
Abstract
A mastering of surface quality issues during machining helps avoiding failure, enhances component integrity and reduces overall costs. Surface roughness significantly affects the quality performance of finished components. A number of parameters, both material and process oriented, influence at a different extend the surface quality of the finished product. Aluminium alloy 5083 component surface quality, achieved in side end milling, constitutes the subject of the present case study. The design of experiment method is employed: that is, 18 carbide two-flute end mill cutters – manufactured by a five-axis grinding machine – have been assigned to mill 18 pockets in finishing conditions – having different combinations of geometry and cutting parameters values, according to the L18 (21× 37) standard orthogonal array. Process performance is estimated using the statistical surface texture parameters Rα, Ry and Rz– measured during three different passes on the side surface of the pockets. The results indicate that process parameters – such as the cutting speed, the peripheral second relief angle and the core diameter – mostly influence surface texture. The experimental values are used to train a feed forward back-propagation artificial neural network for the prediction of the yield surface roughness magnitude.
Introduction
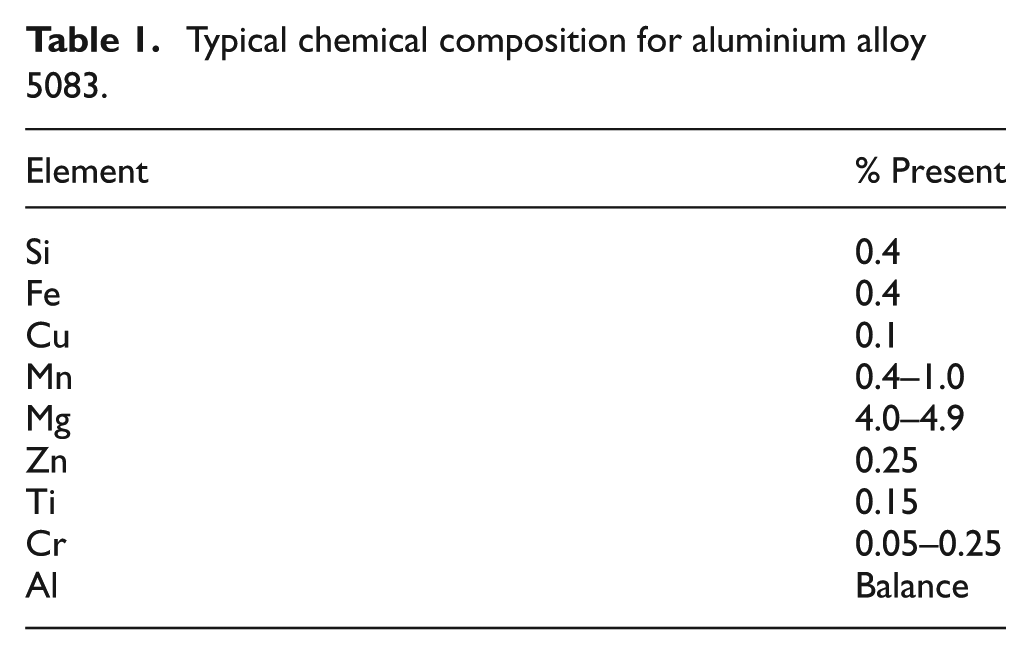
Aluminium 5083 is a magnesium–manganese–chromium–aluminium alloy. Despite the fact of acquiring higher strength – within the series of non-treated alloys – it can be cold hardened, but not heat-treated to higher strengths. It is commonly supplied as a flat rolled plate or sheet. Additional key characteristics are its high resistance to seawater and industrial toxic solvents. Nowadays, aluminium 5083 is widely used in many industrial sectors such as defence industry, shipbuilding, aeronautics, automotive industry and much more. Despite its wide use, no specific machinability data are available for conventional manufacturing processes.
End milling, falling in the category of mechanical material removal processes, form the backbone of industrial manufacturing practice, providing a great deal of flexibility since the shape and the kinematics of the tool and workpiece define the parts’ geometry. 1 Regarding modern machining environments, consideration of the specification of the structure and objective of tool selection as well as of management procedures has become an important issue. Machinability databases are essential in industrial practice due to high-quality product requirements; machining optimisation; tool life/wear considerations and algorithmic tool selection techniques, especially, for turning and milling processes; process planning; tool management and tool/work flow scheduling. 2 The machinability of an engineering material denotes its adaptability to machining processes with regard to factors such as cutting forces, tool wear and surface roughness.
Surface properties dominate the quality of the finished component since they influence features such as dimensional accuracy; tribological issues such as the friction coefficient – rather determined according to the adhesive and ploughing component assumption 3 – and wear; post-processing requirements; appearance and cost. Surface roughness or texture constitutes a measure for achieving finer surface irregularities in the finished product, while three components – that is, roughness, waviness and form – are required for its determination. The influence of the above-mentioned measure is of great significance when dealing either with product quality issues or with machining accuracy evaluation issues.4–7 The capability of a manufacturing operation to produce a specific surface roughness is a multivariable function – that is, it depends on a variety of different factors. For example in end mill cutting, the final surface depends on the rotational speed of the end mill cutter, the velocity of the traverse, the rate of feed, the amount and type of lubrication at the cutting point and last but not least the mechanical properties of both the workpiece being machined and the mill cutter being used. Minor alternations in any of the above factors may have a significant effect on the surface being produced. 8 Consequently, parameter design for a machining process is essential if aiming to have optimised performance and product quality. 9
A number of studies – investigating the relation of cutting forces, tool wear, chip morphology, accuracy issues and dynamic behaviour during end milling with the produced surface quality – are reported in literature. The majority of these studies refer to specific cutting conditions – that is, tool–workpiece material and cutting tool geometry – and can be categorised according to process performance as follows:
Investigation of the machinability behaviour, chip formation, surface residual stresses and surface characterisation for different material compositions – using standard types of tools, generally, those proposed from the manufacturers’ machinability tables;10–12
Evaluation of alternative types of either end mill finishing or milling machines according to surface quality issues; 13
Prediction through simulation of end milling process parameters, utilising analytical or arithmetical methods;14–17
Tool wear issues 18 and their effect on process performance;19,20
Process performance predictions through appropriate modelling – statistical or mathematical; for example, regression analysis of artificial neural networks (ANNs).21,22
The mechanisms leading to the formation of surface roughness are very complex and interacting in nature. A number of researchers have used the response surface method (RSM) to predict the surface roughness of machining operations.23–25 The aforementioned studies aim to process utilisation, cost reduction, time minimisation and quality optimisation. The main consideration of shop-floor engineers and technicians is that the majority of studies are limited and performed in laboratory conditions, thus suffering generalisation due to the complicated cutting mechanism. A general practice – in the case of hard-to-machine materials and special machining conditions – is either to exploit experimental design in order to characterise process performance and to produce new machinability data for future use or search for past experimental data and predictive models (data mining) for the dedicated cutting conditions. A number of schemes, techniques and paradigms have been used for the development of functional decision-making systems that would derive a conclusion on machining process conditions. The cognitive paradigms most frequently employed for the purpose of monitoring in machining are the neural networks (NNs) and fuzzy logic (FL). 26
An artificial NN is a computation model of the human brain that assumes computations distributed over simple interconnected processing elements, called neuron or nodes, operating in parallel. 26 NNs can be employed as mapping devices, pattern classifiers or pattern completers. The subject of NN is widely studied and integrated information could be found in Dreyfus. 27 In literature, numerous studies of NN developed to predict surface roughness in machining operations have been identified. The main advantages include the capability of approximating almost any function without requiring the knowledge of the process and the ability to handle noisy data. Recently, NN models have emerged as a preferred trend and are adopted by most researchers to develop models for near-optimal conditions in machining due to their fault-tolerant, approximated, uncertain and meta-heuristic. Although NNs can achieve a high accuracy in the prediction of surface roughness, their performance is limited by implicit models and unknown inner laws. For the prediction of surface roughness, a feed forward NN has been used for face milling of high chromium steel (AISI H11) in Rai et al. 28 and AISI 420 B stainless steel in Bruni et al., 29 proposing analytical and ANN models. The radial basis feed forward NN model and generalised regression for surface prediction for face milling of Al 7075-T735 have been examined in Munoz-Escalona and Maropoulos. 30 The Pearson’s correlation coefficients have also been calculated to analyse the correlation between the five inputs (cutting speed, feed per tooth, axial depth of cut, chip’s width and chip’s thickness) with surface roughness. Experimental investigation has been conducted in Brecher et al. 31 after end milling of steel C45 aiming in obtaining roughness data and setting up a NN for surface roughness predictions. To achieve the desired surface finish, a good predictive model is required for stable machining. This work investigates a hard-to-machine material, such as aluminium alloy 5083, and produces machinability data for process utilisation. It studies the influence of the cutting parameters of two-flute end cutters on the produced surface and more specifically on the arithmetical mean roughness, Rα; maximum peak, Ry; and 10-point mean roughness, Rz. The proposed approach combines the Taguchi’s design of experiments, together with statistical analysis of the results aiming on tool geometry and process optimisation. Finally, the data produced are used in developing a NN model, while evaluation experiments are performed for confirmation of the model.
Experimental setup
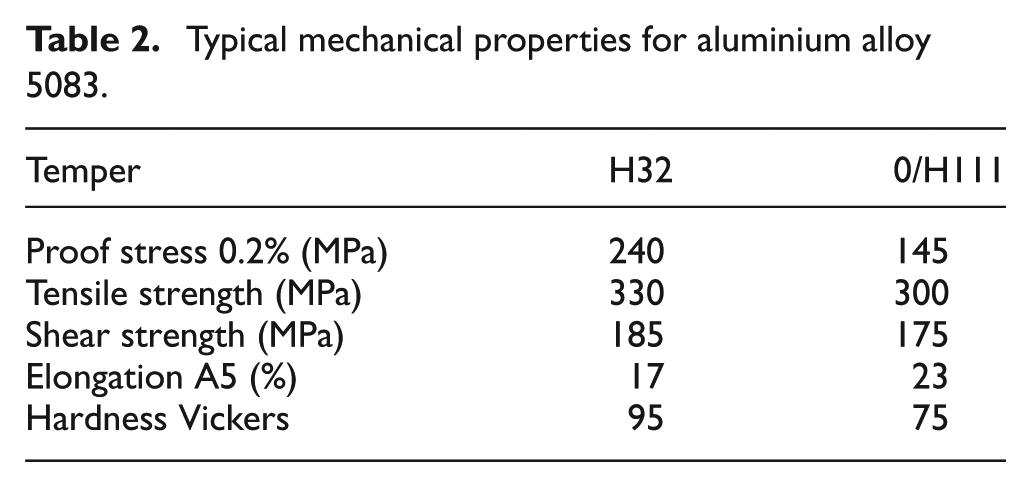
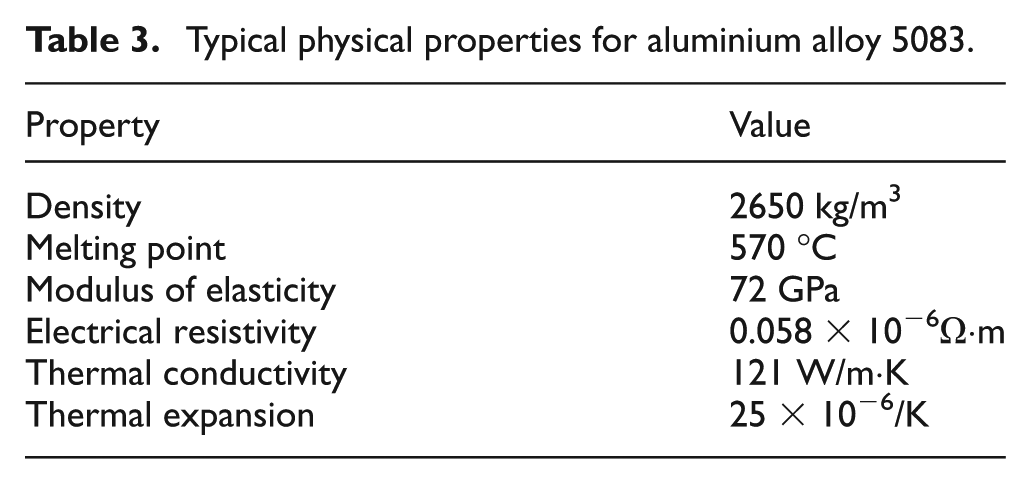
Aluminium alloy 5083 is a non-heat-treatable alloy with exceptional performance in extreme environments, as mentioned above. Its chemical composition, mechanical and physical properties are presented in Tables 1–3. 32 Surface roughness is a widely used index characterising a product’s quality and is measured off-line – when the component is already machined. The surface texture parameters measured during this study are as follows: the arithmetical mean roughness, Rα; maximum peak, Ry; and 10-point mean roughness, Rz; all measured in micrometres.
Typical chemical composition for aluminium alloy 5083.
Typical mechanical properties for aluminium alloy 5083.
Typical physical properties for aluminium alloy 5083.
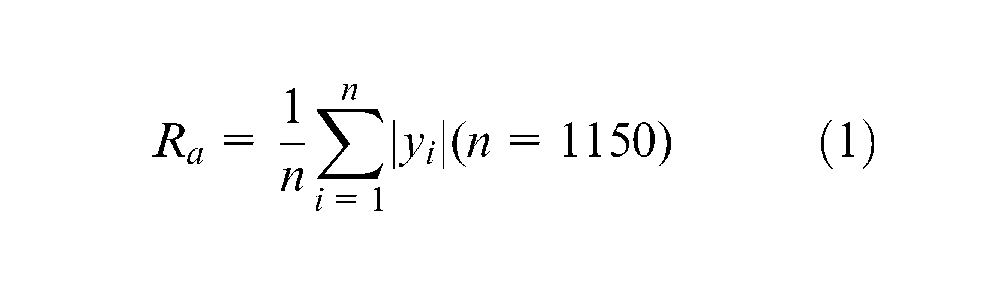
The former (see Figure 1(a)) can be obtained by taking the arithmetic mean of the absolute values of 1150 different positional deviations over a 4-mm standard length with a cut-off at 0.8 mm according to the relation
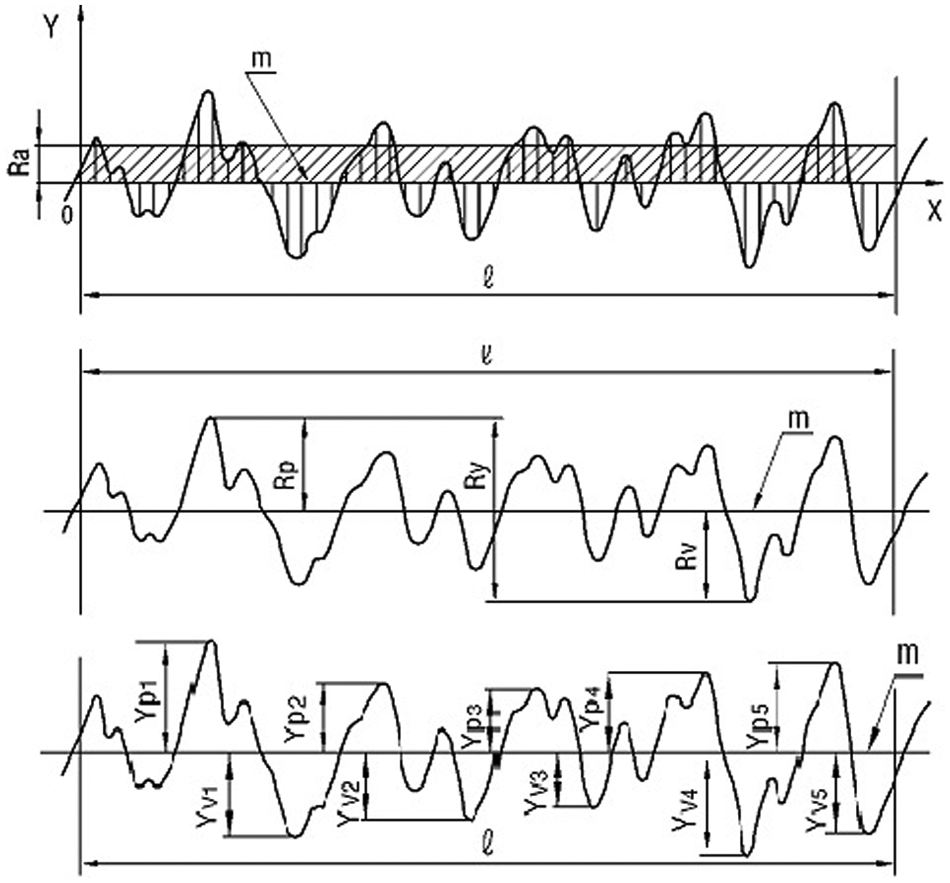
Surface texture parameters.
The second, that is, the maximum peak to valley distance of the filtered profile over an evaluation length – sensitive to large deviations from the mean line and scratches – is defined according to the relation

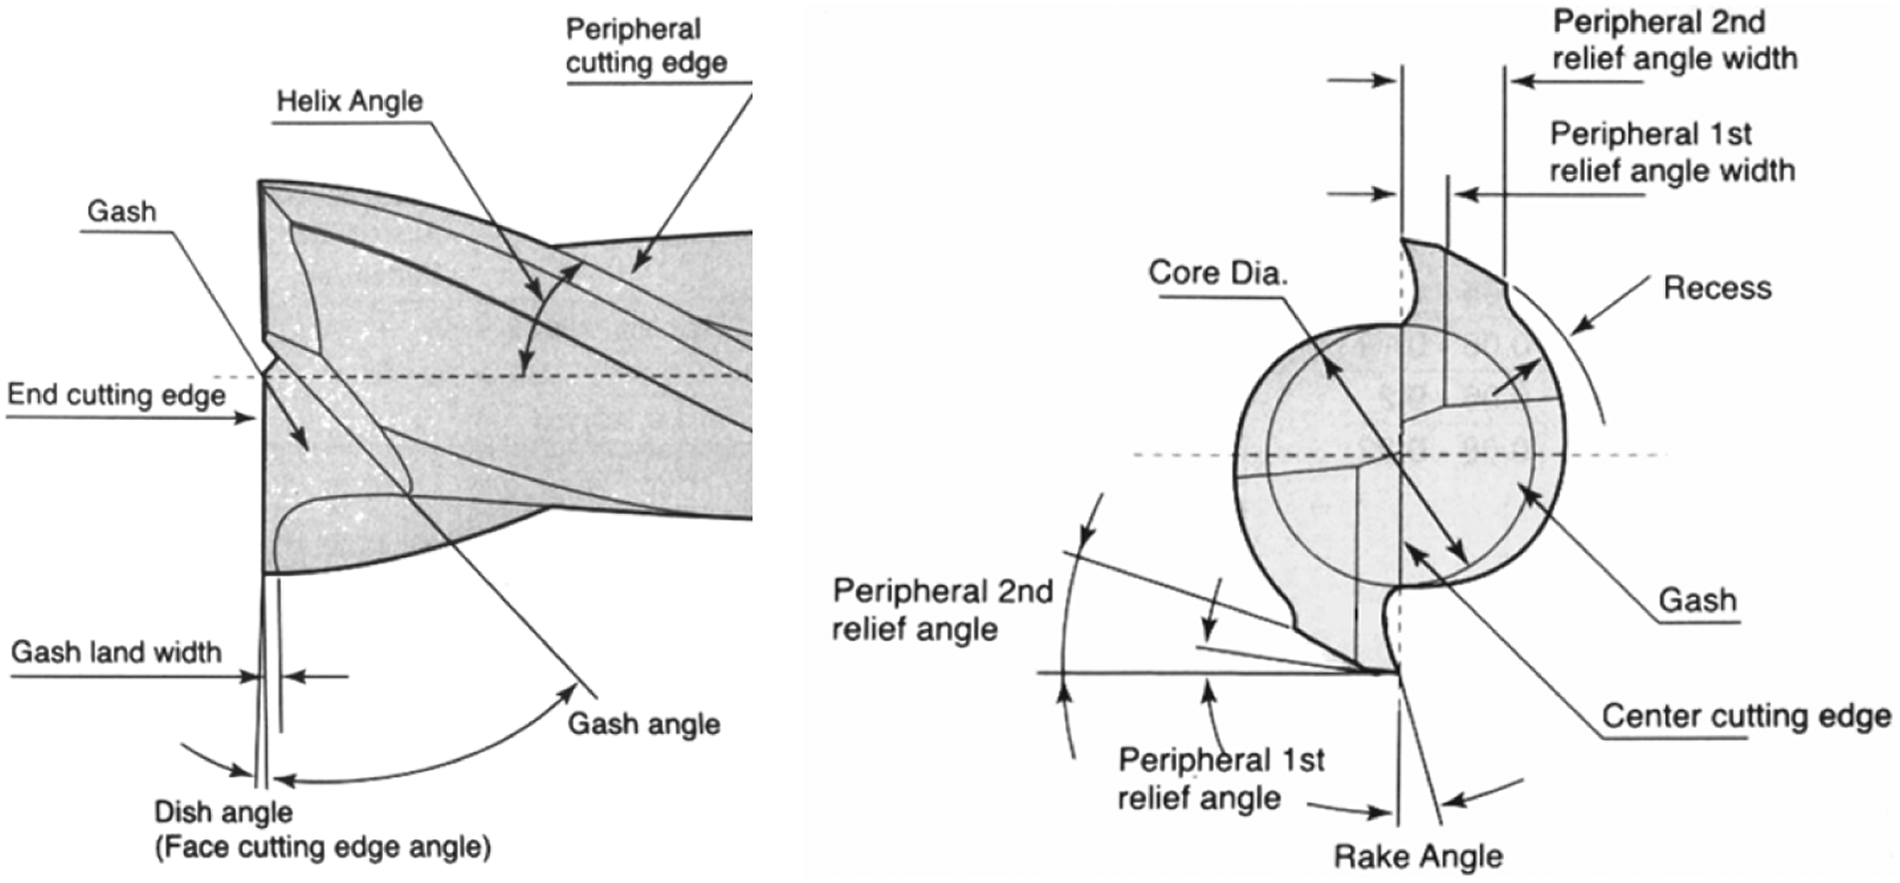
where Rp and Rv are the absolute values of the maximum peak and maximum valley within the measured standard length (Figure 1(b)), and finally, the latter, that is, the 10-point mean roughness, is defined according to the relation
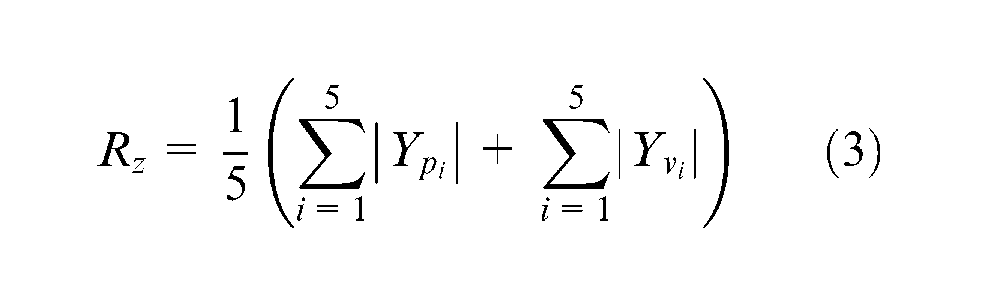
where Ypi are the five tallest peaks and Yvi the five lowest valleys within the sample considered (Figure 1(c)). The two-flute end cutter geometry parameters taken into account are the core diameter (%), the flute angle (°), the rake angle (°), the peripheral first relief angle (°) and the peripheral second relief angle (°) – all shown in Figure 2.
Two-flute end mill cutter geometry (centre cutting type).
The above-mentioned parameters were combined with the depth of cut (mm), the cutting speed (r/min) and the tool feed (mm/flute) using the standard L18 (21× 37) orthogonal array in order to perform the matrix experiment described in the following section and the results were analysed using statistical techniques. The overall experimental flowchart is shown in Figure 3.
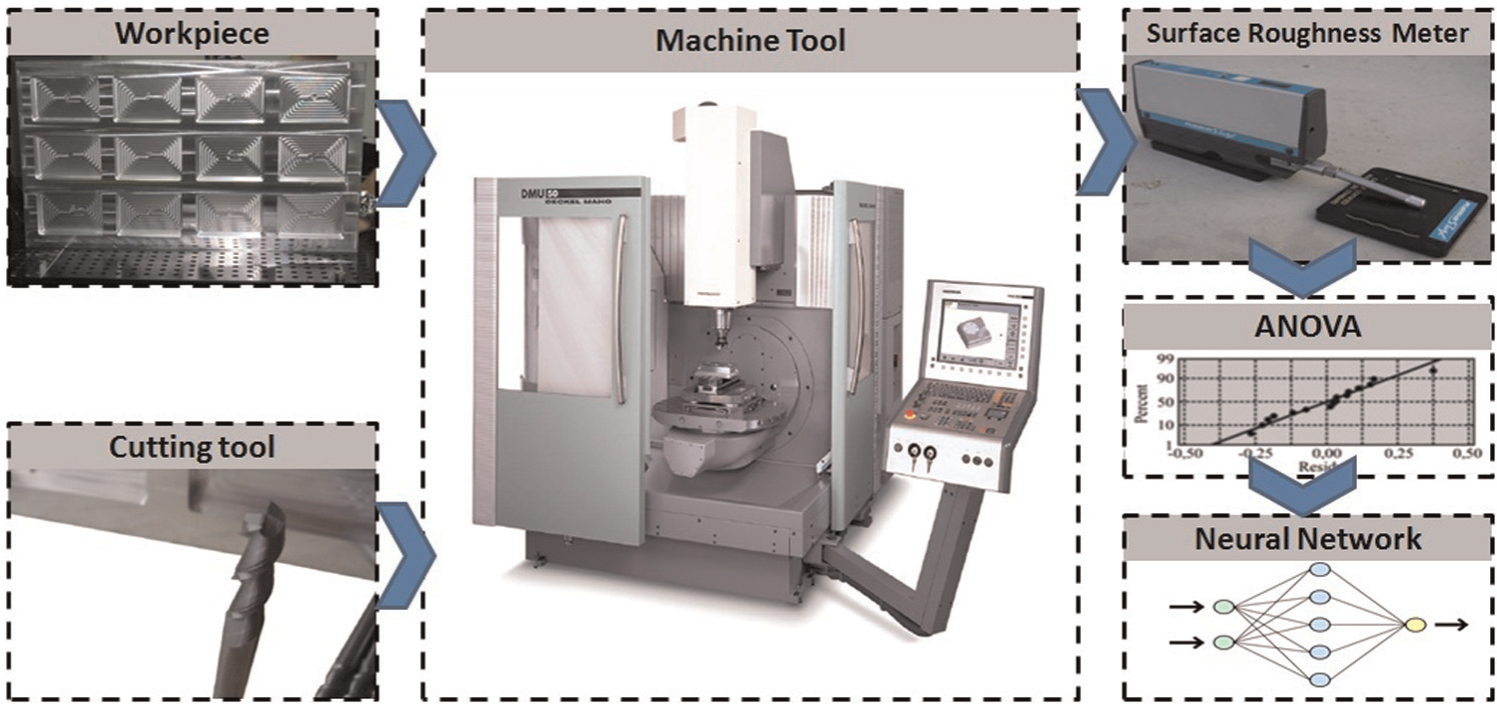
Experimental process flowchart.
The two-flute carbide end mill cutters, 8 mm in diameter, have been manufactured using the five-axis Hawemat 2001 grinding machine (Figure 4). The NAMROTO CAM program was used to simulate the grinding process in order to avoid collision among machine components.
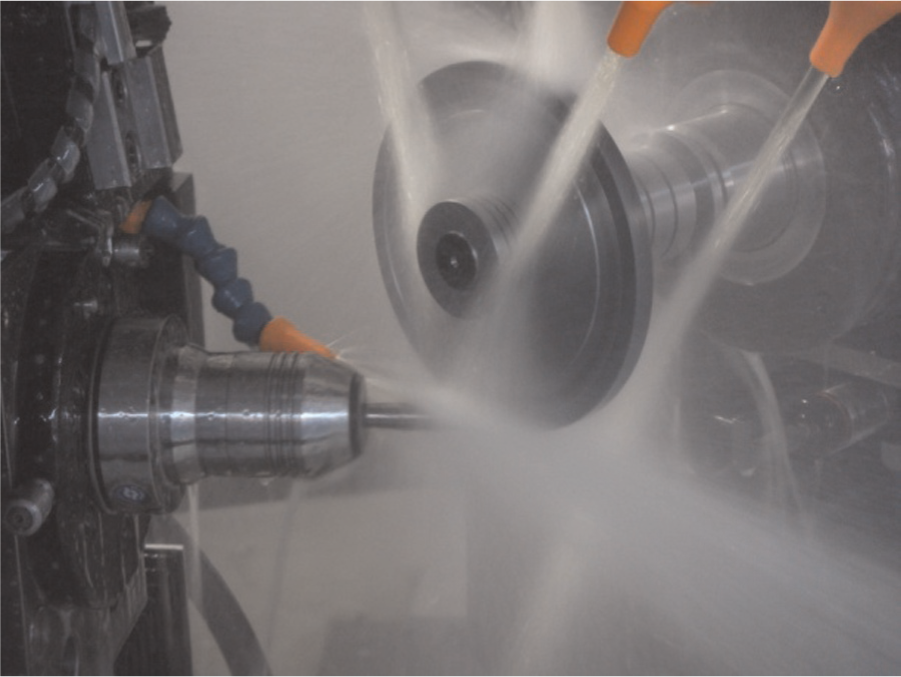
Grinding process for two-flute carbide end mill cutter manufacture.
End milling pockets have been manufactured on a DECKEL MAHO DMU 50V-monoBLOCK 5-axis universal high-speed machining centre. The maximum power of the machine tool and the maximum spindle speed were 18.9 kW and 14,000 r/min, respectively. Each of the 18 end mill cutters cuts a pocket of 100 × 64 mm and 15 mm in depth on the two faces of an aluminium 5083 plate of 500 × 280 mm and 60 mm in depth. The two faces were finished with a face mill cutter, 50 mm in diameter, and two recesses were constructed in order to hold the aluminium plate onto the machine centre chuck. Surface roughness measurements were taken using a RUGOsurf tester. Three measurements parallel to the red arrows, as shown in Figure 5, were taken for each surface roughness parameter (
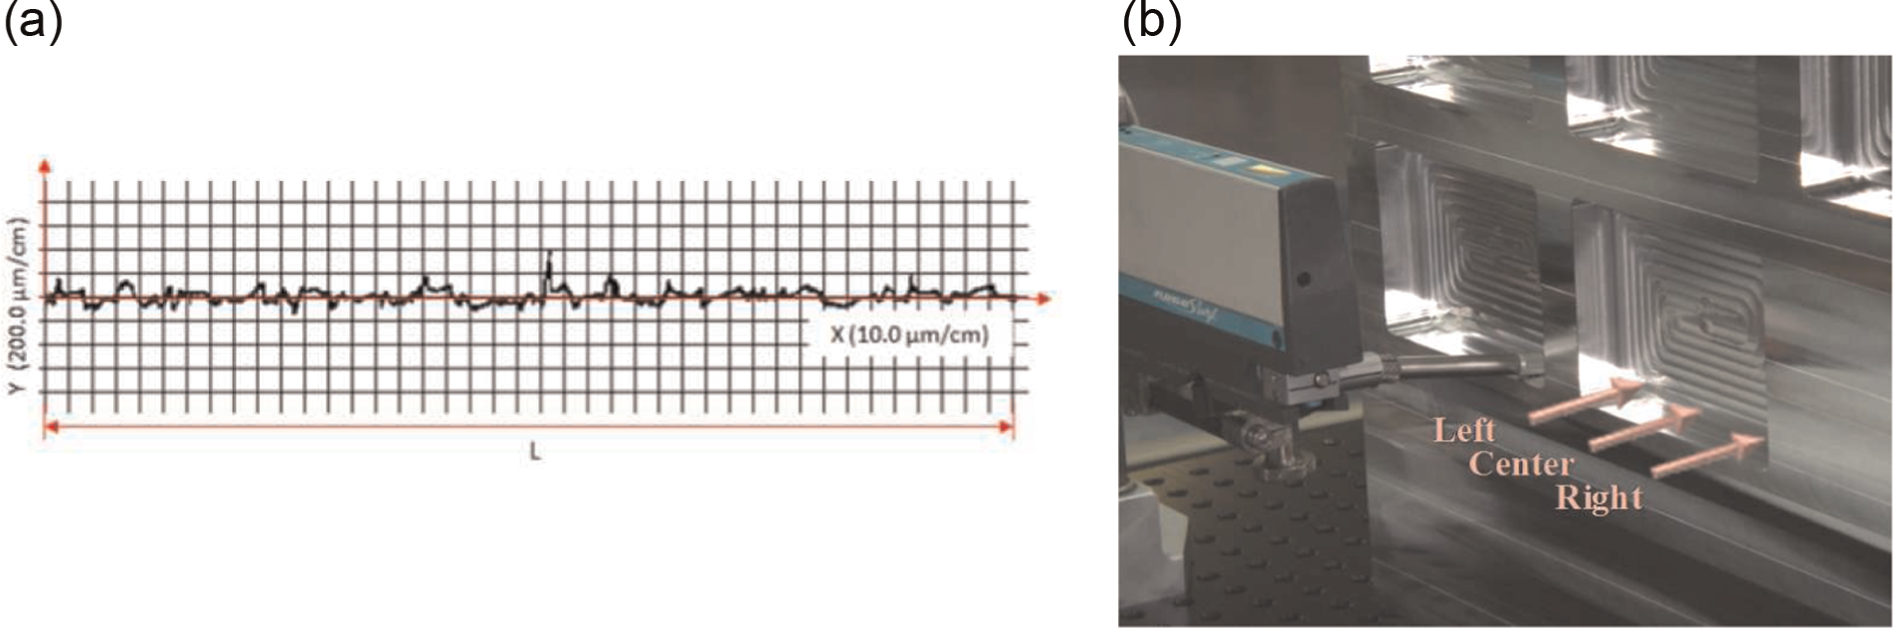
Profile of (a) surface texture and (b) surface roughness measurements.
Design of experiments
The Taguchi design method is a simple and robust technique for process parameter optimisation. The method involves the damping (reduction) of variation in a manufacturing process through robust design of experiments. The main parameters, which are assumed to have an influence on the process outcome, are located in different rows in a designed orthogonal array – so-called orthogonal matrix experiment. With such an arrangement, randomised experiments can be conducted.
Taguchi’s emphasis on minimising deviation from target led him to develop measures of the process output that incorporate both the location of the output as well as its variation. These measures are called signal-to-noise ratios. The signal-to-noise ratio provides a measure of the impact of noise factors on performance. Calculation of the S/N ratio depends on the experimental objective according to which the experiment is conducted – that is, bigger-the-better, smaller-the-better and nominal-is-best with corresponding calculation formulae.
33
The S/N ratio can be made to represent the quality characteristic of the data observed in Taguchi’s design of experiments. In the case of surface quality indicators (
where
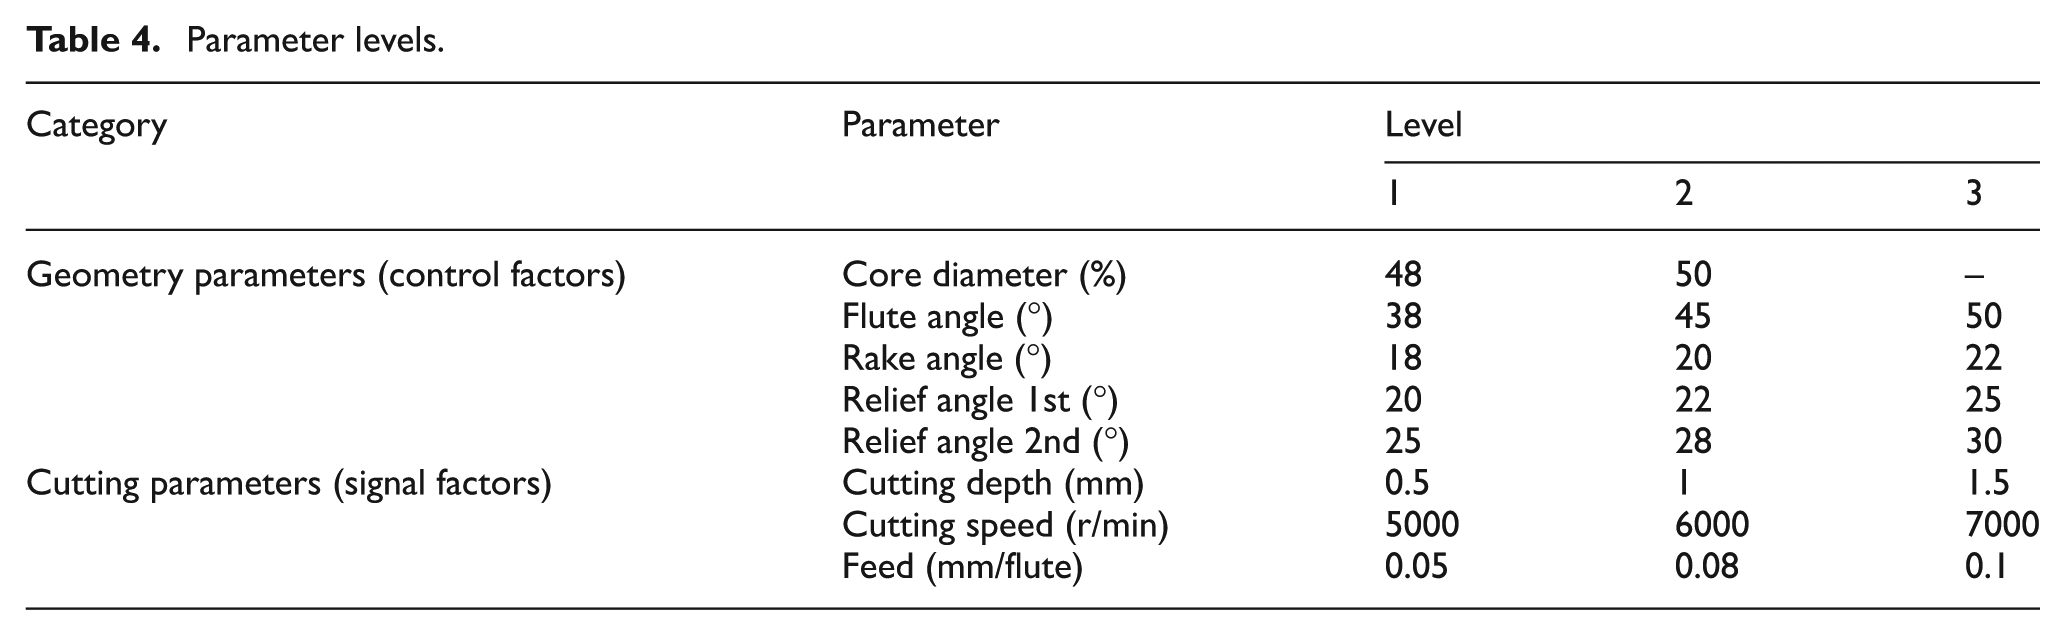
The parameters to be tested have been organised into two categories. Geometry parameters, that is, control factors that are controlled before machining – such as core diameter (%), flute angle (°), rake angle (°), first relief angle (°) and second relief angle (°). Cutting parameters– that is, signal factors that are controlled during the process – such as cutting depth (mm), cutting speed (r/min) and feed (mm/flute). It has to be mentioned, however, that the definition of the cutting speed involves tribological issues such as the friction coefficient and wear, which govern the outcome of the milling process;
19
these have not been included in Taguchi’s design of experiments since material interaction parameters have not been taken into account as stand-alone parameters. The assumption made here is that the determination of an optimum value for the cutting speed could indirectly account for tool–workpiece material issues. It is well known that material parameters belong to the higher order interactions – in the case of experiments of the form
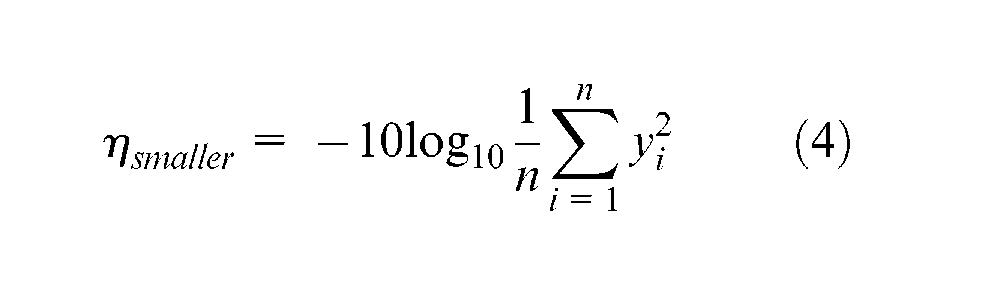
Use of equation (4) yields the parameters influencing the process outcome as well as the optimal sets of values to deal with. The optimum level of a parameter is understood as the one yielding a minimal value for surface roughness in the experimental results.
The main procedure in robust design is the design of the parameters that includes the following:
Parameter levels identification;
Selection of orthogonal array and experimental work;
Analysis of means (ANOM) for process optimisation.
The first step of the parameter design is to choose the appropriate orthogonal array that affects the experimental plan and accuracy of the statistical analysis. As per standard design of experiment theory9,33 for a number of eight parameters with three levels of detail approach, the standard L18 orthogonal array is posed. In this method, the main parameters, which are assumed to have an influence on process results, are located at different rows in a designed orthogonal array, and the results can be analysed using ANOM and analysis of variance (ANOVA) in a similar way as a full factorial design was conducted. The parameters values (levels) are summarised in Table 4, while Table 5 shows the parameter design according to the standard
Parameter levels.
Parameter design according to L18 (21× 37) orthogonal array and performance measures.
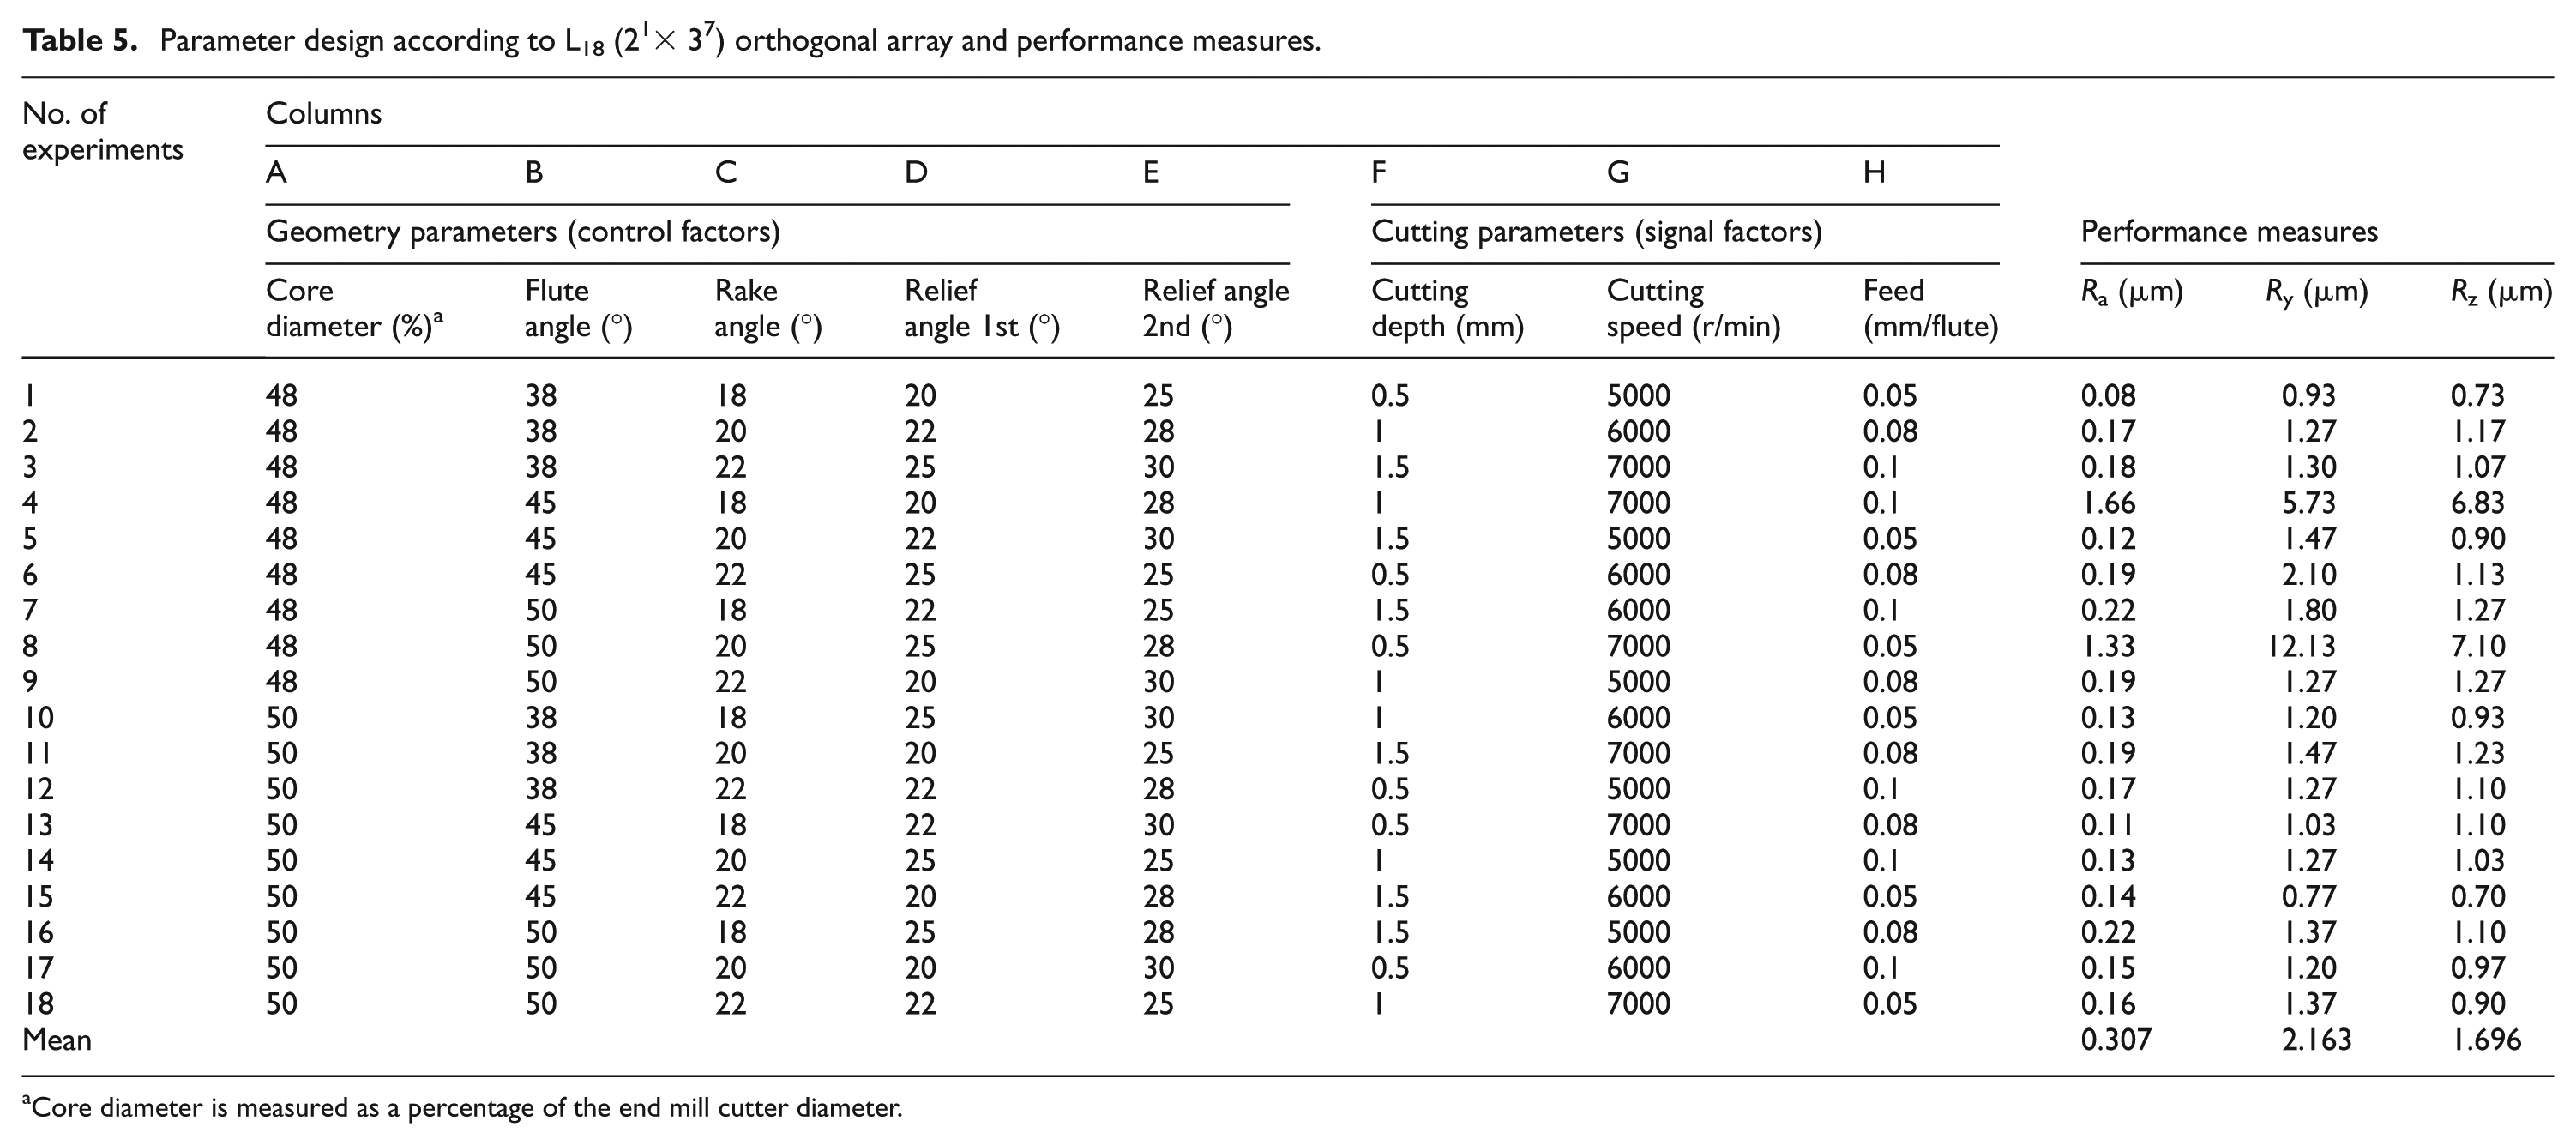
Core diameter is measured as a percentage of the end mill cutter diameter.
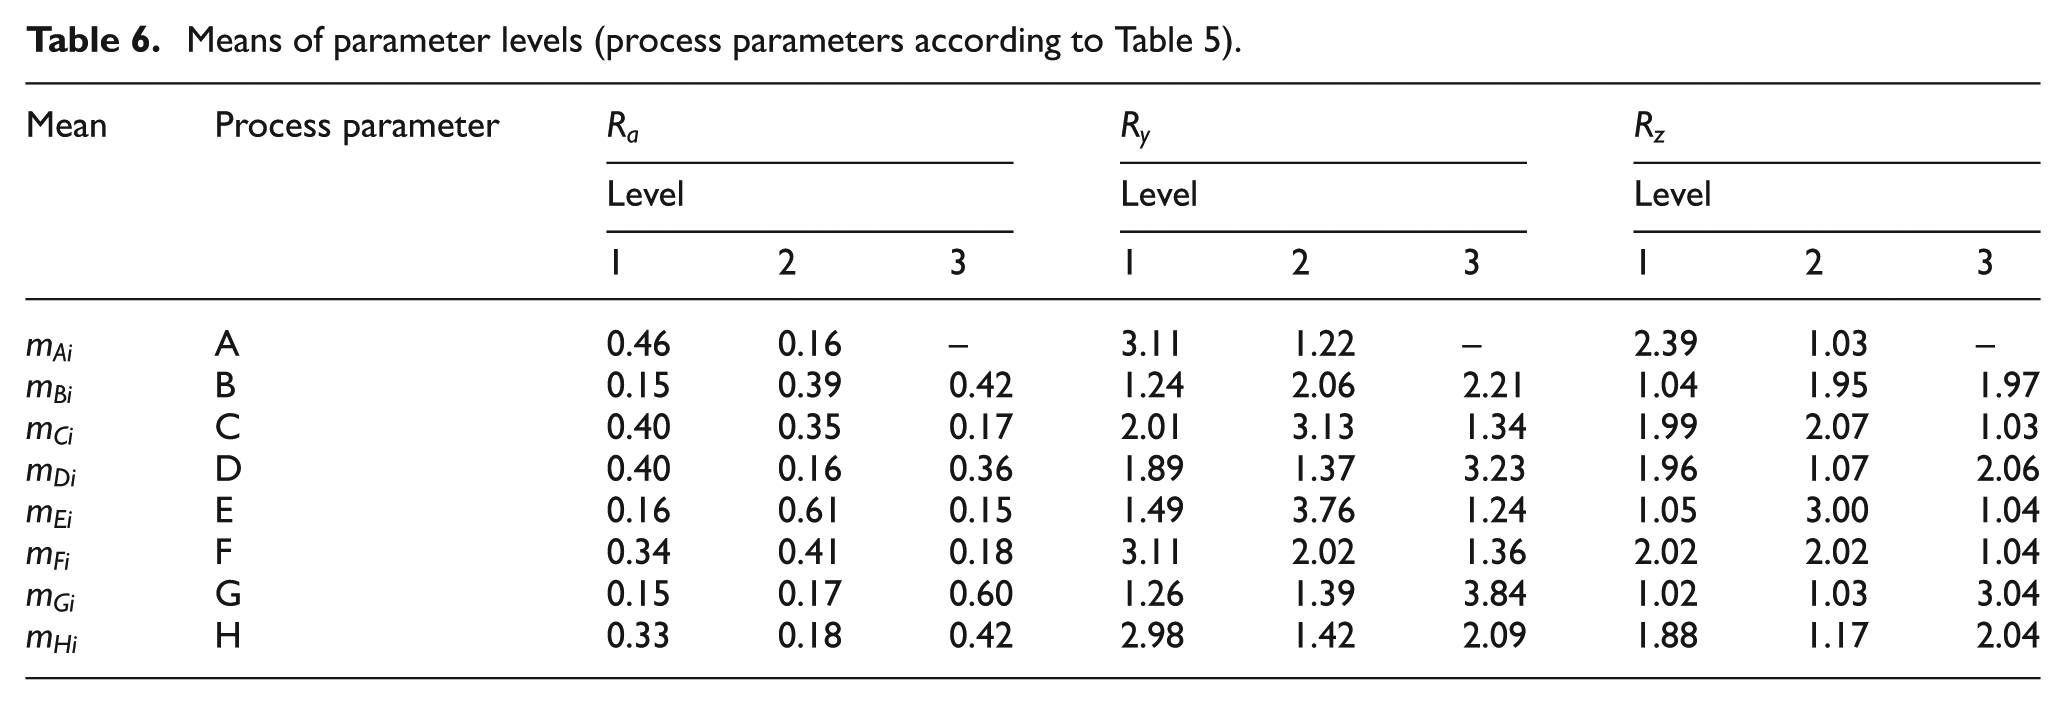
The geometry parameter values for each of the 18 two-flute end mill cutters are shown in columns A–E in Table 5, while the corresponding cutting parameters values in columns F–H. For each of the aforementioned process parameters the average surface roughness (
Means of parameter levels (process parameters according to Table 5).
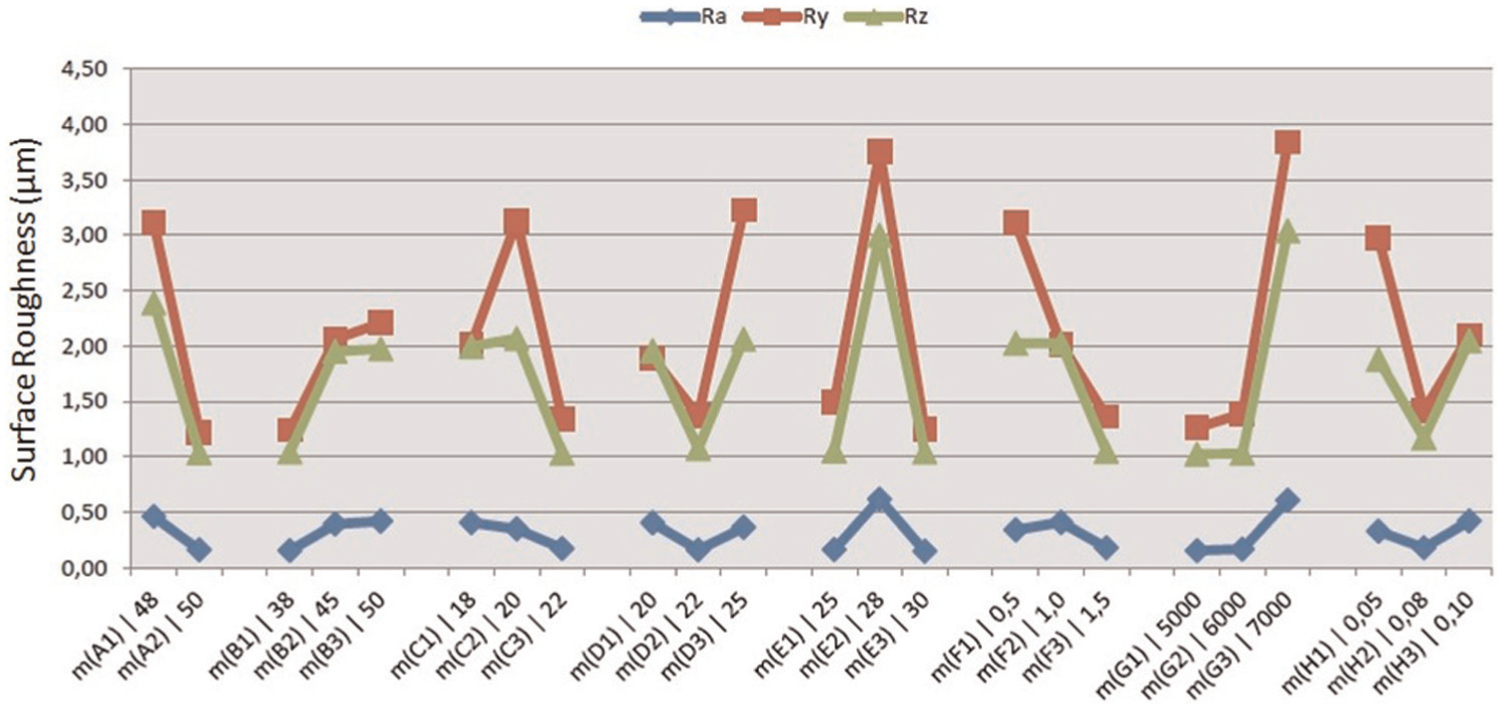
ANOM diagram for
The impact of each factor level on the side surface roughness is produced. Thus, based on the ANOM, one can derive the optimum combination of process variables, with respect to surface roughness. The optimum level for a factor is the level that gives the higher value of the objective function ηRi inside the experimental region. Furthermore, an ANOVA was performed (Table 7), where the impact of each process parameter on surface quality indicators (
Analysis of variance.
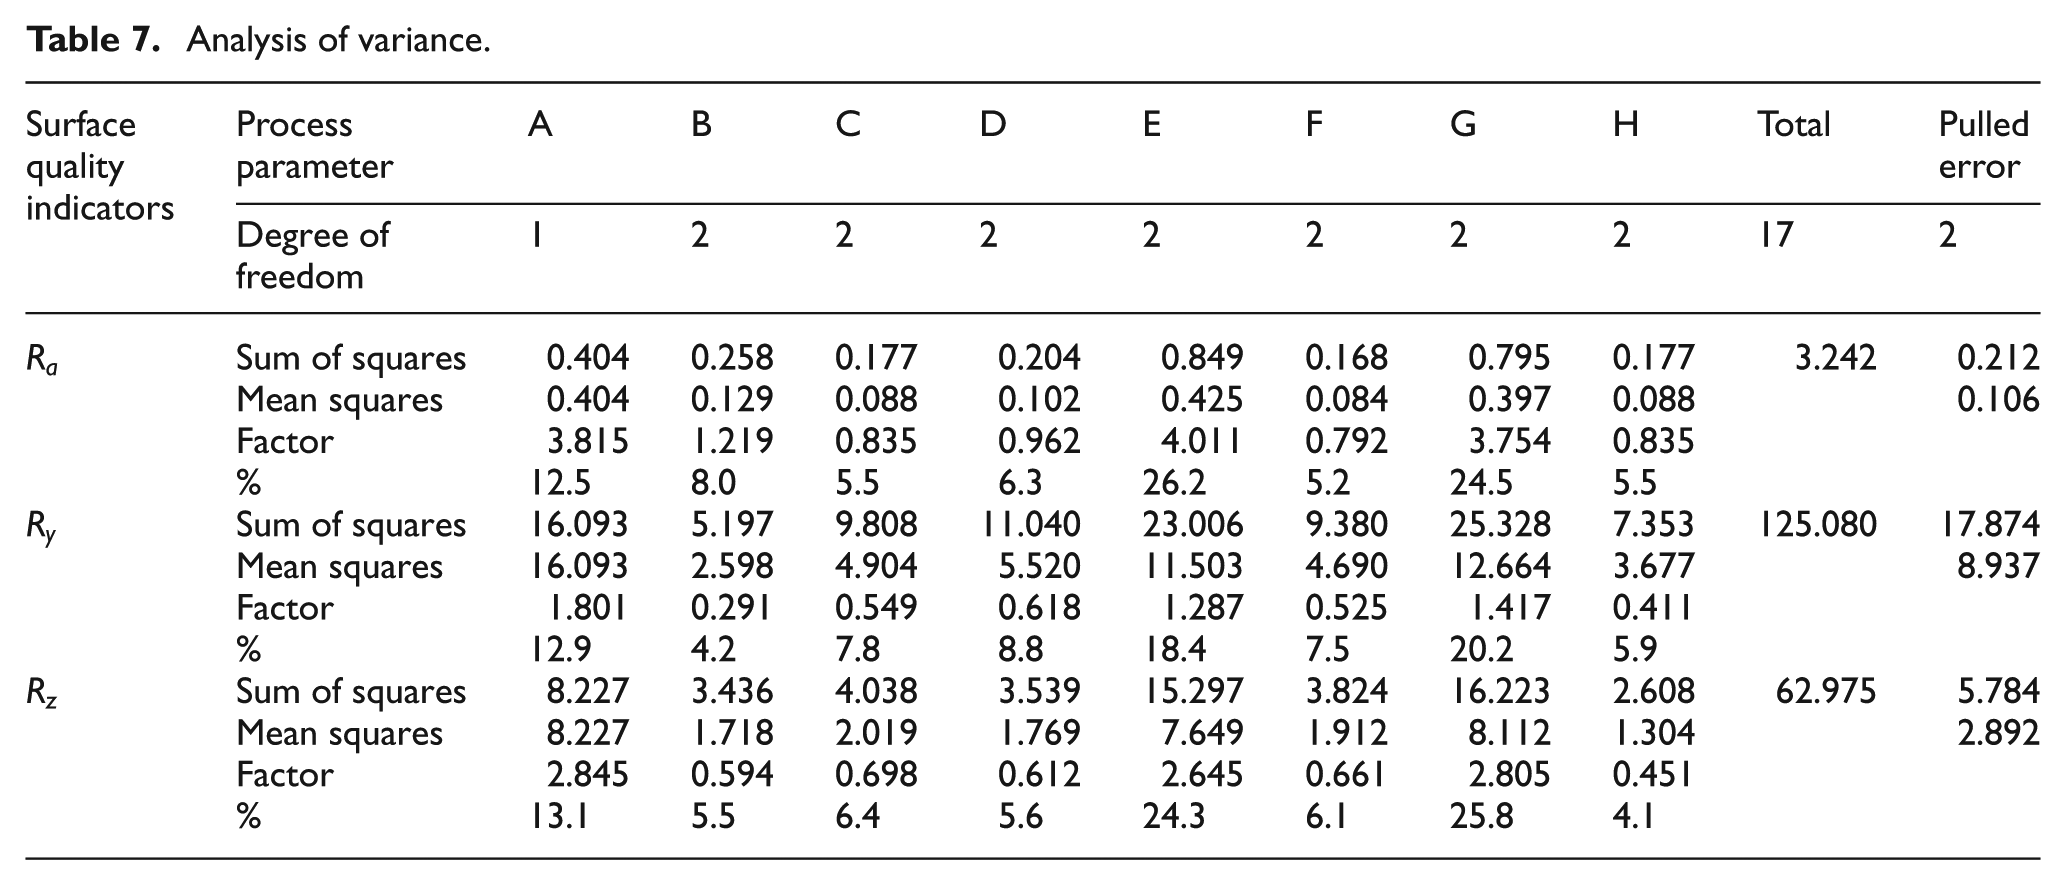
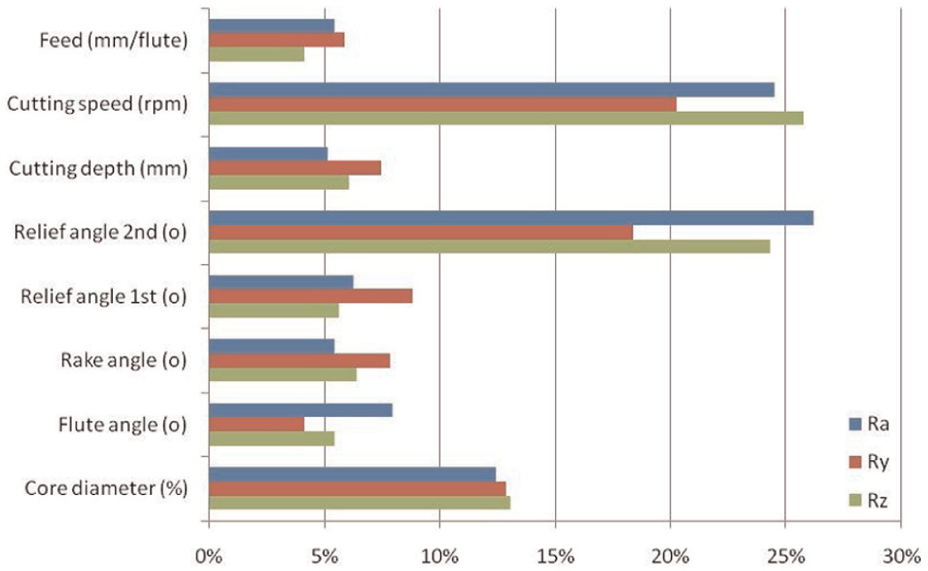
Impact of process parameters on the surface quality indicators.
Discussion of the results
The results of the statistical analysis are shown in Figure 7. The cutting speed, the peripheral second relief angle as well as the core diameter are the three major significant parameters that affect the surface quality indicators (
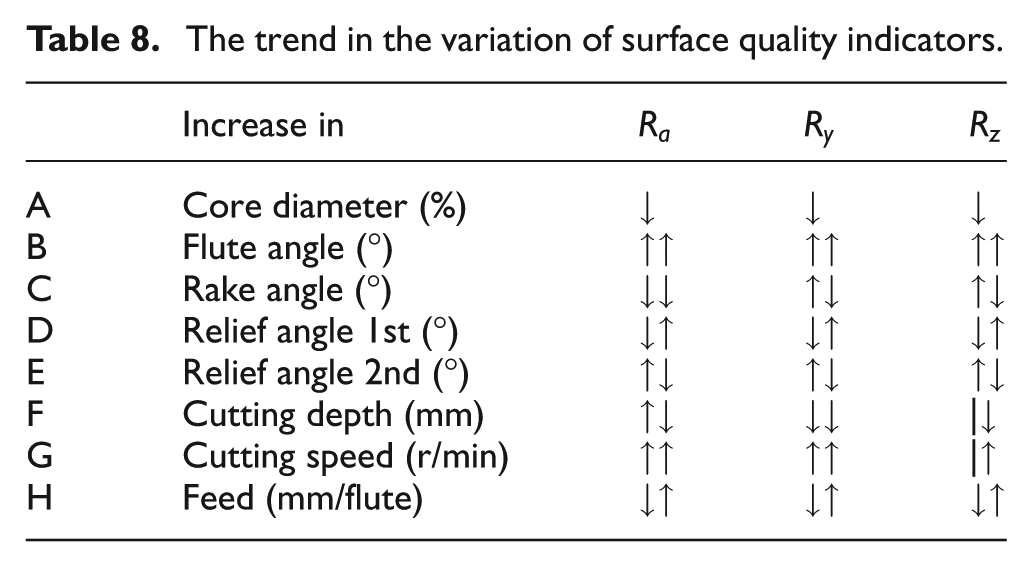
The trend in the variation of surface quality indicators (
The trend in the variation of surface quality indicators.
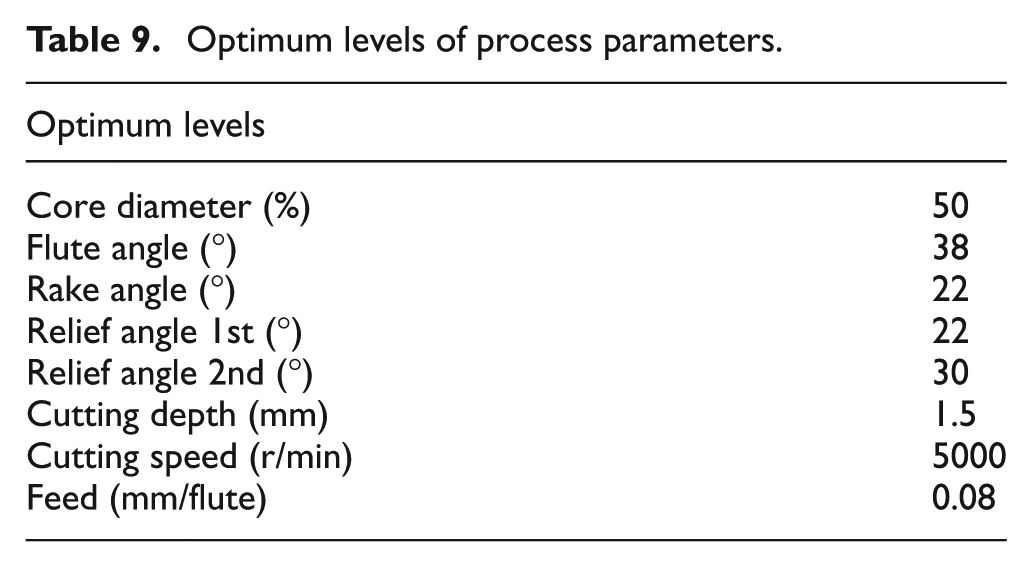
Optimum levels of process parameters.
As per Taguchi’s design, the interaction between two or more parameters can be classified as no interaction, synergistic interaction and anti-synergistic interaction. The parameters tested have been organised into two categories. Geometry parameters– that is, control factors that are controlled before machining – such as core diameter (%), flute angle (°), rake angle (°), first relief angle (°) and second relief angle (°). Cutting parameters– that is, signal factors that are controlled during the process – such as cutting depth (mm), cutting speed (r/min) and feed (mm/flute). Figure 8(a) indicates the type of interaction between the cutting speed and the second peripheral relief angle. It is observed that when the second peripheral relief angle is increased from 25° to 28° or 30°, the corresponding change in
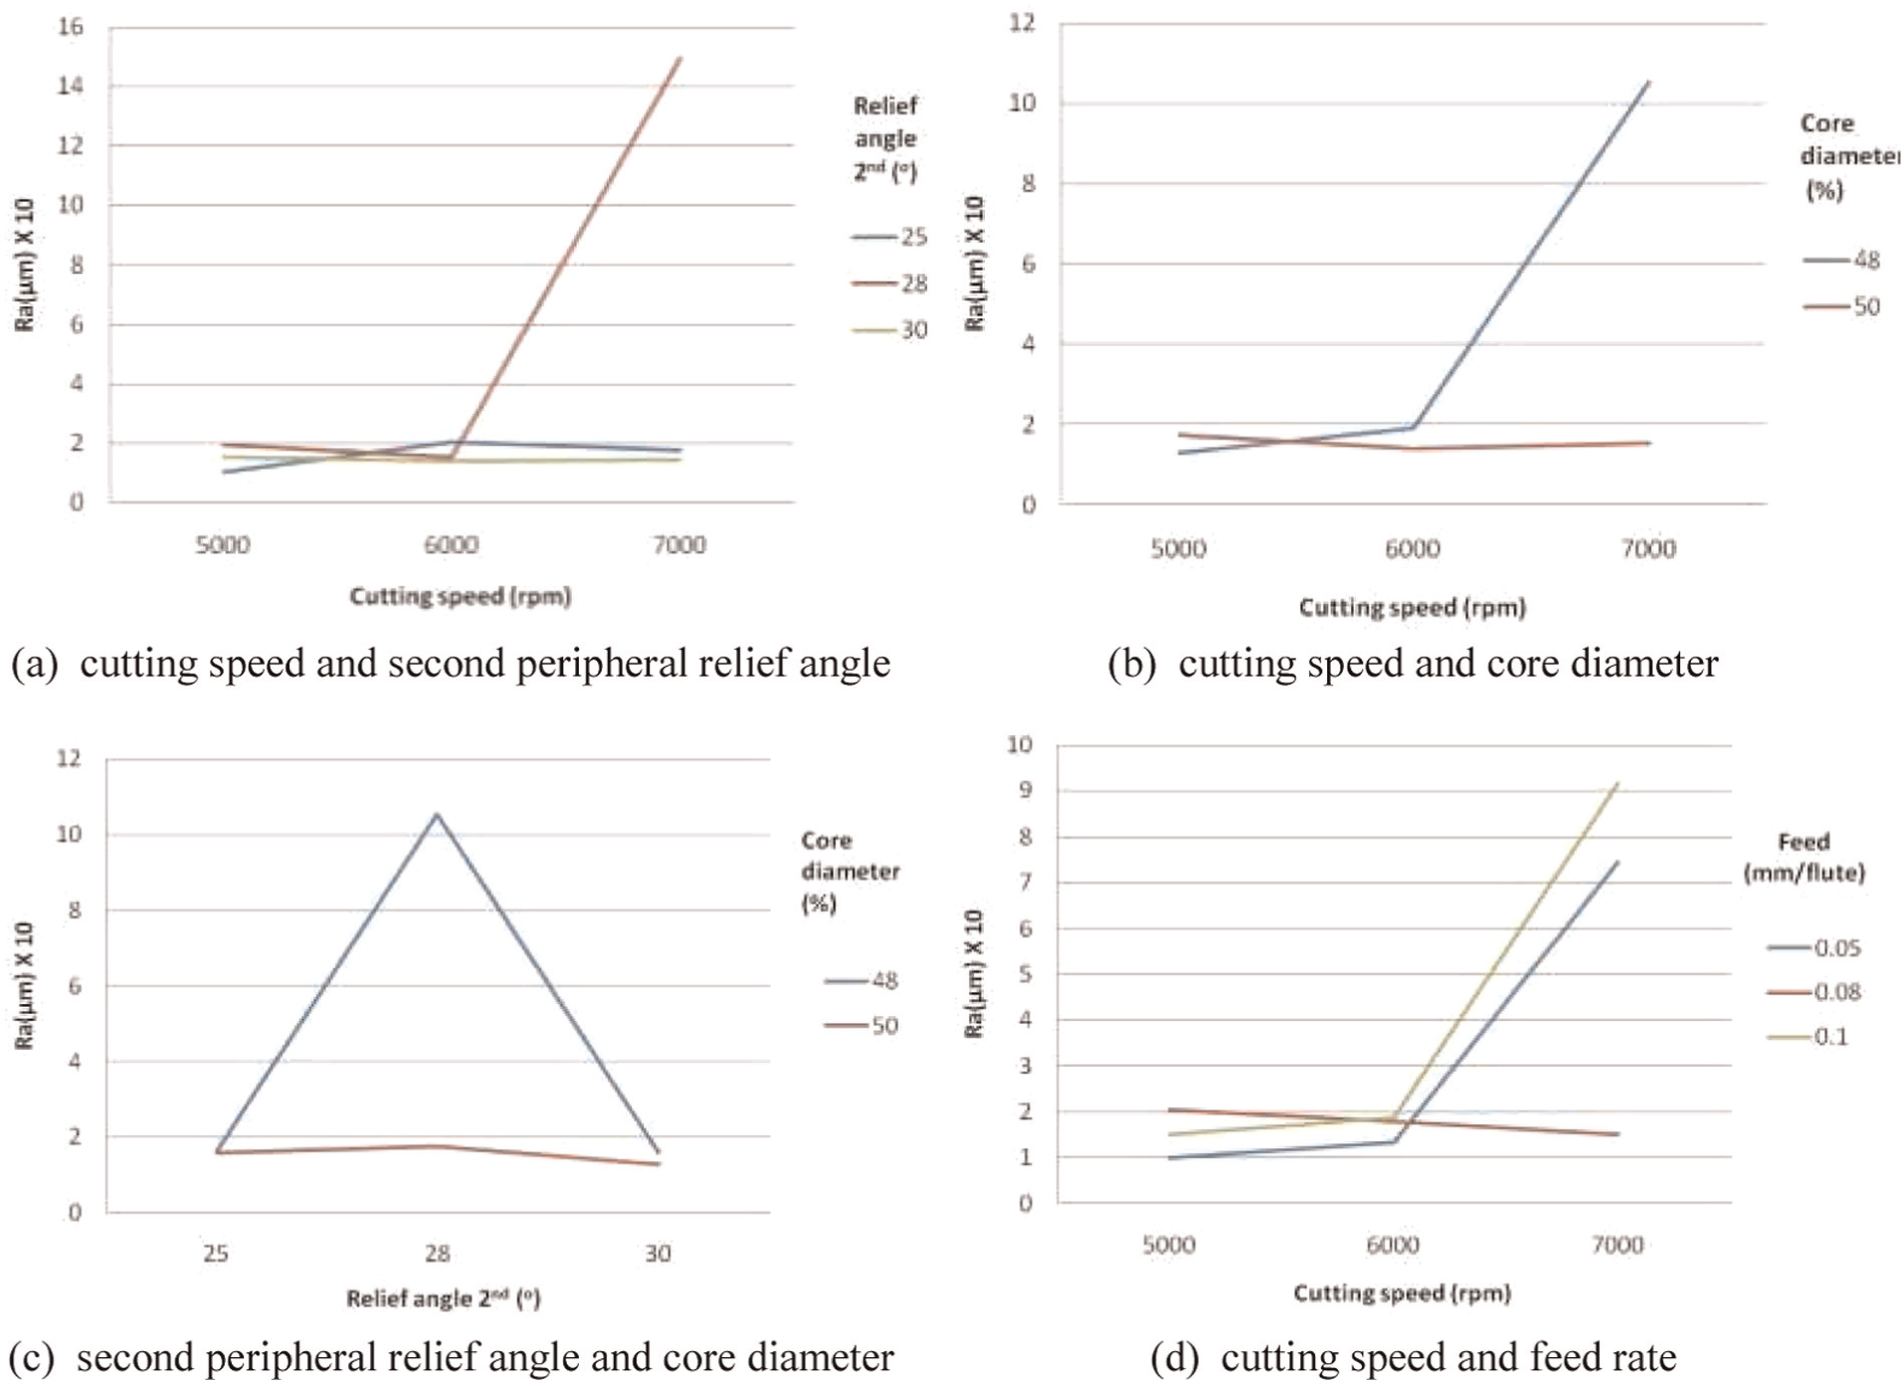
Interaction charts between parameter pairs: (a) cutting speed and second peripheral relief angle, (b) cutting speed and core diameter, (c) second peripheral relief angle and core diameter and (d) cutting speed and feed rate.
In accordance with the cutting theory,8,30 once the relief angle second takes its optimum value (30°), the surface roughness decreases while the cutting speed increases. Additionally the core diameter takes its optimum value (50%).
Predictive modelling
Aiming in the prediction of the produced surface roughness parameters (
Geometry parameters, that is, control factors that are controlled before machining –diameter (%), flute angle (°), rake angle (°), first relief angle (°) and second relief angle (°).
Cutting parameters– that is, signal factors that are controlled during the process –cutting depth (mm), cutting speed (r/min) and feed (mm/flute).
The 18 experimental data samples (Table 5) have been separated into three groups: namely, the training, the validation and the testing samples. Previous studies 35 indicate that by using Taguchi’s design of experiment (DoE) methods, a structured method of NN parameter setting can be implemented, which identifies NN and training parameter settings resulting in enhanced NN performance. Training samples are presented to the NN during training, and the network is adjusted according to its error. Validation samples are used to measure network generalisation and to halt training when generalisation stops improving. Testing samples have no effect on training, and so they provide an independent measure of network performance during and after training (validation runs).
From the 18 experimental data samples, 9 – that is, 50% of the sample population – have been used for training; 4 – that is, 20% – for validation and 5 – that is, 30% – for testing purposes. The training samples have been selected following the
There are many possible types of architecture for ANNs. In this work, the feed forward with back-propagation learning (FFBP) architecture has been selected. These types of networks have an input layer of X inputs, one or more hidden layers with several neurons and an output layer of Y outputs. In the selected ANN, the transfer function of the hidden layer is hyperbolic tangent sigmoid, while for the output layer a linear transfer function is used. The input vector consists of the eight process parameters as given in Table 5. The output layer consists of the performance measures, namely,
Back-propagation NNs are prone to the overtraining problem that could limit their generalisation capability. 36 Overtraining, usually, occurs in ANNs with many degrees of freedom 37 after a number of learning loops – in which the performance of the training data set increases, while that of the validation data set decreases.
The performance of the network is usually measured by the mean squared error (MSE) of the estimated output with regard to the values of the experimental data. The best validation performance has been found equal to 0.0069 when the training of the ANN stopped, suggesting a sufficient network efficiency. Another performance measure for network efficiency is the resulting coefficient of determination (
The trained FFBP-NN model can be used for the optimisation of the yield surface roughness magnitude during computer numerical controlled (CNC) end milling. This can be achieved through testing the behaviour of the response variables (
Figure 9 presents an example of a surface response diagram for the roughness indicator
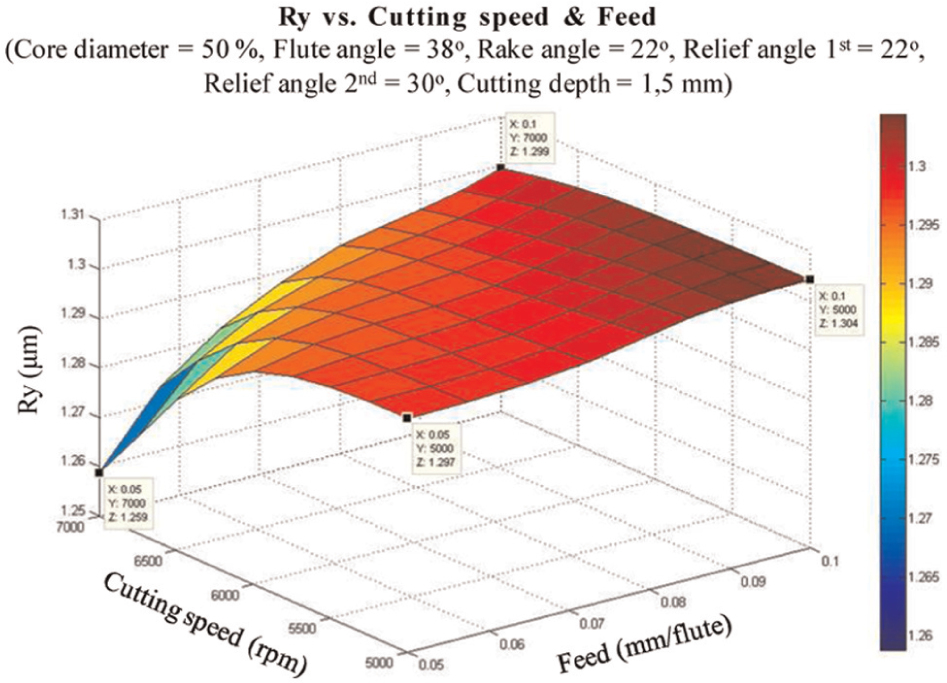
Response surface diagram of
Conclusion
The arithmetical mean roughness (Ra), maximum peak (Ry) and 10-point mean roughness (Rz) have been selected as quality indicators for end milling of aluminium alloy 5083 multiparameter investigation, using design of experiments and statistical analysis. The experimental limits were designed in order for all the combinations suggested in the orthogonal array to be conducted. Orthogonality – that is, the ability of conducting the totality of the combinations suggested in the orthogonal array L18– is ensured by setting variation limits for the parameters involved. Findings indicate that the cutting speed (r/min), the peripheral relief angle second (°) and the core diameters (%) are the most important parameters that affect the surface texture indicators, having F factors close to or higher than 2. All the rest process parameters used in this study had a negligible effect (i.e. F < 0.6) on the surface texture parameters.
A FFBP-NN model has been created for estimating the yield surface roughness magnitude. The performance of the network has been proven acceptable, providing a correlation between the output values, estimated by the model, and the targets, that is, the data samples produced by the matrix experiments, in all three learning phases – that is, during training (R = 1), validation (R = 0.89) and testing procedure (R = 0.93). Furthermore, the response surface diagram indicates that when the geometry parameters take their optimum values, the increase in cutting speed, as well as the decrease in feed rate, results in deduction of the surface roughness, in accordance with the machining theory.
Future work is planned including multi-parameter investigation of the process according to other quality indicators such as tool wear, cutting forces, dimensional accuracy, surface residual stresses and machined surface hardness. Finally, enhancement of the proposed FFBP-NN model in terms of the impact of the cutting speed on the process as well as by increasing the number of experiments used for training is to be studied.
Footnotes
Declaration of conflicting interests
The authors declare that there is no conflict of interest.
Funding
This research is implemented through the Operational Program ‘Education and Lifelong Learning’ and is co-financed by the European Union (European Social Fund) and Greek national funds.