
Abstract
A microstructural and mechanical investigation on lap joints welded by friction stir welding and made out of a 7075-T6 stringer and a 2024-T4 skin is presented. In particular, the metallurgical and mechanical properties of joints have been studied at different tool feed rates (V = 35, 50, 100 mm/min) and constant rotation speed (R = 500 r/min). Temperature distributions have been monitored during the process. It is found that in the welded area, the recrystallized zone (nugget) has an average grain size of about 3 µm and exhibits coarsened MgZn2 particles on grain boundaries. The maximum values of microhardness in the welded skin increase with the process temperature, while they just slightly vary with process temperature in the stringer. From the mechanical point of view, the joint welded at R = 500 r/min and V = 50 mm/min exhibits both the highest strength and average microhardness value in the welded area.
Introduction
Welding is a very common process for aeronautical and aerospace applications. One of the most common applications of this technology is the joining of specific stiffeners, called stringers, to large sheets used for the body structures, called skins. 1 Stringers can have different shapes, among which the two most common are “Z” and “L.” When the former is utilized, a lap joint is needed; on the contrary, “L”-shaped and straight stringers are welded to the skins for obtaining T joints. 2 In the literature, a few researches which focused on both the joints’ integrity, based on the static and dynamic mechanical properties,3,4 and the distortions in the welded joints due to the residual stresses can be found. 5 The main cause of joint failure resulted to be the presence of a large heat-affected zone (HAZ) characterized by grain coarsening and welding defects such as inclusions and porosities. 6 Finally, numerical models have been used in order to correctly design T joints. 7
In order to overcome the typical defects of fusion welding processes, friction stir welding (FSW) seems particularly attractive especially for complex geometries.8,9 As a solid-state process, FSW permits to obtain defect-free and high-resistance joints even with materials traditionally considered not “weldable.” In spite of the quite large number of publications on FSW during the last few years, it is worth to note that they are mainly focused on butt joints and the knowledge acquired cannot directly be transferred to T joints, for which several peculiarities must be considered:10,11 first of all, the clamping fixture must be specific for the developed joint geometry in order to guarantee the correct positioning of the sheets during the process; 12 then, the geometrical and technological process parameters must be specifically selected in order to take into account the different positions of the sheet separation surface—horizontal for T and lap joints and vertical for butt joints. 13 Finally, the distance of this surface from the main heat source of the process, that is, the tool shoulder surface, must be considered when selecting the tool shoulder diameter. In FSW, a main material flow is induced by the tool action in the horizontal plane, that is, the plane parallel to the advancing direction of the tool. An additional flow, of a lesser extent, occurs in the vertical plane, that is, the one containing the tool axis. 12 This condition is particularly effective for butt joints. On the contrary, when T and lap joints are regarded, the vertical component of the material flow must assume a predominant role by properly designing the tool geometry.
As far as the metallurgical evolutions of the material are regarded, the material microstructure undergoes softening phenomena due to the increase in temperature in all the “zones” of the transverse section of the FSW joint, namely, the thermomechanically affected zone (TMAZ), the thermally affected zone (HAZ) and the so-called nugget. In this area, the deformed structure undergoes dynamic recovery (DRV) and possibly continuous dynamic recrystallization phenomena.8,9
Regarding the modeling of the process, a few different approaches have already been presented in literature based either on simple thermal models 14 or on finite element thermomechanical ones. 15 Some of the authors proposed a three-dimensional (3D) continuum-based finite element model (FEM), 16 which highlights the FSW mechanics and the values of the main field variables. The model was based on a “single block” approach as it will be better explained in the following.
In this article, the main metallurgical and mechanical properties of FSW lap joints obtained for different tool feed rates have been analyzed. Macro and micro observations of the joints have been performed, and a numerical model of the process was utilized to predict the temperature fields during the process and to relate them to the occurring microstructural evolutions.
Experimental tests
In Figure 1, a sketch of the considered joints is shown: it should be observed that a typical skin and stringer configuration is taken into account. In particular, AA2024-T4 was used for the skins, while AA7075-T6 was selected for the S-shaped extruded profiles used as stringers. The geometry of the obtained panel is shown in Figure 1(a); Figure 1(b) shows a sketch of the different materials used for skin and stringer. The used alloys are based on the system Al-Cu-Mg (AA2024) and Al-Zn-Mg (AA7075) hardened through T4 (solubilization and natural aging) and T6 (solubilization and artificial aging) procedures, respectively. The basic chemical composition of the two alloys is reported in Table 1.
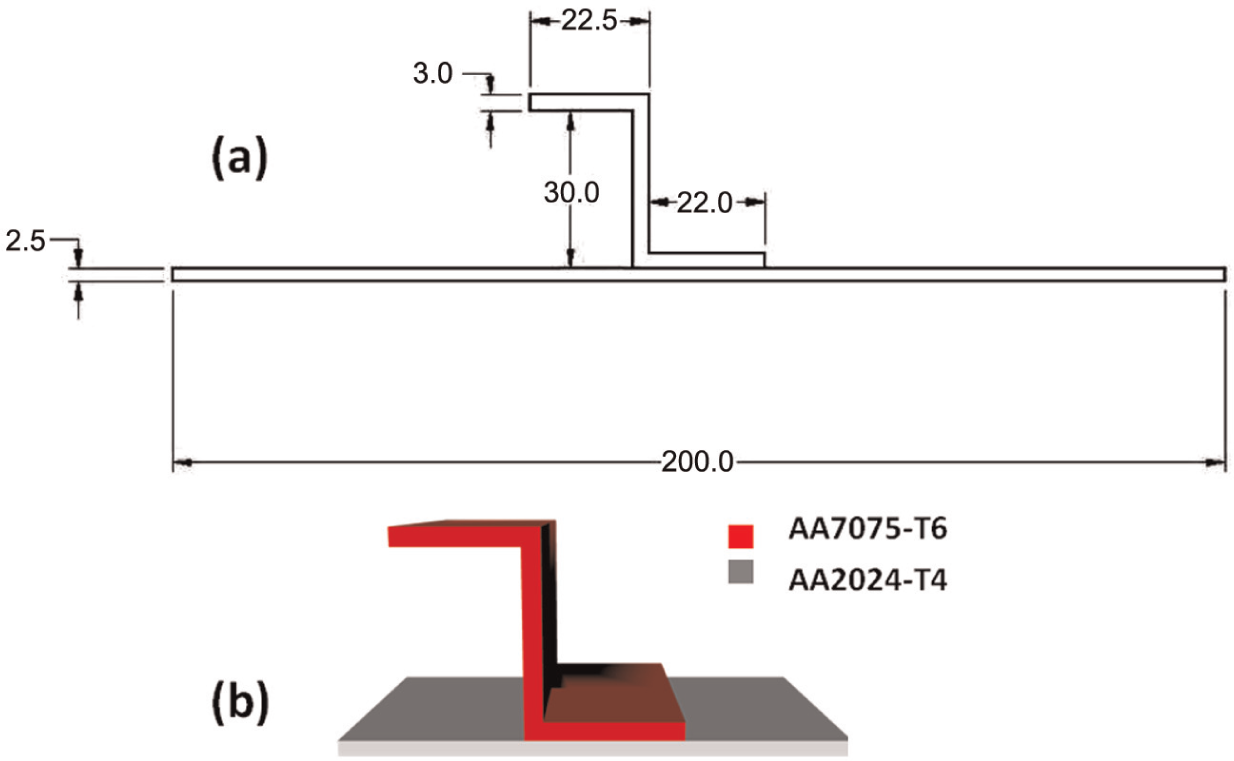
(a) Geometrical characteristics of the joints (dimensions in mm) and (b) schematic representation of the two used aluminum alloys.
Chemical composition (wt%) for the alloys AA2024 and AA7075.
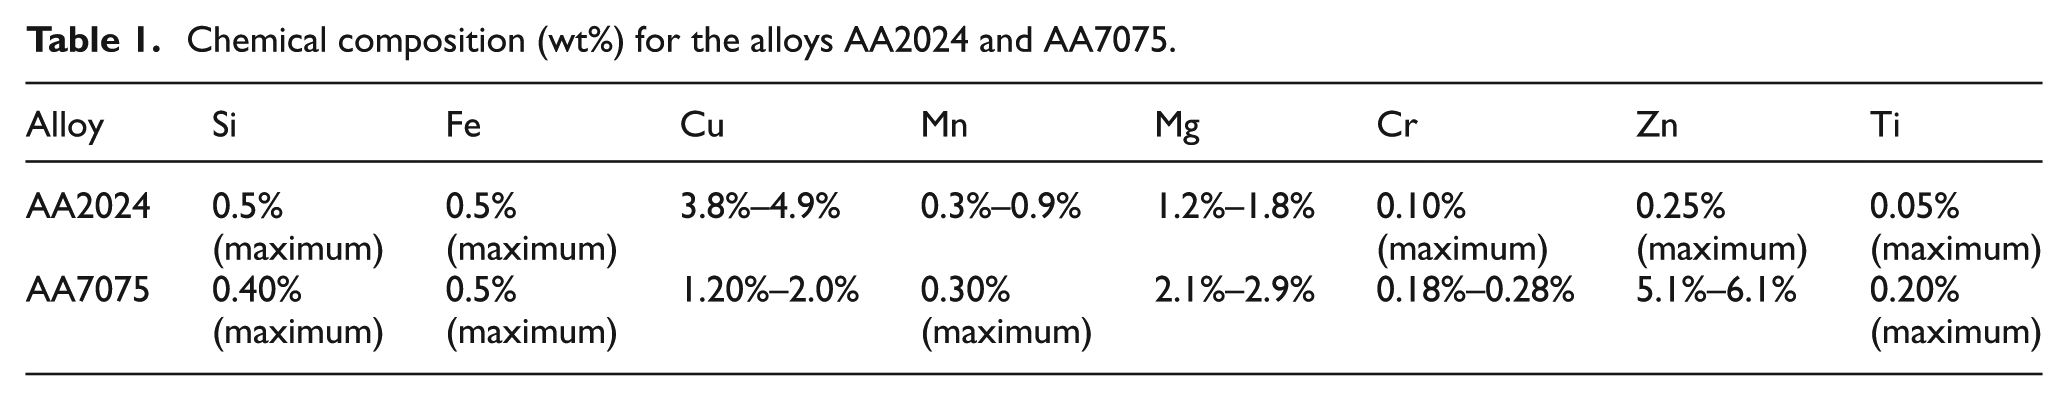
As far as the FSW process is regarded, the joints were obtained using a fixed tool of rotating speed R = 500 r/min and three different levels of tool feed rate, namely, V = 35, 50 and 100 mm/min. The tool was characterized by the geometry shown in Figure 2(a). Tool shoulder penetration into the top surfaces of the blanks was fixed equal to 0.2 mm. A constant tool tilt angle of 2° was used for all the tests.
(a) Tool geometry and (b) used clamping fixture.
In Figure 2(b), the used clamping fixture is shown. It should be observed that in order to weld through FSW skin and stringer configuration joints, a proper clamping support must be used allowing the tool to move all along the welding line.
Three case studies, corresponding to three different levels of specific thermal contribution (STC) conferred to the joint, were identified as H (High STC, V = 35 mm/min), M (Medium STC, V = 50 mm/min) and L (Low STC, V = 100 mm/min).
Both the base materials (BMs) and the transverse sections of the joints were investigated through optical and electronic microscopy. A Nikon Epiphot 200 optical microscope was used, and the specimens underwent standard metallographic preparation and Keller acid etching. Additionally, the nugget zone of the transverse sections of the joints was observed by polarized light; the specimens were electro-polished (80 mL of perchloric acid, 120 mL of distilled water, 800 mL of ethanol, 20 V) and anodized using Barker’s reagent.
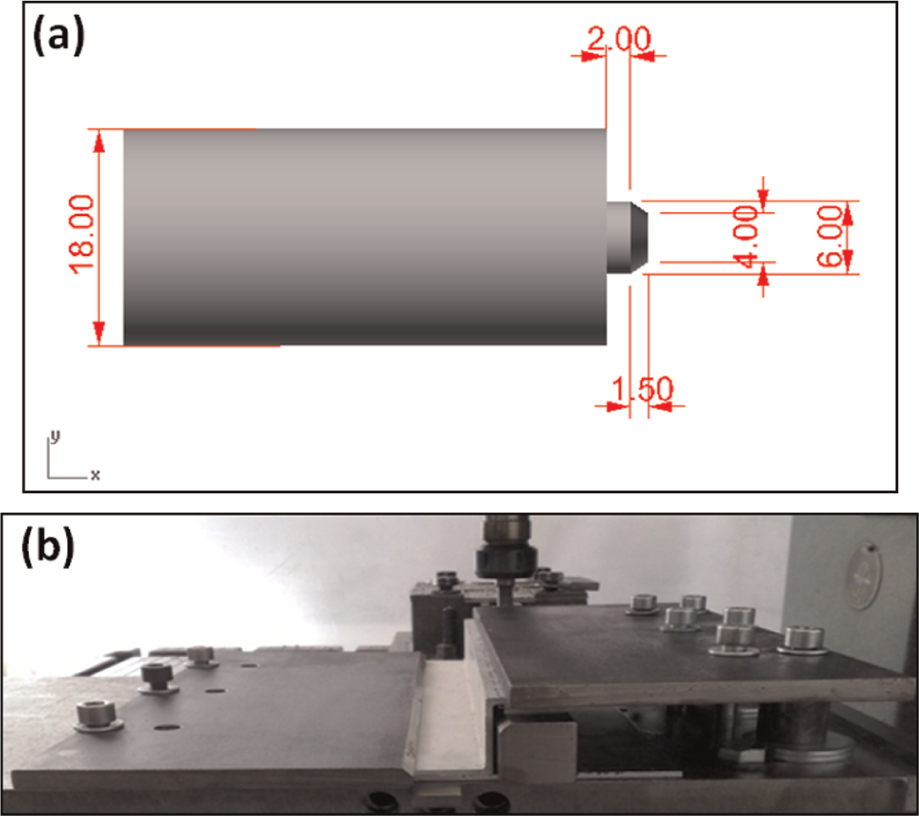
As far as the electronic microscopy is regarded, JEOL JSM-6480 LV, SEM FIB ZEISS 1540 and IXRF System SphinX 130 were used. The mechanical characterization of the BMs was carried out through simple tensile tests and through T-pull tests. 17 Vickers microhardness measurements were developed using a load of 500 g for 15 s; a matrix of four rows of indentations spaced at 1 mm interval, both along the x- and y-axes, was utilized. The rows were at 1.5 mm from the bottom and the top layers of the joint as shown in Figure 3. In this way, a total of 104 measurement points were investigated.
Microhardness measurement loci.
Heat treatments were carried out on the BMs at 450 °C and 250 °C for 1, 2 and 3 min, by submerging specimens in a salt bath with subsequent cooling in air with the aim to separately highlight the thermal and mechanical stirring effects taking place during FSW operations. In this way, the metallurgical evolutions of the BMs occurring during the welding process were investigated in detail. Microhardness and electrical conductivity were measured on the treated specimens: the obtained results were compared with those on the welded joints.
Brief remarks on the FEM model and numerical results
The commercial finite element analysis (FEA) software DEFORM-3D™16 Lagrangian implicit code designed for metal forming processes was utilized to investigate the FSW of lap joints. In Figure 4, a sketch of the model, highlighting the mesh, is shown. The remaining components of the experimental clamping fixture were modeled by proper boundary conditions.
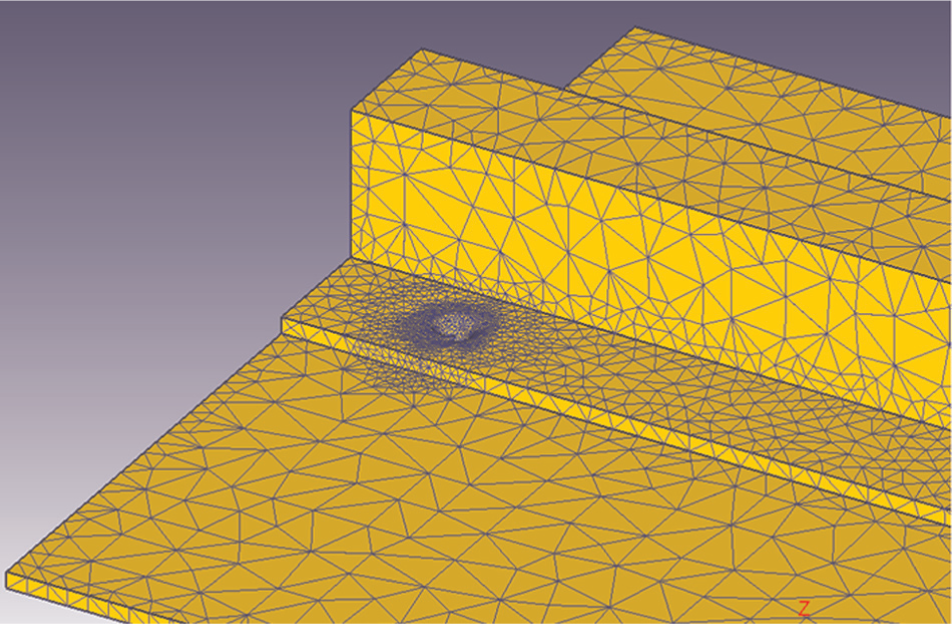
The numerical model.
The process was simulated starting from the tool plunge in order to obtain the needed temperature distribution for the subsequent welding stage when the tool is moved along the welding line. Constant thermal conductivity and heat capacity, taken from literature, 18 were assumed in order to linearize the thermal problem and reduce the calculation time. A temperature- and strain rate–dependent material model was used for the two alloys
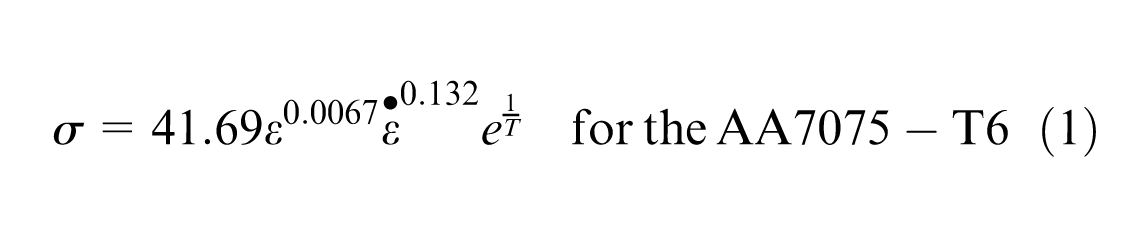
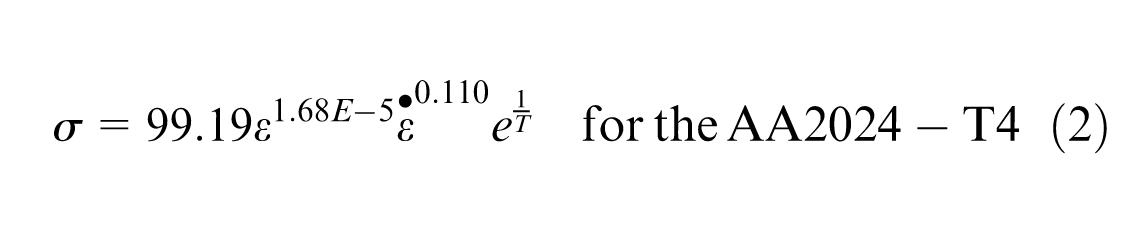
where the constant values are derived from a numerical regression based on the experimental results obtained merging literature data 18 and self-developed tests.
The tool geometry was modeled as rigid body and meshed, for the thermal analysis, with about 3000 tetrahedral elements. The two sheets were modeled as a unique simulation object in order to avoid numerical instabilities due to the contact between two deformable objects. This approach has already been proved effective as the prediction of the main field variable distributions is regarded. 16 The sheet blanks were meshed with about 48,000 tetrahedral elements with linear four dimensions of about 0.75 mm in order to have about four elements along the thickness of each sheet. Smaller elements were placed in the welding area and adaptive remeshing was adopted, characterized by a remeshing window moving with the tool. Sensibility analysis on the mesh density showed that finer mesh does not result in significant enhancement of the model’s predictive capability.
A distinguishing feature of the proposed model is the capability to take into account the presence of two different materials, characterized by two different thermomechanical behavior, in a unique simulation object. 19 The code allows the simulation of the “Diffusion simplified” phase transformation that calculates the material volume fraction subjected to the transformation. The basic idea of the proposed approach was to let the material fully transform from AA2024-T4 to AA7076-T6 in the area of the single block model corresponding to the stringer and then to “freeze” the transformation, avoiding the occurrence of further transformation during the FSW process. In this way, a preliminary stage of the simulation, taking a few steps and a negligible central processing unit (CPU) time with respect to the simulation of the actual process, was used for the phase transformation (Figure 5(a)–(d)).
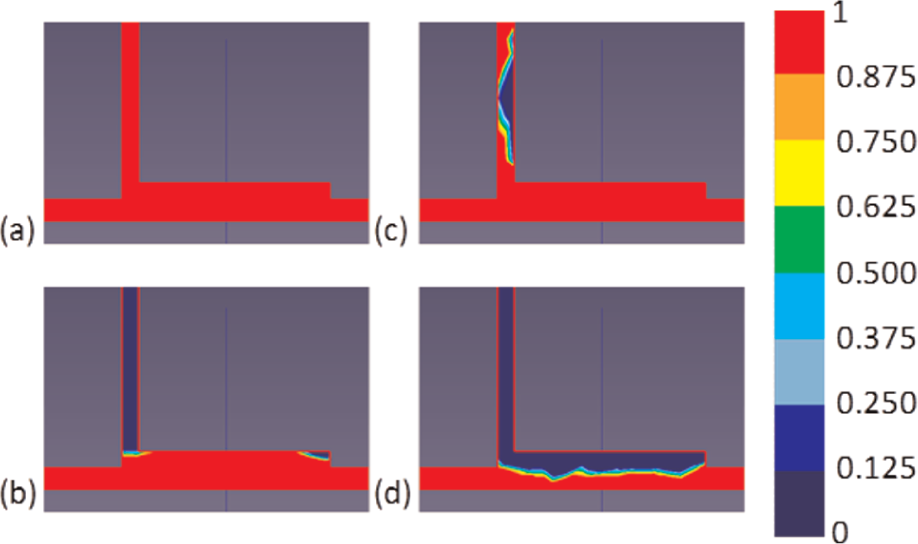
Volume fraction of AA2024: (a–d) four subsequent stages of the phase transformation in the joint.
In this way, the presence of the two different materials was maintained, and the first stage of the simulation, that is, the tool plunge, was run. Additional details on the numerical procedure can be found in Fratini et al. 19 The contact conditions at the tool–workpiece interface were modeled through a constant interface heat exchange coefficient of 11 N/mm s °C and a constant shear friction factor of 0.46. 16 The model was used to simulate the experiments carried out varying the STC levels.
Results and discussion
BM microstructures
The microstructure of 2024 and 7075 BM was studied both in the cross and longitudinal sections according to the sketch reported in Figure 6.
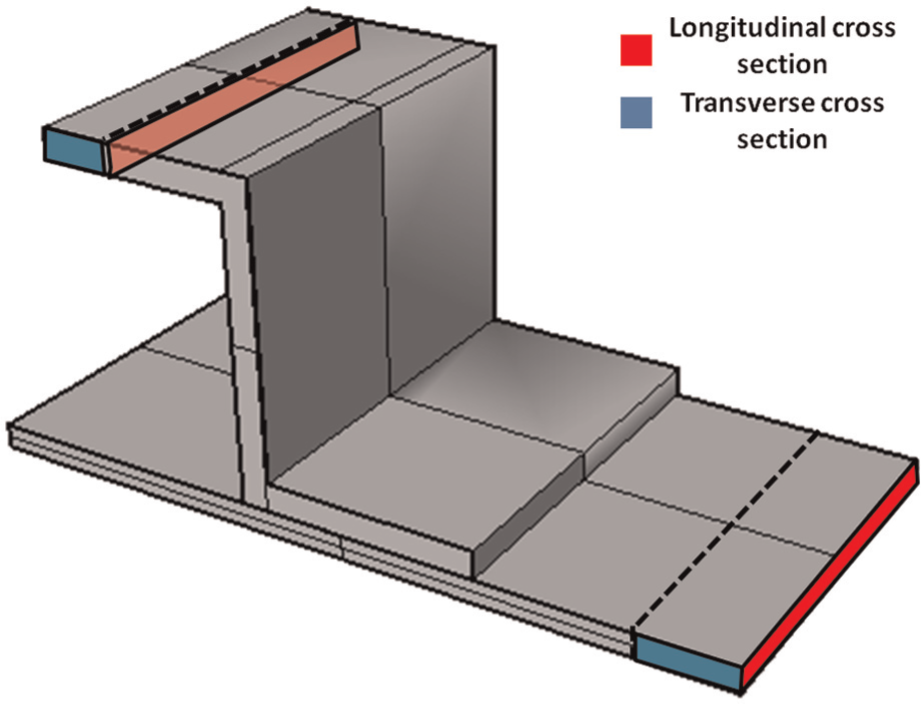
Identification of cross and longitudinal sections in 2024 and 7075 parts.
The 2024 sheet was welded in the T4 state, that is, with solution treatment and natural aging. The hardening mechanism is due to Guinier–Preston zone (GP zone) in the grains that hinder dislocation movement. Average microhardness (Hv0.5/15 s) value along cross section is 55.4 ± 1.2.
Light microscopy and SEM analysis revealed the presence of Al2CuMg (spheroidized) and Al7Cu2Fe (irregular) on the basis of morphology as indicated in Figure 7(a) and (b).20–23 Phase identification has been confirmed by energy-dispersive X-ray spectroscopy (EDS) microanalysis (Figure 7(c)). Optical micrographs of longitudinal section (Figure 7(d)) and cross section (Figure 7(e)) after chemical etching show the grains in the area to be welded.
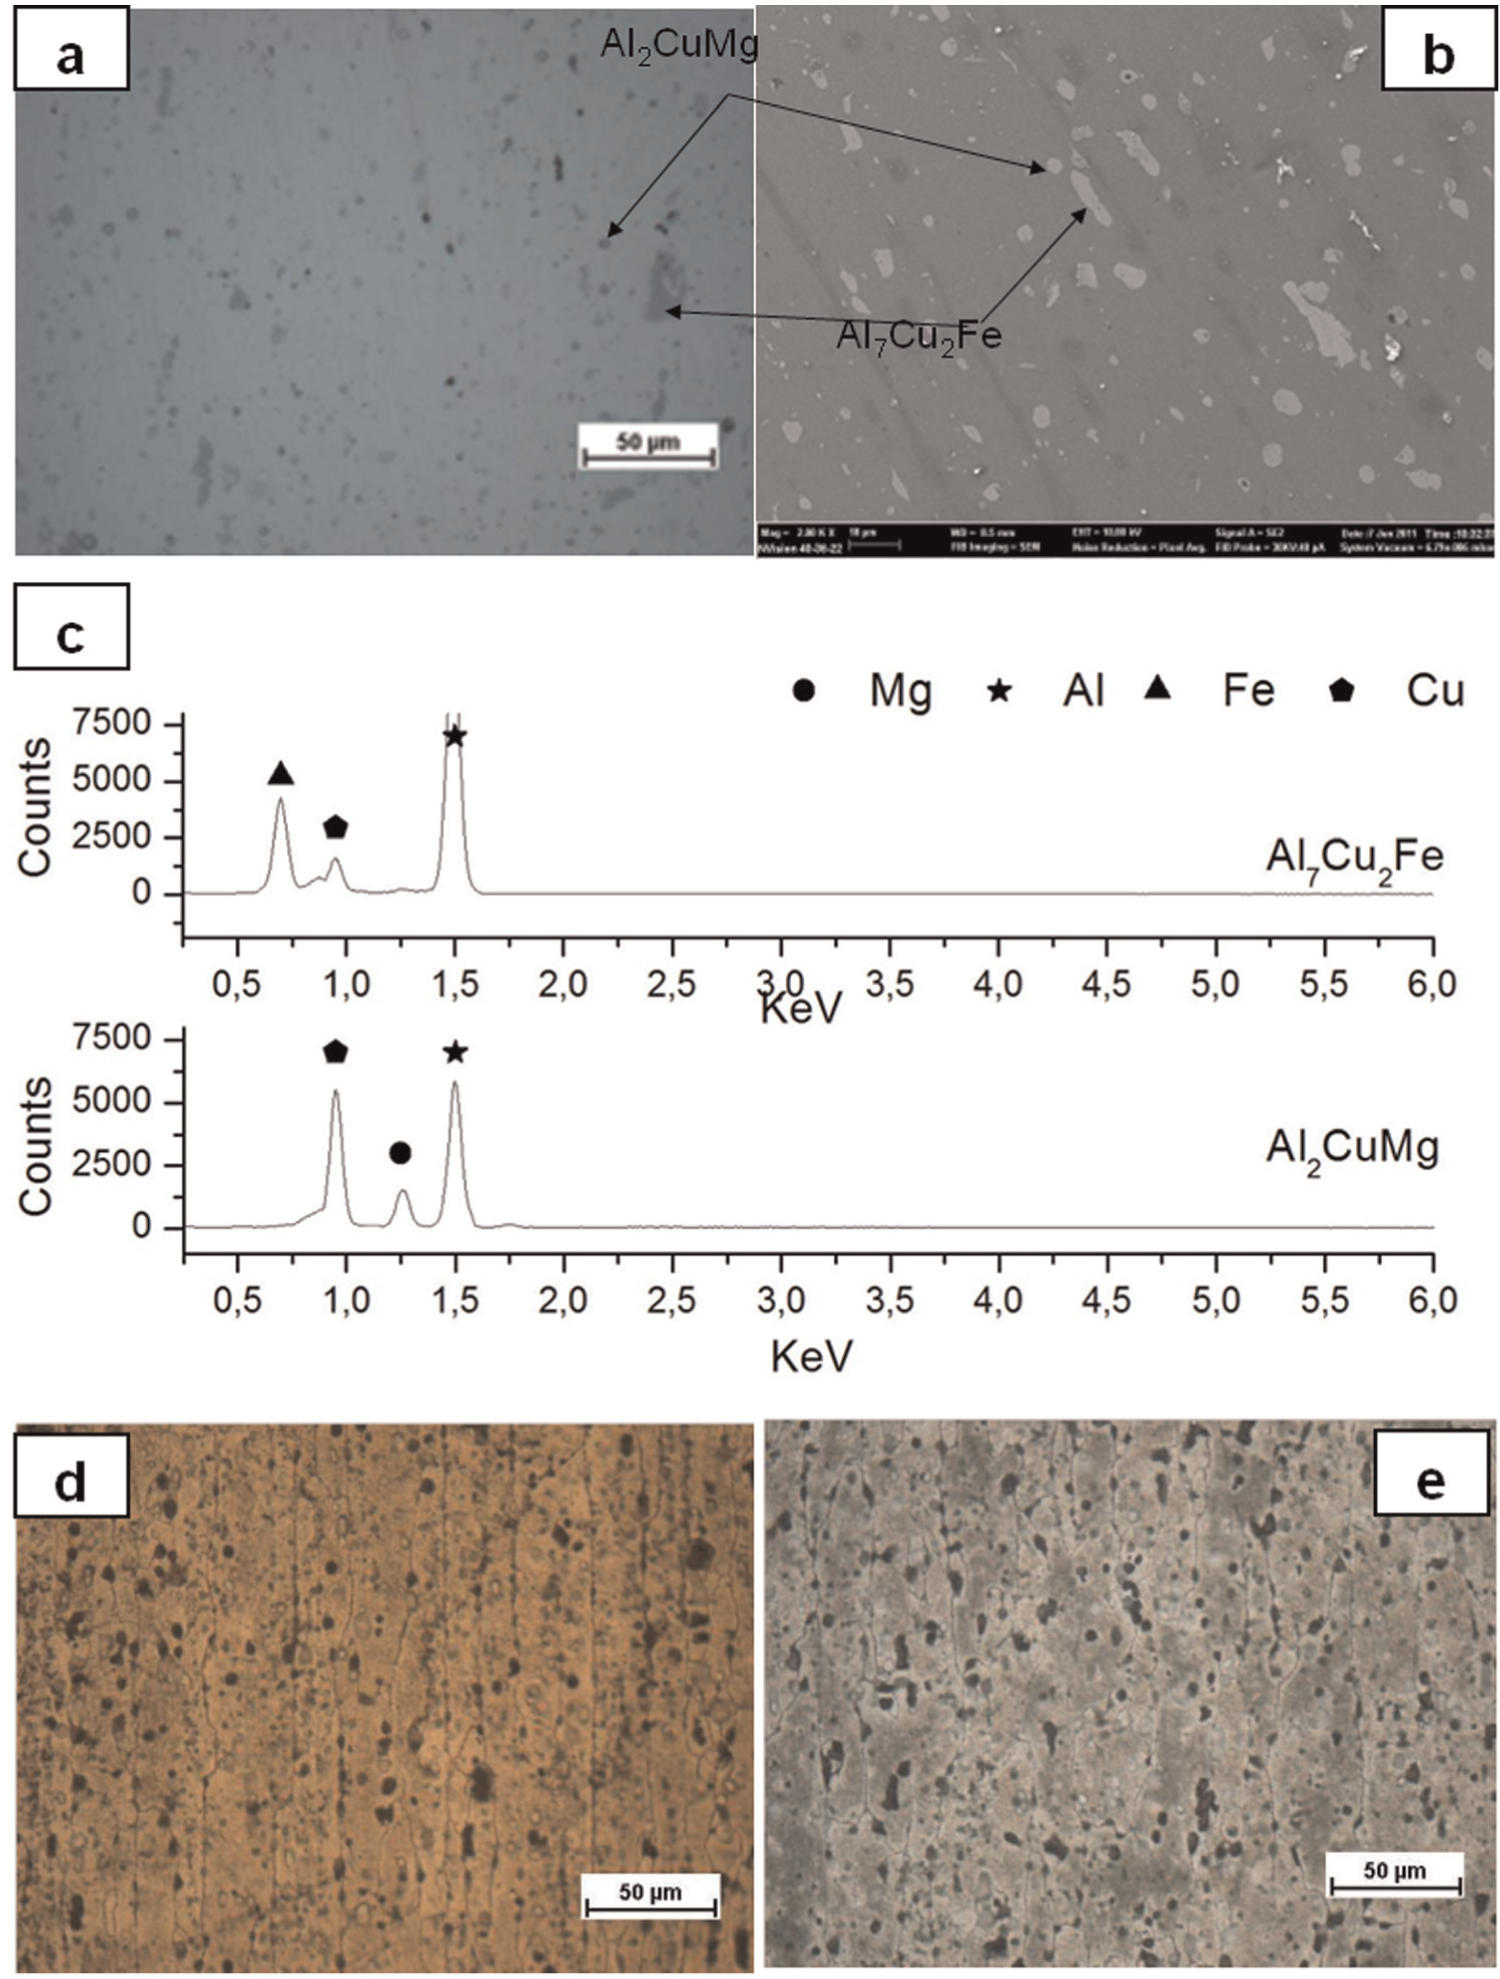
(a) Optical and (b) SEM micrographs of 2024-T4 BM with phase identification; (c) EDS spectrum for Al2CuMg and Al7Cu2Fe; optical micrographs of (d) longitudinal section and (e) cross section after chemical etchant showing grain boundaries.
In the T4 state, some of Mg containing phases and Al2Cu stable precipitates may be undissolved depending on Cu content, solution temperature (usually 495 °C) and quenching rate.20–24 The sheet used in the skin–stringer configuration was 7075-T6, which is solution treated and artificially aged to reach the peak hardness. Average microhardness (Hv0.5/15 s) value along the cross section is 159.7 ± 6.3. Light microscopy and SEM microanalysis, Figure 8, have revealed the particles as follows: irregular (Al7Cu2Fe and Al2CuMg type) and smaller (about 2 µm diameter) spheroidal particles of Mg2Si (Figure 8(a)). Moreover, MgZn2 precipitates at grain boundary and interior are visible (Figure 8(b)). Phase identification of Mg-Si and Mg-Zn particles has been confirmed by EDS microanalysis (Figure 8(c)). Optical micrographs of longitudinal section (Figure 8(d)) and cross section (Figure 8(e)) show elongated grains with fibrous intermetallic compounds fractured and aligned in longitudinal direction.
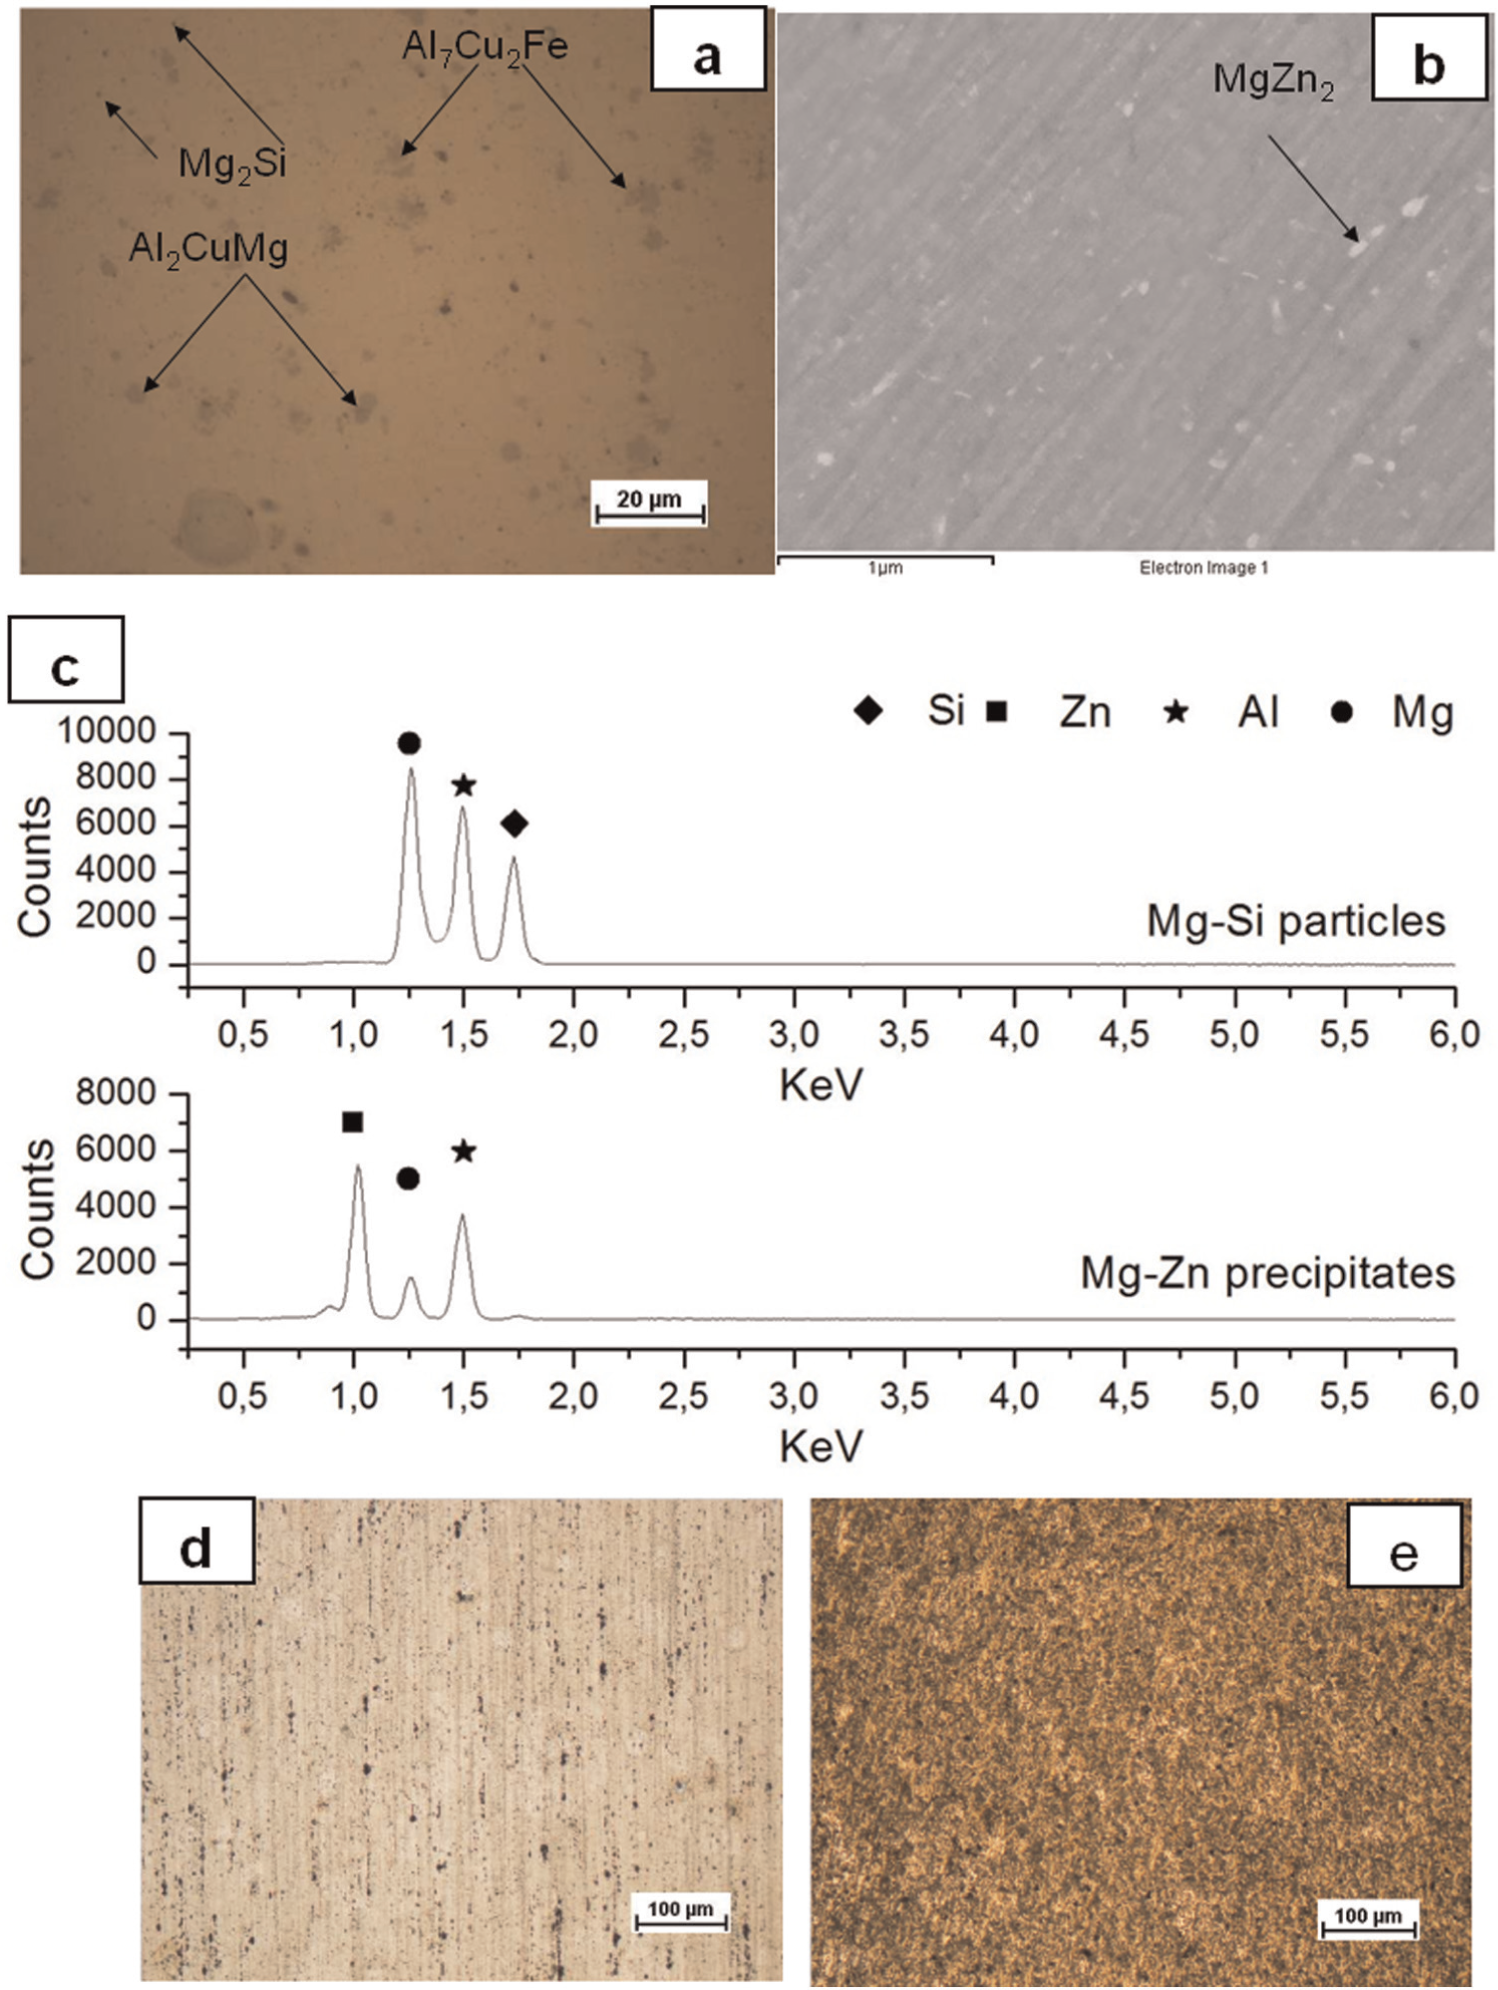
(a) 7075-T6 BM light microscopy showing phases (no etching), (b) SEM micrograph showing MgZn2 particles, (c) EDS spectrum for Mg2Si and MgZn2 and optical micrographs of (d) longitudinal section and (e) cross section after etching.
Friction stir welded joint microstructure
Figure 9(a) is a schematic transverse section of the FSW joint highlighting the most typical and analyzed areas. Figure 9(b) is a montage of low-magnification light micrographs showing the morphology of the stir region and surrounding zones. Capital letters indicate the regions investigated by light and SEM microscopy at higher magnification (Figure 10). Finally, Figure 9(c)–(e) shows the macro image of the etched transverse section for the L, M and H case study, respectively. All the three welds are sound with no macro defect due to incorrect material flow.
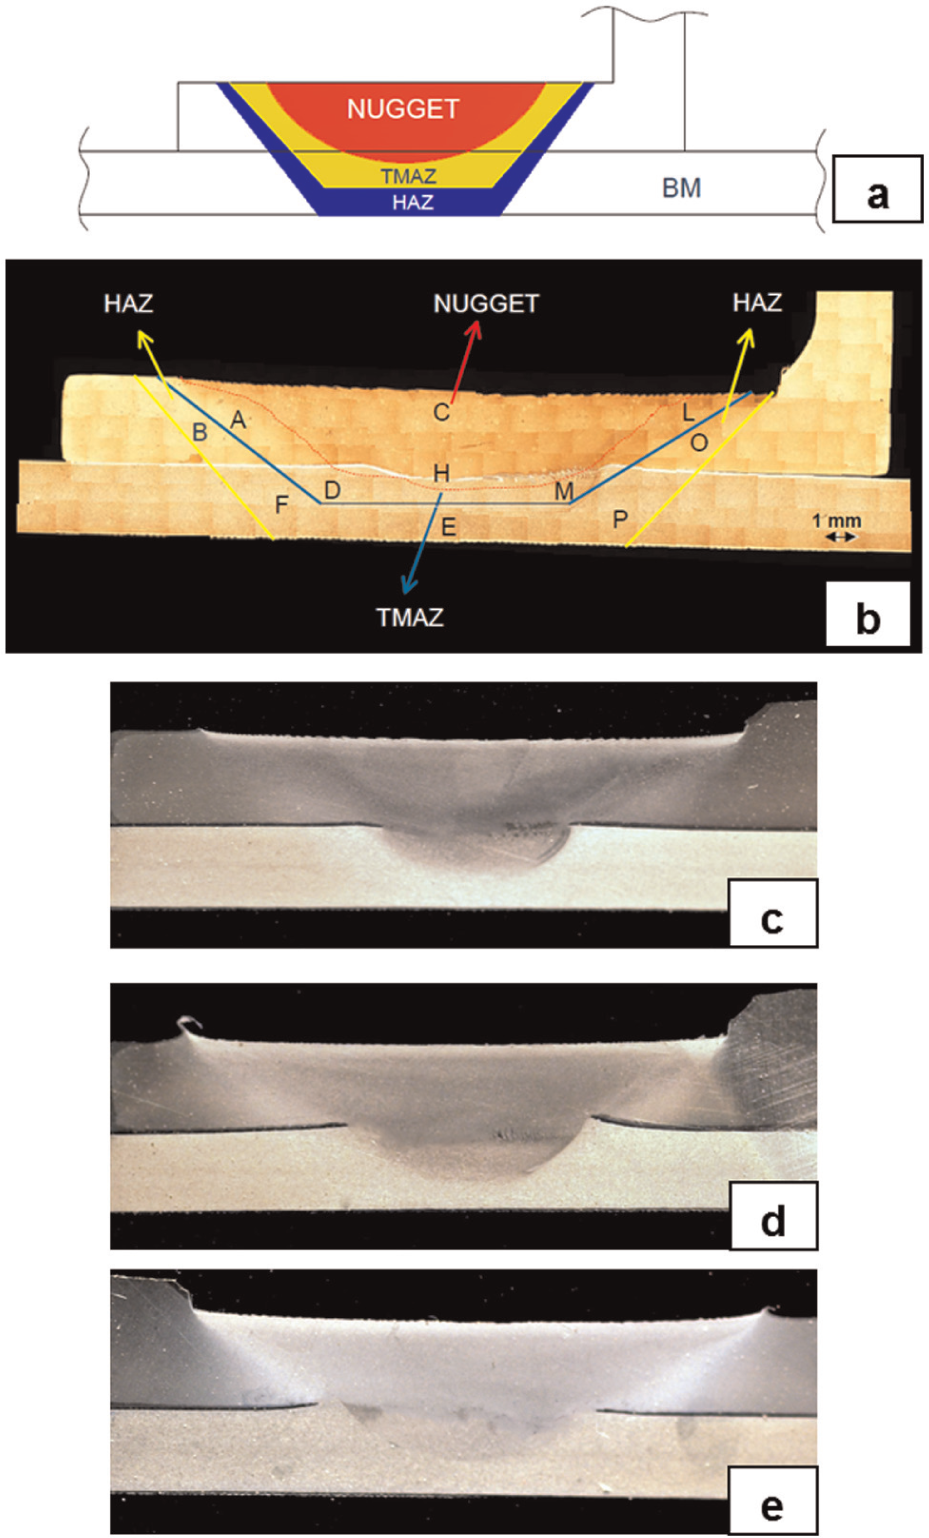
(a) Sketch of the transverse section indicating the most significant and analyzed regions; (b) montage of low-magnification light micrographs; and macro images of (c) L, (d) M and (e) H case studies.
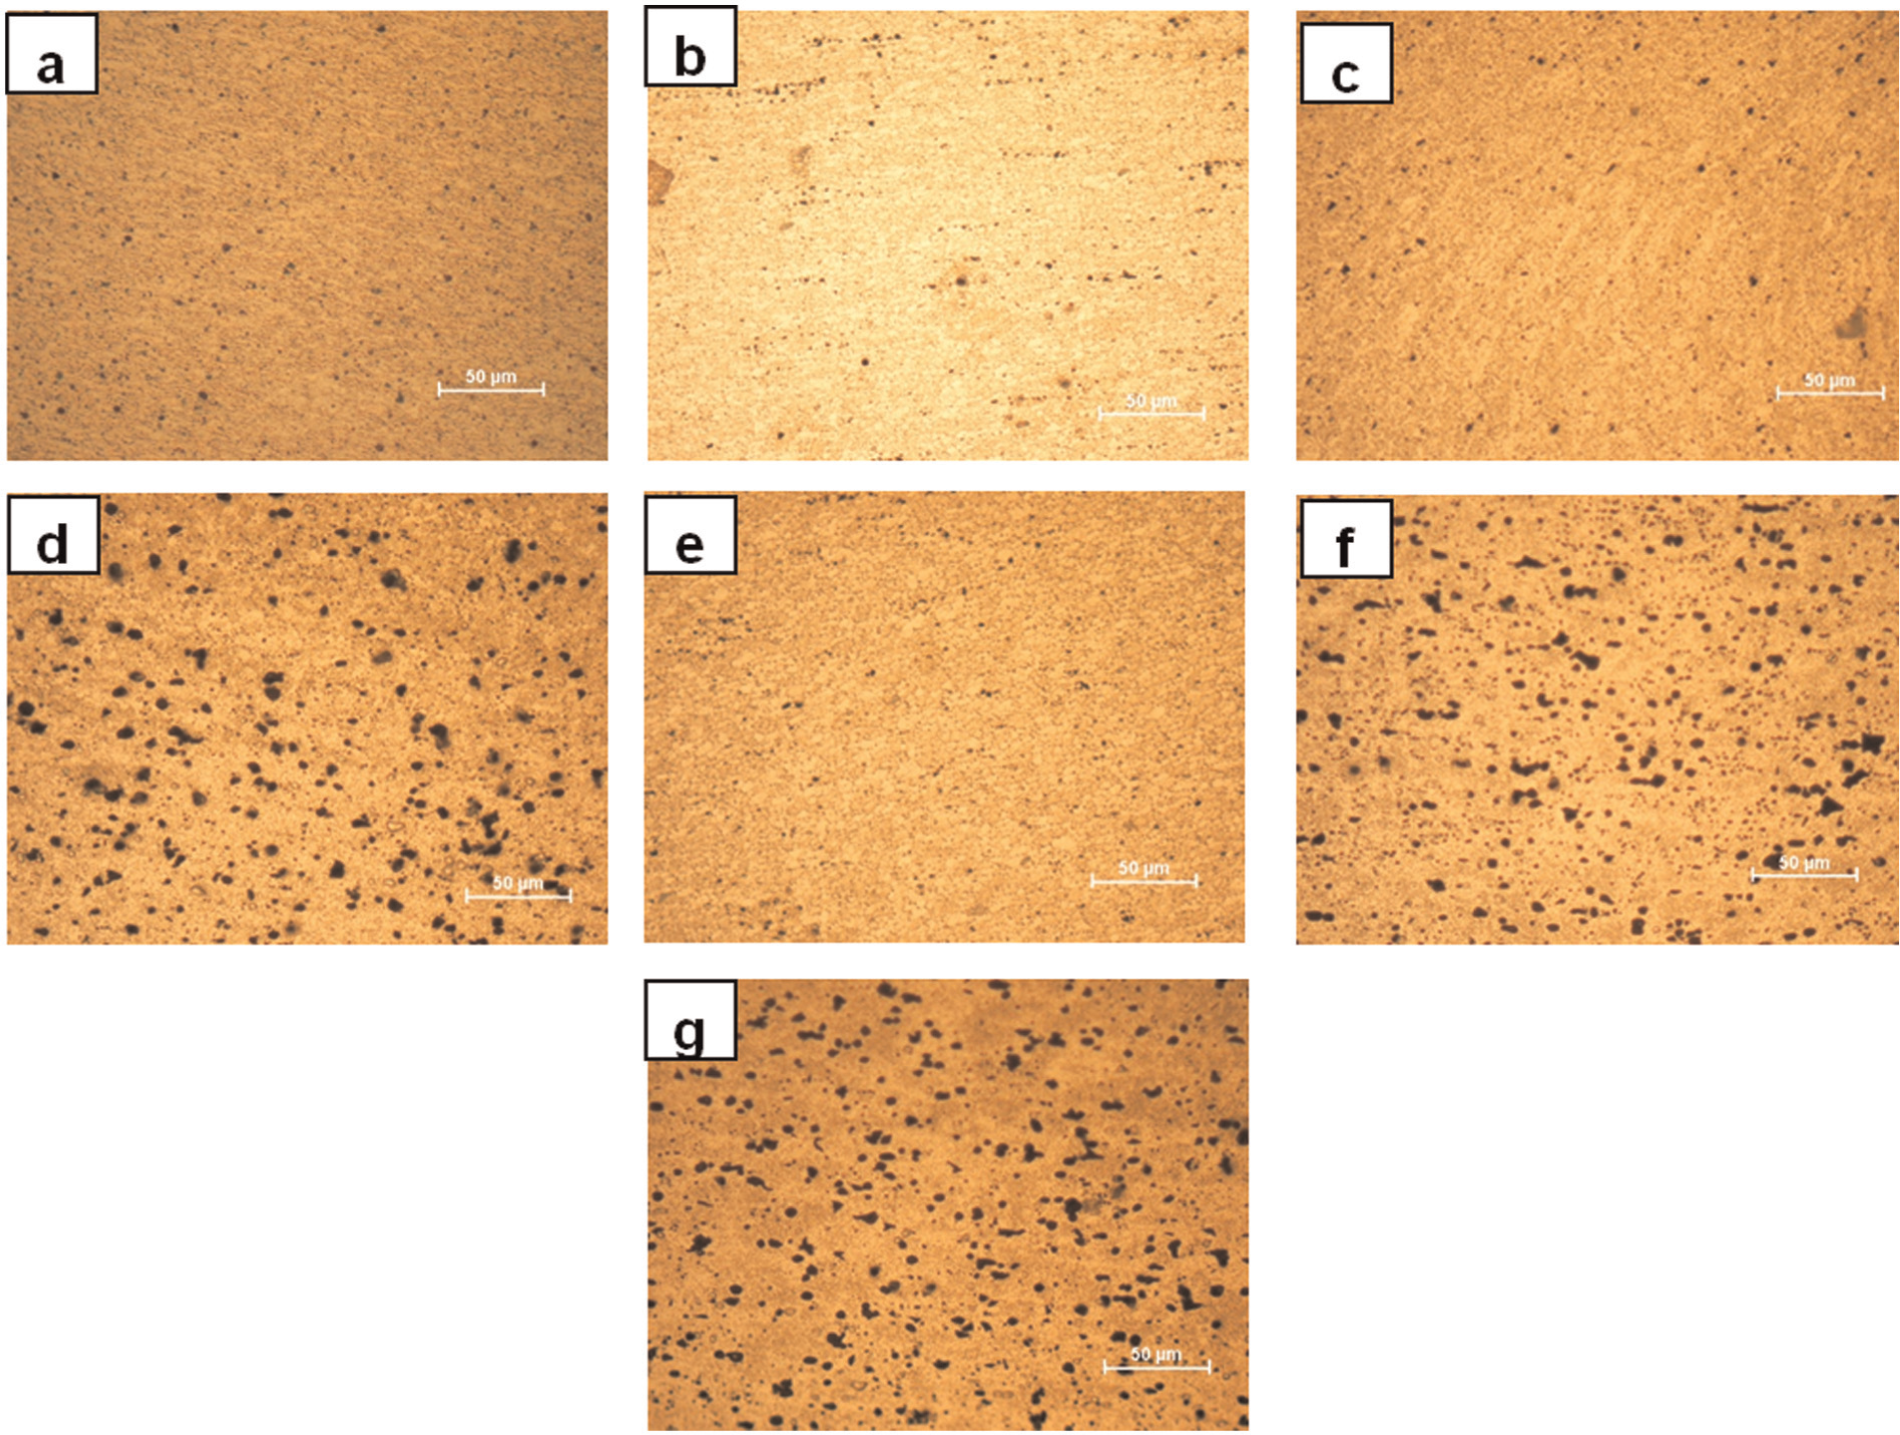
Optical micrographs as indicated in Figure 9: (a) area A, (b) area C, (c) area L (c), (d) area D, (e) area H, (f) area M and (g) area E.
Recrystallized grains are visible in Figure 10(b) and (e) as magnifications of regions C and H in Figure 9(b); Figure 10(a) and (c) shows the TMAZ and the HAZ with no apparent changes compared to BM. Fibering of intermetallic compounds can be observed in the nugget (Figure 10(b)) along the direction perpendicular to the welding line.
The high-magnification pictures (Figure 11) of C and O regions (Figure 9(b)) again of the 7075-T6 show that the MgZn2 particles found both on the grain boundaries and inside the grains in the HAZ (Figure 11(a)) are smaller than those in the nugget (Figure 11(b)). SEM micrographs of different areas of the 2024-T4 skin are shown in Figure 12. Figure 12(a) is a high-magnification picture of the NM showing Al-Cu-Mg and smaller Al-Cu particles (Al-Cu particles undissolved from solutionizing). In the nugget region (Figure 12(b)), the small particle density is reduced with respect to the BM. Additionally, elongated particles (P in Figure 12(b)) whose morphology indicates S phase (Al2CuMg) are found, as confirmed by EDS21–23 recalling the presence of Cu and Mg.
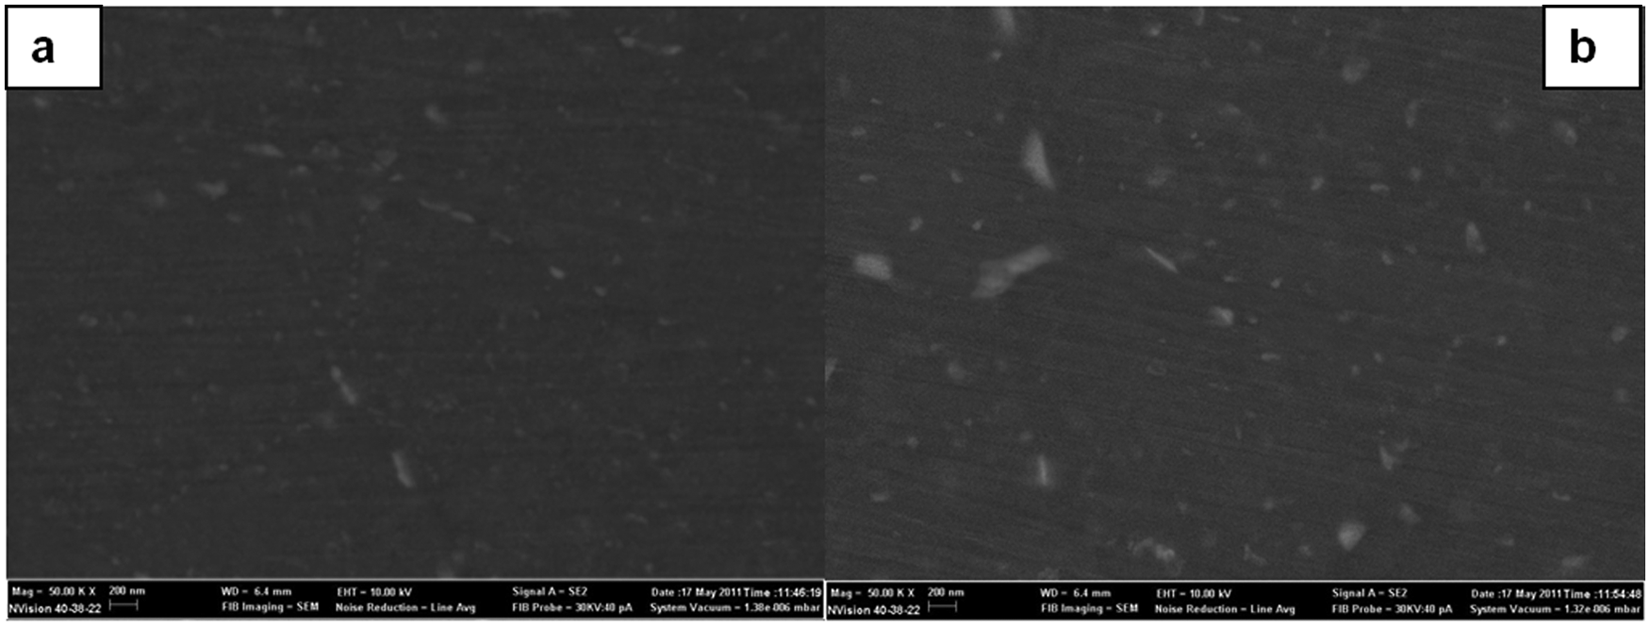
SEM micrographs of the AA7075-T6 stringer in (a) area O and (b) area C showing that particles size increases in the nugget.
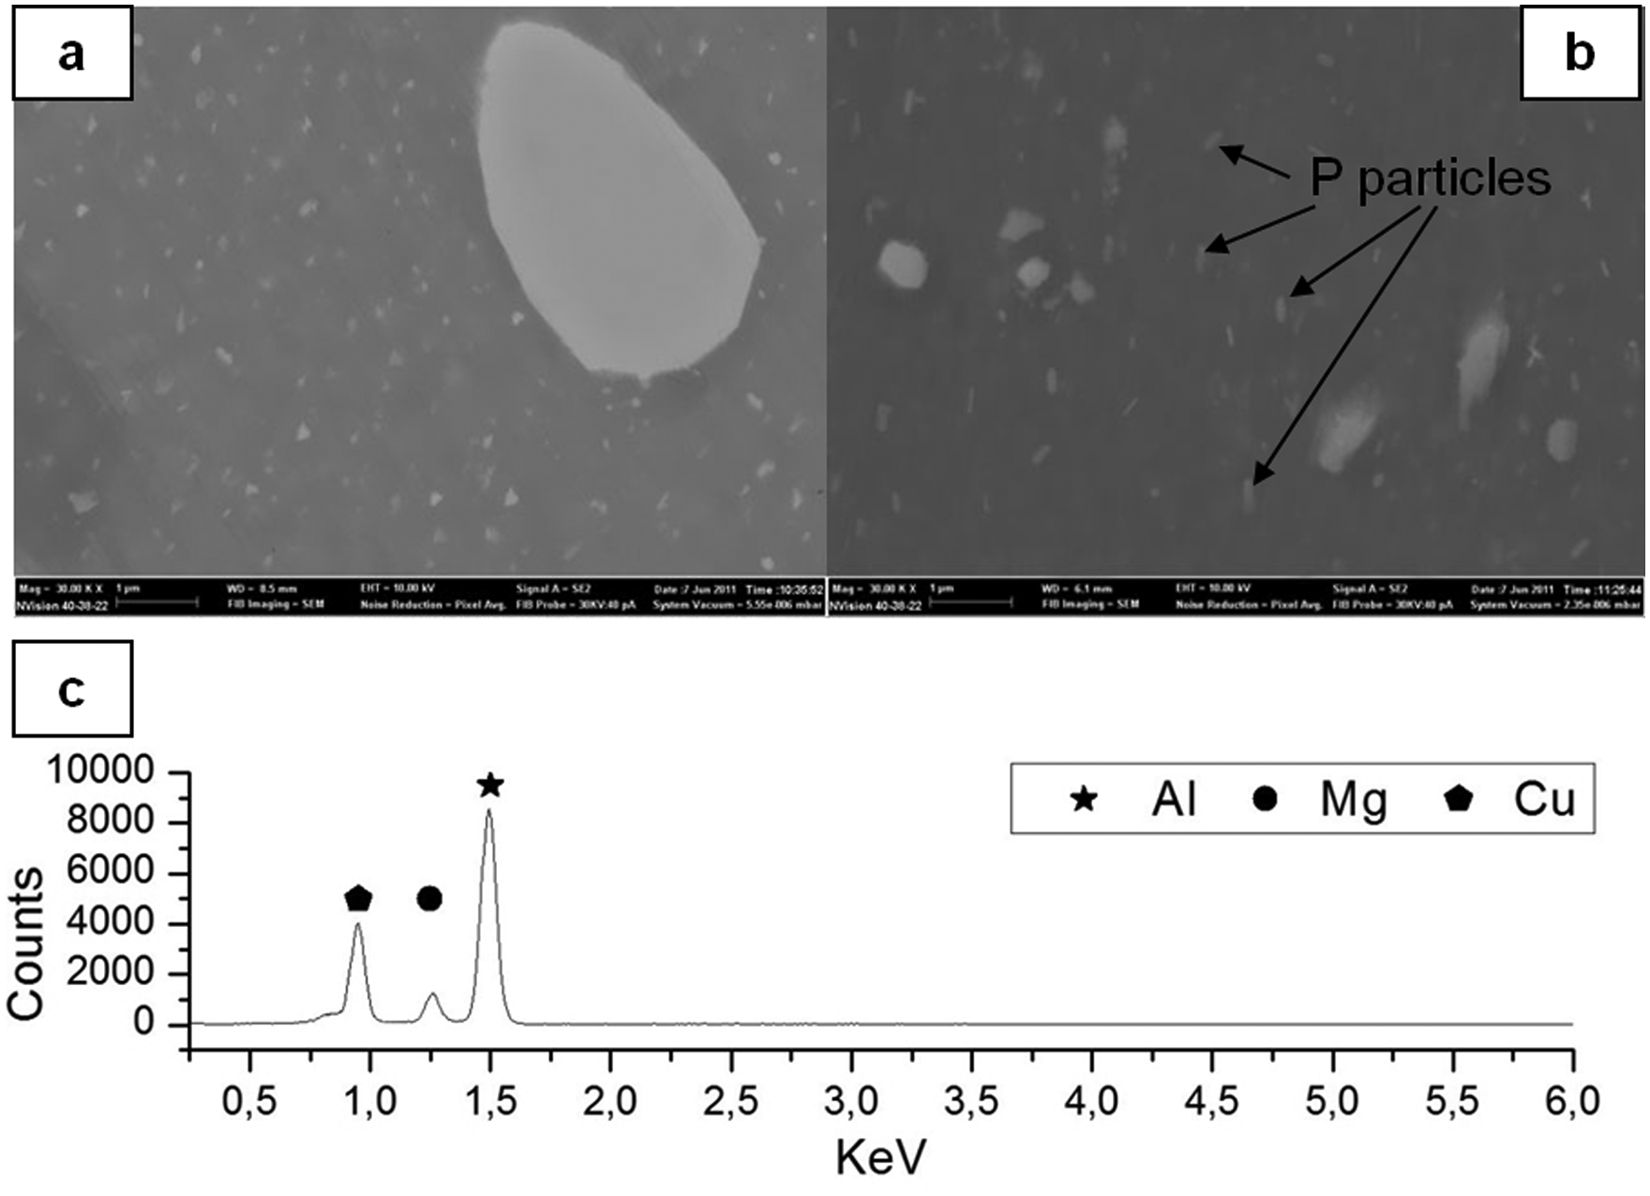
SEM micrographs of the AA2024-T4 skin: (a) BM showing smaller particles uniformly distributed in the matrix; (b) area H showing a reduction of smaller particles and elongated particles; and (c) EDS analysis of P particles from (b).
In order to separate the contribution of plastic deformation to the solution-aging effect of temperature in the welded joints, the BM of the two sheets was exposed to high (450 °C) and low temperatures (250 °C), thus reproducing typical measured values during the FSW. The effect was evaluated by microhardness and electrical conductivity values measured at constant temperature as a function of time (Figure 13). The 7075-T6 alloy exhibited a substantial decrease in hardness in few minutes at 450 °C (Figure 13(a)), while for the 2024-T4, the reduction was minimal. It is worth noticing that the reduction is related to the initial precipitation state of the two materials. Regarding the 7075-T6, precipitate dissolution is confirmed by decreasing electrical conductivity. However, at low temperature (250 °C) (Figure 13(b)), 2024-T4 exhibits a low hardness increase compared to 7075-T6 that remains constant; in fact, the T4 state permits some additional enhancement of metastable precipitate, while in the T6 condition, any evolution results in coarsening or overaging. Electrical conductivity values do not show significant changes. On the basis of these results, it can be stated that the 7075-T6 is more sensitive to high-temperature exposure (hardness decrease as shown in Figure 13(a)), while 2024-T4 is sensitive to low-temperature exposure (250 °C) (slight hardness increasing (Figure 13(b)).
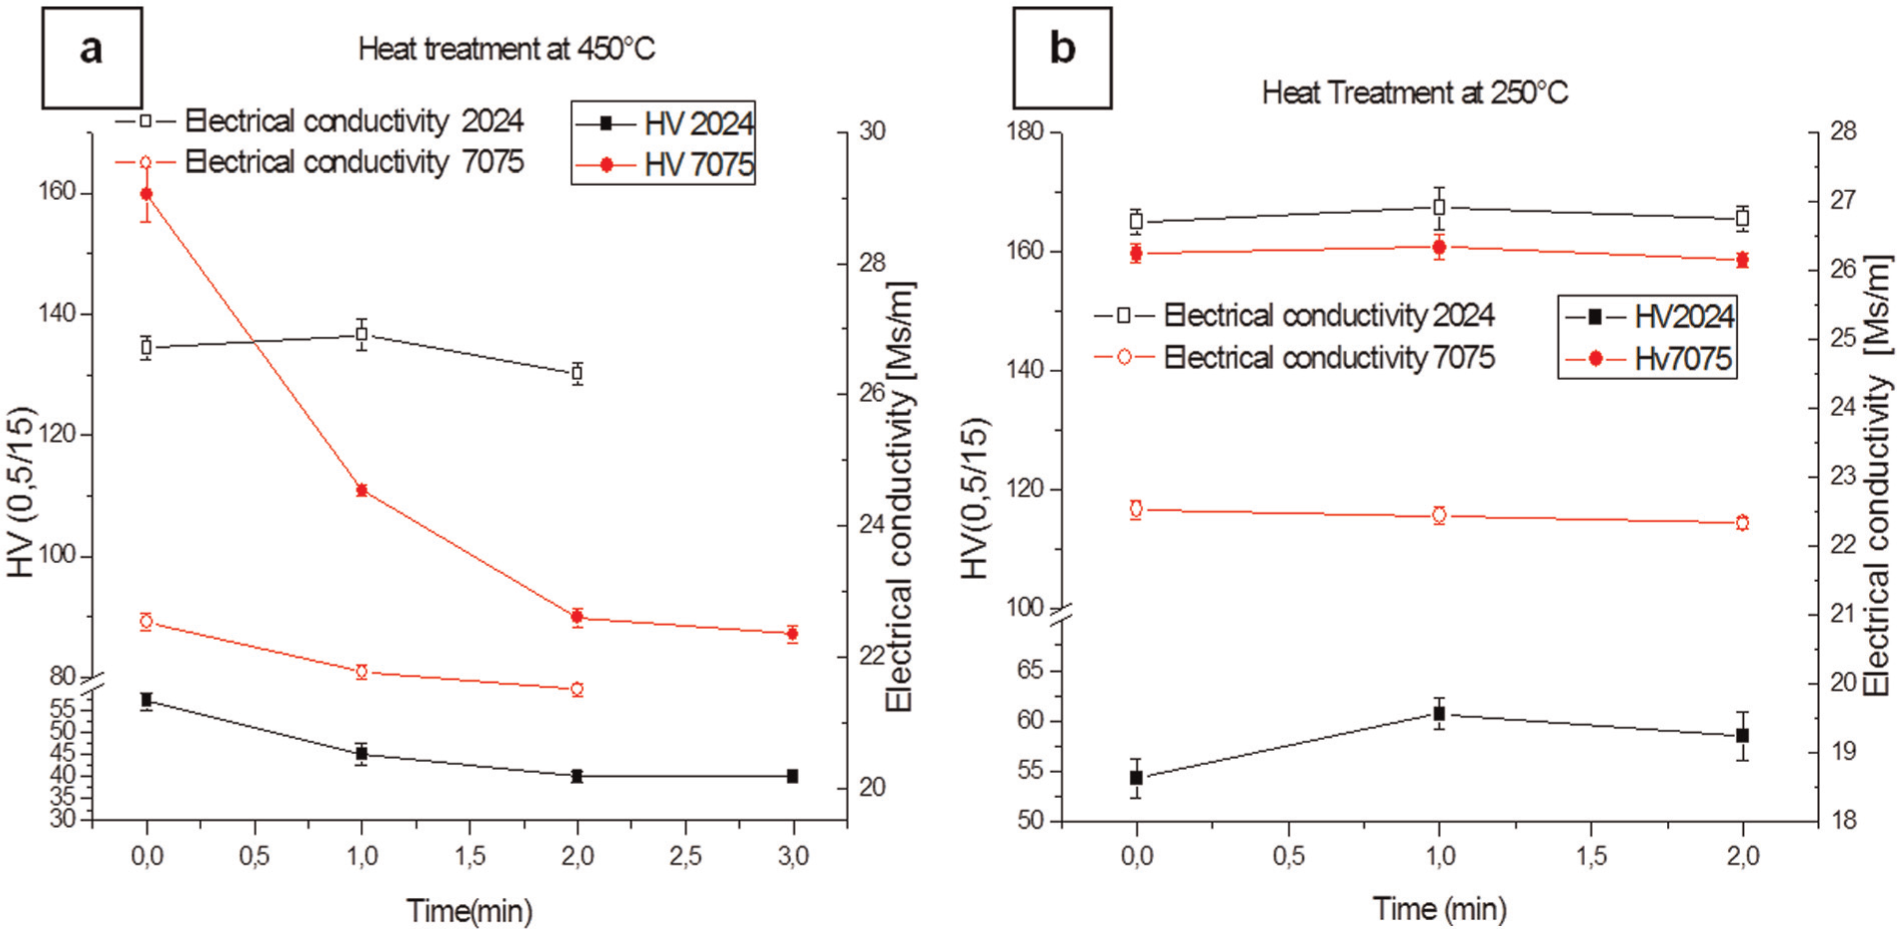
Hardness and electrical conductivity (a) at 450 °C and (b) at 250 °C as a function of time for 2024-T4 and 7075-T6 BM.
Electrical conductivity values of the joint under 2024-T4 element along the welding line are lower than the BM values before static heat treatment (24.60 ± 0.05 vs 26.7 ± 0.1 of BM). For the 2024-T4 bottom, lower electrical conductivity value indicates an increase of atoms in solid solution due to dissolution of smaller particles in the BM (Figure 12(a) and (b)).
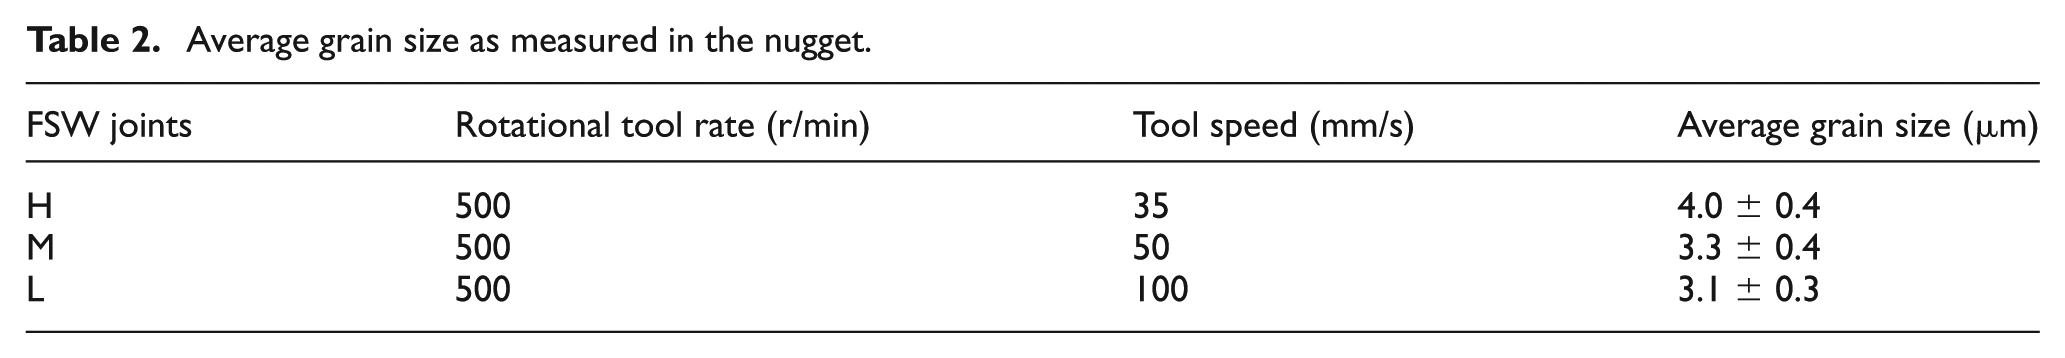
Table 2 shows mean equivalent grain size as a function of tool feed rate (mm/min) and STC. The measurements have been performed in the C and H areas of the nugget, highlighted in Figure 9(b). Mean grain size values are very close; the lowest value corresponds to L joint in accordance to thermal history of the joint that will be discussed in the next paragraph.
Average grain size as measured in the nugget.
Thermal histories and mechanical properties
The results from the numerical model were utilized for the analysis of the temperatures reached in the welded joints during the process. Figure 14 shows the temperature distribution in a 3D view of the joint welded in M STC conditions.
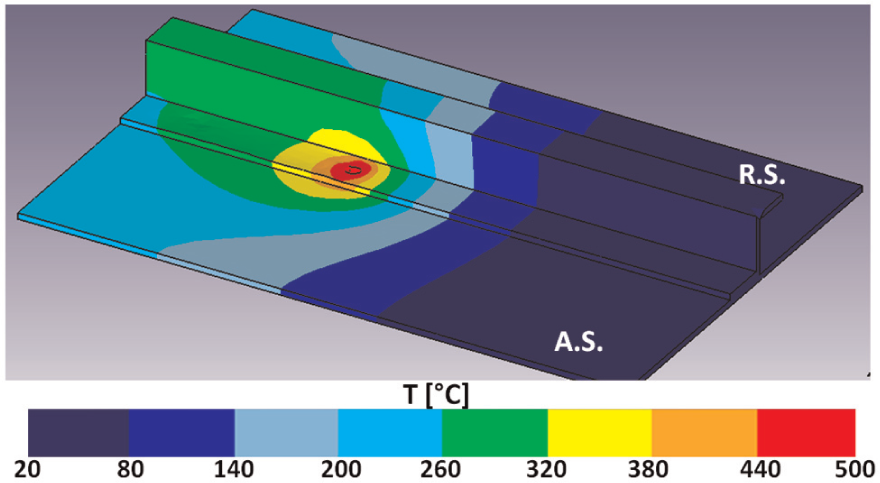
3D view of the temperature distribution in the joint—M case study.
A non-symmetric distribution is observed due to the peculiar joint morphology. In particular, higher temperatures are observed in the advancing side of the weld, that is, the half of the joint not containing the vertical “wall” of the stringer. This characteristic is better highlighted looking at a transverse section of the joint, as shown in Figure 15, taken after the process reached the steady state, that is, after about 35 mm of weld length. This section is taken right behind the tool, that is, immediately after the material closed the “crack” opened by the tool pin.
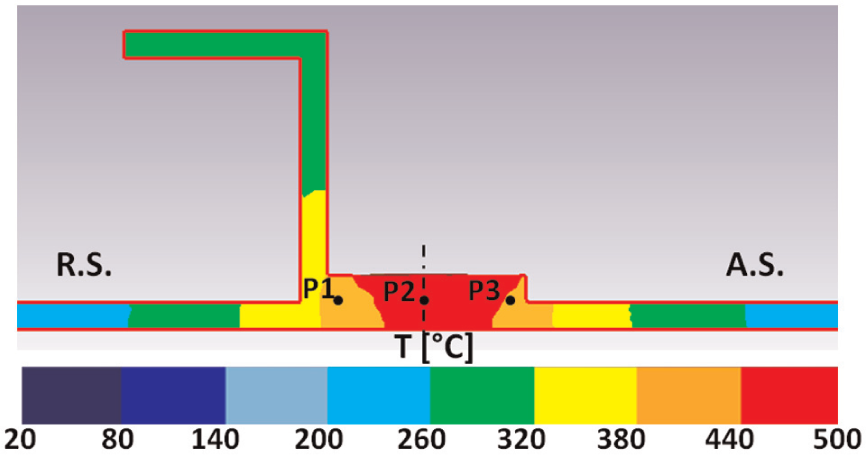
Temperature distribution in a transverse section of the joint—M case study.
Different from what usually observed for butt joints, the “V”-shaped distribution, typical of friction stir welded aluminum alloys, is not perfectly centered with respect to the welding line, especially for the stirring zone. In this way, the P1 and P3 measurement loci, located at 2.5 mm from the bottom of the skin and at a distance of 8 mm from the welding surface, experience different temperature histories during the process. Figure 16 shows the thermal histories of the three points highlighted in Figure 13 during the weld.
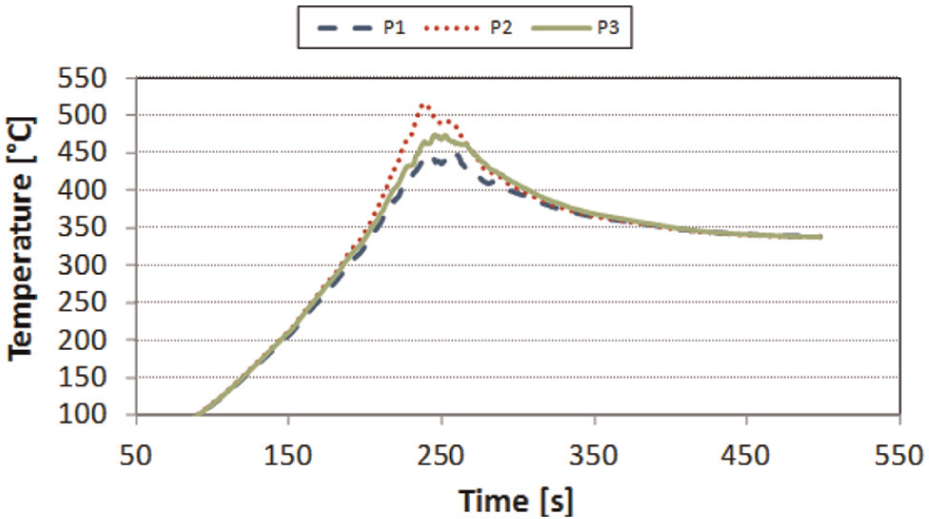
Thermal histories for points P1, P2 and P3 as defined in Figure 13—M case study.
Finally, in order to relate the thermal histories of each measurement locus to the microstructural evolution occurring in that area, bar charts have been built clustering proper temperature ranges. In this way, it was possible to identify the time length during which each area of the transverse section of the joints experienced temperature values in a given range. In Figure 17, the bar charts obtained as described above are shown for two points lying at the advancing side of the joint, at a distance of 2 mm from the welding line and 2.5 and 0.5 mm from the bottom of the skin, respectively.
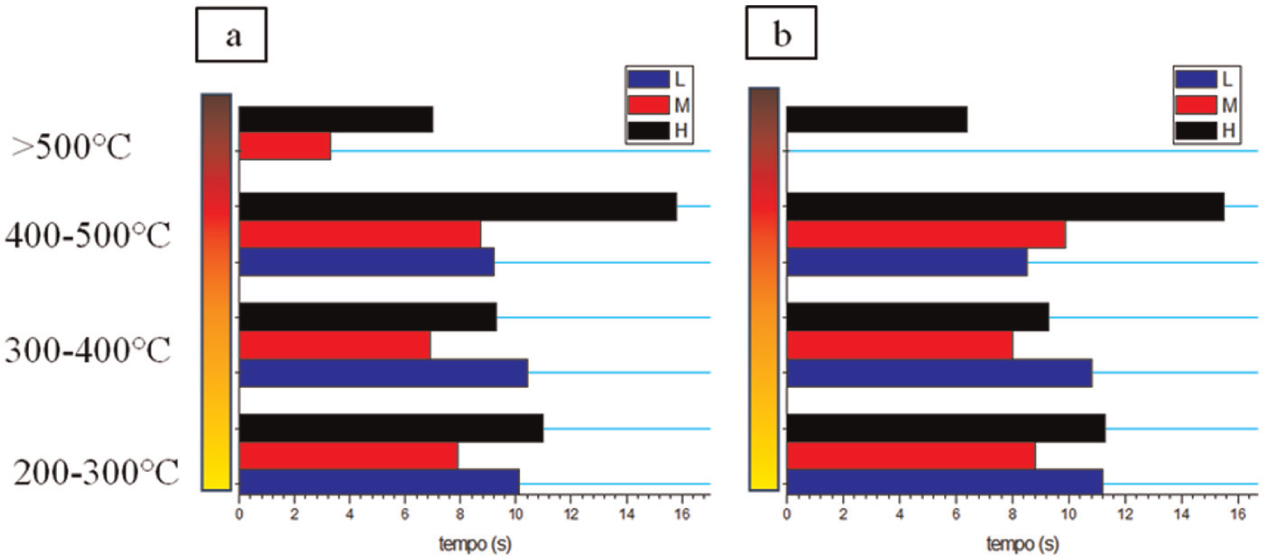
Temperature ranges and times for two points located in the advancing side at 2 mm from the welding line. The distances from the bottom of the skin are (a) 2.5 and (b) 0.5 mm.
The largest temperatures values, over 500 °C, are observed only for the M and L case studies. As far as lower temperature ranges are taken into account, the corresponding times assume more similar values at the varying of the conferred STC. The predicted temperature profiles and histories have been used to explain, from the microstructural point of view, the mechanical performances of the joints.
Figure 18(a)–(c) shows hardness profiles measured according to the scheme in Figure 3, while Figure 18(d) and (e) illustrates the average hardness of each joint in the 7075-T6 and 2024-T4 regions. Each hardness curve shows a maximum at the center of the joint for the top and bottom parts of the welded joint (7075-T6 stringer and 2024-T4 skin, respectively). In the top part (Figure 18(d)), the highest values of hardness are always lower or comparable to BM, and the gap decreases by reducing heat input (L joint). Moreover, the minimum hardness values at the top increase by reducing the heat input. The hardness curve profiles at the top may be explained by considering the evolution of 7075-T6 at high temperatures. In fact, the higher temperature reached in the H case study leads to significant hardness decrease due to (1) dissolution of fine precipitates created during T6 heat treatment in BM (Figure 11(a)) and (2) growth and coarsening of precipitates (Figure 11(b)) during welding. Even if precipitation occurs during cooling, these precipitates strengthen the matrix less than peak aged precipitates. The precipitate evolution toward overaging in T6 is the main reason of hardness variation in FSW joints.
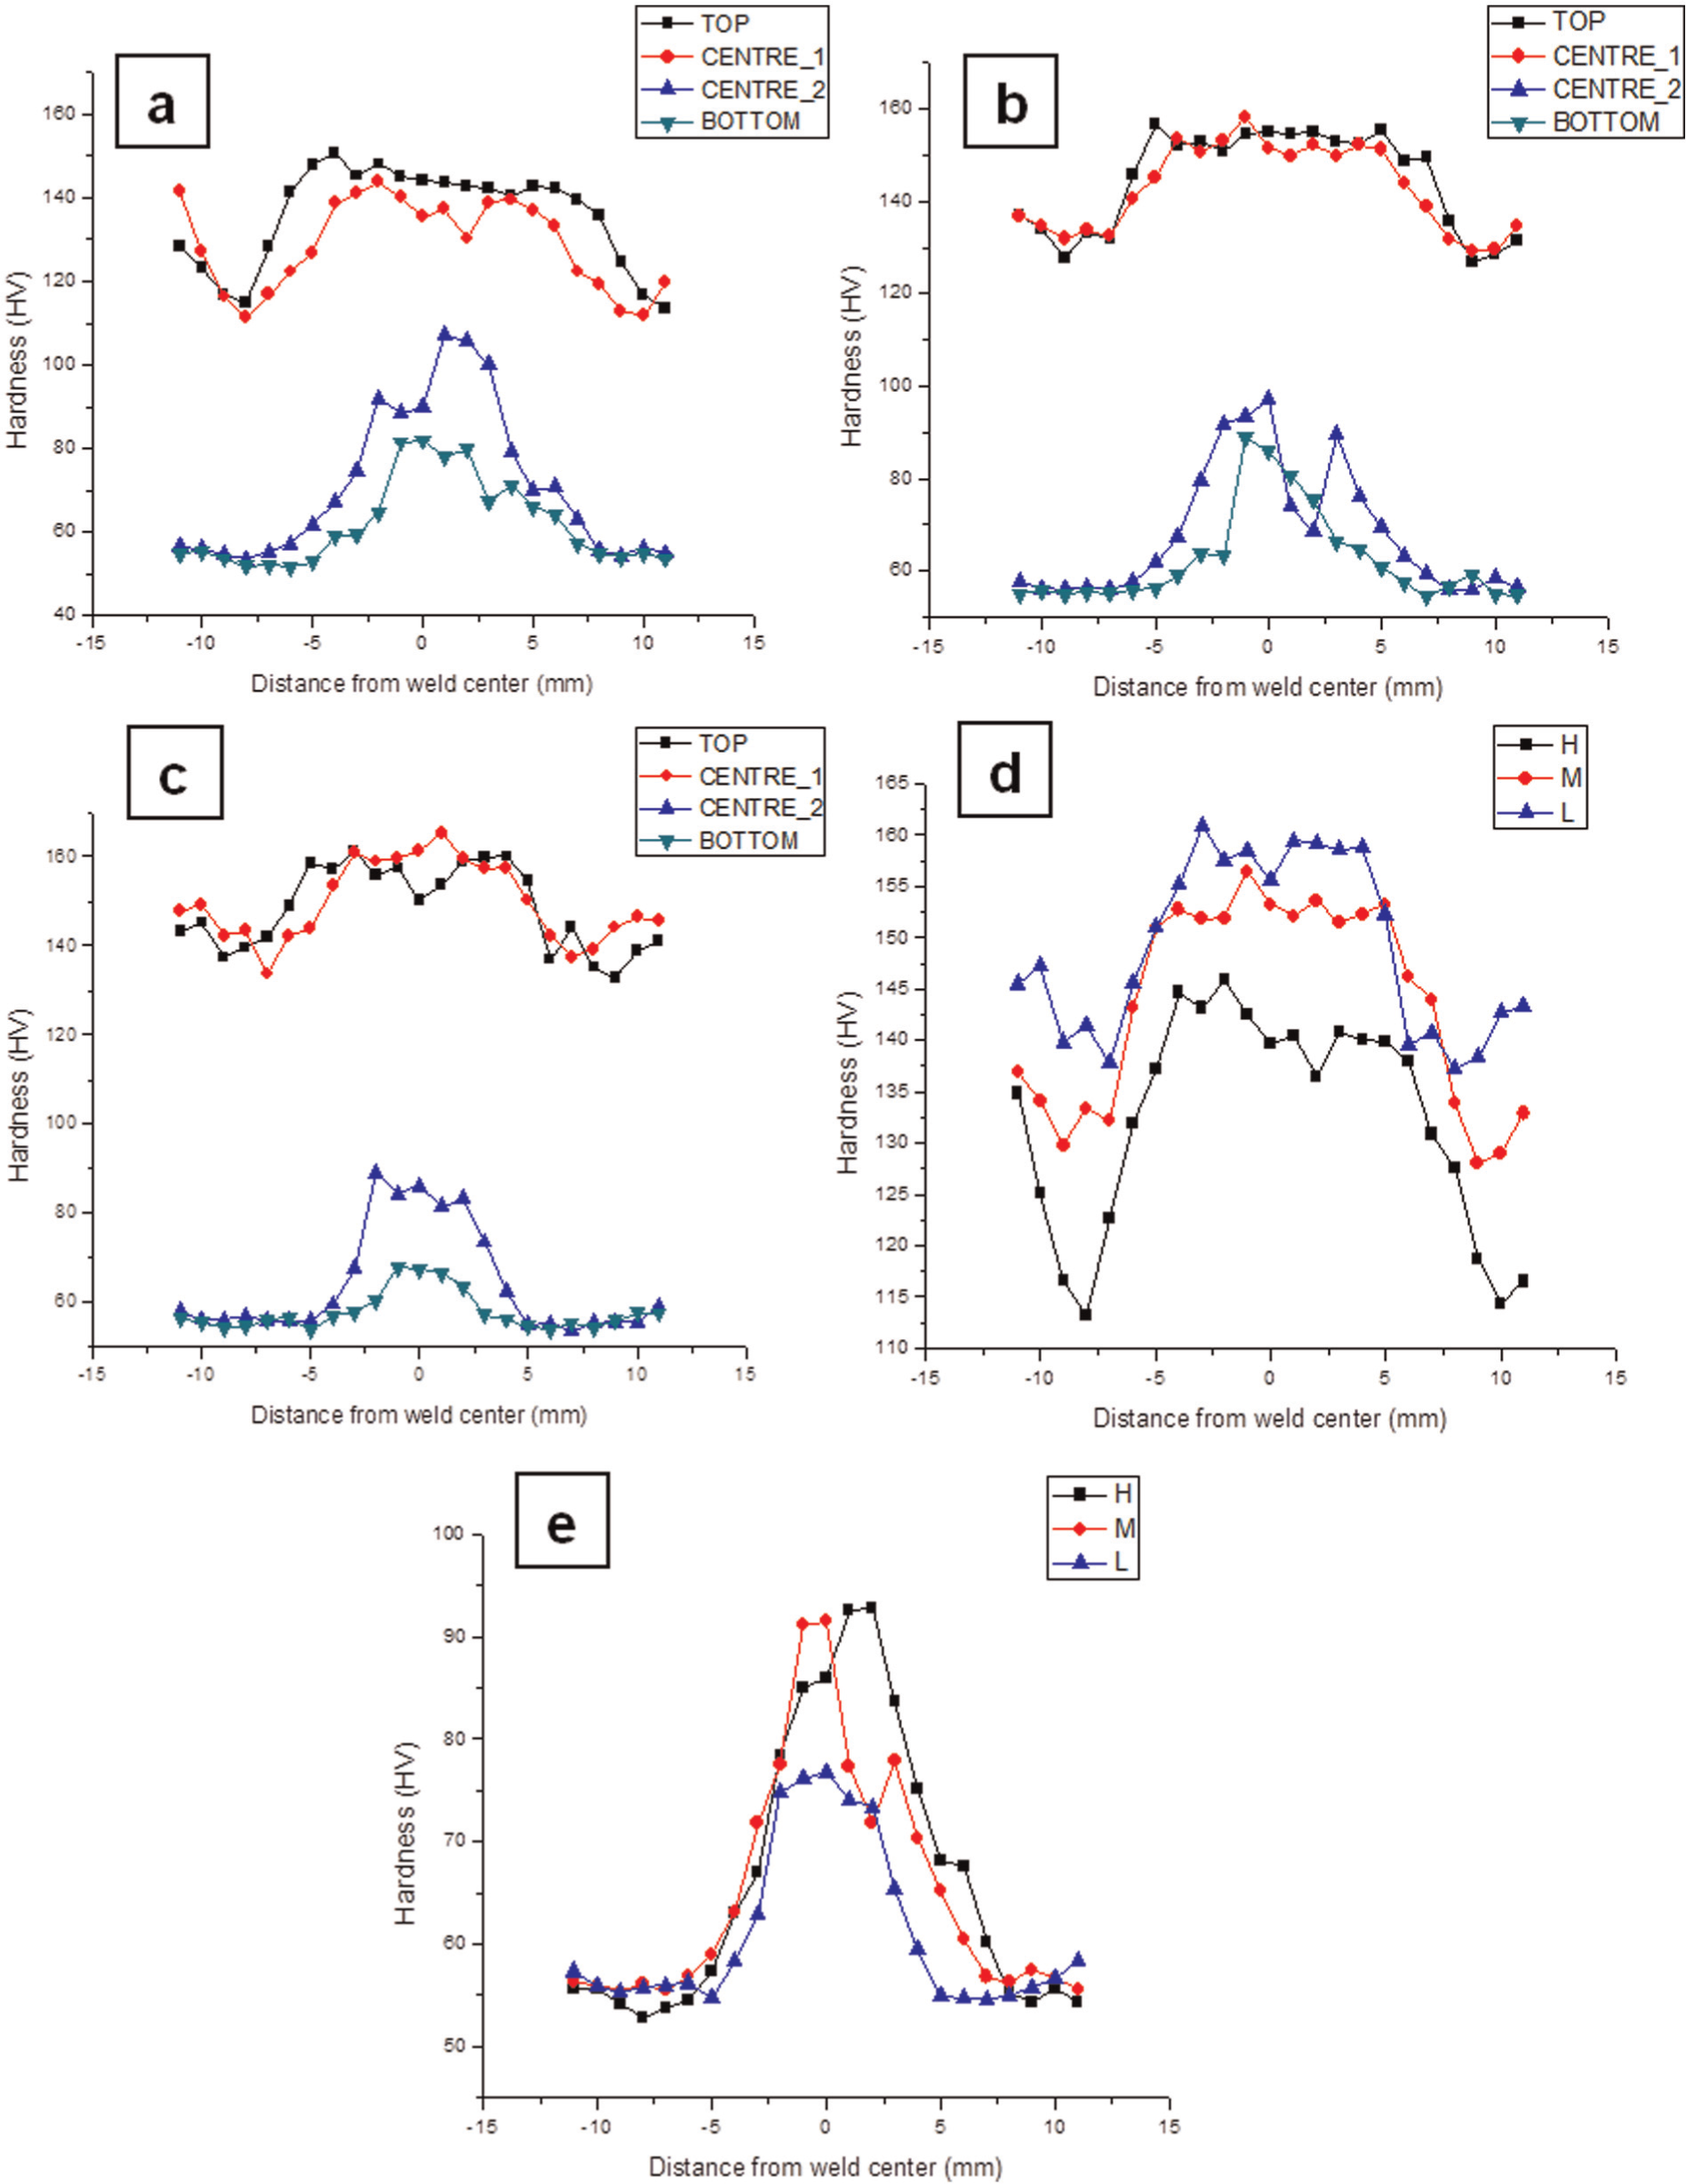
Hardness profiles as in the transverse sections according to Figure 3 for (a) H case study, (b) M case study and (c) L case study and average hardness at the (d) top and (e) bottom of the joints.
In the bottom part of the joint (Figure 18(a)–(c)), minimum hardness values are always higher or comparable to BM ones. This behavior may be explained observing that exposure to high-temperature levels during FSW process implies dissolution of existing GP precipitates (not effective strengtheners), and Al-Cu particles (Figure 12(a) and (b)), and an increase of atoms in solid solution. Moreover, some Al2CuMg particles enlarge becoming more effective than preexisting GP zones (Figure 12(b)).
For short time at 250 °C, the 2024-T4 skin (see Figure 13(b)) exhibits a slight hardness increase. A high heat input may increase GP zone dissolution and the enlargement of hardening particles resulting in additional strengthening. This may explain the decrease in hardness observed for the H and L cases studied (Figure 18(e)).
The hardness values in the welded area are affected both by thermal history and microstructure induced by the welding process. Recrystallized grains and substructures influence the kinetic of precipitation and coarsening in both skin and stringer. These phenomena lead either to increasing (skin) or decreasing (stringer) in hardness observed with STC with respect to the effect of static aging on BM (Figure 13).
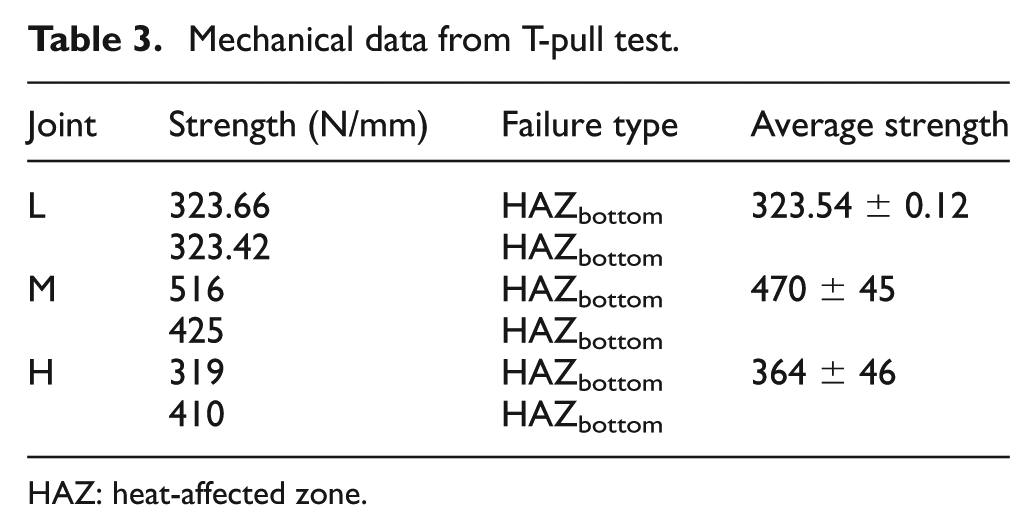
The results of T-pull tension tests are illustrated in Table 3. The strength of the joints was measured as force per unit of weld length in order to compare the performances of the different welds. The mechanical results show that the M joint exhibits the maximum strength followed by H and L joints. For all the tests, the region of failure of the joints was the lower HAZ. The latter result is in agreement with the hardness tests showing that the bottom part of the joint is the most critical part (Figure 18).
Mechanical data from T-pull test.
HAZ: heat-affected zone.
Conclusion
In this article, an experimental and numerical analysis was performed on typical aeronautical skin and stringer joints made out of AA2024-T4 and AA7075-T6, respectively. On the basis of the obtained results, the main conclusions are reported in the following list:
2024-T4 BM is characterized by coarse Al2CuMg and Al7Cu2Fe and by small Al2Cu particles undissolved by solution heat treatment. 7075-T6 BM contains Al2CuMg and Al7Cu2Fe particles. Moreover, small Zn/Mg and Mg/Si particles have been identified.
Heat treatments at 250 °C and 450 °C (temperature range typically measured during FSW) on 2024-T4 and 7075-T6 BM have shown that 7075-T6 is more sensitive to high-temperature exposure leading to a decrease in hardness. 2024-T4 is more sensitive to lower temperatures (250 °C) leading to slight hardness increase.
FSW results in coarsening of Zn/Mg particles in the 7075-T6 stringer, dissolution of smaller Al2Cu particles and enlargement of AlCuMg particles in the 2024-T4 skin.
Hardness curves in the welded area show a maximum at the center of the joint for 7075-T6 and 2024-T4 elements. The largest values of hardness in the 7075-T6 stringer are lower or comparable to those of BM. The coarsening of Zn/Mg particles (enhanced by recrystallized grain and substructure induced by the welding) softens the T6 starting microstructure leading to decrease in hardness with increase in temperature of welding. The lowest values of hardness in the 2024-T4 skin of joint are larger than those of BM due to dissolution of GP zone/Al2Cu smaller particles (not effective strengtheners) and enlargement of more hardening Al2CuMg particles with respect to T4 starting state. As thermal contribution increases, the hardness of skin element increases as well.
Footnotes
Declaration of conflicting interests
The authors declare that there is no conflict of interest.
Funding
This research received no specific grant from any funding agency in the public, commercial or not-for-profit sectors.