
Abstract
This article investigates the influence of welding heat input on the microstructure, hardness, ultimate tensile strength and toughness of submerged arc welding of plain carbon steel. An attempt was also made to find an optimal welding heat input conditions using Fuzzy logic–based multiobjective threshold acceptance algorithm. Phase analysis of weldments was evaluated at different welding conditions varying from 7.806 to 17.955 kJ/cm. Results revealed that the percentage of ferrite increases with the heat but pearlite percentage decreases and significant grain coarsening was observed in weld zone. Mechanical properties of the weld joints decrease with the increase of heat input. Fuzzy interference system has been adopted to solve the multiobjective problem to avoid the imprecision and uncertainty in weights of the responses. Threshold acceptance method has been introduced for finding optimal welding heat input condition. Finally, a confirmatory test was carried out using the optimal result to verify the effectiveness of this approach.
Keywords
Introduction
Submerged arc welding (SAW) process is widely used in the nuclear plant, power generation, shipbuilding, offshore and construction industries due to its inherent advantages of deep penetration, smooth bead, superior quality and high efficiency.1,2 It is well known that high efficiency and high quality are the developing targets of welding technology. The quality of a weld joint is directly influenced by the welding heat input, that is, related to current, voltage and traverse speed during welding, and the joint quality can be defined in terms of properties like weld-bead geometry, mechanical properties and distortion.3,4
The microstructural and mechanical behaviors of the weld joint generally depend on the thermal history and chemical composition of base material. During solidification of the weld metal in low-carbon steel, cellular dendritic structure of cast metal consisting of both coarse columnar austenite grain and a fine cellular network within the grains is formed.5,6 The above microstructure then transforms to ferrite depending upon the rate of cooling of weld metal. Rasanen and Tenkula 7 report that the transformation product of weld metal depends on the rate of cooling of the weld metal. The above transformation products are also dependent upon the austenite grain size, impurities and alloying elements. Prasad and Dwivedi 8 studied the microstructural and mechanical characteristics of submerged arc welded high-strength low-alloy steel joints at different heat inputs. It was found that hardness decreases with the increase of heat input, and toughness shows a mixed trend, first increases and then decreases. Kumar et al. 9 investigated the influence of SAW input variables using Taguchi design of experiment (DOE) and found that welding current and type of flux were the most significant factors effecting microhardness and microstructural properties. Gunaraj and Murugan 10 investigated that response surface methodology (RSM) is a powerful technique to develop mathematical models to correlate parameters, namely, the open-circuit voltage, wire feed rate, welding speed and nozzle-to-plate distance to some responses, namely, the penetration, reinforcement, width and percentage dilution of the weld bead in SAW of pipes.
To consistently produce high-quality welding, various optimization techniques can be applied to define the desired output variables through developing different mathematical models between process parameters and response parameters. Taguchi method is a powerful DOEs, which is a simple, efficient and systematic approach for optimizing joint quality, performance and cost. 11 Datta et al. 12 applied Taguchi technique for process parametric optimization of bead geometry and width of heat-affected zone (HAZ) in SAW using a mixture of fresh flux and fused flux. Tarng et al. 13 applied grey-based Taguchi method for solving multicriterion optimization problem in SAW process in hardfacing. An orthogonal array, the signal-to-noise (SN) ratio, multiresponse performance index (MRPI) and analysis of variance (ANOVA) were employed to study the performance characteristics in the SAW process. Lee and Rhee 14 revealed that the multiple regression analysis (MRA) can be used to predict the process parameters of gas metal arc welding, but this is limited in application due to difficulties in modeling, time-consuming and cumbersome. Kim et al. 15 have used genetic algorithm (GA) and RSM to determine the optimal welding conditions in gas metal arc welding (GMAW) process, and the base metal was mild steel with a thickness of 5.8 mm. Correia et al. 16 described a comparison between GA and RSM in the optimization of the GMAW process in welding of 9.5-mm-thick mild steel with a square-groove butt joint. They also established that GA is a powerful tool for optimization, especially in irregular experimental regions because there is no need to generate models.
The fuzzy logic was first initiated by Zadeh, 17 which was very useful for dealing with uncertain and vague information. Using fuzzy reasoning, optimization of complicated multiple performance characteristics can be transformed into the optimization of a single MRPI. 18 Lu and Antony 19 offered the application of fuzzy rule–based reasoning and SN ratios for the optimization of multiple characteristics. The aim is to combine multiple SN ratios into a single performance index output, in which the optimum level setting of process variables could be found by maximizing MRPI. Dueck and Scheuer 20 first introduced threshold acceptance (TA) method, which is almost similar to classical simulated annealing (SA) algorithm. The main advantages of TA are its conceptual simplicity and its excellent performance on different combinatorial optimization problems. TA uses a simpler acceptance criterion for new solutions and does not require the generation of random numbers and exponential functions. 21 Tarantilis et al., 22 proposed the list-based threshold accepting (LBTA) method for the solution of job-shop scheduling problems that uses a list of threshold values, which was adapted as the solution proceeds.
The present work proposed an algorithm to determine the optimal welding conditions of SAW process using a Fuzzy logic–based TA algorithm, which aims at developing better microstructural and mechanical performance of weld joint. In the present investigation, welding heat input was considered as process variable, and the response parameters were hardness (H), ultimate tensile strength (UTS) and toughness (Tg).
Welding procedure
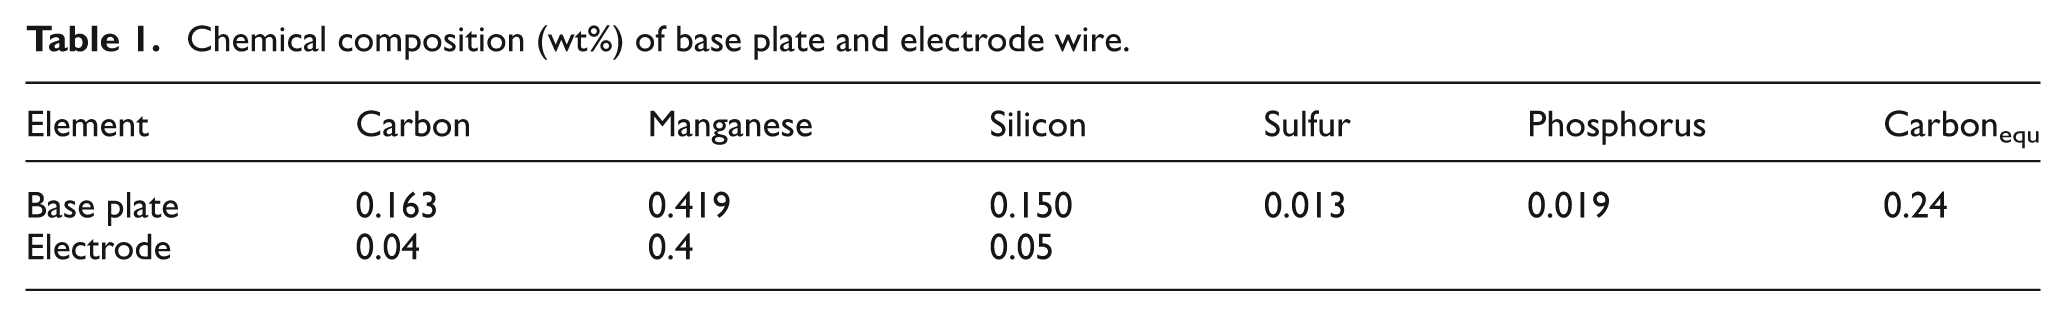
The goals of the present work are: (1) study the effects of welding heat input on the microstructure and mechanical properties, and (2) to find optimum heat input conditions that maximize the mechanical performance of the welded joint. The bead-on-plate welding technique was used to perform the experiments on a SAW machine (MAESTRO 1200 (F); Ador Welding Ltd, India). A 10-mm-thick mild steel (AISI 1015) plate was used for this study. The chemical composition (wt%) of base plate and electrode wire is shown in Table 1. Electrode wire of 3.15 mm diameter (AWS A/S 5.17: EH 14) coated with copper has been used. A fused-type silicon product with grain size 0.2–1.6 mm with basicity index of 1.6 flux (AUTOMELT A55) was used for welding steel having chemical composition of SiO2+ TiO2 = 30%, CaO + MgO = 10%, Al2O3+ MnO = 45% and CaF2 = 15%.
Chemical composition (wt%) of base plate and electrode wire.
Microstructure of weld metal
Once welding was completed, test plates were visually inspected for detection of any defect or irregularity of weldment. Different welded specimens for testing were cut transverse to the welding direction width of about 12–15 mm by automatic hydraulic power saw. For metallographic study, the welded specimens were polished by using different grades of emery papers followed by standard metallographic procedure. Polished specimens were etched with a mixture of 2% natal solution to reveal the various zones of weld zone (WZ) and HAZ. Quantitative metallography was carried out using an optical microscope (Leica DMI 3000M) attached with an image analyzing software. Figure 1 illustrates the optical micrographs of WZ at different heat input conditions.
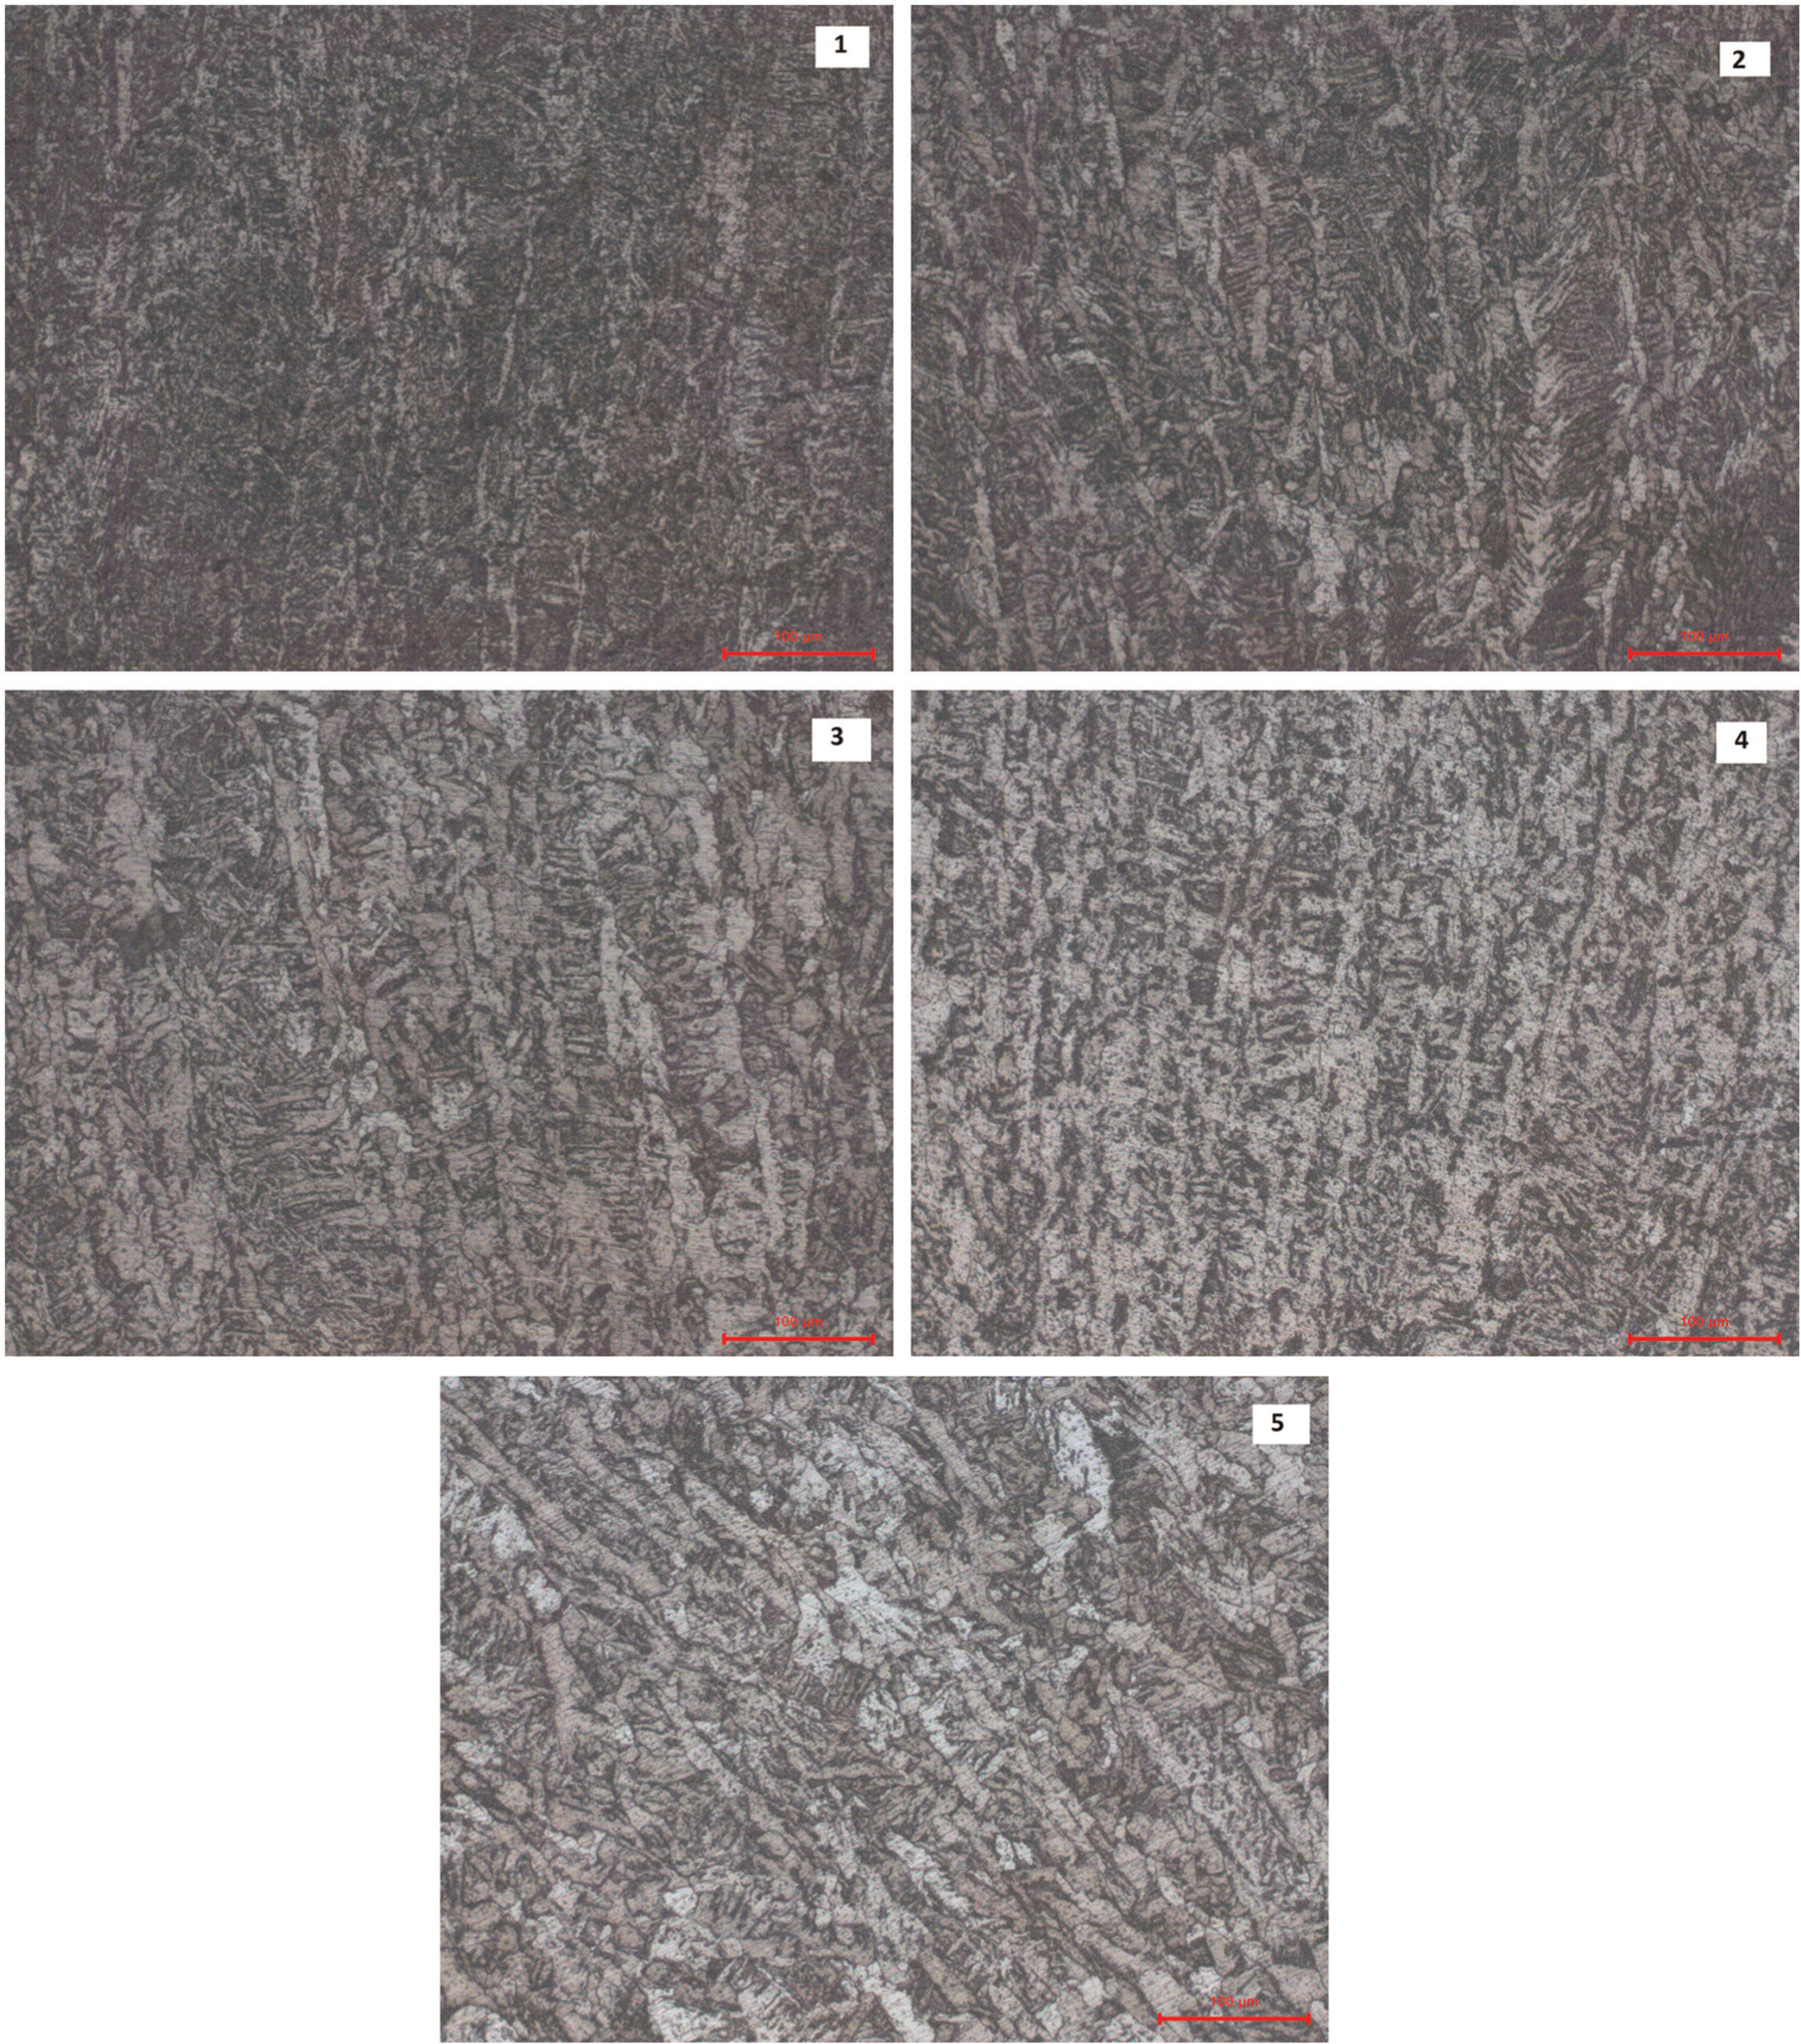
Micrographs of WZ at different welding heat input conditions.
Mechanical test
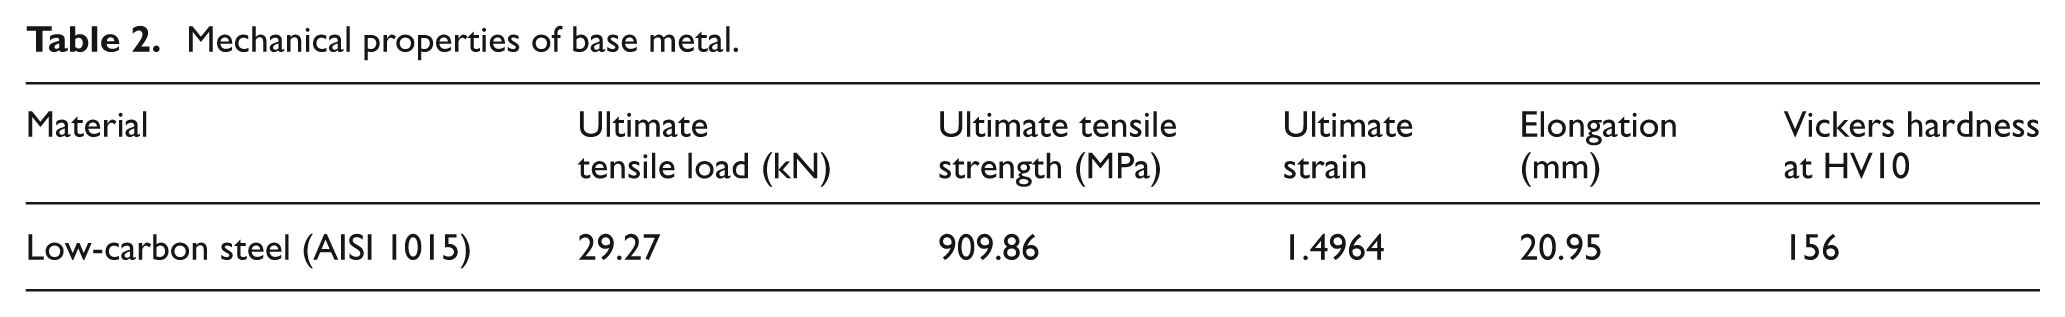
In the present investigation, hardness of weldment, ultimate tensile strength and toughness tests have been carried out for all the welding conditions. Hardness of the welded zone was tested at constant load of 10 kg in semi-Vickers hardness tester machine. The tensile specimen was prepared as per ASTM E8 standards and tested in a hydraulically controlled universal testing machine of 600 kN. Charpy V-notch impact test was carried out to find the relative toughness of welded joints at room temperature (30 °C) in digital impact testing machine as per ASTM E23. Mechanical properties of base metal are shown in Table 2.
Mechanical properties of base metal.
Results and discussions
Welding parameter
A series of welding has been done by using a range of heat inputs from 7.806 to 17.955 kJ/cm at varying wire feed rate levels from 105 to 210 mm/min and welding speed levels from 0.75 to 1.2 m/min. There is no additional arrangement to vary the current. It changes with respect to wire feed rate. Using trial and error method, heat input was fixed for defectless welding. The welding heat input was calculated from the following equation
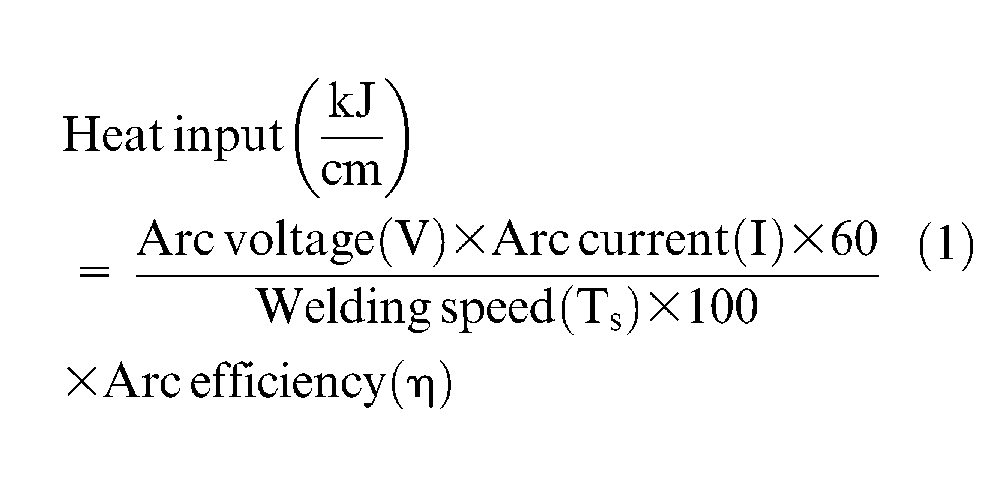
Arc efficiency for SAW is taken as 0.95. 4
Results obtained from the experiment as discussed above are shown in Table 3. For each condition, three trials have been laid down, and the average value was taken for analysis.
Experimental values of the mechanical performance tests at different welding heat inputs.
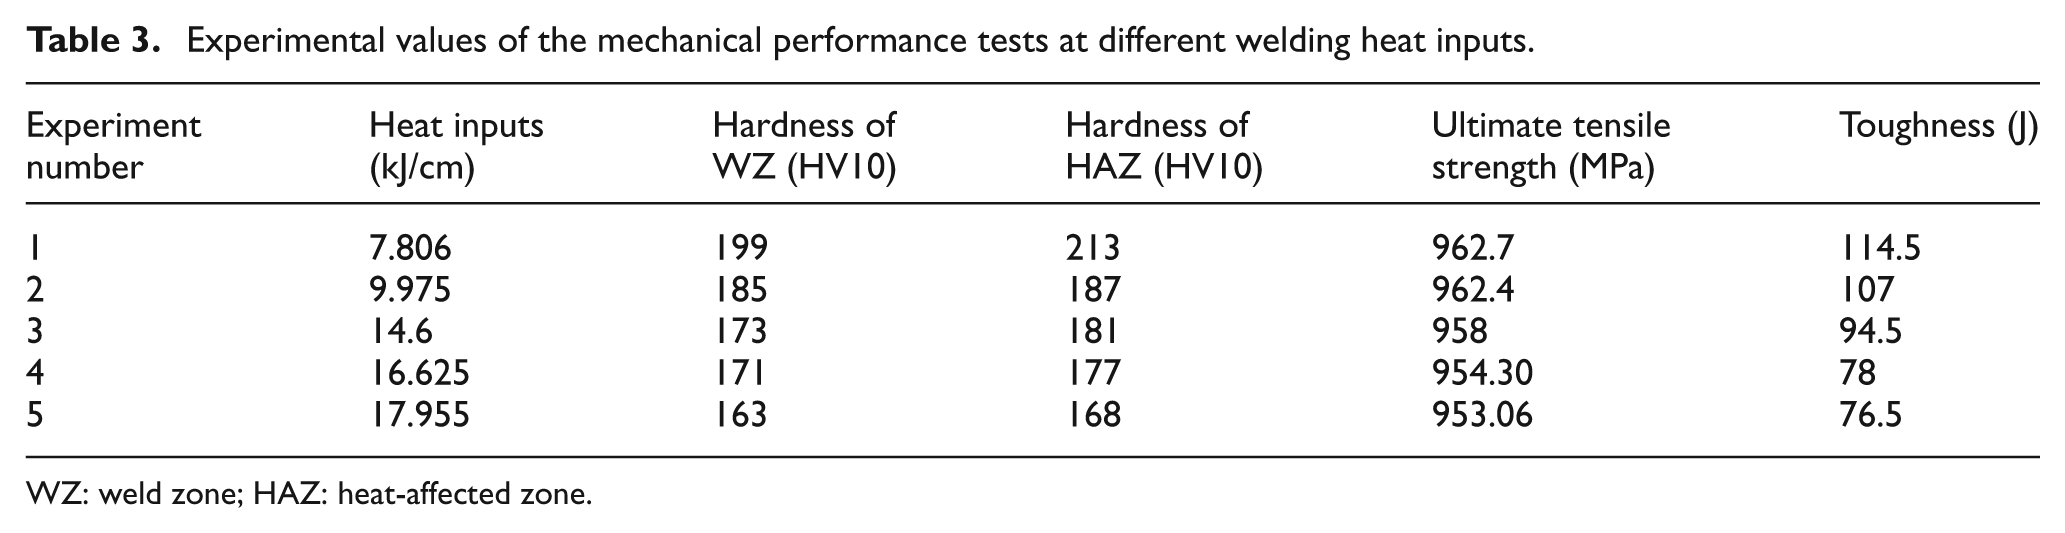
WZ: weld zone; HAZ: heat-affected zone.
Computational procedure to establish correlations
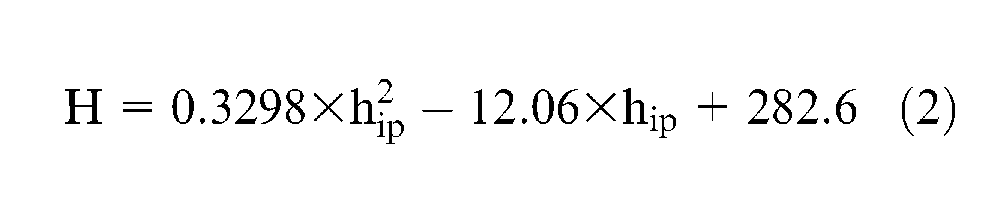
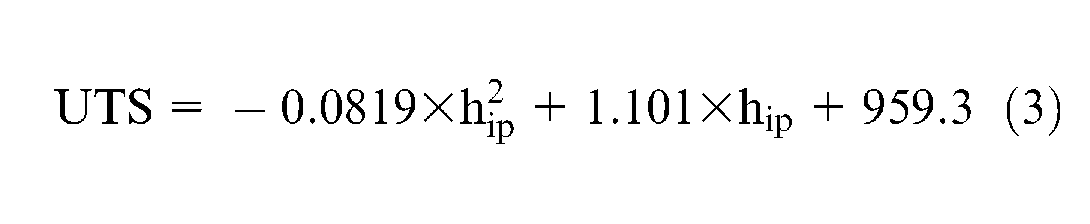
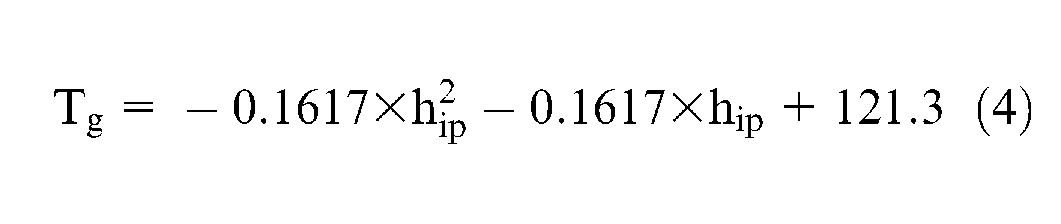
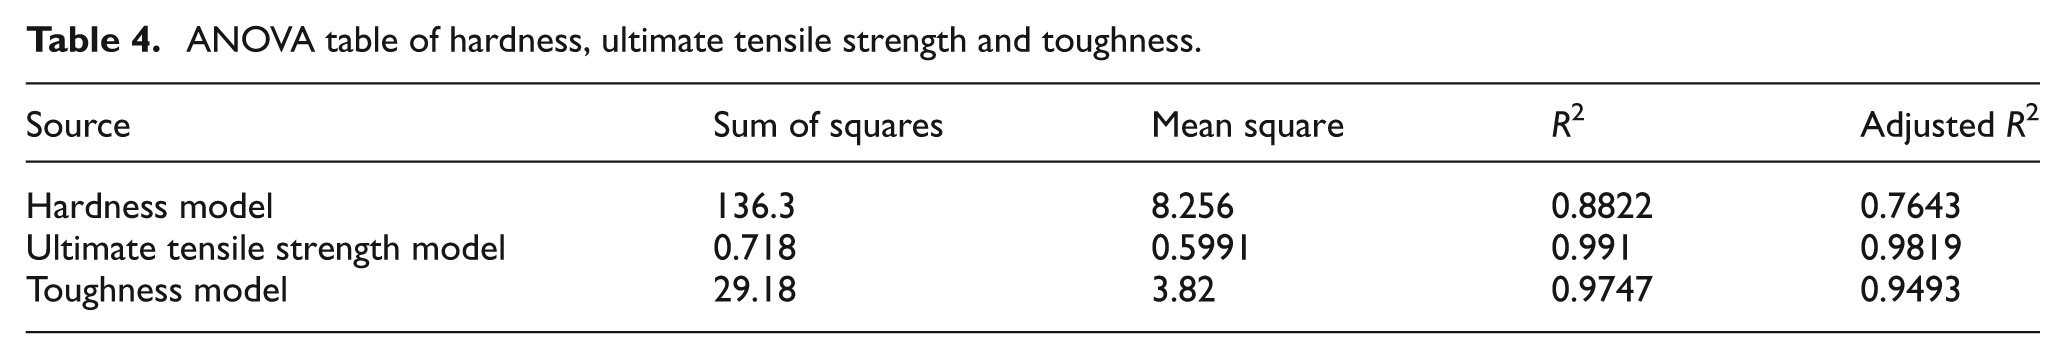
The statistical method MRA was used to develop the mathematical models using experimental data listed in Table 3. Hardness of HAZ was considered for optimization of welded joint performance because maximum hardness was found in HAZ. In this study, welding heat input was the independent parameter, and hardness, UTS and toughness were the dependent parameters. Regression equations of three responses are given below, and related ANOVA is given in Table 4
ANOVA table of hardness, ultimate tensile strength and toughness.
Effect of heat input on the hardness of weld metal
The microstructure of the weldment depends on the chemical composition of base metal as well as consumables and the thermal cycle (heating and cooling) of welding. Hardness measurements were taken at different regions of WZ and HAZ. It was observed that grain size of the weld metal increases with the increase of welding heat input. Optical micrographs of WZ of low-carbon steel generally show two phases, namely, ferrite (white) and pearlite (dark). 23 Percentage of ferrite and pearlite at different welding conditions is shown in Figure 2. This figure revealed that the percentage of ferrite increases with the increase of heat input, but percentage of pearlite shows a negative trend. Carbon diffusing is one of the main reasons for the changes. Nucleation of pearlite was reduced due to supercooling at a high temperature and lead to the formation of ferrite. 24 There would be a higher tendency for the nucleation of ferrites from the grain boundaries probably in the form of Widmanstätten ferrite.
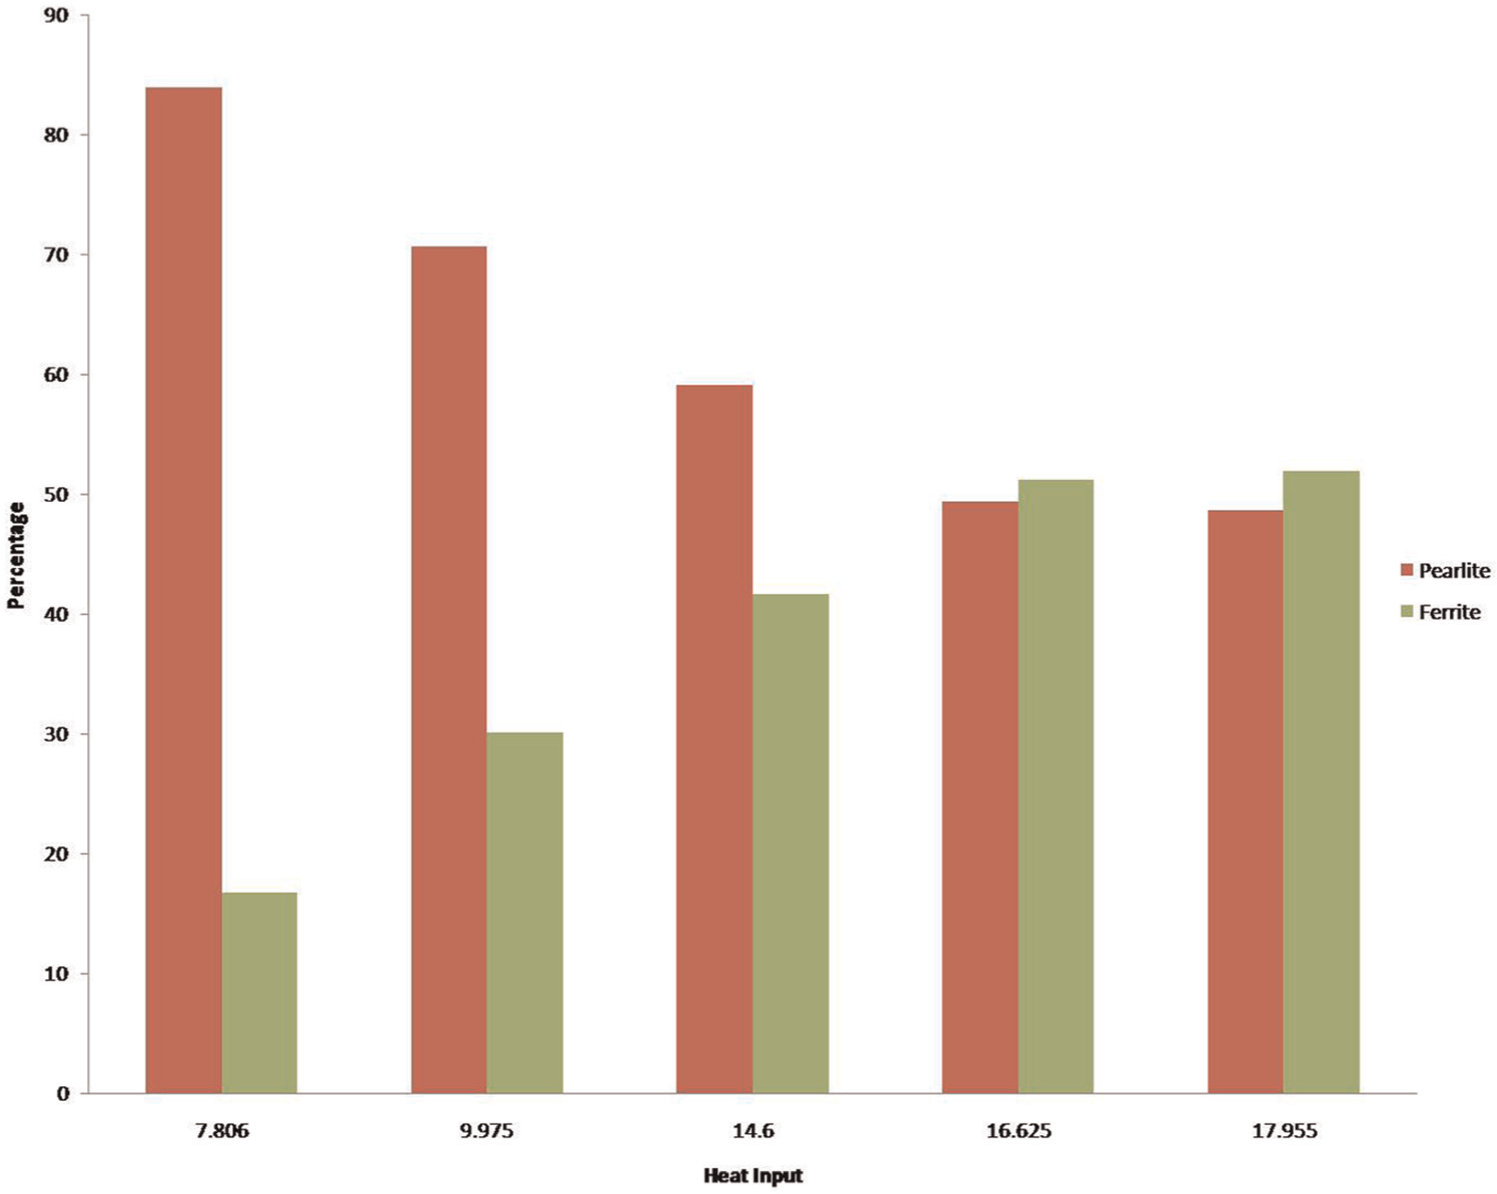
Percentage of pearlite and ferrite at different heat inputs.
Figure 3 shows the influence of heat inputs on the hardness of WZ and HAZ at different conditions. From this figure, it was observed that the heat inputs have an inverse effect on the hardness of WZ as well as HAZ. This may be due to the fact that high heat input causes a slow cooling rate, which increases the coarsening of grain size and nucleation of soft phases. 8 Hardness of HAZ is higher than the WZ, and maximum hardness was found in coarse grain heat-affected zone (CGHAZ) which was adjacent to fusion boundary.
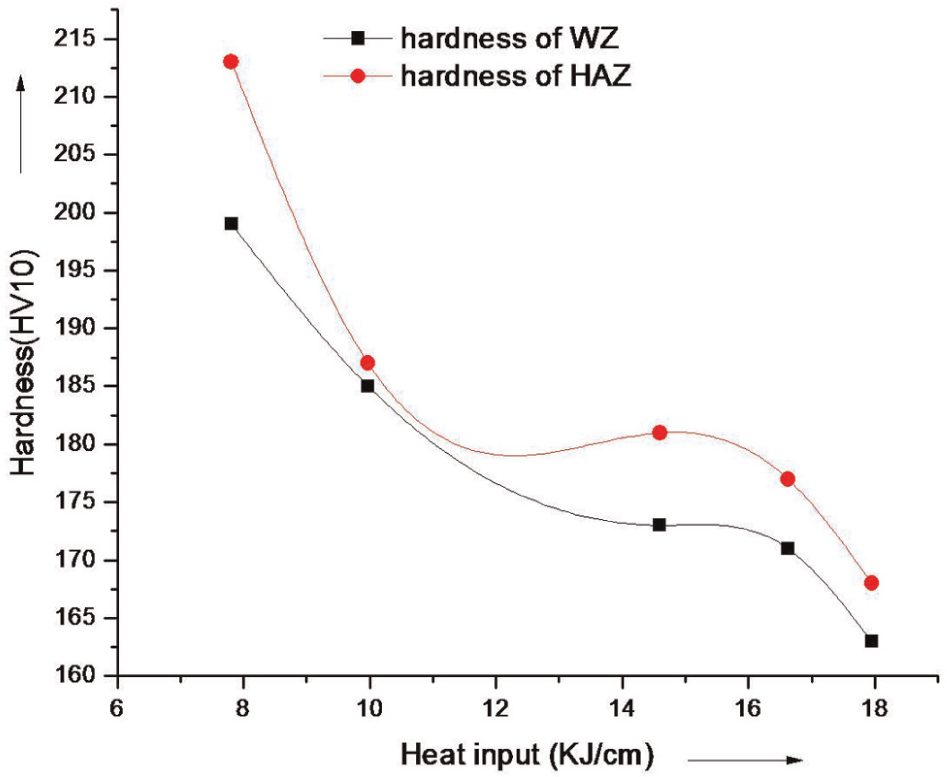
Hardness at different heat inputs.
Effect of heat input on the UTS of weldments
UTS testing was carried out on the welded specimen transversely to the welding direction. The UTS of weld metal was generally high when compared to the base material. 25 This is due to the presence of impurities and alloying elements in the weldment. Figure 4 illustrates that the UTS of the weld joints decreases with the heat input. The tensile strength of pearlite is higher than ferrite 23 which agrees to the decrease in UTS of the weldment due to higher ferrite nucleation than pearlite in weld metal as heat input increases. The inter-dendritic spacing and average dendrite length increase with the increase of heat input, which was another main reason for UTS reduction. 26
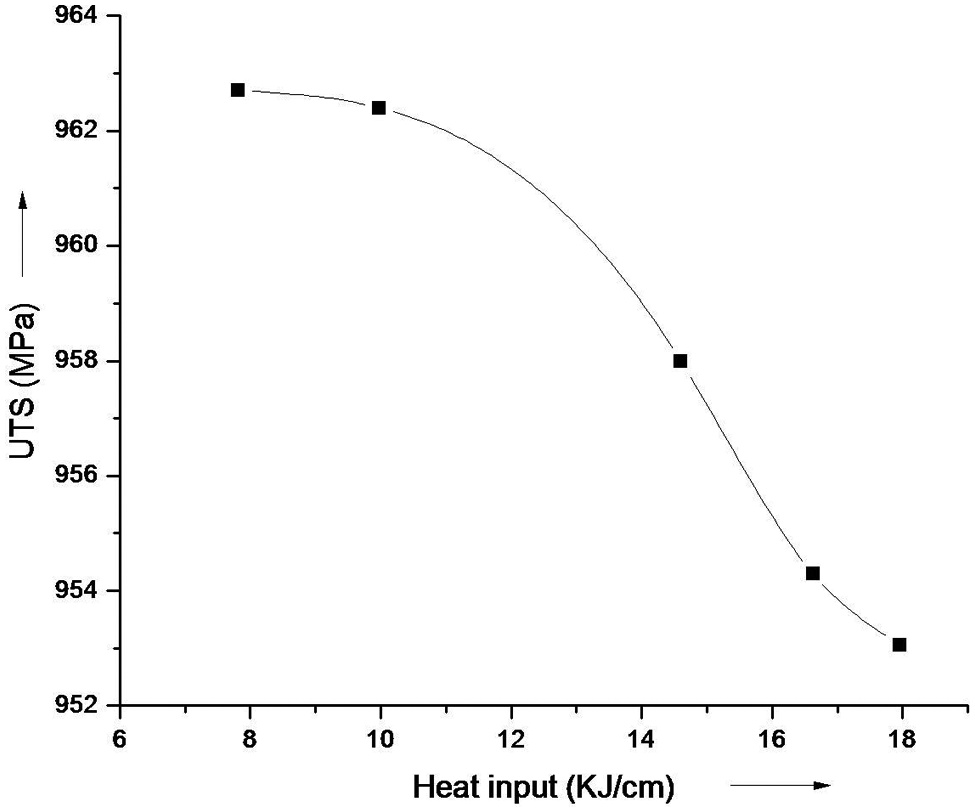
UTS at different heat inputs.
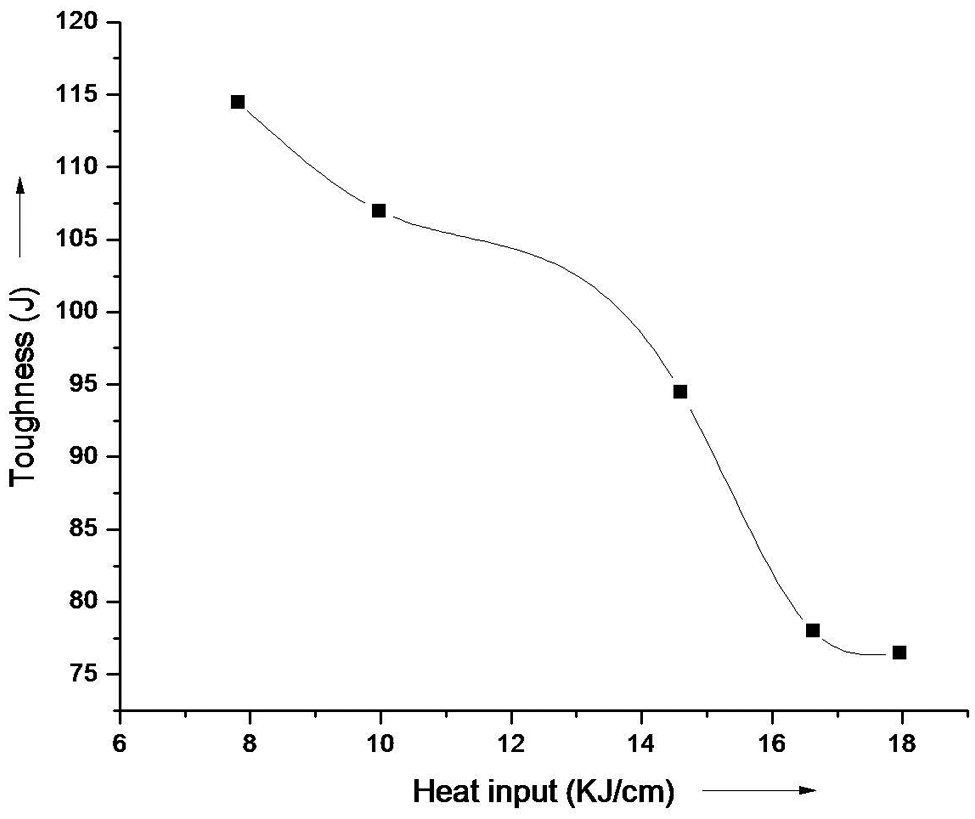
Effect of heat input on the toughness of weldments
Toughness of the weld joints was less than that of the base metal because of inhomogeneity of weld microstructure. 25 Charpy V-notch test was carried out to find the toughness of weld joint, which also decreases with the increase of heat input as shown in Figure 5. Toughness decreases with the increase of welding current at a given welding speed, and increase in dendrite fraction was also responsible. 27 Significant grain coarsening in weld metal also leads to decrease in the impact strength and increase in crack initiation and growth.
Toughness at different heat inputs.
Prediction of optimal mechanical properties of weldments
Fuzzy logic methods
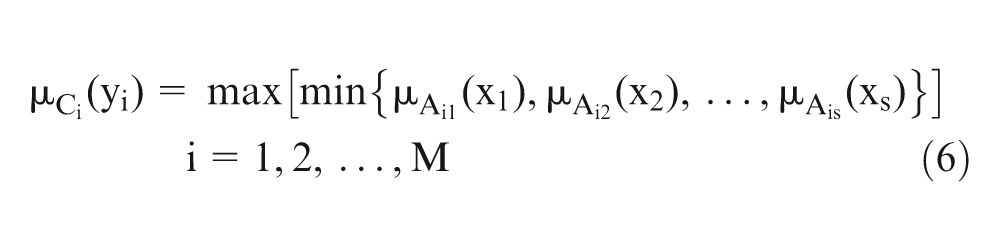
Fuzzy logic offers a powerful frame of reasoning as how human reasoning works. 17 It predicts the complex characteristics of the problem based on the concept of relative importance of precision of solutions. A fuzzy system consists of fuzzifier, inference engine, knowledge base (database and rule base) and defuzzifier. 28 The fuzzifier first uses membership functions to fuzzify the crisp inputs into fuzzy sets. Next, the inference engine performs a fuzzy reasoning on fuzzy rules to generate fuzzy values. Finally, the defuzzifier converts the fuzzy values into the crisp outputs (MRPI). The database defines the membership functions of the fuzzy sets used in the fuzzy rules, and the rule base contains fuzzy IF–THEN rules. In this study, the Mamdani implication method is employed for the fuzzy rule definition. 29 For a rule
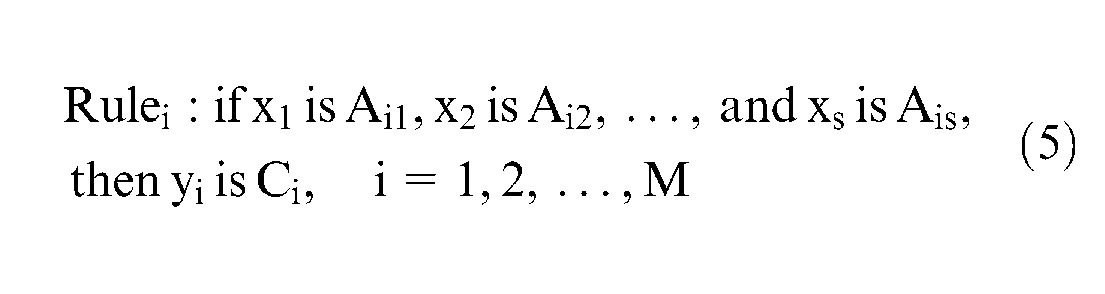
Here, M is the total number of fuzzy rules, xj (j = 1, 2,…, s) are the input variables, yi are the output variables and Aij and Ci are fuzzy sets modeled by membership functions
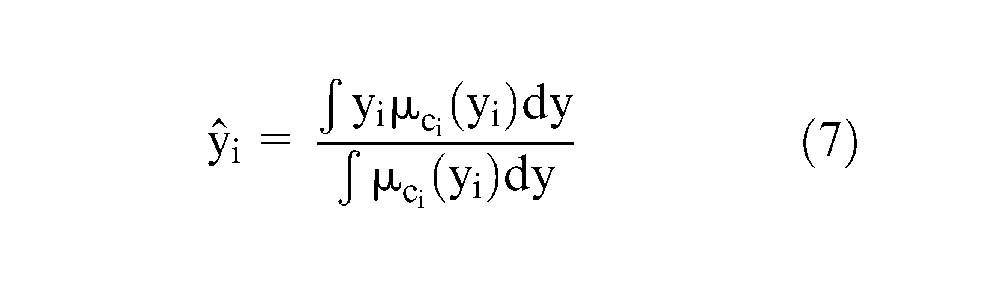
The defuzzification method is used to obtain the fuzzy values as one single crisp output value. The center of gravity method is adopted here for defuzzifying the fuzzy output functions. The centroid of the combined outputs,
The nonfuzzy value
TA algorithm
In recent years, much attention has been devoted to heuristic reasoning that is applicable in particular for solving combinational optimization problems. Dueck and Wirsching
30
compared TA method with the well-known SA method for discrete optimization. TA simplified the simulated annealing procedure by leaving out the probabilistic element in accepting worse solutions. TA introduced a deterministic threshold, and a worse solution was accepted if its difference to the current solution was smaller than or equal to the threshold. The key components of TA are the function that determines the lowering of the threshold during the course of the procedure, stopping criteria and the methods used to create initial and neighboring solutions.
31
Assuming that X* is the set of all feasible solutions of the problem, TA starts with an element x0∈ X*, which may be randomly chosen. Then, the method proceeds in an iterative manner. In each iteration, the algorithm decides whether the current solution xc will be replaced by a new one xn. The new candidate was chosen (by use of local search moves) as a small perturbation of the current solution or—speaking in mathematical terms—in a given neighborhood of the current solution xc. The threshold is decreased if the conditions of lowering the threshold are reached such as there is a long time without improvement in the solution. The stopping rule controls when the procedure will be stopped such as the threshold equals to 0. The value of the objective function was calculated for the new candidate, and the results are compared:
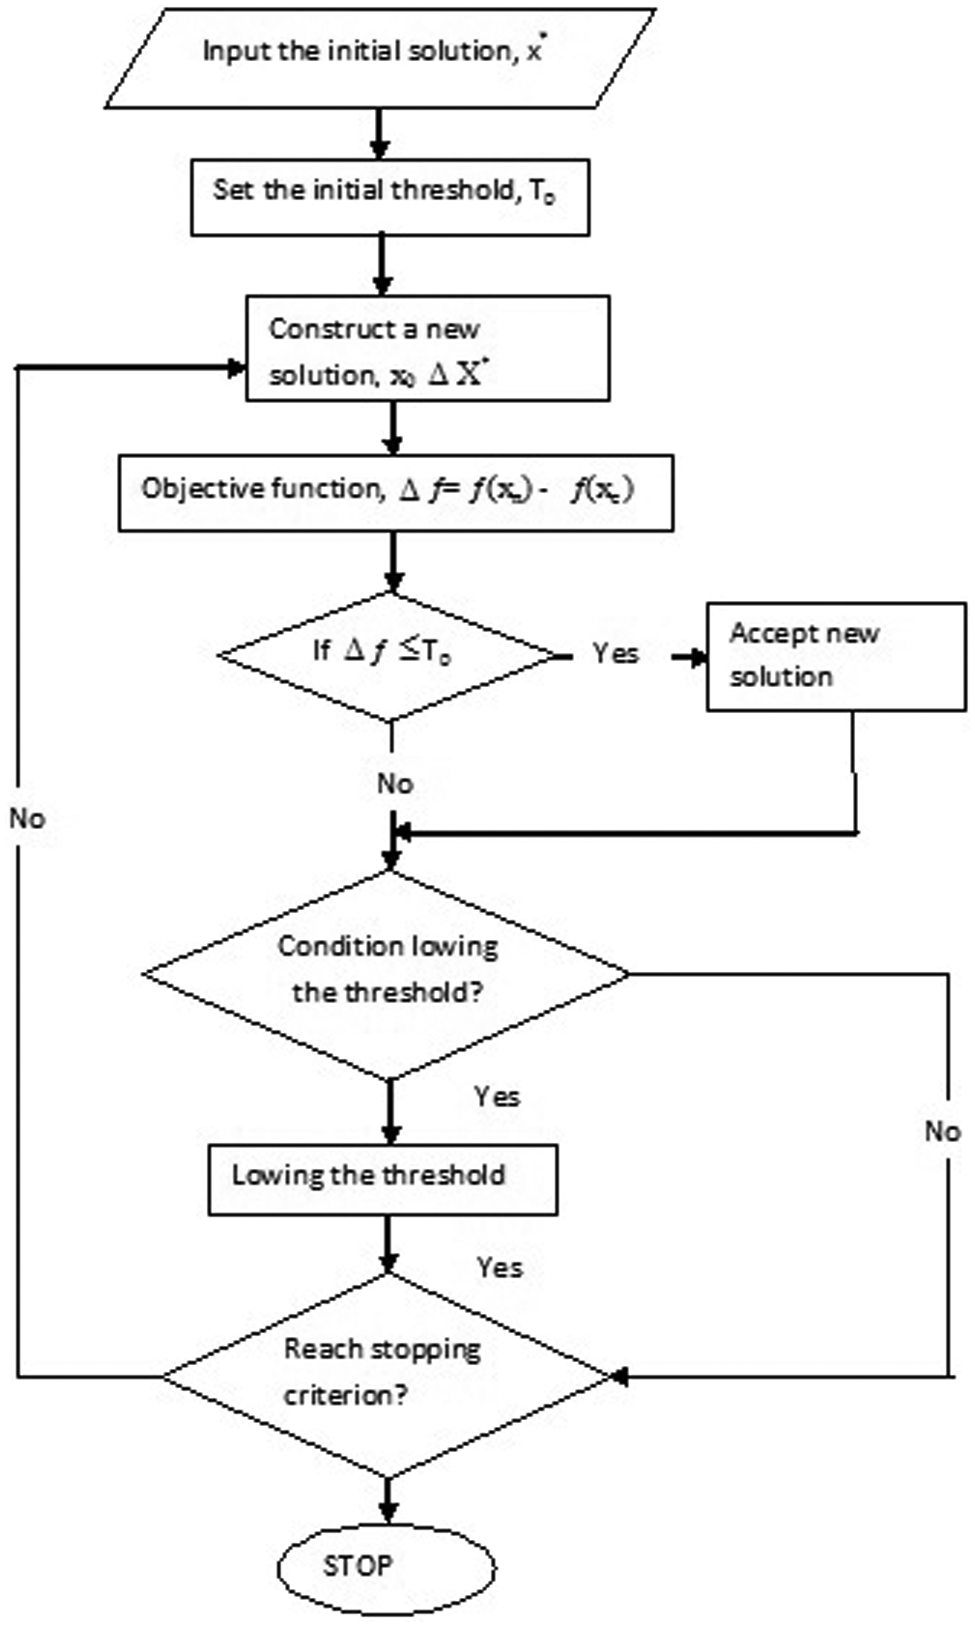
Flowchart of TA algorithm.
Proposed methodology
Experimental results of individual mechanical properties at different welding heat input conditions are shown in Table 4. To avoid the influences of the units, individual characteristics were first normalized ranging from 0 to 1; a higher-the-better (HB) criterion has been chosen for UTS and toughness, whereas a lower-the-better (LB) criterion has been chosen for hardness. The selection of criterion was based on the functional requirements of the weld joint when subjected to application field. The UTS and toughness of the weldment should be maximized, and hardness of weld metal should be close to base metal, therefore minimization was chosen.
The objective function is to maximize the joint strength in terms of hardness, UTS and toughness, therefore MRPI HB criterion has been used. Fuzzy interference system has been proposed to convert multiobjective to single-objective MRPI. Figure 7 represents the graph of the fuzzy reasoning process for three-input and one-output variable that uses triangular-shaped membership functions.
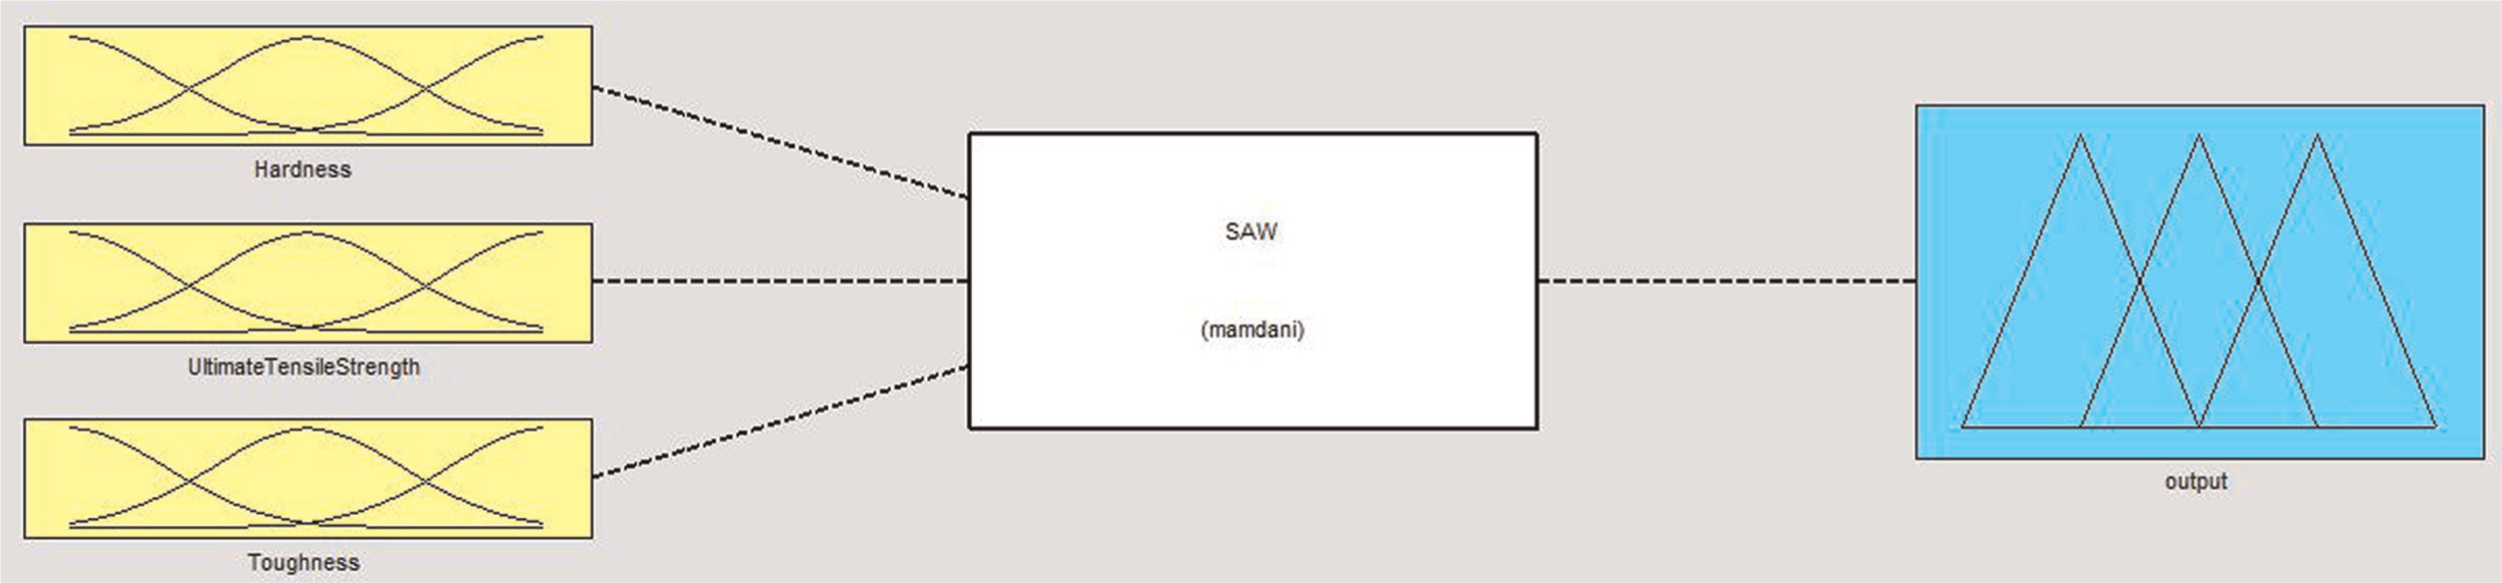
Structure of three-input and one-output fuzzy logic model.
The membership functions used in fuzzy model for the individual quality characteristics and output MRPI are shown in Figures 8 and 9, respectively. Five fuzzy rules have been assigned for MRPI: very small (VS), small (S), medium (M), large (L) and very large (VL).32,33 The 27 numbers of possible fuzzy sets are used for this experimental controller shown in Figure 10. After the fuzzification of crisp input parameters into suitable linguistic values using the fuzzy rules along with Mamdani inference, the fuzzy linguistic values and their membership values for the output MRPI can be obtained. Then, the center of gravity method (equation (7)) is used for defuzzification of the crisp output as the final MRPI value.
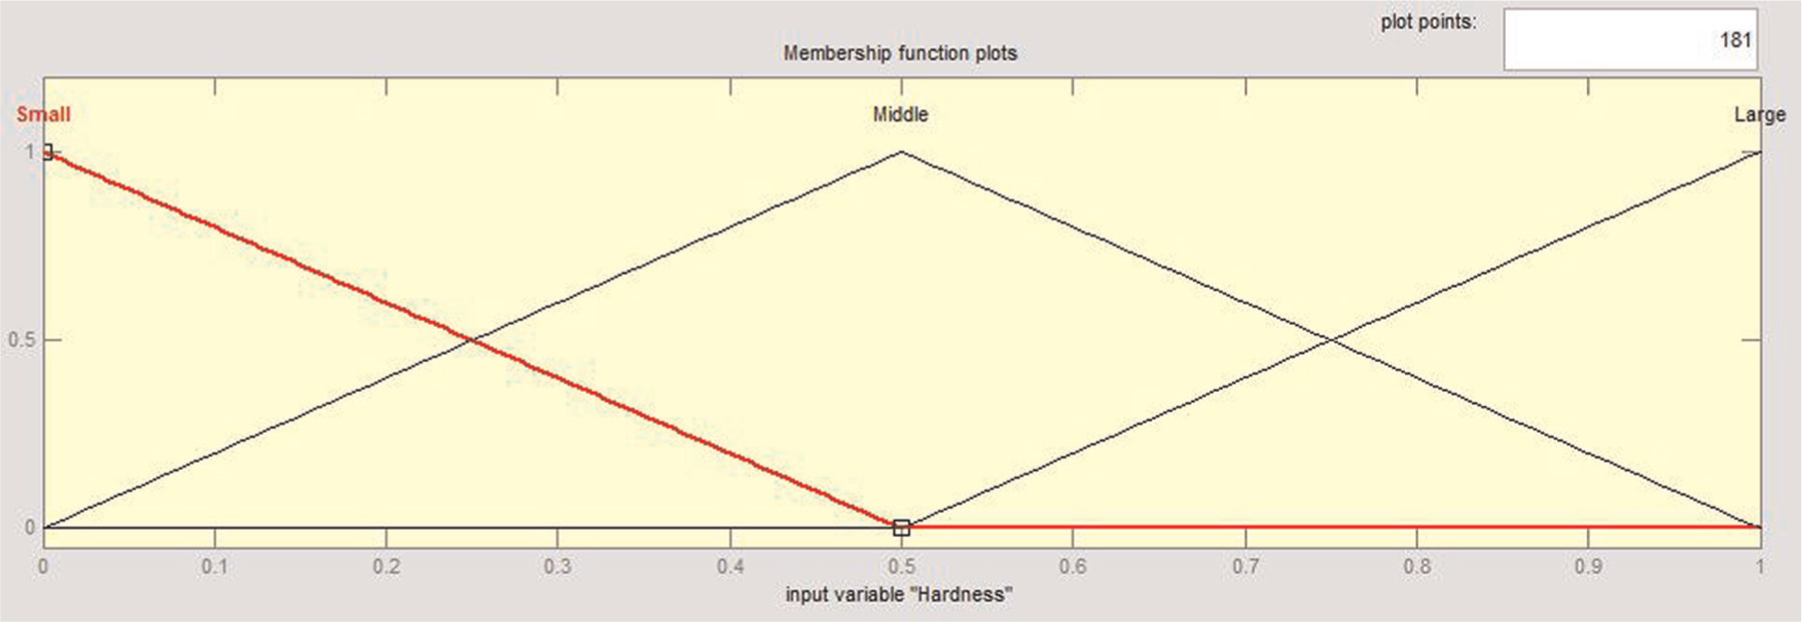
Membership functions of individual characteristics.
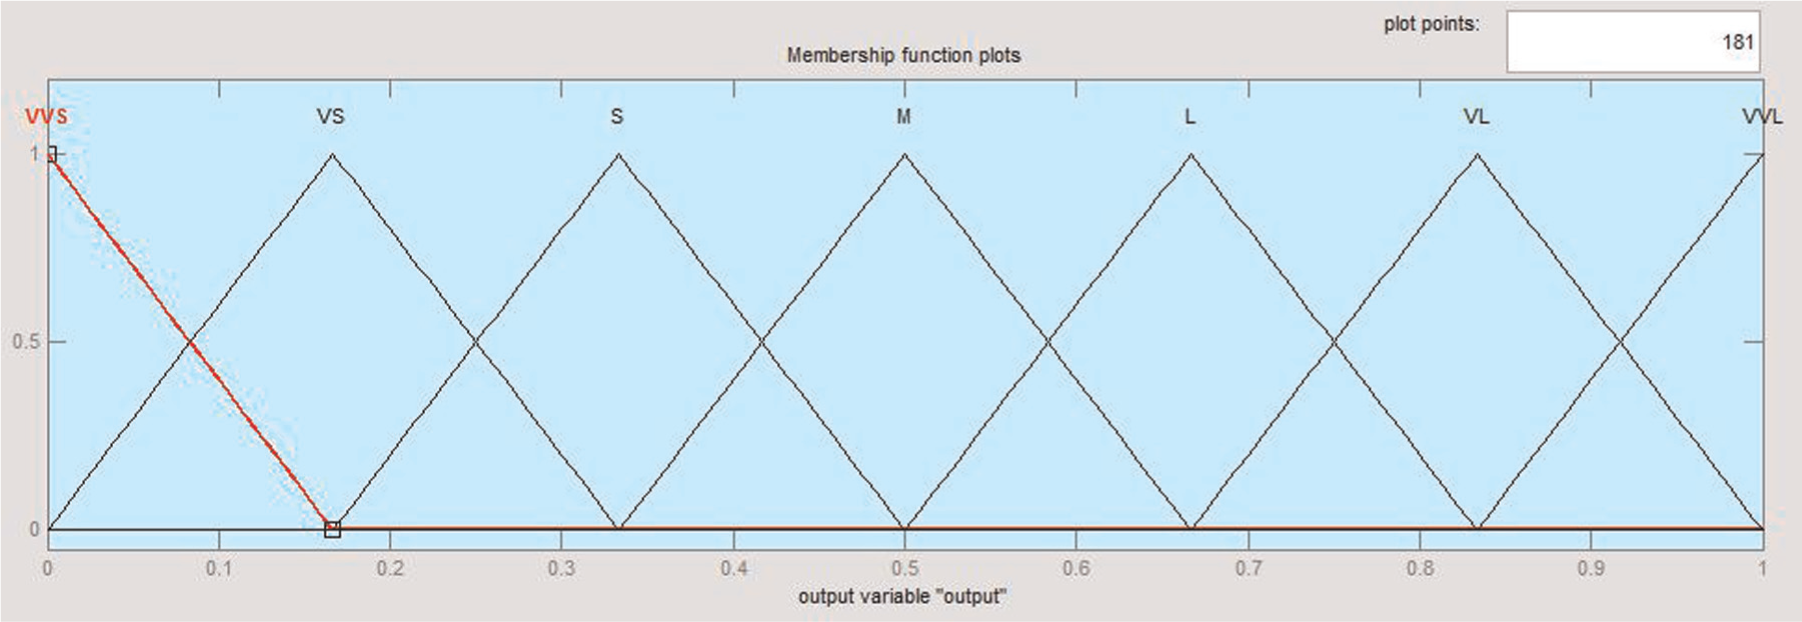
Membership function for MRPI.
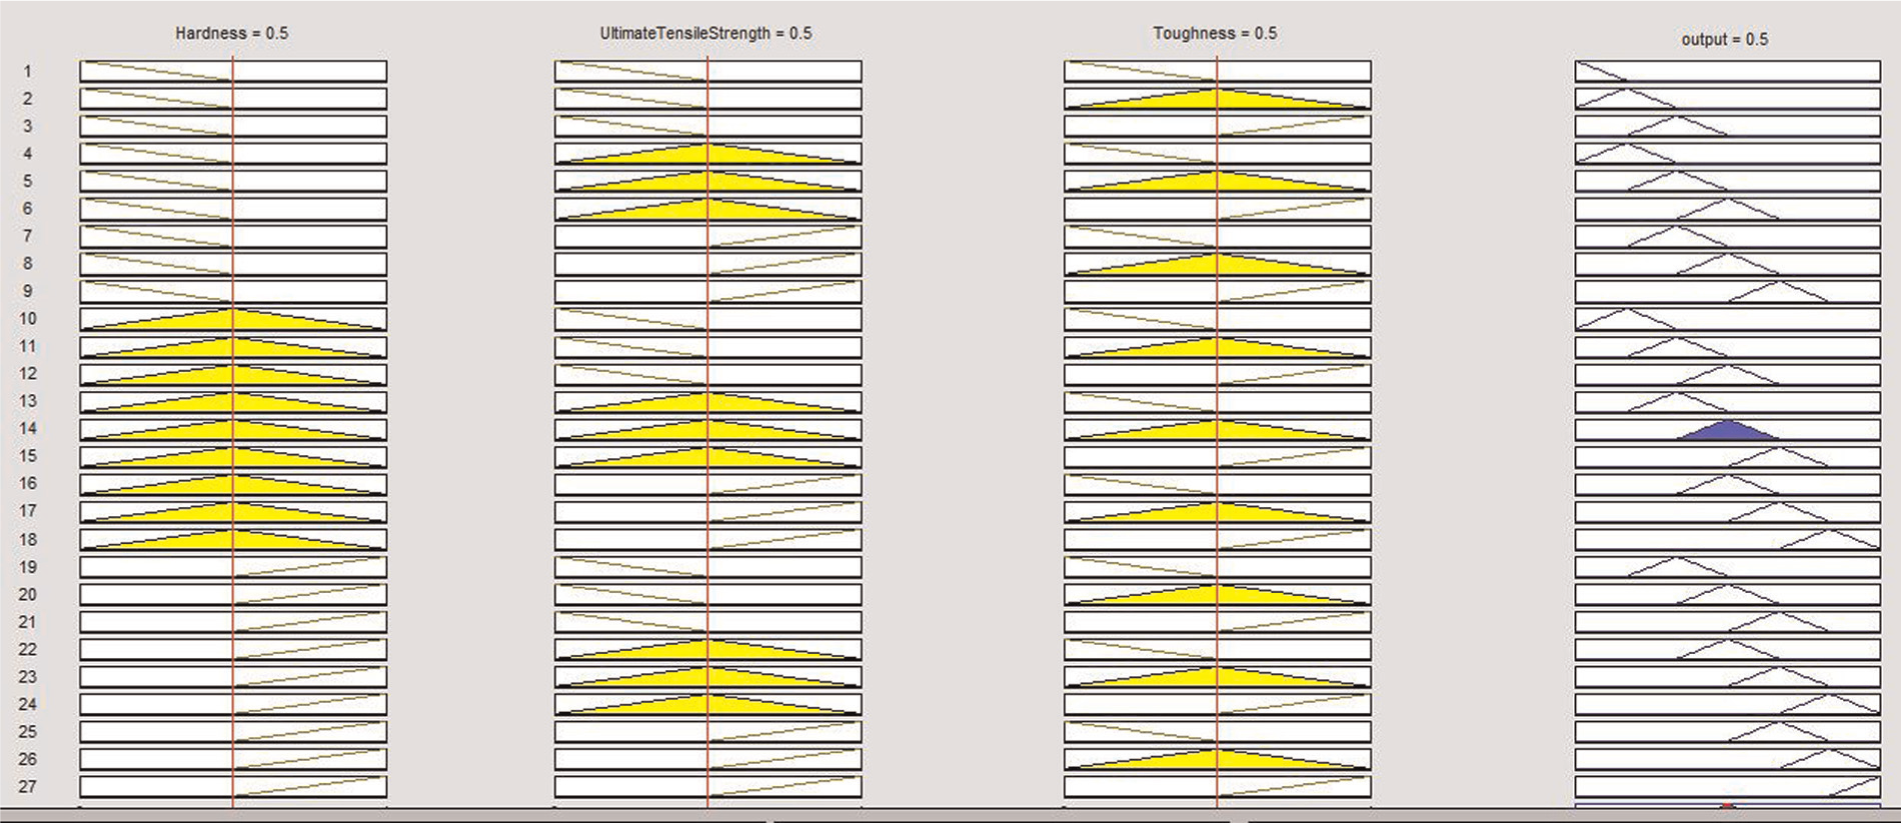
Fuzzy rules of the three inputs.
To determine the optimal welding heat input condition, it was necessary to find out the highest MRPI value among all possible combinations. A TA algorithm has been used for optimization (maximization) of MRPI. MATLAB version 7.9.0 has been used for development of fuzzy model and TA code. The optimal solution obtained in TA depends on the TA parameters such as initial threshold, final threshold, threshold reduction step size, threshold decreasing type and number of permutation to be performed at particular threshold.
Convergence of the developed TA model is shown in Figure 11. From this figure, it was apparent that the maximum joint strength is obtained at the
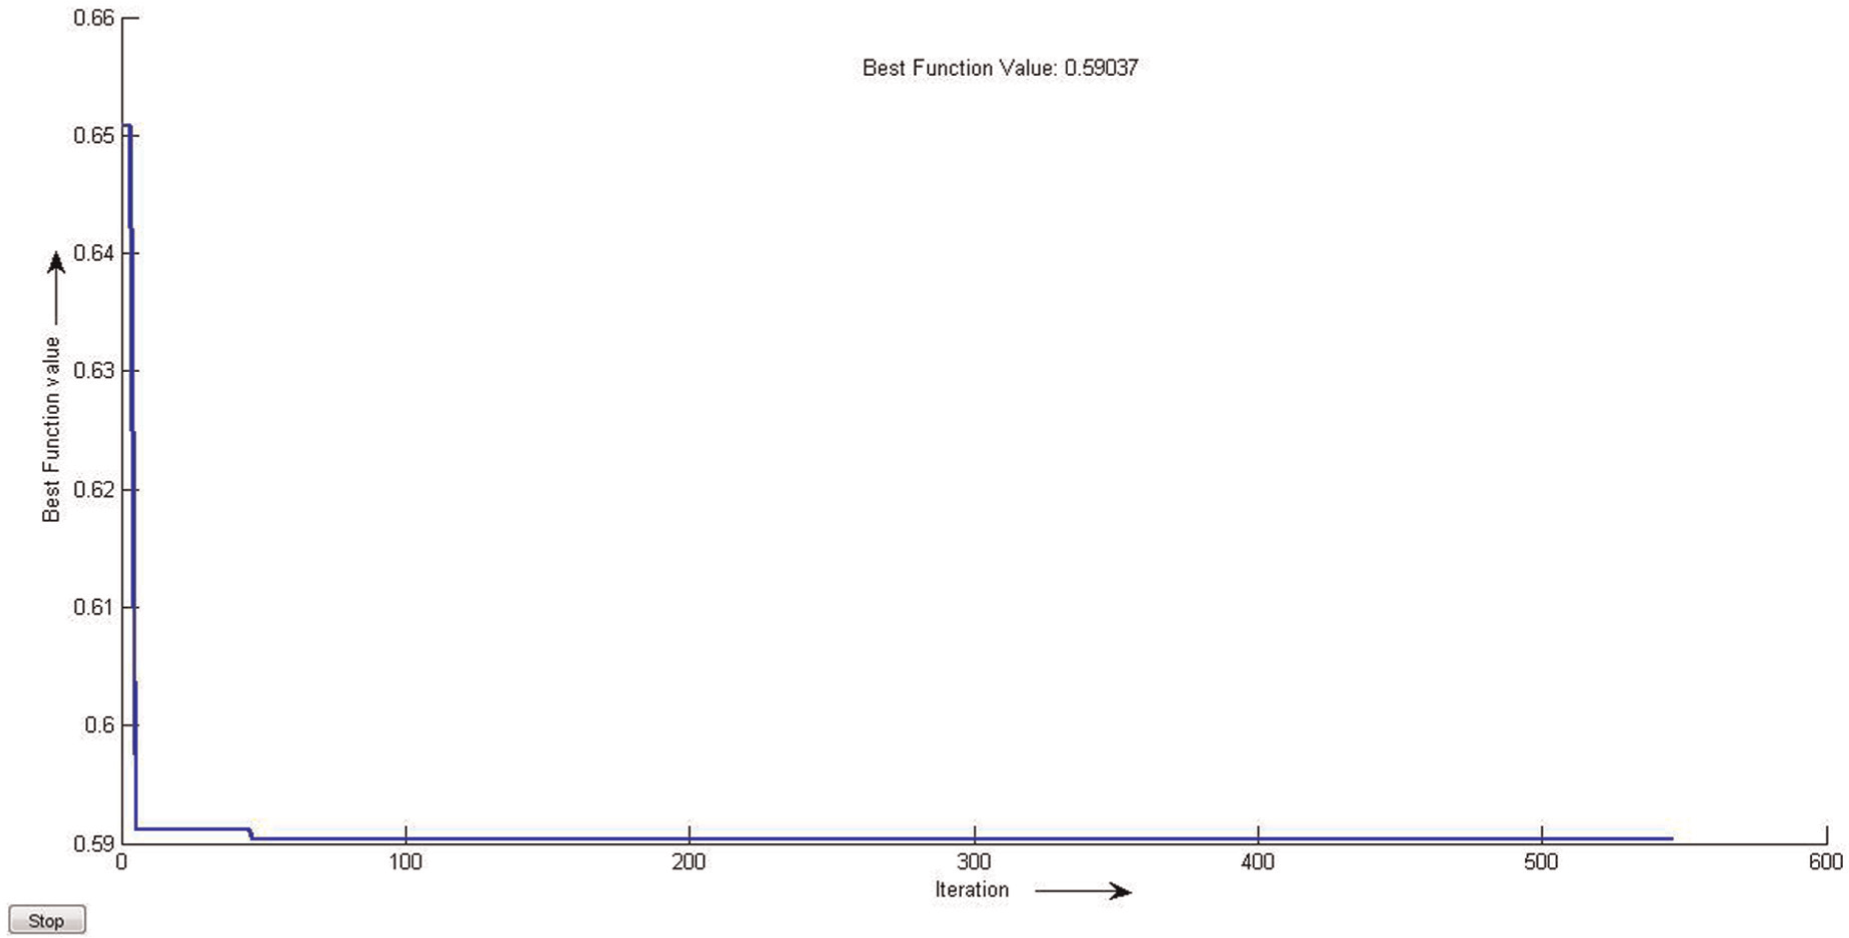
Convergence of the developed TA model.
Confirmatory test
Once the optimal level of the welding condition has been selected, the final step was to predict and verify the improvement of the performance characteristic using the optimal level of the process parameter. Table 5 shows the comparison of results predicted by TA model with experimental results. However, detailed scanning electron micrograph (SEM) study is necessary to see the fractured surfaces of impact specimen which may show some relation of toughness with heat input.
Comparison of the predicted and experimental values.
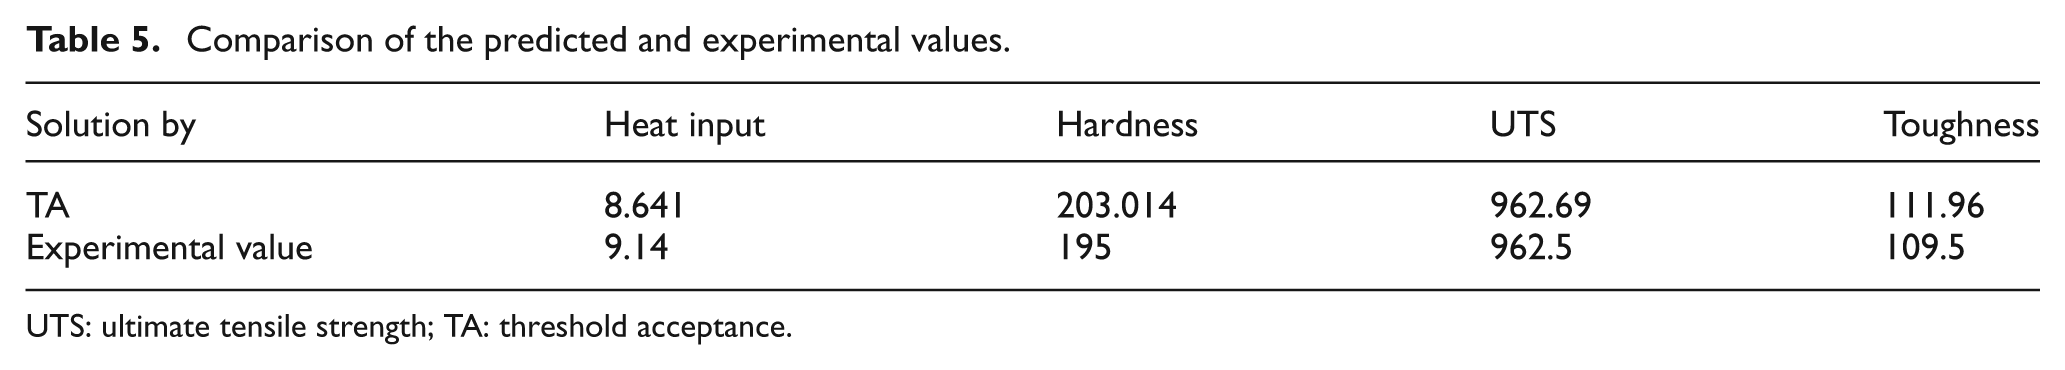
UTS: ultimate tensile strength; TA: threshold acceptance.
Conclusion
From the above discussions, the following conclusions can be drawn.
Microstructure study of all WZs revealed that increase in heat input coarsened the grain structure. Phase analysis of WZ micrographs shows increase of ferrite percentage with the heat input, whereas pearlite percentage decreases.
Mechanical properties, namely, hardness, UTS and toughness of the weld joints, decrease with respect to welding heat input.
Fuzzy interference system was used to perform a fuzzy reasoning of the multiple responses. Therefore, the individual characteristics are converted into single-objective optimization problem.
The optimal welding heat input condition optimized by TA algorithm was 8.641 kJ/cm. Confirmatory test results also validate the accuracy of the TA model.
Based upon this study, it was recommended that the low heat input was more preferable to high heat input in SAW of low-carbon steel. The low heat input welding condition shows better microstructural and mechanical performance.
Footnotes
Acknowledgements
The authors offer their sincere thanks to the HOD of Mechanical Engineering Department and Instructors of Workshop, NIT, Agartala, for their valuable help in finishing this work.
Declaration of conflicting interests
The authors declare that there is no conflict of interest.
Funding
This research received no specific grant from any funding agency in the public, commercial or not-for-profit sectors.