
Abstract
Plunge milling is used increasingly in the manufacture of molds and dies for opening pockets due to its advantages over end milling. Because it is a rough operation, it involves high material removal rates and strong cutting forces. In this context, this article reports on a study of the static and dynamic behaviors of the forces involved in the process. In addition, a cutting force model is developed based on the kinematics of the process and the tool’s special features to predict the mean forces generated during the plunge operation. Low sensitivity of the static force components of tool flank wear and minor influence of the system on the dynamic behavior of the process are observed. The model shows good agreement with experimental results.
Introduction
One of the main operations in die and mold manufacturing is the opening of the initial pocket, from which more complex geometries are machined to produce the negative shape of the final product. Since it is a rough operation, it involves high cutting forces and significant tool wear. Plunge milling is an interesting alternative for this operation, since it enables a high material removal rate and its highest cutting force is exerted in the axial direction, where the spindle is most rigid, 1 thus tending to produce less vibration than plane milling operations. 2
Wakaoka et al. 3 also propose plunge cutting to cut vertical walls, arguing that the process is stable because it is performed using a single point tool, which produces relatively small cutting forces that do not change during cutting. Hence, according to them, plunge cutting offers higher accuracy and lower surface roughness than end milling.
Kwong et al. 4 used plunge milling as a finishing operation after drilling Ni-based superalloys, since the process successfully eliminates undesirable properties such as residual tensile stresses introduced in the material by aggressive drilling processes. Herbert et al. 5 proposed a sensible method for determining the amount of material that has to be removed in a plunging milling (finishing) operation after a roughing (drilling) aiming the removal of the surface anomalies generated. This enables the production of essentially damage-free surfaces, such as those required for critical safety components used in gas turbine aircraft engines.
Ko and Altintas 2 propose a time domain simulation model taking into account the regeneration of chip thickness to predict cutting forces in plunge milling. They show that there is a strong coupling effect between torsional and axial vibrations due to chip evacuation cavities in plunge milling cutters. They state that when the cutter geometry has large chip evacuation cavities between the teeth, the tool exhibits strong torsional vibrations like those produced by twist drills. These torsional vibrations are transmitted as axial deflections, which directly change the regenerative chip thickness and become a dominant source of chatter. Their study emphasizes that flexibilities in other directions may also be important, if the vibrations are transmitted in the chip thickness direction by the cutter geometry. They also state that the presence of chatter is identified when the cut surface is rough, and the process is dominated by a high pitched sound that does not correspond to the harmonics of tooth passing frequency but is close to one of the natural frequencies.
Damir et al. 6 developed a model to study the dynamics of plunge milling for system with rigid and flexible workpiece. Their model predicts cutting forces, system vibration as a function of workpiece and tool dynamics, tool setting errors, tool kinematics, and tool geometry. Both workpiece and tool dynamics are considered in the simulation for flexible workpiece, while only the tool dynamics is considered in case of rigid workpiece. Witty et al. 7 evaluated the stability and performance of plunge milling relating the engagement condition of the tool with the process parameters and microgeometry of the cutting tool.
Knowledge of the behavior and magnitude of forces in machining processes is very important, since they affect the required cutting power, the ability to obtain tight tolerances, the cutting temperature, and tool wear. 8 The predicted loads are used to size spindle bearings, spindle dimensions, and motor capacity, as well as to avoid overloading the machine tool system. 2 The magnitude of cutting forces is known to increase with the progression of tool flank wear, but Lin and Lin 9 confirmed that this increase may result from other factors such as changes in workpiece and tool geometry. Moreover, it may also depend on cutting parameters.
In this context, and considering the scantiness of the literature on this theme, the present work focused on a study of the static and dynamic components of cutting forces in plunge milling. These forces are also analyzed as a function of different levels of tool wear, and a simple cutting force model based on tool geometry and on an evaluation of the contact angle is proposed to allow the process to be easily sized and optimized.
Material and methods
To evaluate the static and dynamic components of cutting forces in plunge milling and compare the experimental cutting forces with those obtained by the proposed model, pockets were machined without cutting fluid in workpieces of AISI D2 steel, with 29 HRC hardness, in a Mori Seiki SV-40 vertical machining center with a maximum spindle speed of 12,000 r/min. A PH D40-H90-A-W32-13 plunge tool from Iscar (Figure 1(a)), 40 mm diameter, 112 mm length, and with two teeth, was applied, and International Organization for Standardization (ISO) grade P15-30 TiAlN-coated cemented carbide inserts were used. The special inserts have specification PLHT1305-PDX and were also manufactured by Iscar. “PL” means that insert is used in plunge mills, “H” corresponds to the dimensional tolerance of the insert, “T” characterizes the chip breaker, “13” is the edge length in millimeters, and “05” is the insert thickness also in millimeters. In the second part, “P” is related to a cutting-edge angle of 90°, “D” corresponds to a clearance angle of 15°, and X characterizes a special chamfer, not specified by the manufacturer. Two cutting speeds, vc, 300 m/min and 500 m/min, were tested, applying a constant depth of cut, ap, of 20 mm and feed per tooth, fz, of 0.025 mm/tooth.
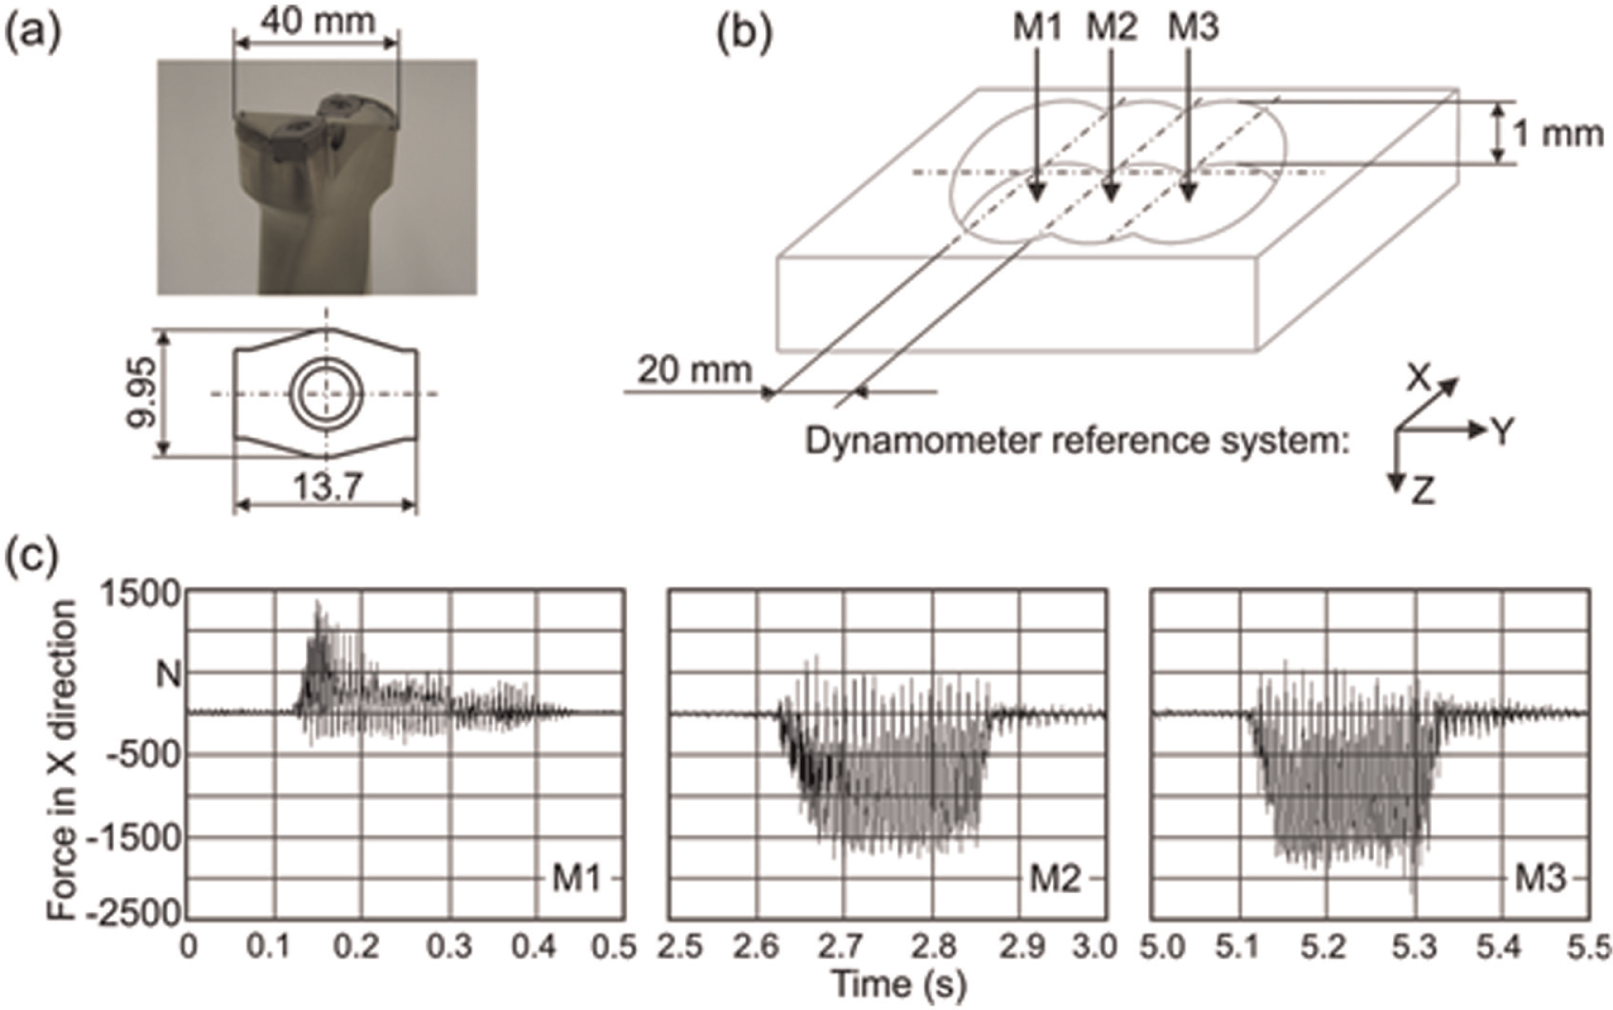
(a) Detail of the plunge tool, (b) analyzed pocket parts, and (c) example of cutting force in direction X at each tool penetration.
A pocket (herein also referred to as a “cut”) was opened by three consecutive penetrations of the tool (holes) to a depth of 1 mm. After each penetration, the tool’s displacement (in the Y direction, according to the dynamometer reference system) was 20 mm (= tool diameter/2), as shown in Figure 1(b). The forces in directions X, Y, and Z were evaluated with each tool penetration (Figure 1(c)). Tool wear and cutting forces were measured after every five cuts, that is, after opening five pockets, each 1 mm deep. To confirm the reliability of the results, two tests were performed at each cutting speed. Each test ended when the tool flank wear reached a maximum value of 0.3 mm in one insert or an insert broke. Tool wear was controlled using a Quimis Q714ZT2 optical microscope linked to a computer equipped with Motic Images software. Data were acquired with a Kistler 9257B dynamometer connected to a Kistler 5019B signal conditioner (Figure 2), at an acquisition rate of 2000 Hz and an analog low-pass filter with a cutoff frequency of 1000 Hz.
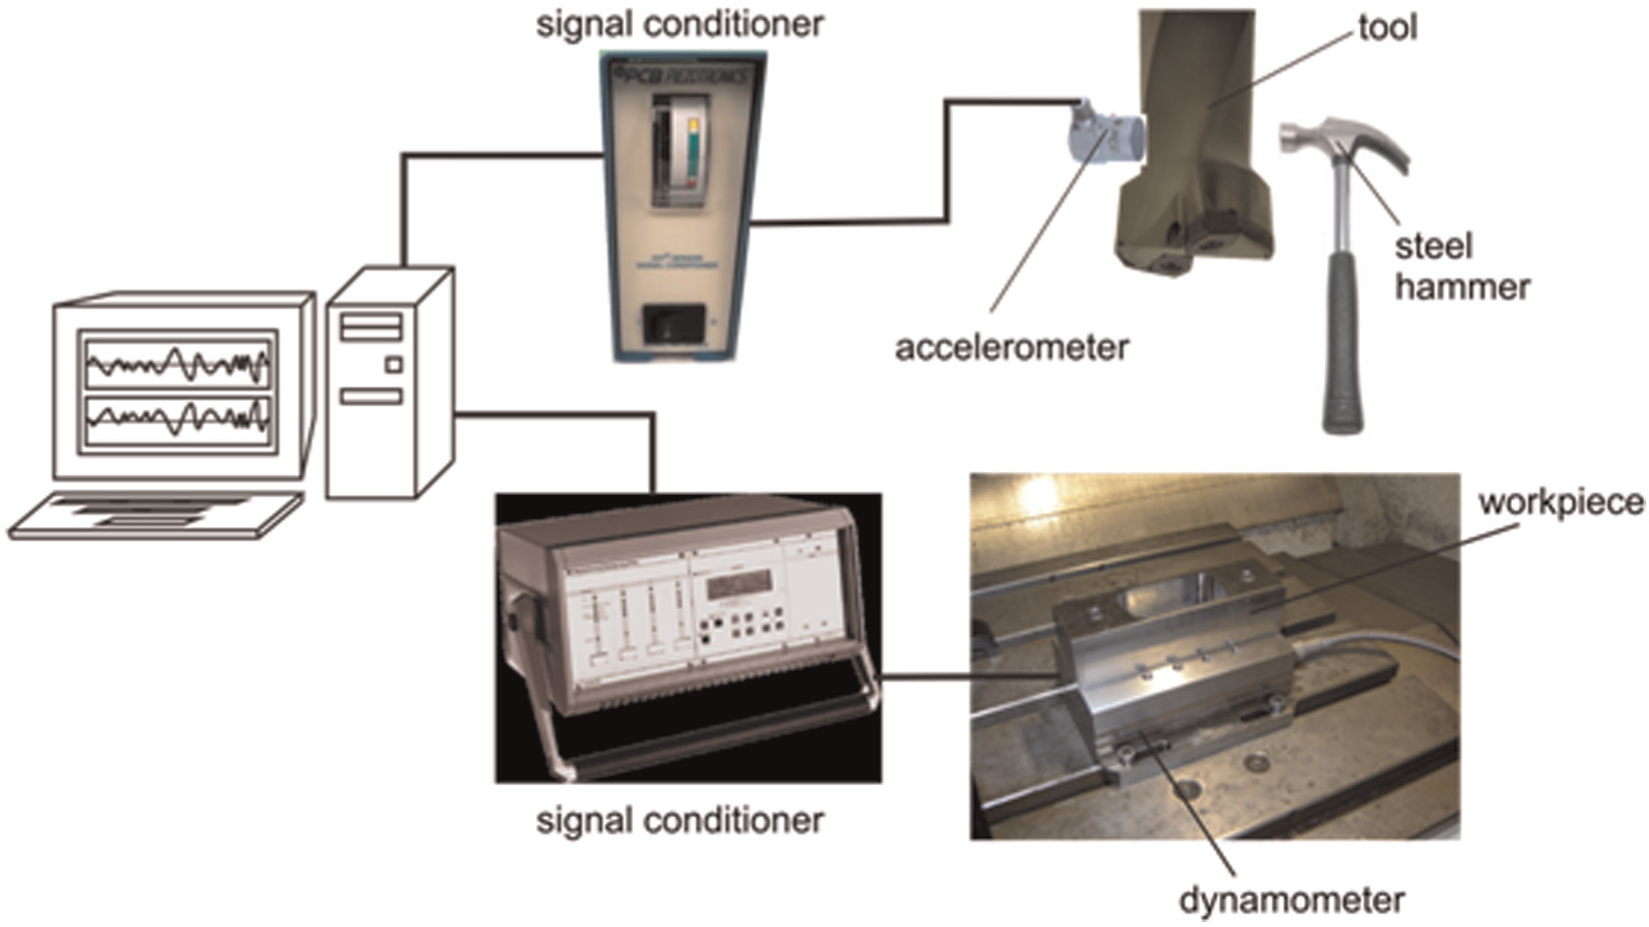
Schematic diagram of cutting force signal acquisition and tool modal analysis.
Root mean square (RMS) values indicate the magnitude of a given signal and were used here to evaluate the static component of the forces, since they oscillate and present positive and negative values. In this way, the calculation of an arithmetic mean value could lead to 0, which has no significance. The RMS force, FjRMS, with j = X, Y, or Z direction, was calculated using equation (1)
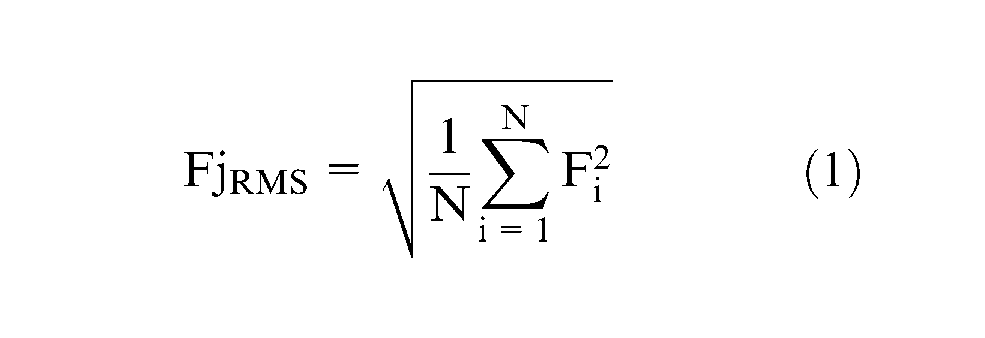
where Fi = instantaneous force at a given moment and N = number of instantaneous force values that comprise the signal.
In the analysis in the frequency domain, the Welch method 10 was used to calculate power spectral density. To analyze the relationships between force and system vibration frequencies, the tool was subjected to modal analysis. To this end, a PCB 352C33 uniaxial accelerometer coupled to a PCB 482B05 signal conditioner (with unity gain and without filter) was attached to the milling tool (Figure 2) and excited by a steel hammer with an uncontrolled impulse. The excitation was carried out in directions X, Y, and Z, parallel to the axis of the accelerometer. After acquiring the signal at a rate of 20 kHz, it was filtered digitally with a ninth-order Butterworth low-pass filter with a cutoff frequency of 9 kHz, using MATLAB 7.1 software, and was also normalized, since the amplitude of the spectrum was not considered in this study.
Results and discussion
In this section, the results are analyzed, and a force model is presented to gain a better understanding of the influence of the cutting conditions on the force components.
Static component of cutting force
An evaluation of cutting forces in each direction and the evolution of tool wear at both cutting speeds are shown in Figures 3 and 4.
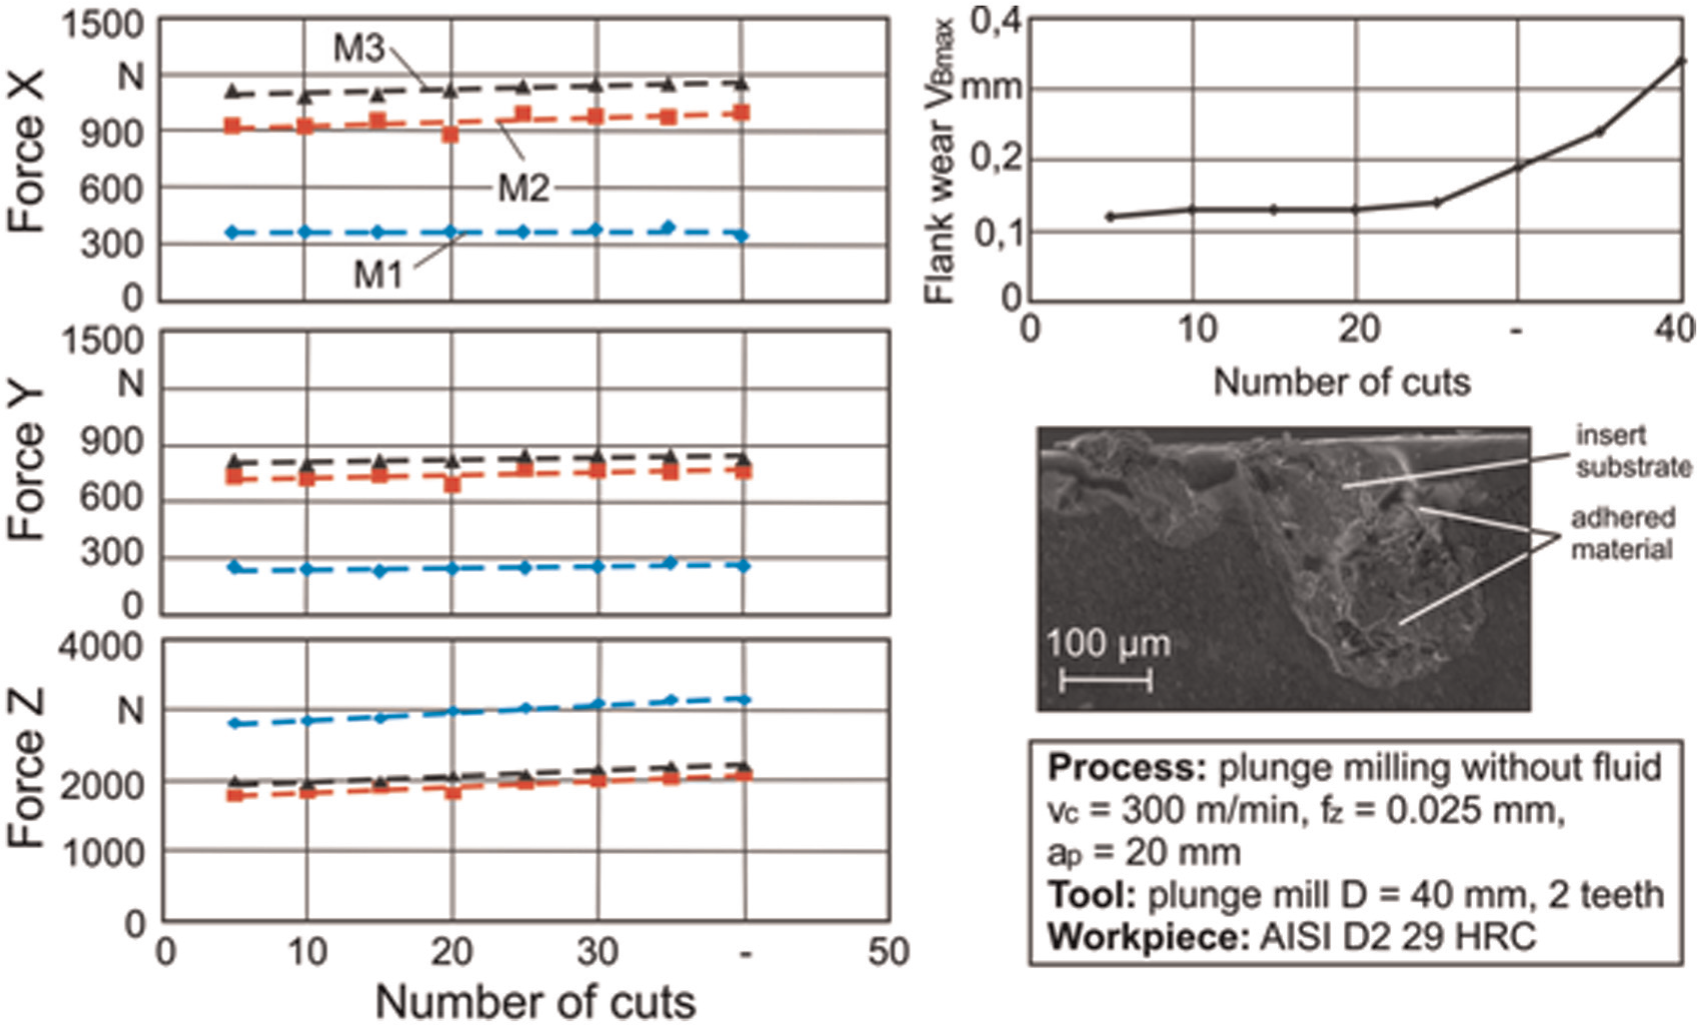
Plunge milling at a cutting speed of vc = 300 m/min: RMS force values in X, Y, and Z directions and evolution of tool wear.
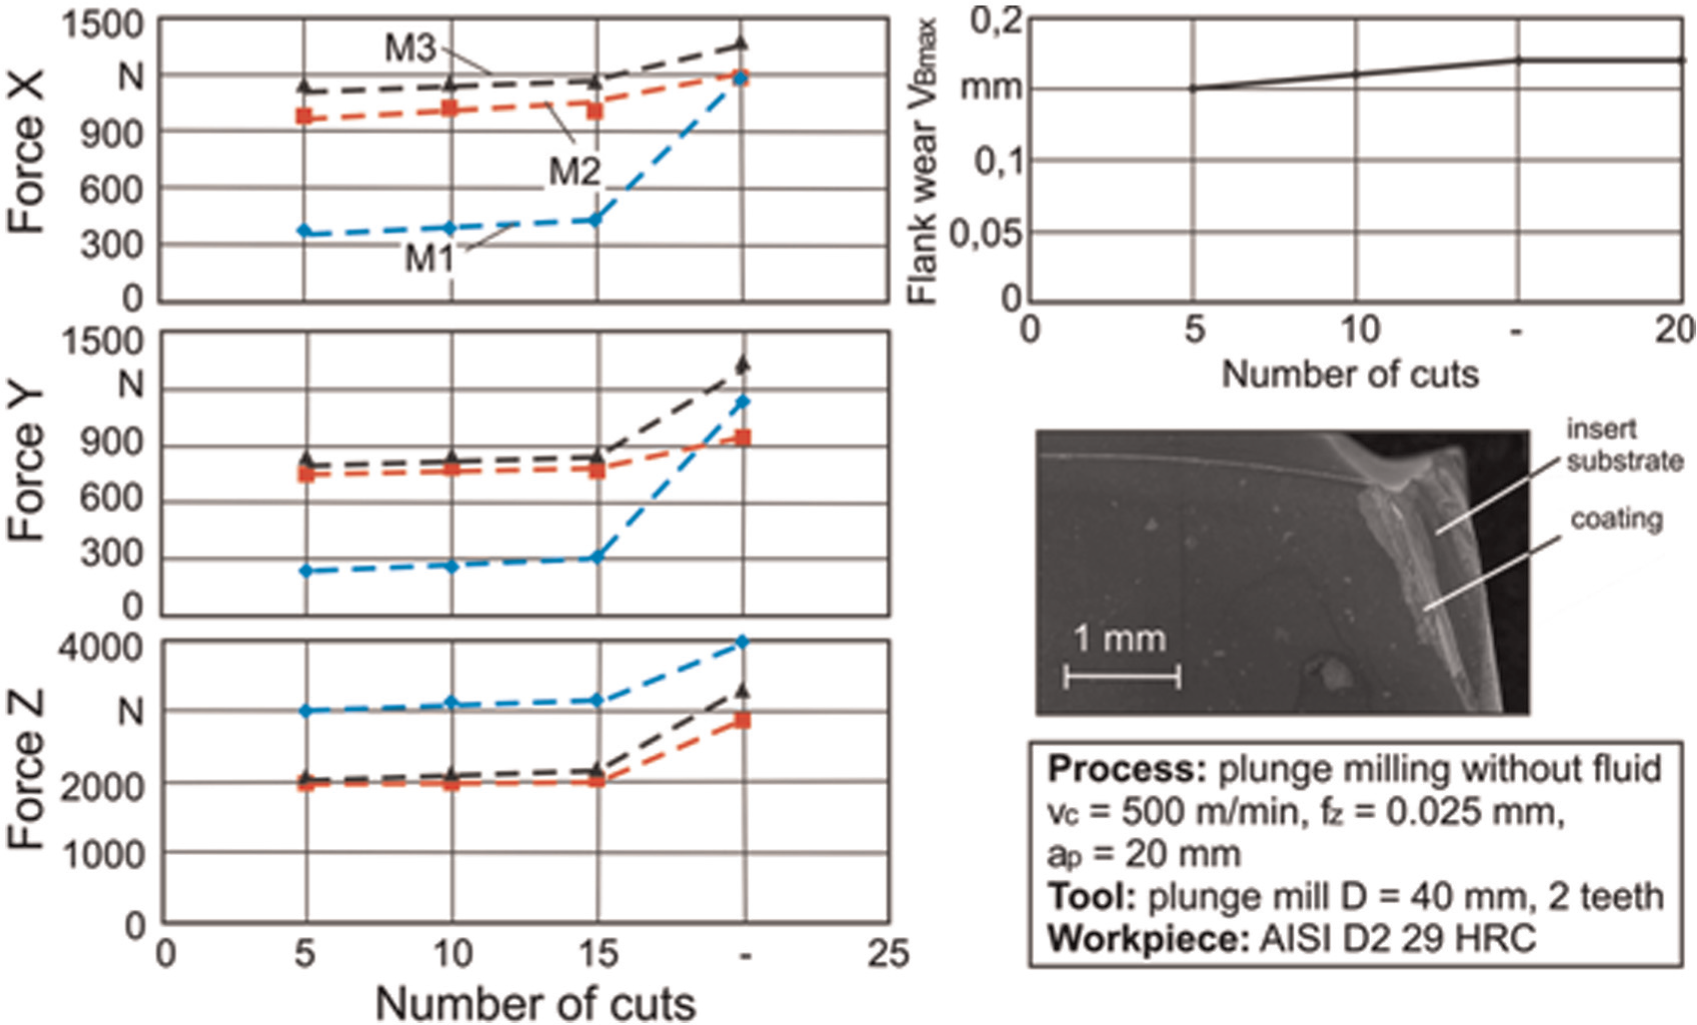
Plunge milling at a cutting speed of vc = 500 m/min: RMS force values in X, Y, and Z directions and evolution of tool wear.
At both cutting speeds, the RMS force in M1 (“full” hole) in directions X and Y is lower because the radial force of one insert is subtracted from that of the opposite insert, reducing the resultant value. Since the cutting sections of each insert are different, the resultant force is nonzero. In M2 and M3 (“half” holes), there is a part already cut, one of the inserts is always outside of the workpiece material, and therefore, the forces in directions X and Y have greater resultant values.
The opposite behavior is seen in the Z direction, that is, greater RMS forces in M1 and smaller ones in M2 and M3. As the cut is full in the former, there is a greater contribution in this direction since both inserts are in contact with the workpiece during the entire cutting time. With regard to the “half” holes, it can be stated that the interrupted part reduces the mean force values in direction Z. In every part of the pocket (M1, M2, and M3), the force in the spindle direction (Z) is greater than in directions X and Y due to the purely axial feed of the tool and the larger cutting area at the bottom of the insert.
The evolution of cutting forces in response to increasing tool wear is also illustrated in Figures 3 and 4. In the first case, with vc = 300 m/min, a very slight increase in the force is visible only in direction Z, although the wear increases constantly. This force component is more sensitive to wear because of the larger contact region at the bottom of the insert during cutting.
The main wear mechanism in the first case is adhesion of workpiece material on the wear land, followed by the removal of this adhered material together with tool particles. Trent and Wright, 11 who call this mechanism attrition, found that the irregular chip flow over the cutting edge and tool vibration also favor wear by adhesion. Although this mechanism is considered typical of low-speed processes, it can also occur in high-speed processes or in interrupted cutting processes such as milling. 12 No evidence of crater wear is found. In this way, despite a wear increase, the edge is not considerably damaged. Moreover, an increase of friction force seems to be not significant in this case. Because of that, large changes in cutting forces are not observed.
In the second case, with vc = 500 m/min, the forces are also approximately constant throughout the tool life. A greater difference is visible in the last cut, which can be justified by the chipping that occurred in one insert (Figure 4). Failure of the tool caused interruption of the test, since the forces were excessively high. For this reason, flank wear did not reach the 0.3 mm established in the experimental design. Chipping of the insert occurred at the intersection between the main and secondary flank faces, enabling the chip to enter the region between the tool and the wall of the pocket, causing it to be recut and accelerating tool failure.
Without considering the chipping of one insert in the test with vc = 500 m/min, which leads to an increase of the forces, there is no significant variation of cutting forces with change in cutting speed. For M1, the forces in X and Y directions are about 300 N, and in Z direction, they reach 3000 N for both cutting speeds. For M2 and M3, in both tests (with vc = 300 and 500 m/min), the forces in X direction are about 1050 N, in Y direction, 750 N, and in Z direction, 2000 N.
Dynamic component of cutting force
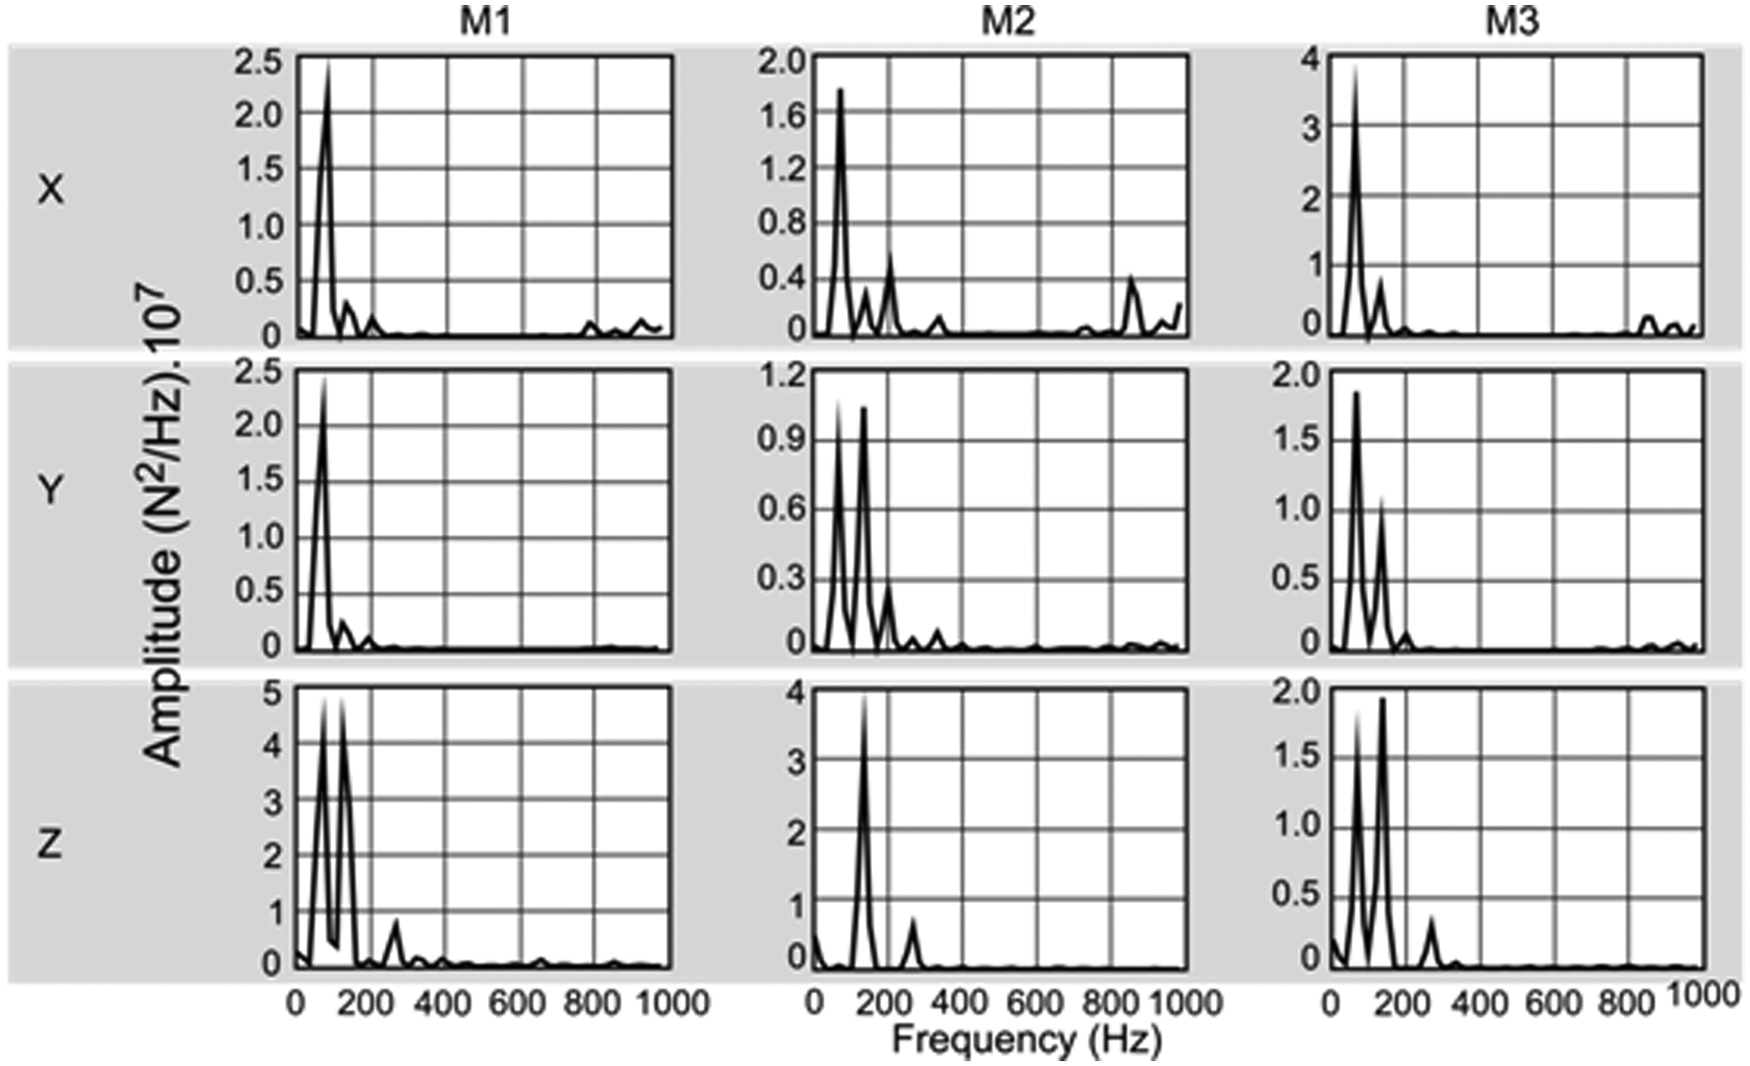
The main frequency observed in the power spectral densities in all the parts (M1, M2, and M3), directions (X, Y, and Z), and cuts corresponds to the entry of the tooth in a new portion of material (80 and 132 Hz for tests with vc = 300 and 500 m/min, respectively, according to Figures 5 and 6), since the two inserts have different areas. No variations of the power spectral densities are observed with the regular tool wear evolution for both tests.
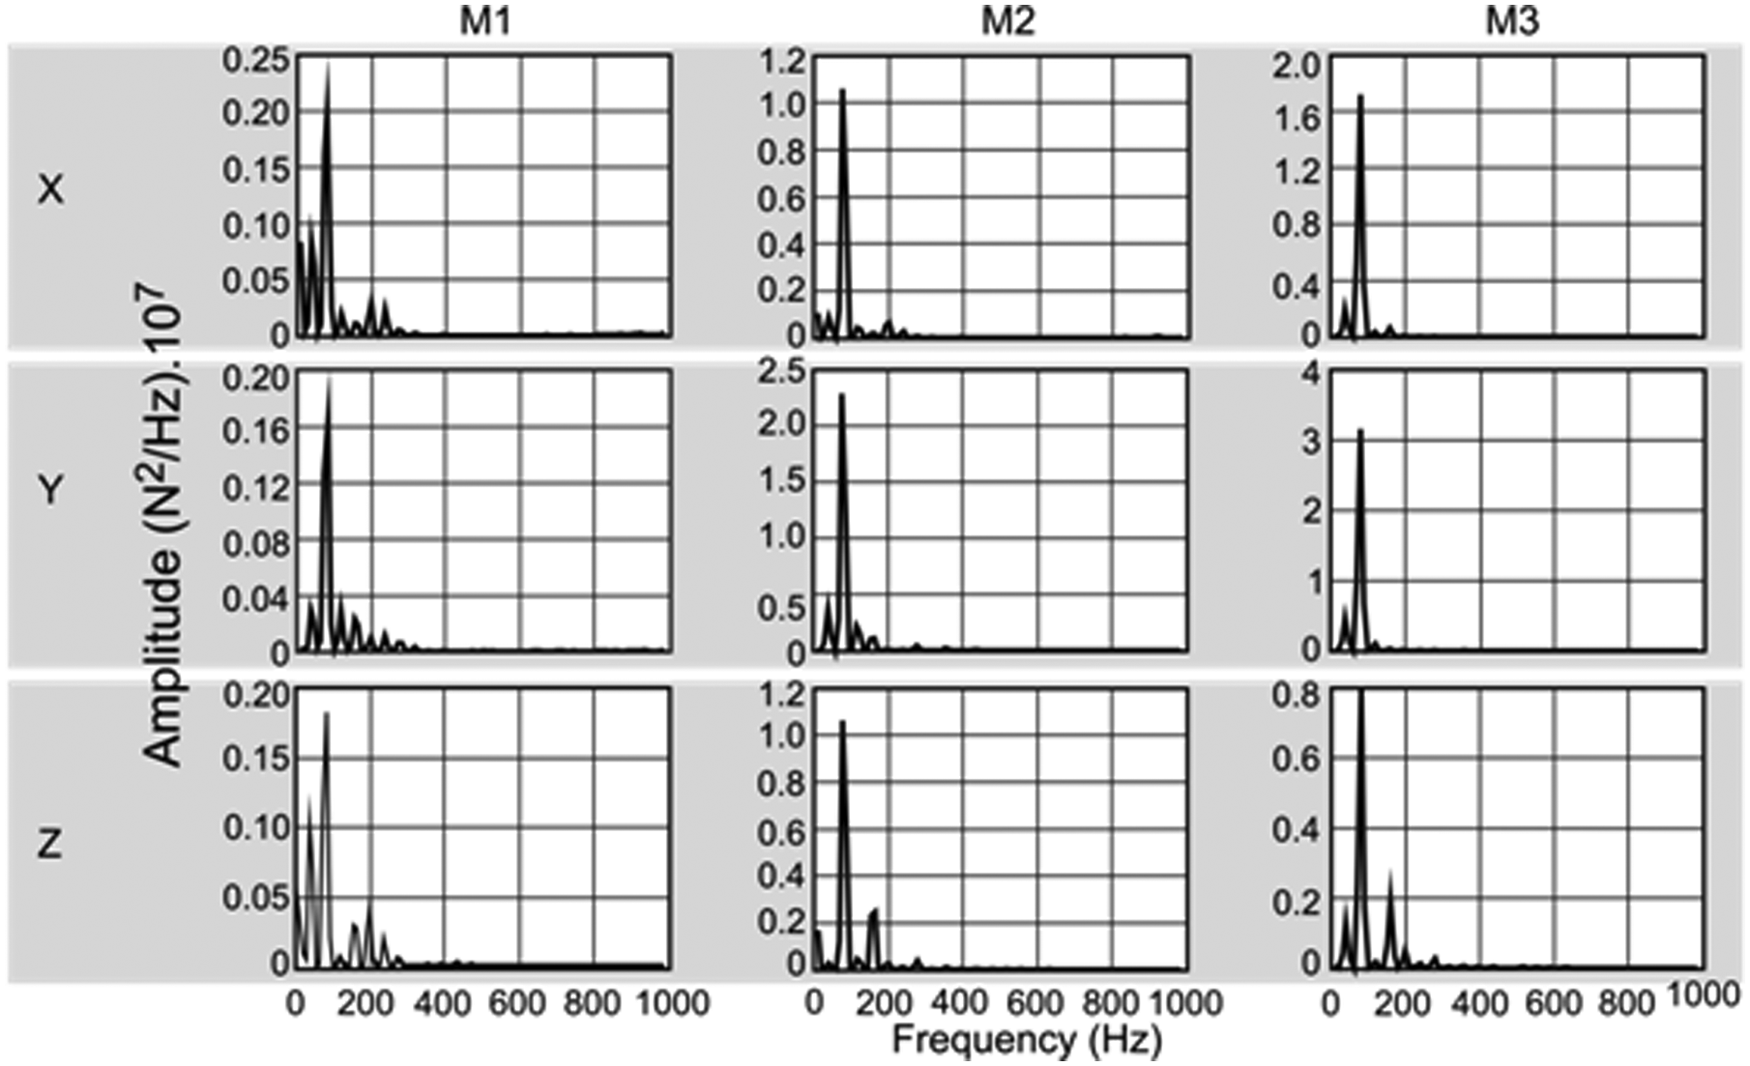
Power spectral densities for cutting forces in directions X, Y, and Z in all the parts of the pocket (vc = 300 m/min, fifth cut).
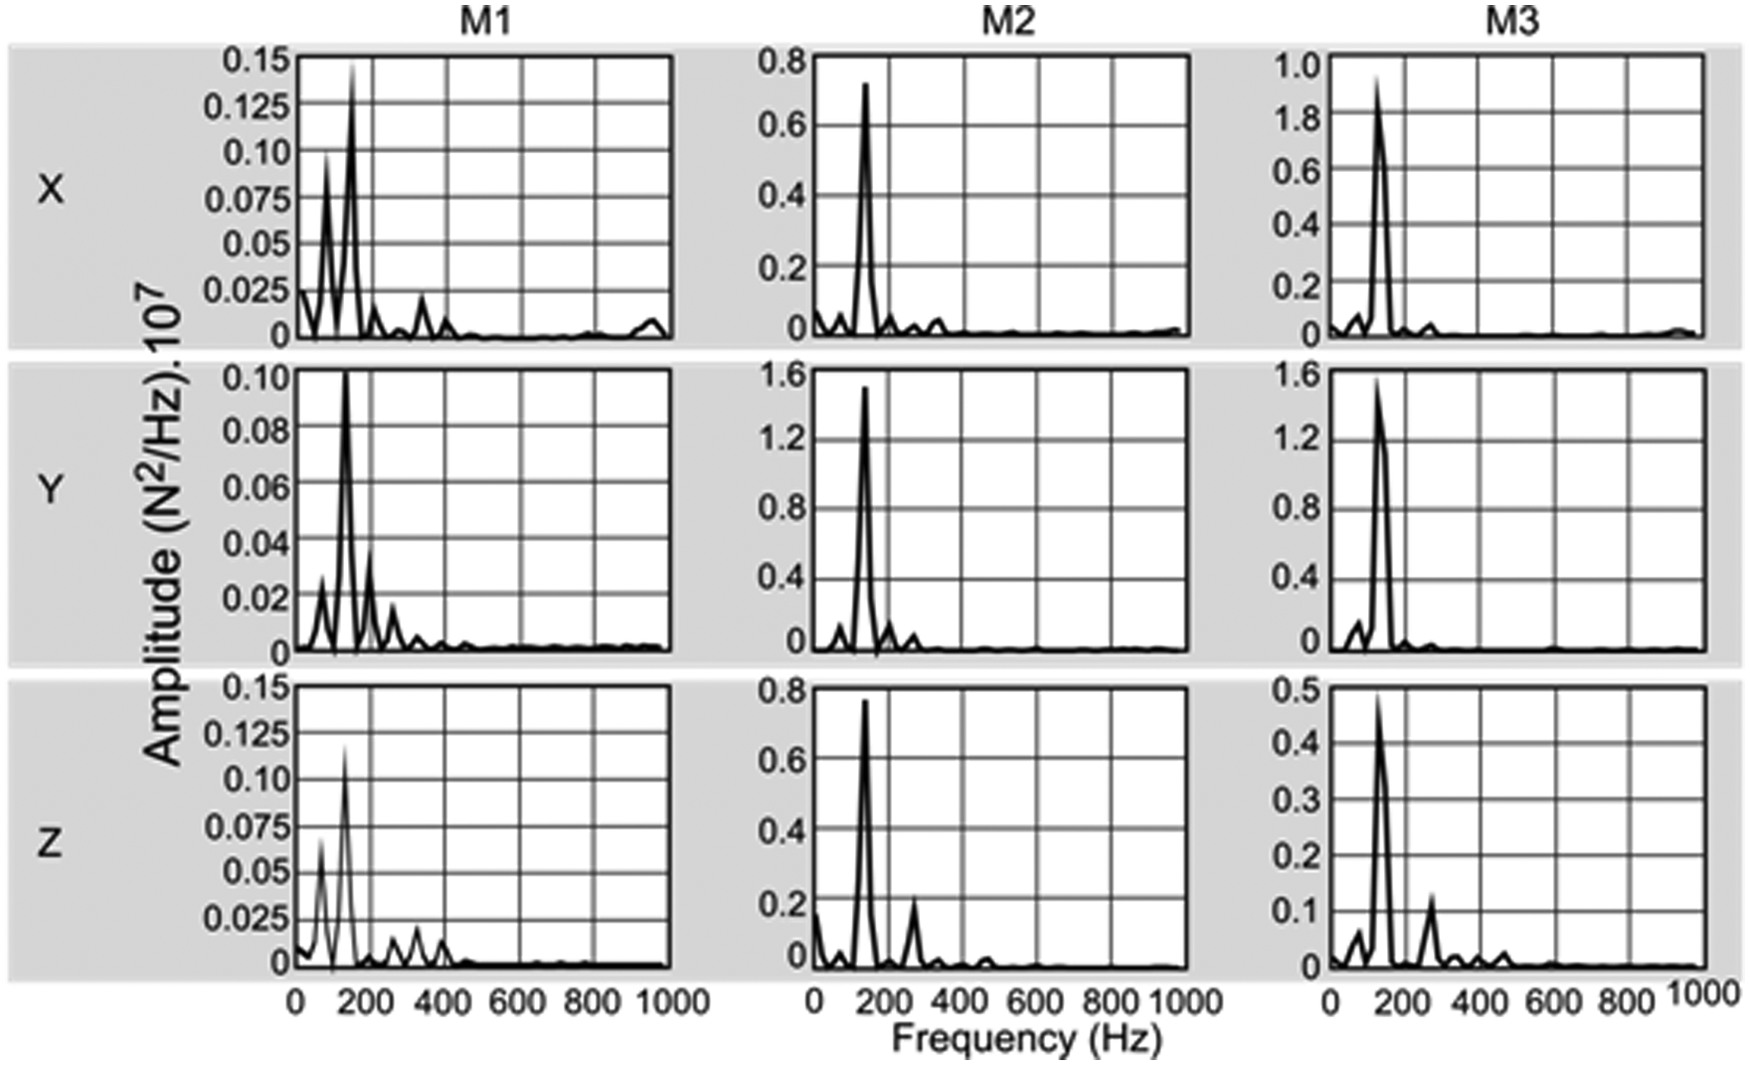
Power spectral densities for cutting forces in directions X, Y, and Z in all the parts of the pocket (vc = 500 m/min, fifth cut).
The few main frequency components suggest that the cut is stabler, even at very high amplitudes. These high amplitudes are indicative of a high material removal rate and are much higher than those related to higher frequencies. Therefore, the influence of the latter frequencies is reduced in the spectra. Higher amplitudes are noted mainly in M2 and M3, since the cut in these parts is interrupted and the impact frequency is distinguishable.
The modal analysis (Figure 7(a)) indicated that, due to low spindle speed, the harmonics of the cutting force with higher amplitudes are far from the fundamental frequency of the system (approximately 470 and 630 Hz in directions X and Y and 350 Hz in direction Z). Hence, when the force signal in the frequency domain is multiplied by the system’s response in the frequency domain, the resultant amplitudes at high frequencies are low compared to the amplitudes of the tooth passing frequency. Thus, the system’s contribution to the excitation of the frequencies in the analyzed range is low. However, the occurrence of structural vibrations cannot be excluded, even if they are not comparable to the energy of the cutting process. A higher contribution of the system can be observed in the power spectral density of the force in direction Z during plunge milling at vc = 500 m/min. It is clear that the system’s fundamental frequency in this direction (350 Hz, Figure 7(a)) was excited by the cutting process. This fact was evidenced by scratches at the bottom of the pocket (Figure 7(b)).
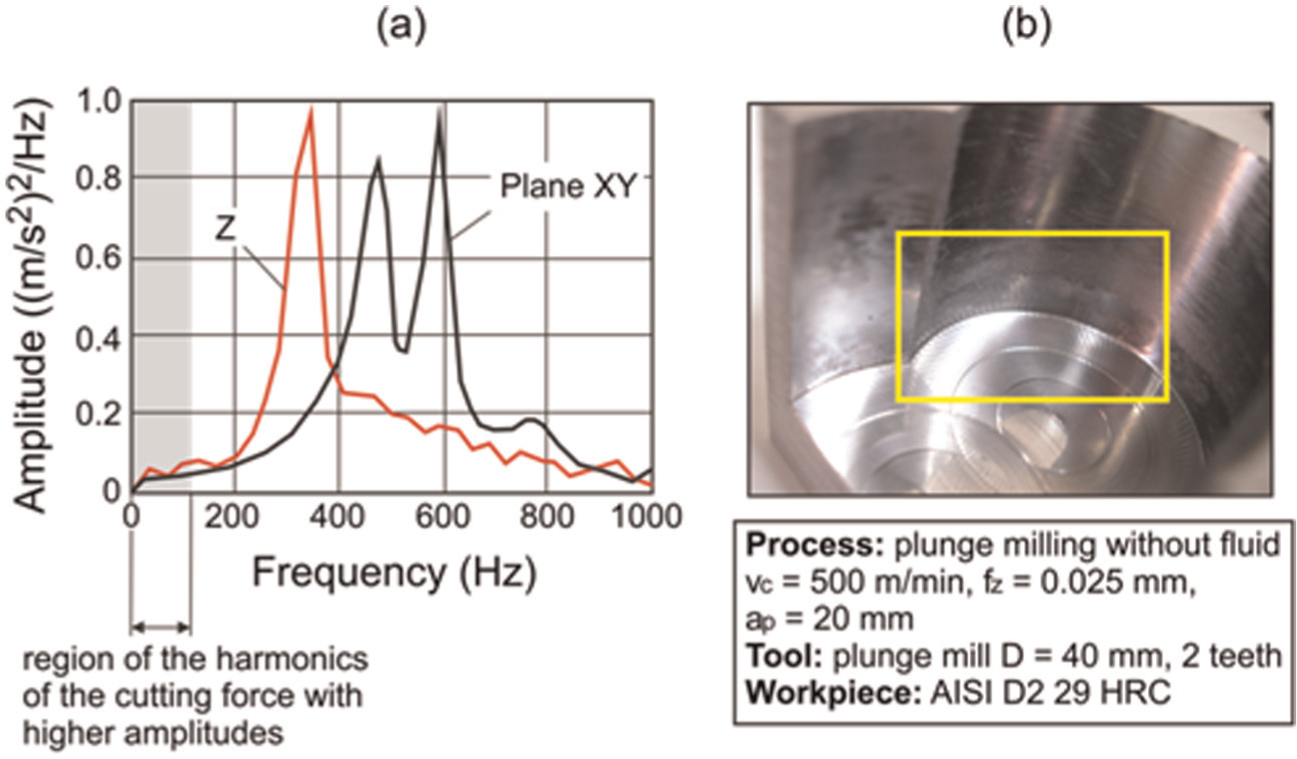
(a) Modal analysis of the plunge tool and (b) scratches at the bottom of the pocket.
In plunge milling at a higher cutting speed, the tool’s rotational frequency (66 Hz) also shows higher amplitudes in the power spectral densities of most of the parts and directions in the last cut (Figure 8), due to chipping of an insert. In addition to the higher amplitudes of the tool’s rotational frequency caused by chipping of one of the inserts, it was found that increasing the cutting speed did not alter the dynamic behavior of the process but instead simply increased the main frequencies without generating other frequency components.
Power spectral densities of cutting forces in directions X, Y, and Z in all the parts of the pocket (vc = 500 m/min, 20th cut).
Cutting force model
The proposed study is based on the model developed by Altintas 13 to evaluate cutting forces in oblique cutting, disregarding the effect of the helical angle, since the feed is very low. Dynamic effects are also disregarded.
Since the evolution of tool wear did not cause a significant variation of forces, a model relating tool wear and cutting forces is not important in the present case. In this way, new inserts were considered by the simulated and experimental forces. Therefore, the proposed model aims to predict the mean behavior of cutting forces in the plunge milling operation, considering the process kinematics and tool peculiarities.
The force components at the edges in the tangential, radial, and axial directions can be evaluated by equations (2)–(4)


where Ktc, Krc, and Kac are the specific cutting pressures in the tangential, radial, and axial directions; Kte, Kre, and Kae are the specific contact pressures at the edge in each direction; Achip is the chip’s cross-sectional area; and b is the contact length of the edge.
To compare the model with the experimental data, the forces in directions X, Y, and Z (according to the position of the dynamometer, see Figure 9) of each insert inside the cut must be calculated by equation (5), with ϕ equal to the angular position of a given insert.
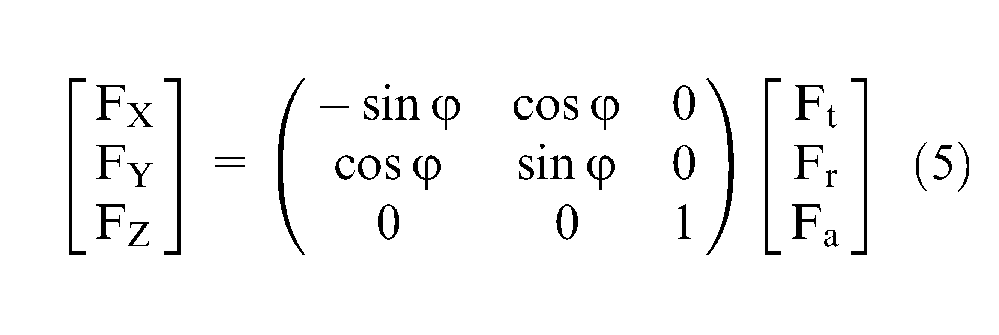
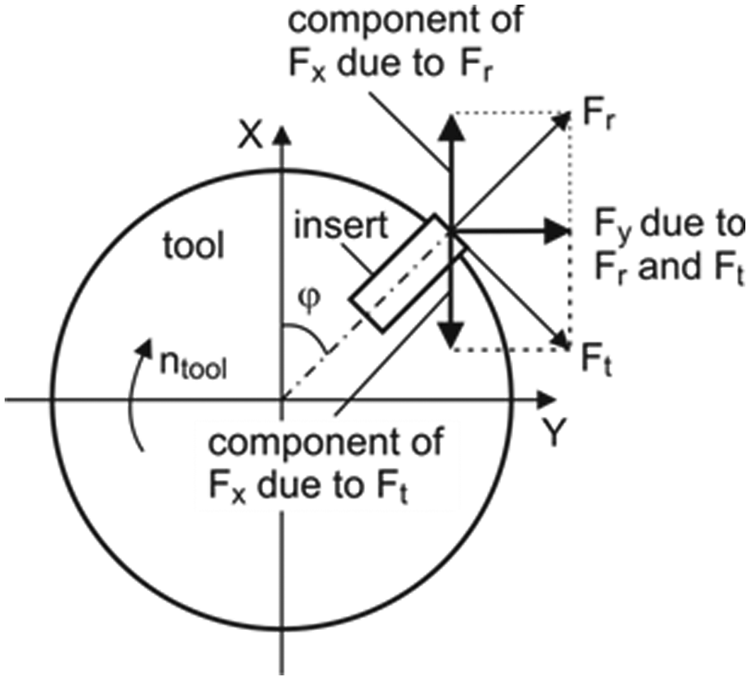
Projection of forces in dynamometer reference system.
It should be kept in mind that the contribution of each insert inside the cut must be included (equation (6)) and that, at the same time, each insert has a different angular position.

where j = X, Y, or Z; ni = number of the tooth inside the cut; and N = number of teeth simultaneously in the cut.
In the plunge process, the tool’s feed is purely axial, with a constant chip cross-sectional area (Achip) associated with the feed per tooth (fz) and the edge angle (λ = π/2 −β), according to Figure 10(a). Based on this figure, equation (7) is obtained to calculate the cutting area (Achip) of each insert. The contact length, b, can also be determined based on the geometrical relations, according to equation (8). It should be noted that each insert (located peripherally and centrally) has a different value of β, which was provided by the tool manufacturer.


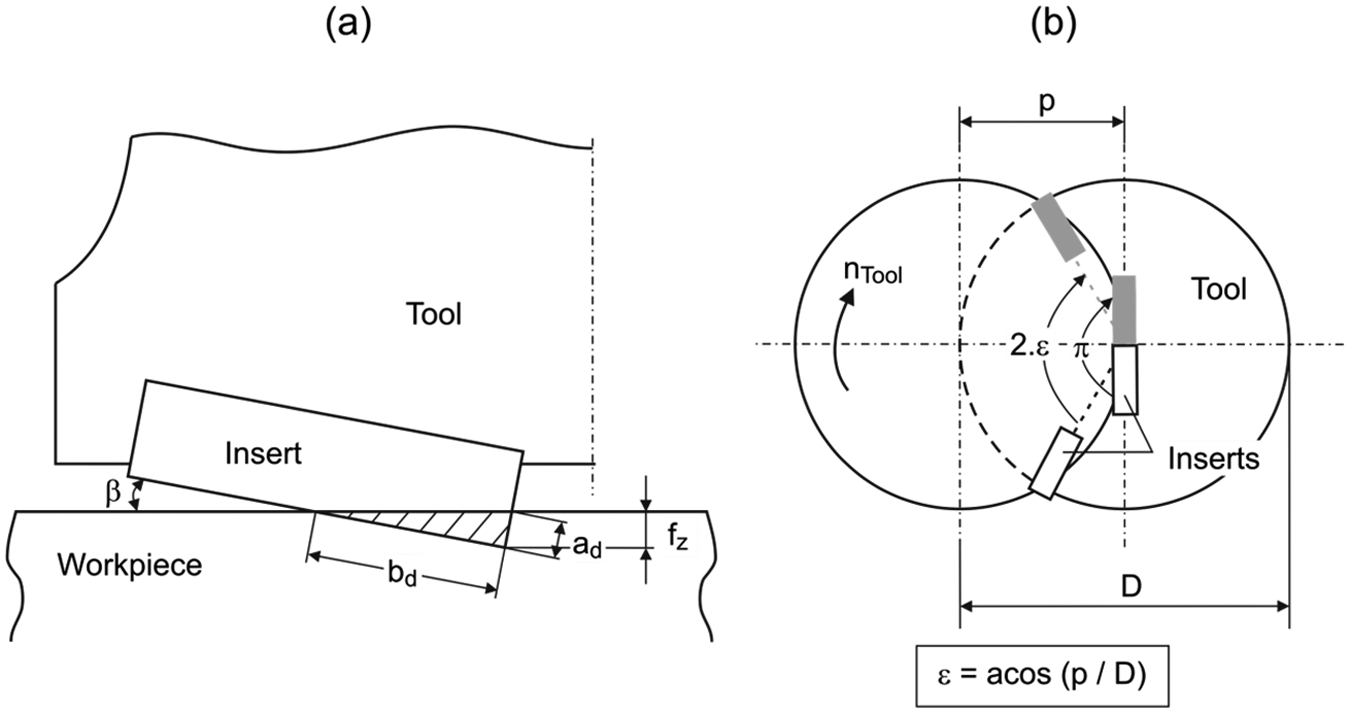
(a) Tool geometry for calculating the cutting area and (b) contact angle of different inserts in interrupted cutting.
The cut in the “half” hole is interrupted in different angular positions of each insert, as illustrated in Figure 10(b), since one insert is located close to the center of the tool and the other at its periphery. The model considers that the peripheral insert runs out of the workpiece material 2ε rad, while the central insert cuts each π rad. The value of ε can be calculated geometrically according to Figure 10(b).
To determine the cutting and edge constants in each direction (tangential, radial, and axial), the method suggested by Altintas 13 is applied. It is important to emphasize that the experimental and analytical curves to be equated are parabolas, due to the geometrical relation obtained between the cutting area and feed per tooth, whose constants are given in Table 1.
Cutting and edge constants for the process performed at vc = 300 m/min.
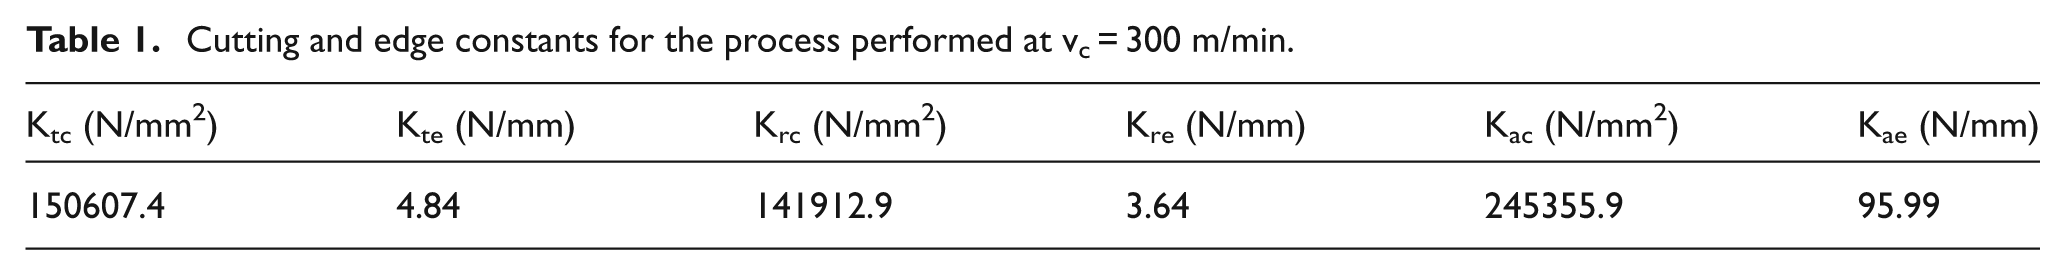
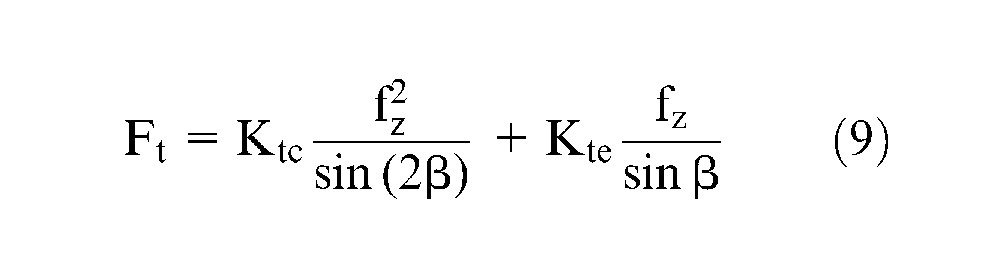
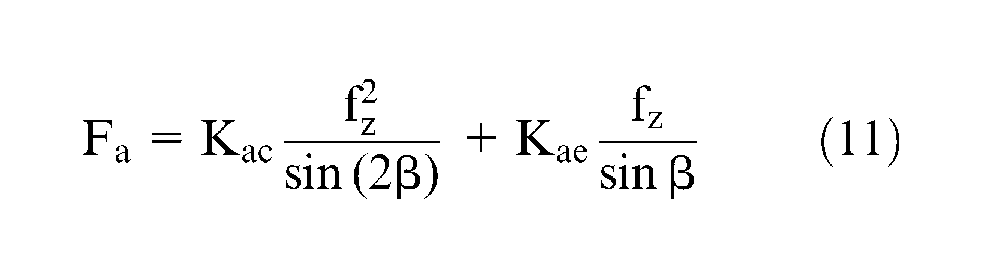
The behavior of the forces acting on the insert in the tangential, radial, and axial directions (equations (9)–(11)) is determined by substituting equations (7) and (8) in equations (2)–(4). Note that the forces increase quadratically with the increase in feed per tooth.
The total forces acting on the tool in the dynamometer’s directions can be determined by applying equations (5) and (6).

Considering the calculated constants, the cutting conditions (fz = 0.025 mm/tooth, vc = 300 m/min, ap = 20 mm), and the tool and pocket geometries (z = 2 teeth, β1 = 0.048 rad, β2 = 0.070 rad, final pocket depth = 1 mm, lateral tool displacement = 0.5 × D = 20 mm), the experimental forces (filtered through a low-pass filter with a cutoff frequency of 100 Hz) and simulated forces in “full” and “half” holes can be compared, as shown in Figures 11 and 12, respectively.
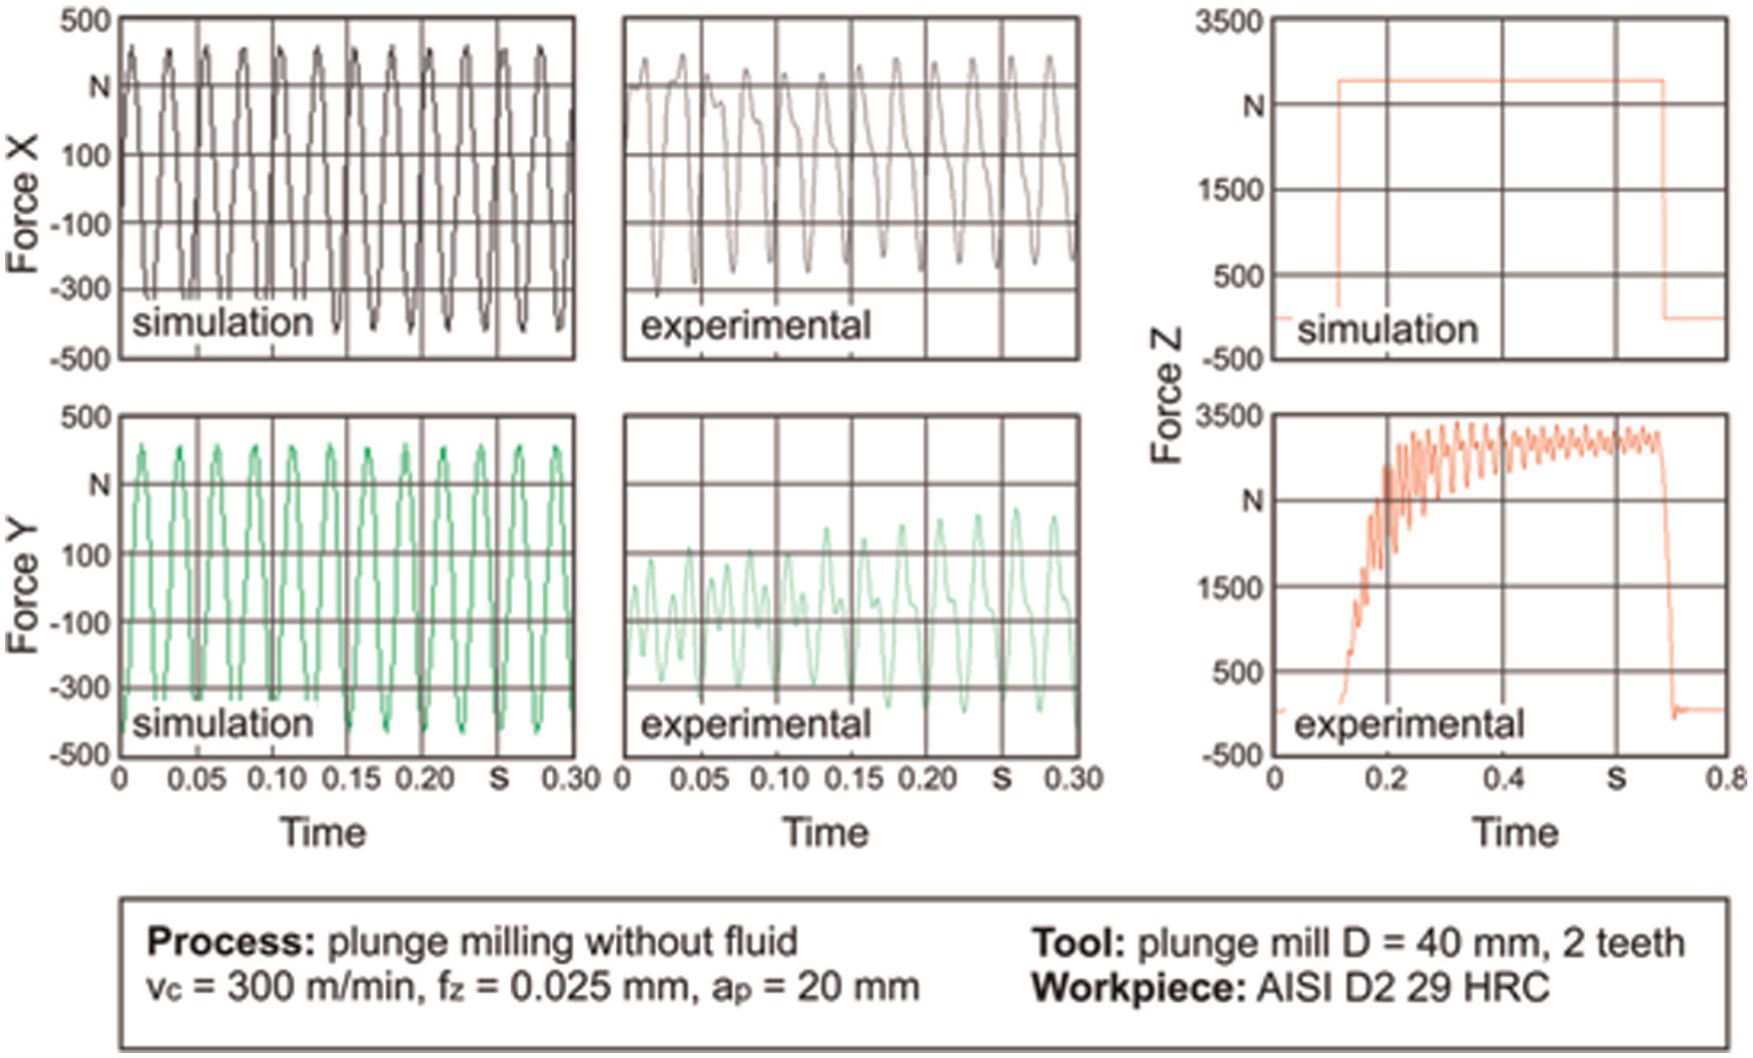
Simulated and experimental cutting forces in directions X, Y, and Z in M1.
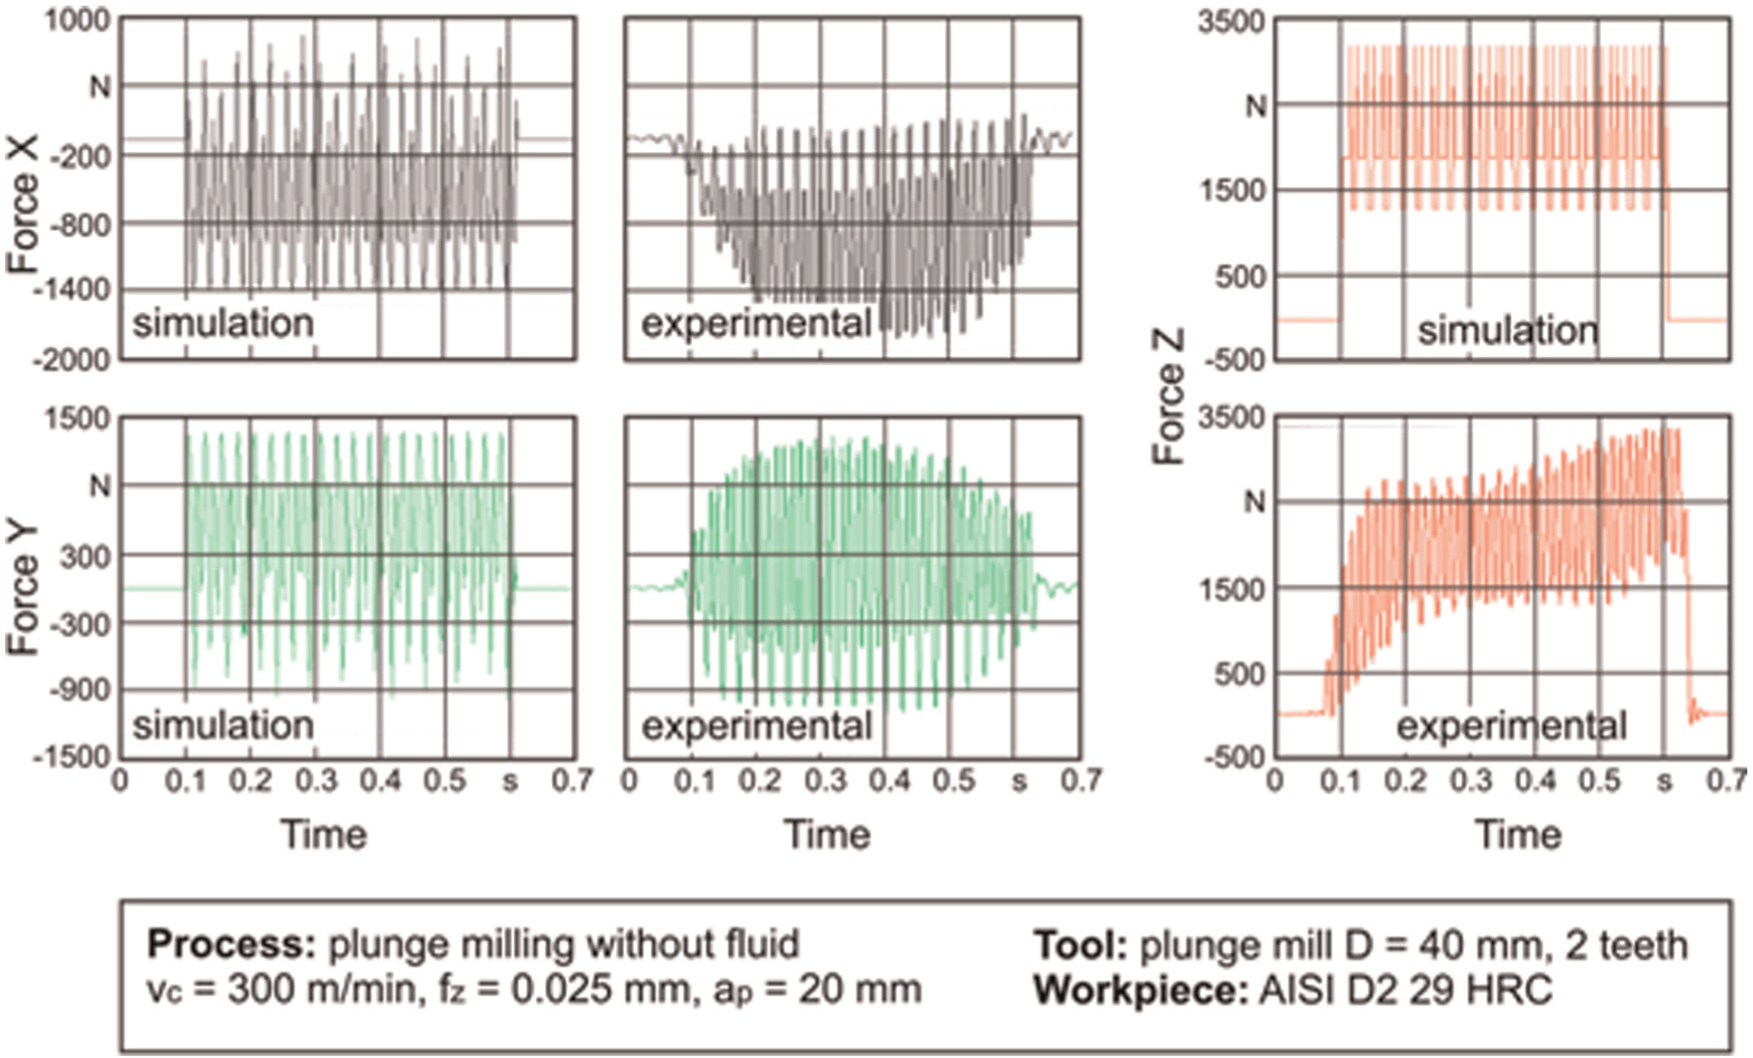
Simulated and experimental cutting forces in directions X, Y, and Z in M2.
In relation to the graphic shapes, experimental and simulated forces are in good agreement in all cases. Lower forces at the beginning and at the end of the plunge process in M2 are due to accelerations and decelerations of the machine. Displacements of the graphics upward or downward in M2 are mainly due to tool positioning errors. In this situation, more material has to be cut in a portion of the hole, and the resultant force vector becomes higher in a determined direction. In this way, percentage errors between simulated and experimental forces are calculated based on peak-to-peak force amplitudes, that is, the differences between maximum and minimum force values in each case (Table 2).
Maximum and minimum values of simulated and experimental cutting forces, as well as their percentage errors.
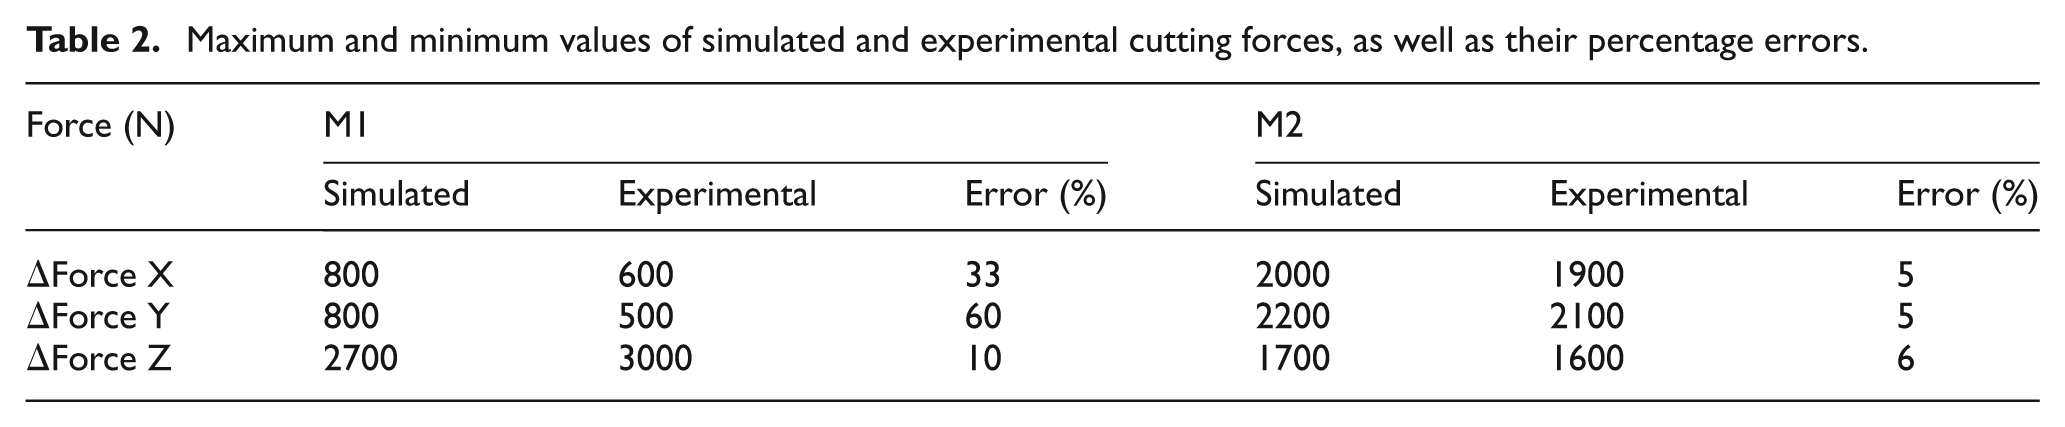
Most deviations occur because of vibrations associated with instabilities and with the dynamics of the process. Since the model does not consider the dynamic behavior of the forces, these variations cannot be captured. Other variations are related to errors by obtaining the cutting and edge constants.
A smaller rigidity of the workpiece clamp on the machine table contributes to variations in Forces X and Y in M1, when both inserts are in contact with the workpiece all the time. This justifies the higher deviations for these two force components: percentage error of Force X = 33% and percentage error of Force Y = 60%. In M2, the deviations are lower than 6% for all forces. Despite some deviations, the model is in good agreement with the experimental results when considering a stable cutting and can be used to predict and analyze the behavior of cutting forces in plunge milling.
A possible application for the developed model is in the analysis of the load acting directly upon the insert (Figure 13). The curves in the tangential, radial, and axial directions are analogous. The different inserts show variations only in amplitude (since the cutting areas are different) and in the oscillation period, since the contact angle varies due to the different radial positions of a given insert.
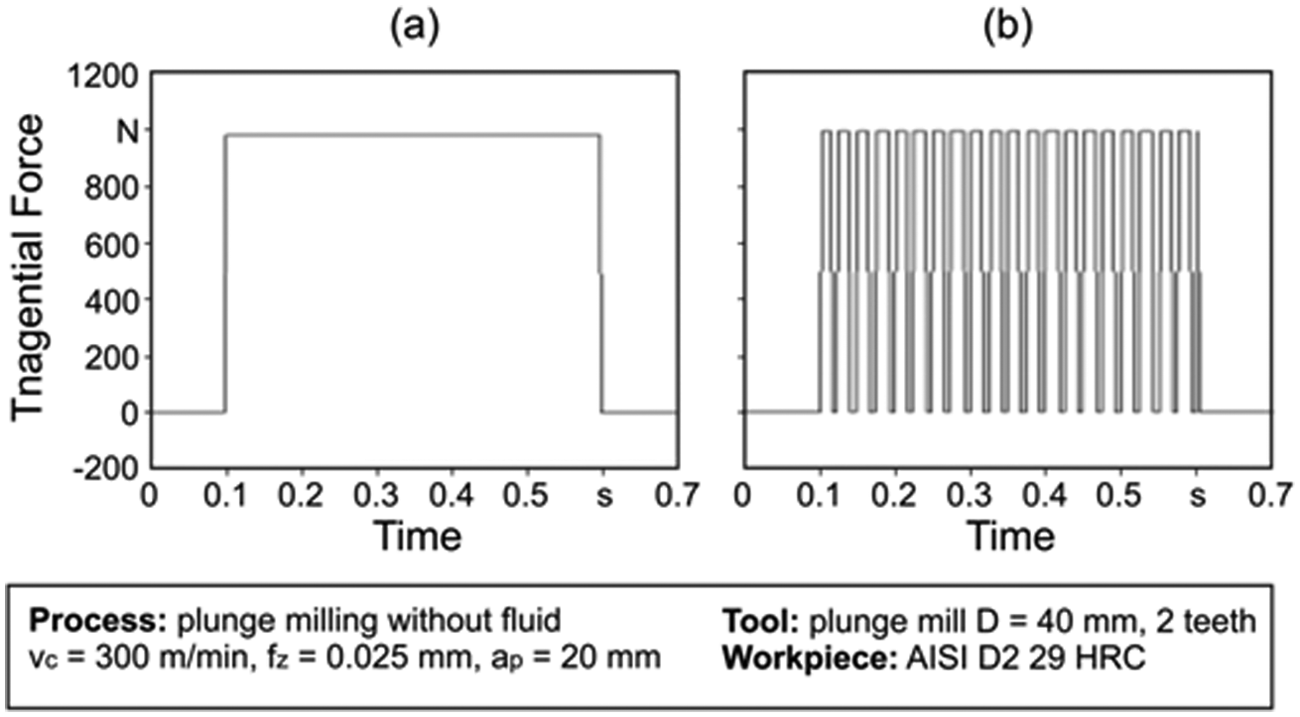
Simulation of the tangential force acting on the insert in a plunge operation: (a) “full” hole and (b) “half” hole.
In the first situation (“full” hole—Figure 13(a)), it can be seen that the load is constant, since the cutting area does not vary with feed or angular position. In the “half” hole (Figure 13(b)), a high amplitude oscillation is visible because the insert is not in contact with the workpiece material all the time.
The tool used here allows for high material removal rates, which generates high forces. Hence, these oscillations can be decisive in causing tool breakage. Moreover, one must take into account that interrupted cutting causes temperature variations, increasing the possibility of thermal cracking.
Thus, it is clear that reducing the interrupted part can increase the tool’s life if the main cause of its end is tool breakage. However, such a change increases the amount of material to be removed in semi-finishing and finishing operations.
The developed analytical model can provide a good estimative of cutting forces and flexibility in process design by simulating the forces for different process parameters, materials, and tool geometries. A recalculation of the edge and cutting constants according to Altintas’ method 13 enables the simulation of the force during milling different materials. Variations of tool geometry have to consider additionally an analysis of the cutting area.
Conclusion
The following conclusions can be drawn based on the results obtained in this study:
The behavior and magnitude of the force are dependent on the part of the pocket that is being cut, and the correct choice of cutting parameters for any given part can extend the tool’s life.
Tool flank wear has little effect on cutting forces.
Increasing the cutting speed from 300 to 500 m/min caused chipping of the peripheral insert, and this situation augmented the forces by 30%.
Considering the dynamics of the process, it can be stated that the system does not play an important role in directions X and Y, since the main cutting force frequency (related to the tooth passing frequency, in most cases) is far from the system’s main frequencies. Otherwise, in direction Z, vibrations produced by excitation of the system caused scratches on the bottom of the pocket.
Notwithstanding some deviations due to the dynamic behavior of the process, the model is in good agreement with the experimental results obtained in this study and can be used to predict cutting forces in plunge milling. Moreover, the model also serves to evaluate the mean load applied directly on the insert, thus helping to select suitable cutting parameters aimed at extending the tool’s life.
Footnotes
Declaration of conflicting interests
The authors declare that there is no conflict of interest.
Funding
This research was financially supported by FAPESP (São Paulo Research Foundation).