
Abstract
Porous titanium, characterized by interconnected and large open-cell structures, constitutes one of the most promising bone substitutes that are currently available for surgical orthopedic and dental implantation procedures. Since little is known about the behavior of this highly porous material during material removal operations, the main objective of this study was to develop a framework capable of evaluating the effect of cutting speed, cutting depth, and feed rate on the interplay between porosity and cutting force signatures, as experienced during microslot cutting experiments. The comparisons performed between optically determined porosity and cutting force profiles by means of standard random data analysis metrics (correlation coefficient, power spectral density, and coherence) revealed that the presence of a material discontinuity has a prevalent effect on cutting force variation in the case of micromilling processes characterized by (1) less intensive machining regimes and (2) larger cutter/workpiece engagement zones. The proposed methodology is useful in selection of the investigative approach to be taken in assessment of the micromachining-related behavior of highly porous foams subjected to micromilling operations.
Keywords
Introduction
Porous titanium is a class of metallic materials generally produced through specialized powder metallurgy processes. In the recent years, these materials have found multiple applications especially in the biomedical area due primarily to their excellent biocompatibility properties and enabled by their macroscopic porosity, lightweight, and high strength. Regardless of whether used as standalone materials or as coatings on the surface of solid structures, porous titanium is currently acknowledged as one of the most desirable materials in fabrication of orthopedic and dental implants.1–3
Although the end-products manufactured from porous titanium generally involve net-shape or near-net shape technologies, large fractions of them are subjected to secondary finish/machining operations before final use and assembly. 4 These secondary operations enable the attainment of dimensional and surface finish parameters that cannot be obtained directly through the sintering. 5 Also, there are numerous types of geometric features whose generation is practically impossible without the involvement of secondary machining operations. Under this category, one can find often listed narrow slots, bevels, threads, blind holes, or other types of reentrants whose direction does not coincide with sintering direction.
To further reinforce the ubiquity of secondary machining operations in the context of powder metallurgy components, Alizadeh 6 pointed out that approximately half of these parts will require some form of secondary material removal operation. The size of the components produced from porous titanium varies between large limits, but many of them, especially those intended for biomedical purposes, tend to be relatively small in size. As a result, micromachining technology represents one of the attractive solutions that can be used to meet the high-quality constraints demanded by these products.
In this regard, extensive research efforts have been directed toward understanding of the multifaceted phenomenology associated with machining 7 or micromachining of solid materials.8,9 One of the most common topics in prior studies on micromilling consists of the development of accurate cutting force models, and numerous developments were reported in this field.10–14 While in some cases, the researchers were preoccupied to explicitly determine the influence of process parameters like cutting tool radius, feed rate, spindle angular velocity, and number of flutes on cutting force signature, 15 in other studies, the interactions between cutting forces and process parameters were assessed in a rather indirect manner in an attempt to control surface finish, burr formation, or tool wear.16,17 Obviously, the underlying assumption of all these studies is that the material is characterized by continuum spatial properties, which is not the case of porous titanium, in which cutting edge engagement/cutting forces vary because of the primary rotational motion of the tool and the material voids.
To further this idea, it can be mentioned that the surveyed literature revealed a relative paucity of studies capable of addressing the complex problems of micromachining when cutting materials with discontinuities. The few attempts made so far have managed to emphasize that the use of tools whose sizes are comparable with pore dimensions constitutes the root cause of a whole new set of challenges related to process stability, cutter durability, and machined surface characteristics. In this sense, Chen et al. 18 have concentrated their investigations on the combined effects of tool geometry, tool material, work material properties, and machining conditions on smearing of porous tungsten surface, a phenomenon that negatively affects the functional performances of the dispenser cathodes typically manufactured through face contour turning operations. Their study concluded that cutting edge radii and cutting force values represent two key factors with impact on surface smearing and defects. In a separate study involving micromilling of porous tungsten copper alloys used in micro electrical discharge machining (µEDM) tools, Uhlmann et al. 19 concluded that tungsten grain diameter, particle distribution of the metal bonding phase, and the fraction of the bonding phase represent the main material features to be accounted for when establishing the parameters of the micromachining process that in turn affect both cutting force magnitude and final roughness of the generated surface. Since the use of the micromilling force in a process-averaged sense is unable to provide significant insight on cutting force/workpiece microstructure interactions, Vogler et al. 20 performed a series of micromilling trials on ductile iron, which is a multiphase material composed of three distinct metallurgical constituents: graphite, ferrite, and pearlite. By means of a mechanistic cutting force model, the authors have demonstrated that cutting force signature is in fact strongly correlated with local microstructural constitution of the material encountered along the tool path. Their estimations were that for the particular case of micromilling analyzed, the microstructural effects account for more than 35% of the energy of the cutting force signal generated.
Although porous titanium could be regarded—at least to some extent—as a special case of biphase material in which the second phase consists of voids/air, a direct extrapolation of most of the previous results is not possible, especially due to the large differences in volumetric fractions of various constituents of the multiphase materials, combined with the large size of the voids present within the micromilled porous samples, which typically around 350 µm on average. As shown in a prior study, 21 porosity distribution influences the amplitude of the cutting forces in a direct manner that can be outlined by simply comparing cutting force signatures obtained while micromilling porous and continuous samples involving the same base material. However, based on the reviewed literature, it is reasonable to expect that in addition to the aforementioned porosity distribution, the process parameters themselves also play a role on the amplitude of the cutting forces. As a result, the current study aims to develop a framework for the assessment of the impact of primary process parameters on the dependence between porosity and cutting force signatures during micromilling of porous titanium. The investigation to be detailed further is performed by means of appropriate statistical measures. While cutting force signature was determined through classical dynamometric measurements, a previously developed optical-based method has been employed to establish a porosity profile along the cutting tool path. 22
As it will be reiterated later in the text, the primary objective of the study is to assess—from a rather qualitative perspective—the effect of several important micromilling process variables on the amount of correlation between porosity and cutting force signatures seen here as unique input and output variables into the machining process. In this context, all investigated and otherwise conventional machining parameters (spindle speed, chip load, tool size, and cutting depth) will be treated as simple “noise” on the aforementioned correlation that is to be tested with some spaced apart values of the “noise” contributors.
Factors affecting cutting force signature in micromilling of porous titanium
Porous titanium is characterized by a highly interconnected network of voids (Figure 1). Pores have variable sizes—typically ranging between 50 and 400 µm—characterized by random shapes and nonuniform volumetric distributions. As a requirement imposed by biomedical applications, pores have to be open to outer surfaces and form an interconnected network in order to facilitate the osteointegration process. When micromilling is performed with tools ranging from 200 to 800 µm diameter, their cutting edges engage frequently the solid titanium material, but the duration and repeatability of the engagement are low and hence relatively difficult to predict. This intermittent contact between cutting tool and solid titanium creates the premises of material removal operation, and a number of theories have been proposed to describe its intrinsic mechanisms. 21
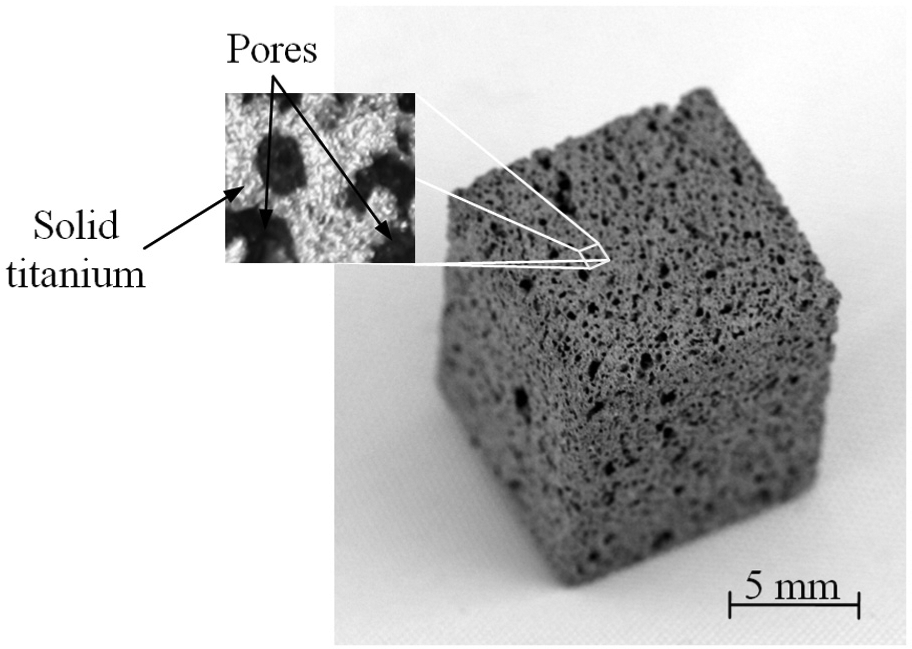
Sample of porous titanium outlining its porous nature.
Porosity distribution along the tool path
As mentioned above, numerous models for cutting force prediction in micromilling of solid materials have been proposed in the past. Most of these models are formulated by assuming a predictable circular cutting edge trajectory as obtained from Martelotti’s approximations of real trochoidal curve. 23 Analytical calculations of the instantaneous magnitude of the cutting forces are possible based on their implicit direct proportionality with the area covered by cutting edges of the micromill.10,24 An inherent assumption of material continuity underlies this approach.
However, when micromilling is used in finishing operations performed on porous materials, the cutting edges of the tool are engaged only for a limited amount of time, such that many of the solid material cutting assumptions are no longer valid. Since during finish micromilling, pore profile does not change significantly with depth, the volume of material removed in each tool revolution can be estimated with an acceptable precision based on the amount of porosity determined at the top of the surface to be machined. Without losing the generality of the proposed approach, all subsequent considerations are made in the assumption of a two-flute cutter.
As shown in Figure 2(a), the area swept during ith tooth revolution (Ai) represents in fact the difference between the semicircular surfaces covered by two consecutive cutting edge trajectories Ti−1 and T i . According to cutting kinematics, the maximum distance between any pair of successive cutting edge trajectories is equal to feed/tooth value (f). No difference between the area swept (Ai) and removed (Si) during ith tooth revolution exists in micromilling of continuous materials (Figure 2(b))
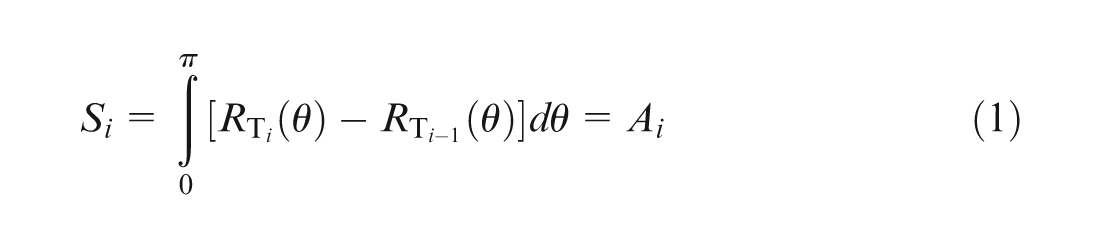
where
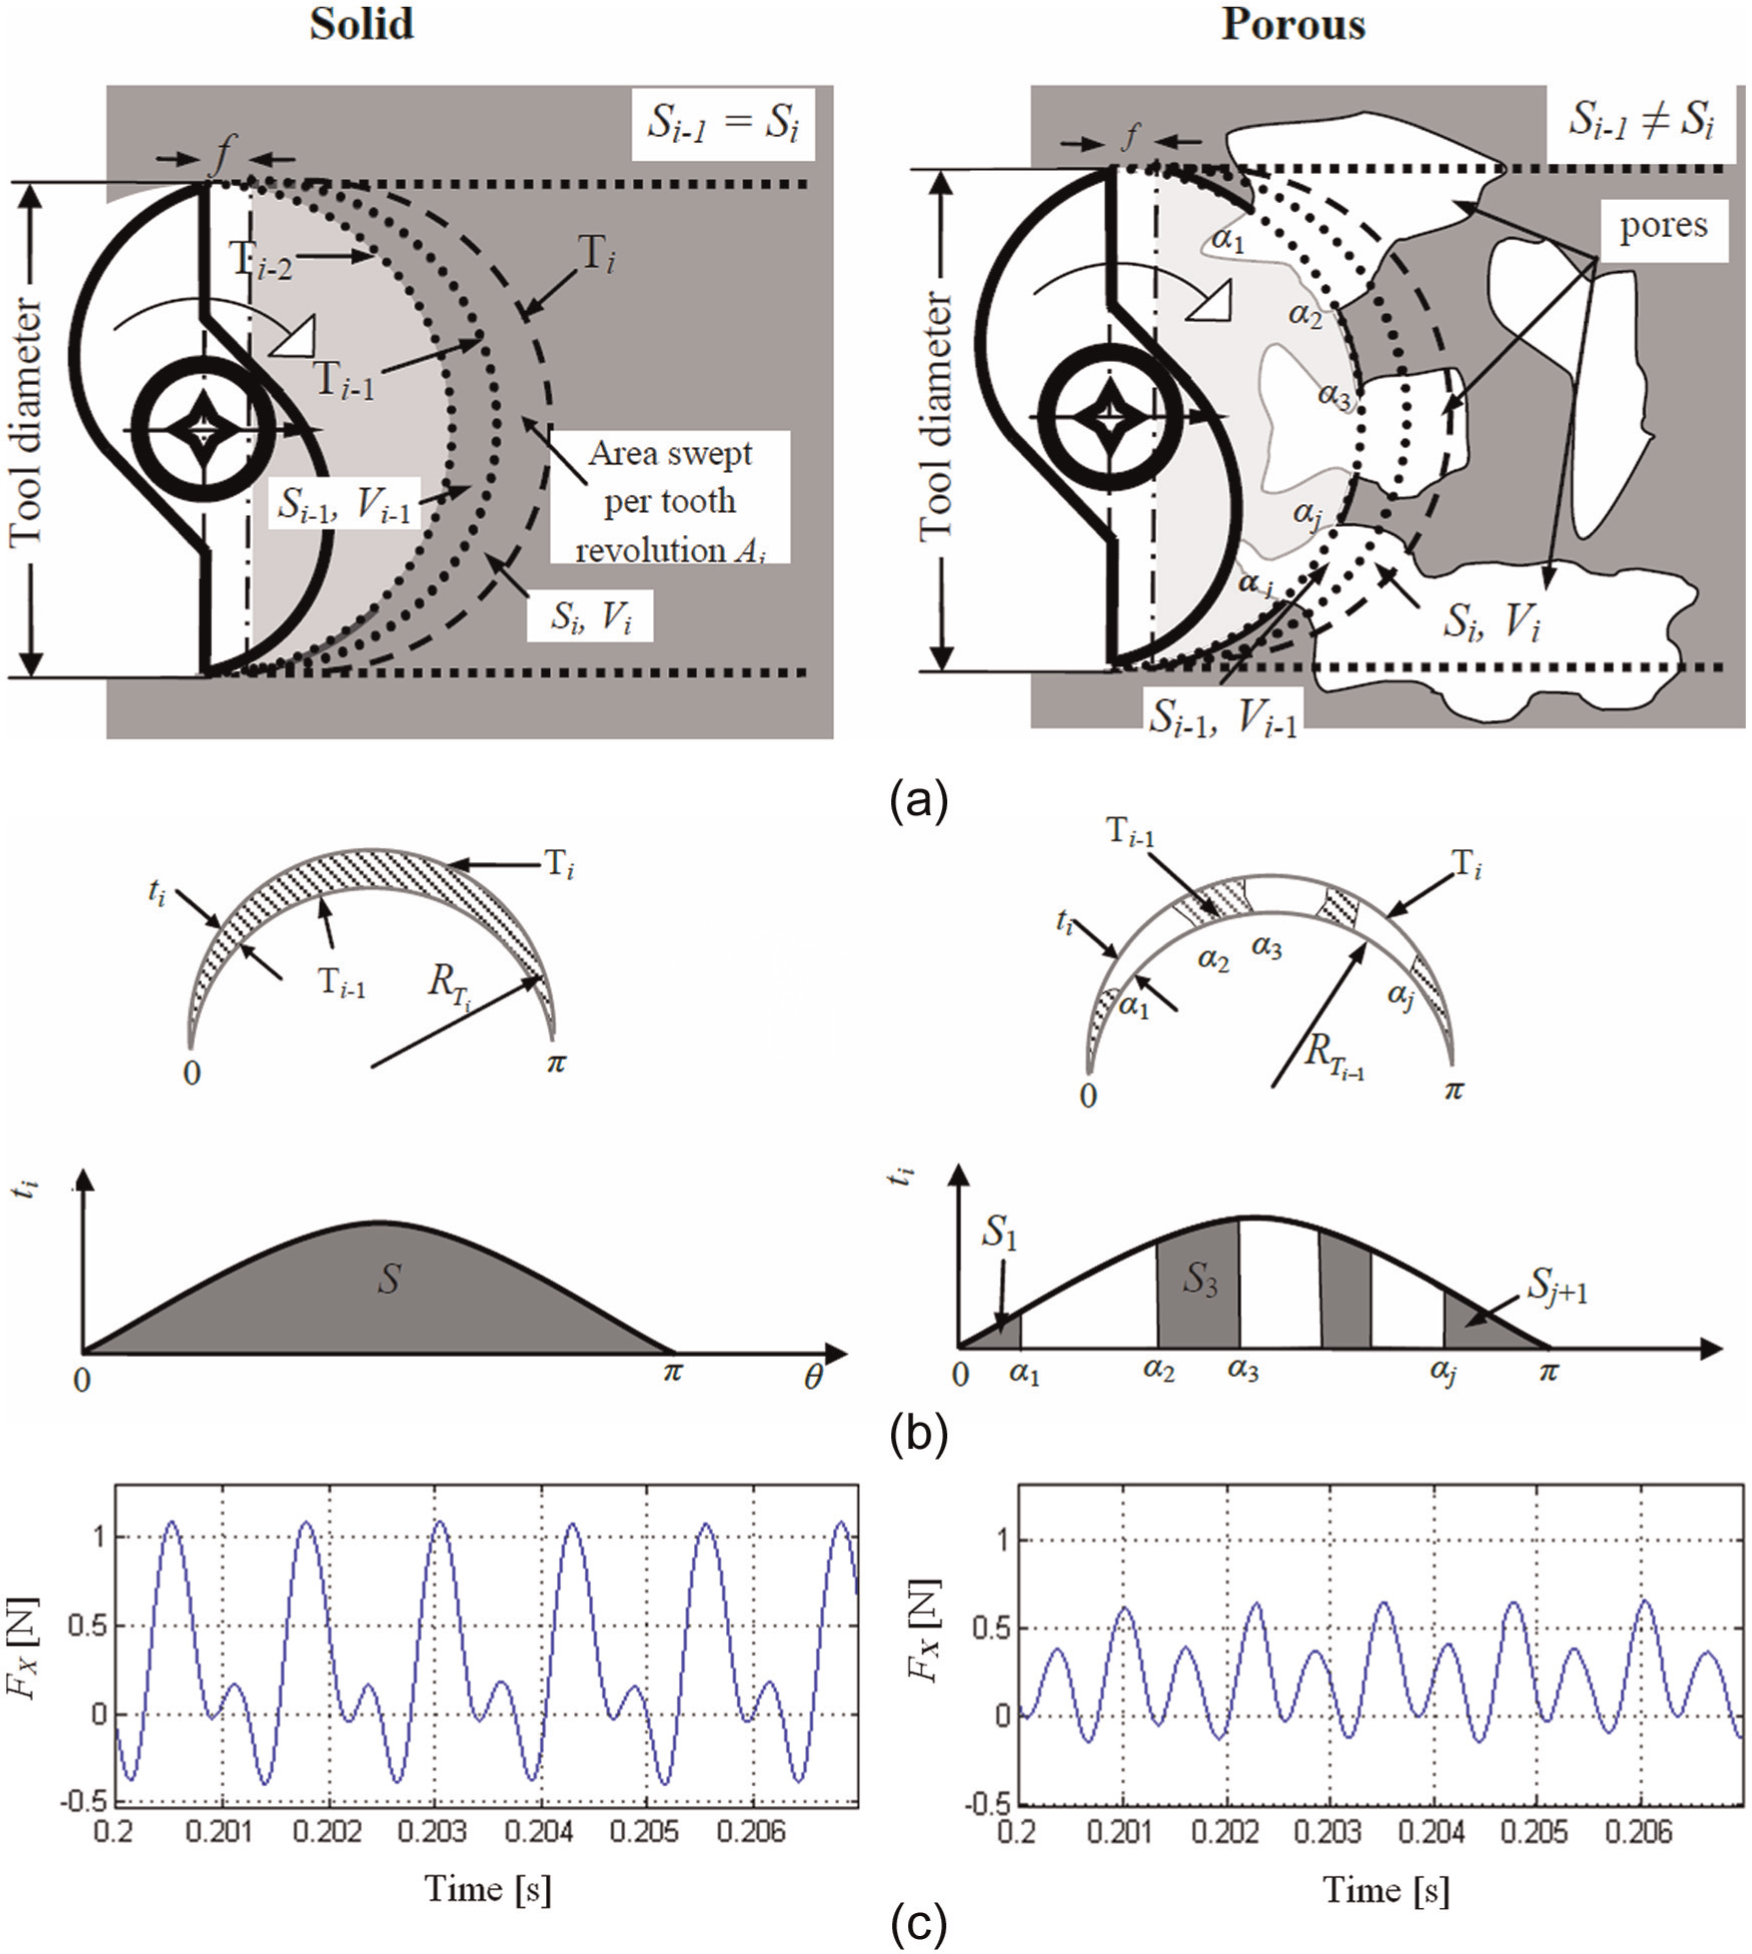
Comparisons between solid and porous titanium micromilling: (a) schematic of the cutting edge trajectory, (b) schematic of the amount of material removed per tooth revolution, and (c) experimental samples of cutting force signature in time domain.
By contrast, when micromilling is performed with identical process settings on porous titanium, only pure geometric parameters, like Ai, preserve their values over the entire duration of the operation. The amount of material removed, whether measured in two-dimensional (2D) (Si) or in three-dimensional (3D) (Vi) changes continuously for each new revolution of the tooth, since it is determined by the relative fraction between solid material and voids (pores) contained within Ai
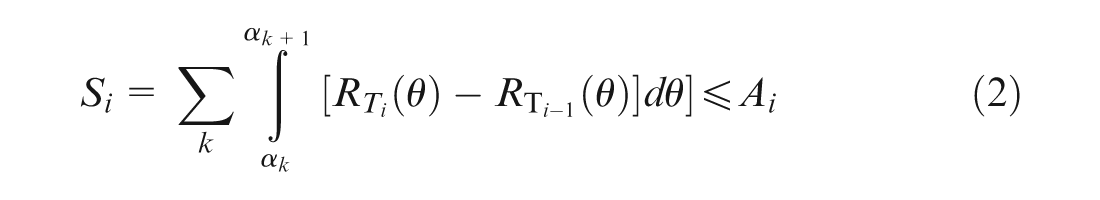
where the area delimited by αk, αk+1 angular parameters and Ti− 1, T
i
curves encompasses solid material only. The radii
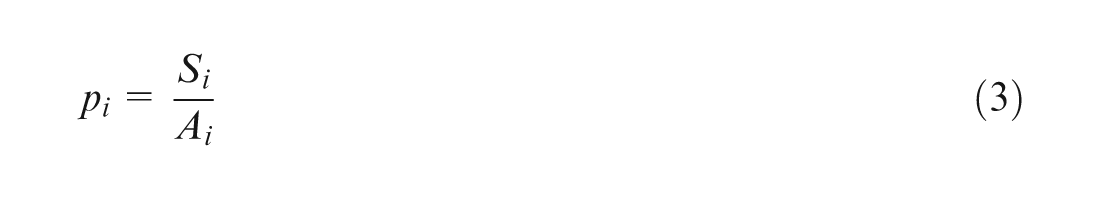
with pi∈ [0, 1]. Here, pi = 0 corresponds to no material removal and pi = 1 corresponds to solid material cut (i.e. no pores in Ai). Based on these conventions, smaller pi values indicate larger porosities, while larger pi values are associated with smaller porosities. It is perhaps of importance to note here that in the “small depth” micromilling context of this work, the standard definition of porosity as a measure of the volumetric fraction of voids has been reduced to its areal correspondent. Since it is reasonable to believe that the magnitude of cutting force per revolution is actually proportional to the amount of material removed, it can be inferred that in porous material micromilling, cutting force signature will in fact correlate with pi. Samples of cutting force variation as measured on x-axis during micromilling of solid and porous titanium are shown in Figure 2(c).
Figure 3 depicts a direct comparison of the resultant cutting force FR as measured along tool path during micromilling of solid and porous titanium. The resultant force FR was determined as an absolute mean value over one complete tool revolution, and it was plotted as a function of cutter location position (l). By converting the porosity distribution along tool path into spatial domain variation of pi through image analysis, it was shown that significant correlations exist between porosity and cutting force signatures.21,22
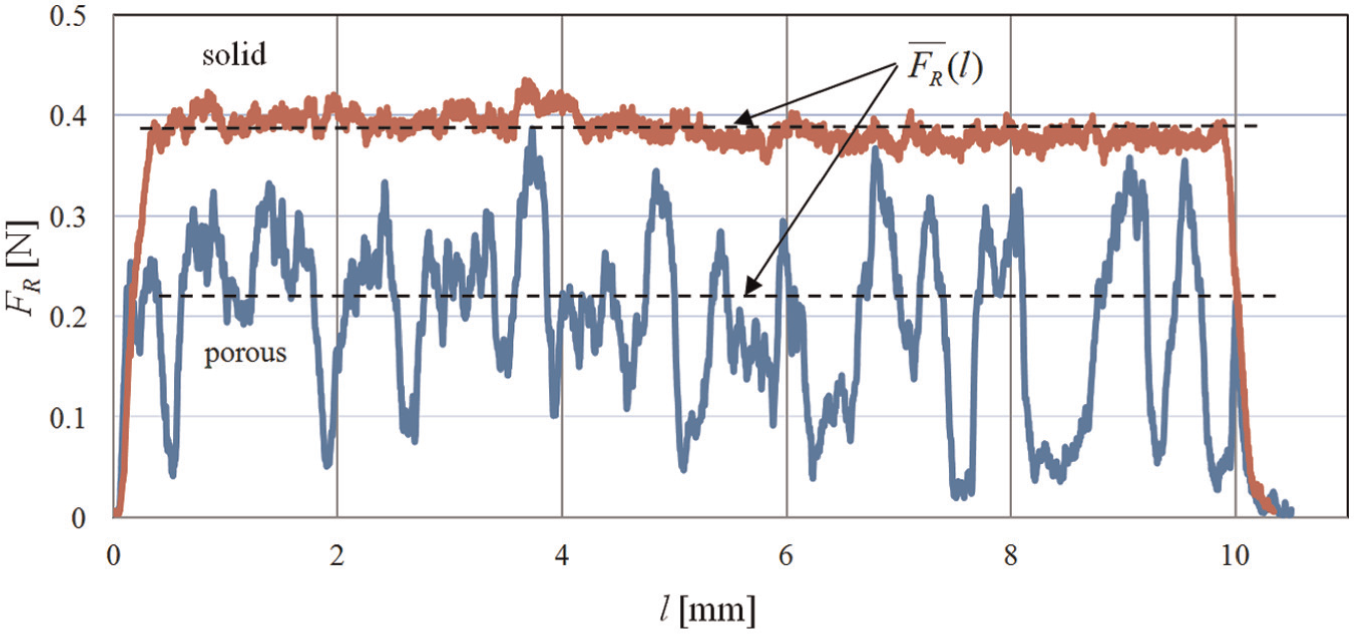
Experimental sample of resultant cutting forces FR during micromilling of solid and porous titanium.
The comparison between porous and solid material micromilling suggests that the presence of the voids within the volume of the material decreases the overall mean cutting force (dashed line), and this overlaps with large oscillations of their values around the average amount, whereas micromilling of solid titanium is accompanied by small cutting force variations. The phenomenon is more evident in the stable cutting region that practically excludes the two ends of the tool path and their associated progressive material engagement/disengagement zones.
Other parameters with impact on cutting force signature
Since the correlation between porosity and cutting forces never reaches 100%, it can be assumed that other factors influence the cutting force signature. Among them, process parameters related to the overall dynamics of the micromilling operation (cutting speed, feed rate, cutting depth, and so on) constitute an obvious choice, since their impact on cutting forces experienced during machining of solid materials is well known. Furthermore, these parameters also influence the local response of the material when subjected to machining conditions.
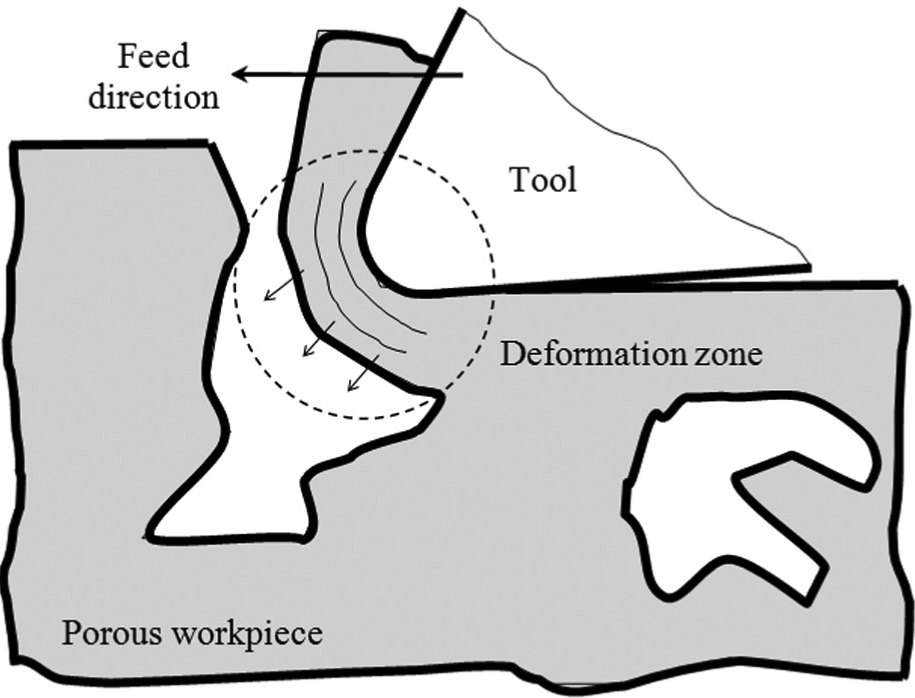
Similar to macroscale machining, micromilling is a process caused by the shearing of the material along the slipping planes induced by the cutting edges of the tool. When material has a homogeneous structure, shearing happens only along known and controlled directions within micromilled material, such that the two-sided edges of the microslot are always parallel to main feed direction imposed by machine tool stages. By contrast, the microslots generated during the micromilling of the porous materials are characterized by highly irregular track boundaries, especially in zones adjacent to large voids (Figure 4). This phenomenon is probably caused by a brief but uncontrolled material removal determined by a spring back–like effect induced by the sudden variation of the radial cutting forces acting on the circumference of the tool. To further explain this, it will be reminded here that during common slot milling operations (180° tool engagement) performed on solid/homogeneous materials, the tip of the tool is typically deflected in a direction opposite to the feed. However, when a portion of the semicircular contact between tool and material is missing because of an adjacent void, the unbalanced radial forces tend to push the cutter toward the core of the pore. It is very likely that this effect is exacerbated by both the dynamics of the process and the intrinsic elasticity of the machined material. The alternation of cutter engagement/disengagement conditions that is specific to porous materials has an important effect on cutting force signature. From an observational standpoint, the aforementioned spring back effect seemed to be more pronounced for small-sized tools when used in the proximity of large pores.
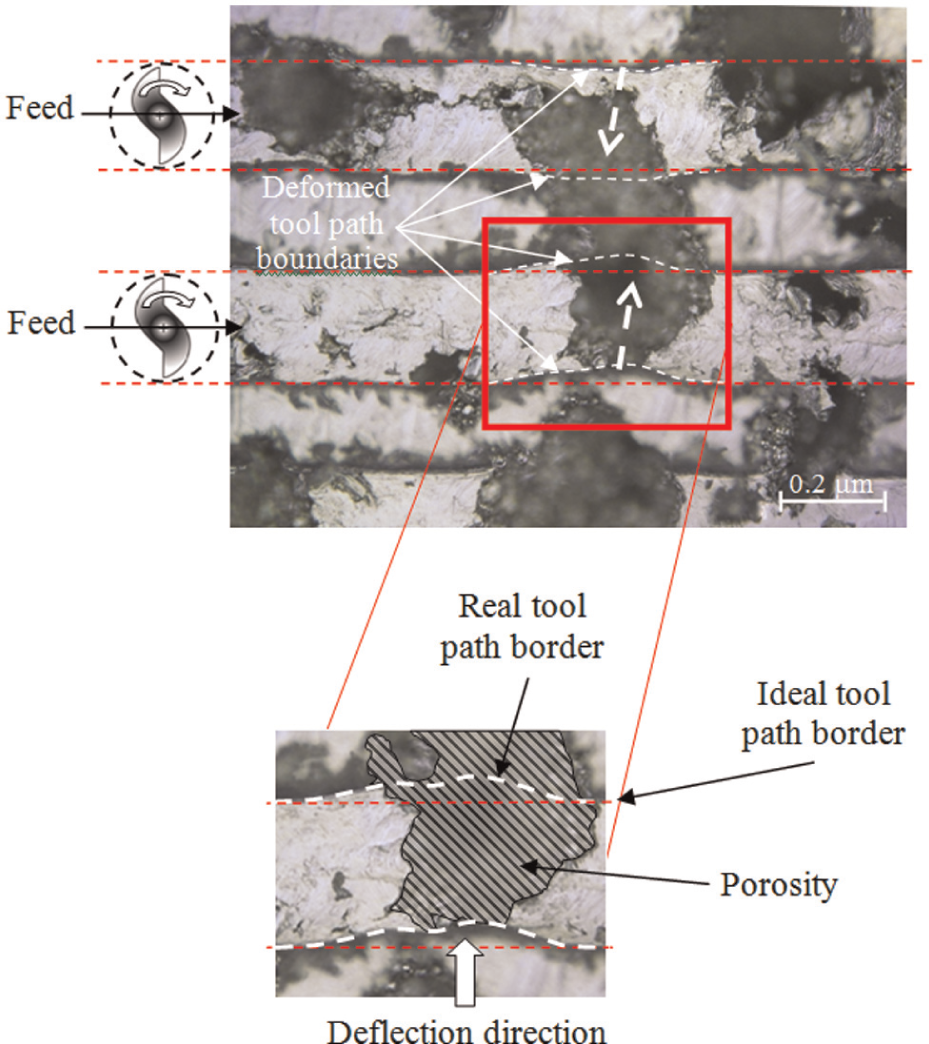
Tool path irregularities caused by large voids.
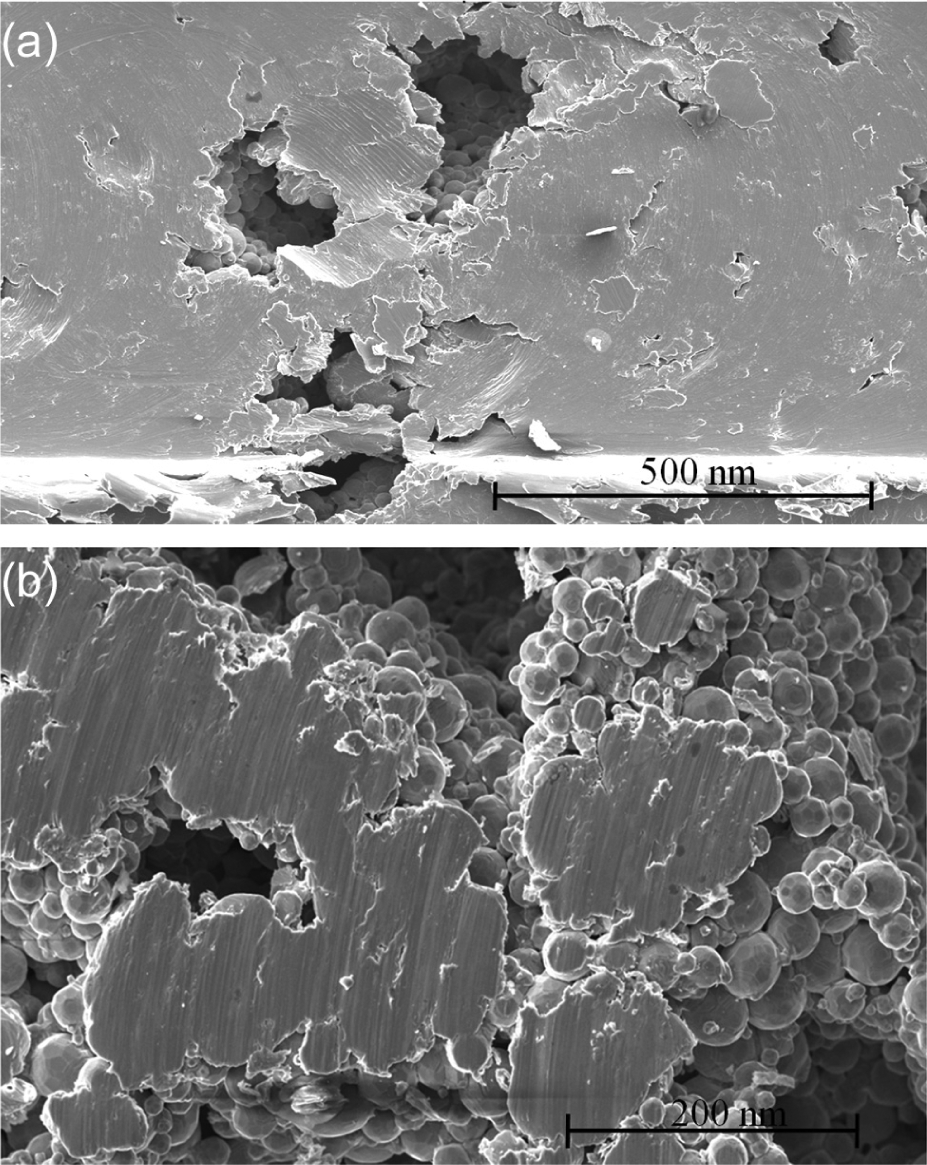
However, shearing is not the only phenomenon responsible for material removal during porous titanium micromilling. A more in-depth analysis of the microstructural configuration of the material reveals that this material is actually composed of a large number of interconnected porosities between which clusters of spherical particles of sintered titanium can be observed (Figure 5). As a result, material removal can also occur due to microparticle breakout/detachment, in which case, cutting forces will deviate from their regular pattern of variation. The porous structure of the titanium sample is also responsible for random changes in the amplitude of the cutting forces induced by sudden collapses of the porous structure under cutting tool tip pressure (Figure 6).
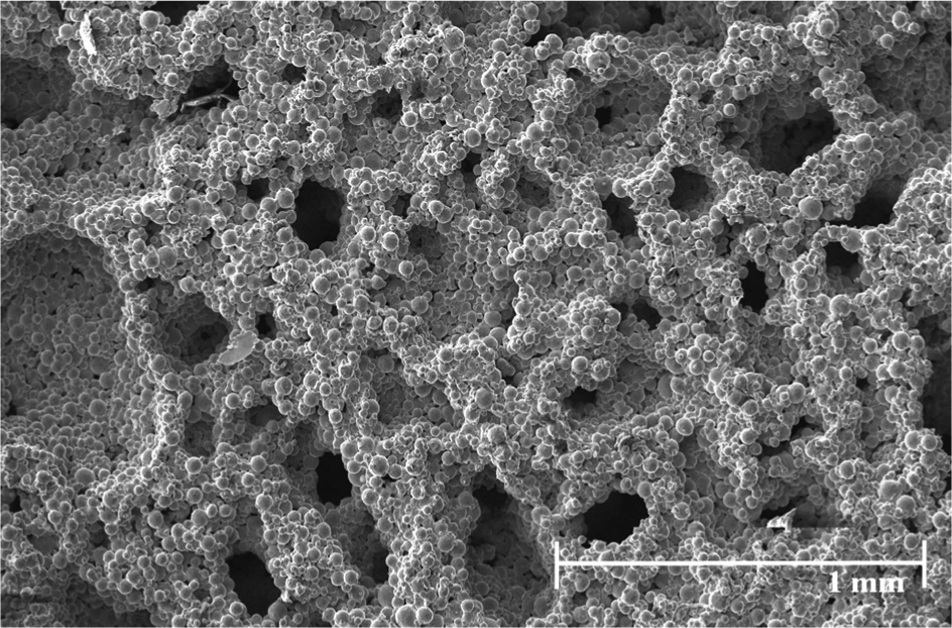
Scanning electron microscopy (SEM) micrograph of porous titanium revealing its highly interconnected void structure.
Porosity collapse under cutting tool tip pressure.
Experimental equipment and methodology
Experimental analysis was performed to investigate the effect of different cutting parameters in micromilling of porous titanium by carrying out real-time cutting forces and motion data measurements. The data acquired were subsequently used to synchronize the resultant cutting force values with space domain, such that its statistical comparisons with porosity profile encountered along the tool path become feasible.
Material investigated
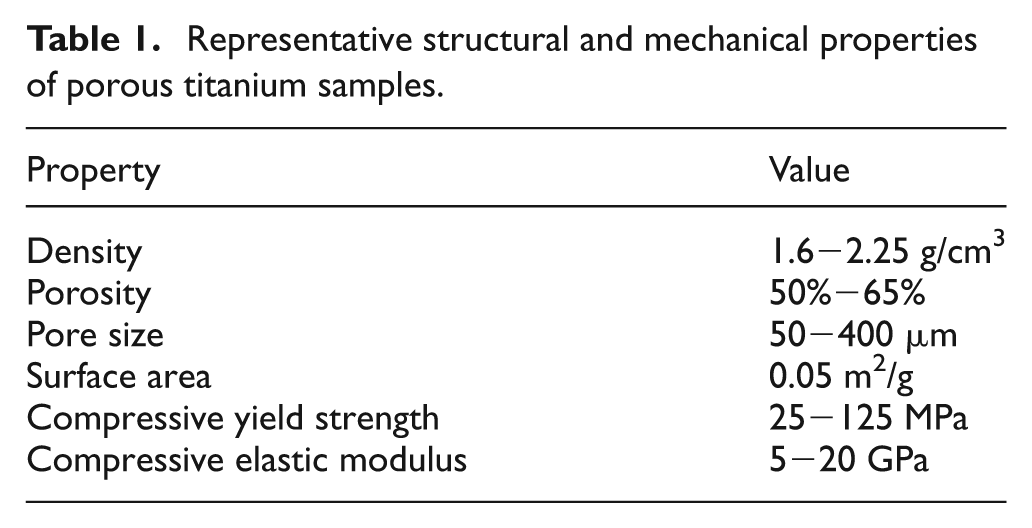
Porous titanium samples used in this study were manufactured by the Industrial Material Institute of the National Research Council of Canada (Boucherville, Quebec) through a proprietary powder metallurgy procedure. 25 A commercially pure titanium powder (commercially pure grade 1 titanium) was used as raw material in the sintering process. The structural and mechanical properties of the samples used in micromilling experiments are presented in Table 1. The pieces to be machined were provided in cubic shapes with an approximate side length of 13 mm (Figure 1).
Representative structural and mechanical properties of porous titanium samples.
Micromilling equipment
A custom-built five-axis computer numerically control (CNC) micromilling system (Figure 7) was used to perform microslot cutting experiments. The system is equipped with an air-bearing spindle capable of rotational speeds between 5000 and 100,000 r/min. The micromilling system was characterized by a maximum travel range on x- and y-axes of 300 mm and a static positional accuracy of 1 µm.
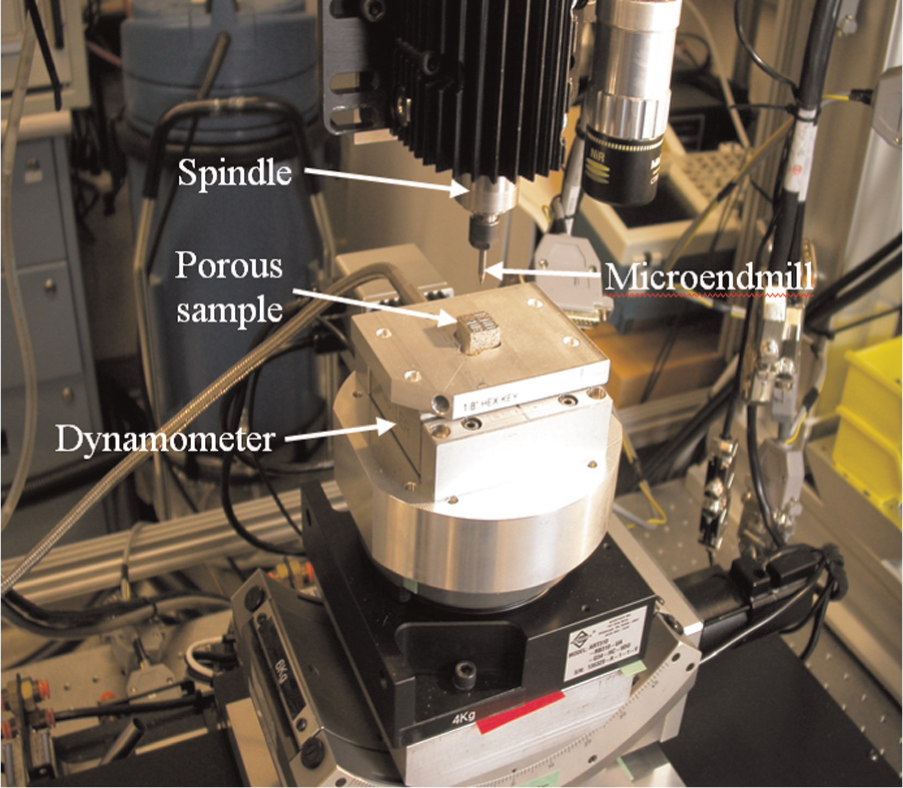
Experimental setup used for cutting force measurements.
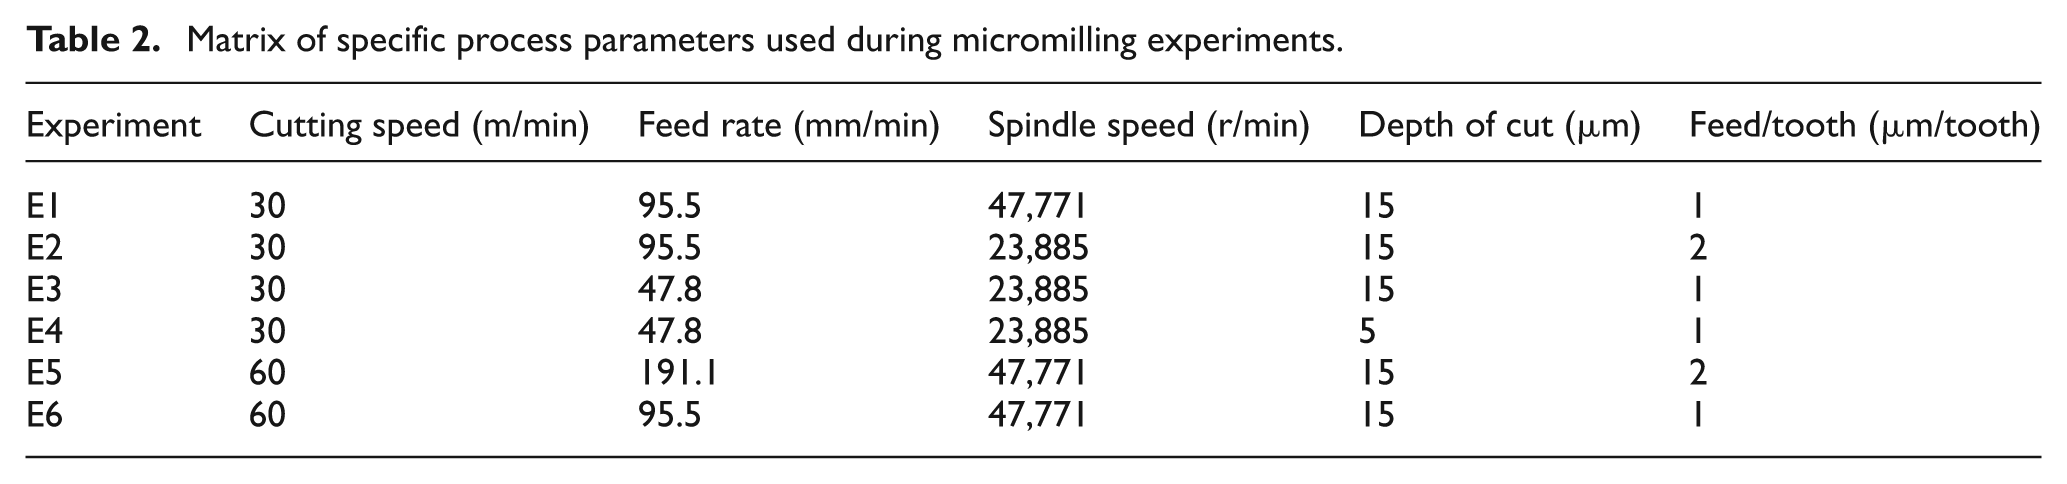
Cutting experiments were performed with two-flute, uncoated, tungsten carbide flat-end micromills with diameters varying between 200 and 400 µm. Their helix and clearance angles were 25° and 6°, respectively. The microslots cut were placed on the top face of cubic titanium samples, and their geometry was defined by a constant length of 10 mm and depths varying between 5 and 15 µm. Six microslot cutting experiments were performed, and a detailed breakdown of their process parameters is presented in Table 2.
Matrix of specific process parameters used during micromilling experiments.
Experimental determination of cutting force signature
An in-house developed data acquisition system for micromilling cutting force was used in this study (Figure 8). The three orthogonal cutting force components were measured with a Kistler dynamometer (type 9256C2) connected to a Kistler dual mode charge amplifier (type 5010B). The signals outputted by positional encoders connected to the three translational stages of the machine tool were measured in real time along with the three-phase current consumed by the spindle drive. Since the energetic requirements of the micromilling experiments performed within the scope of this study were relatively low, a minimal current variation accompanies the engagement of the microcutting tool with porous material. Because of this, it was assumed that time domain synchronization of the spindle current remains virtually unaffected by the cutting load.
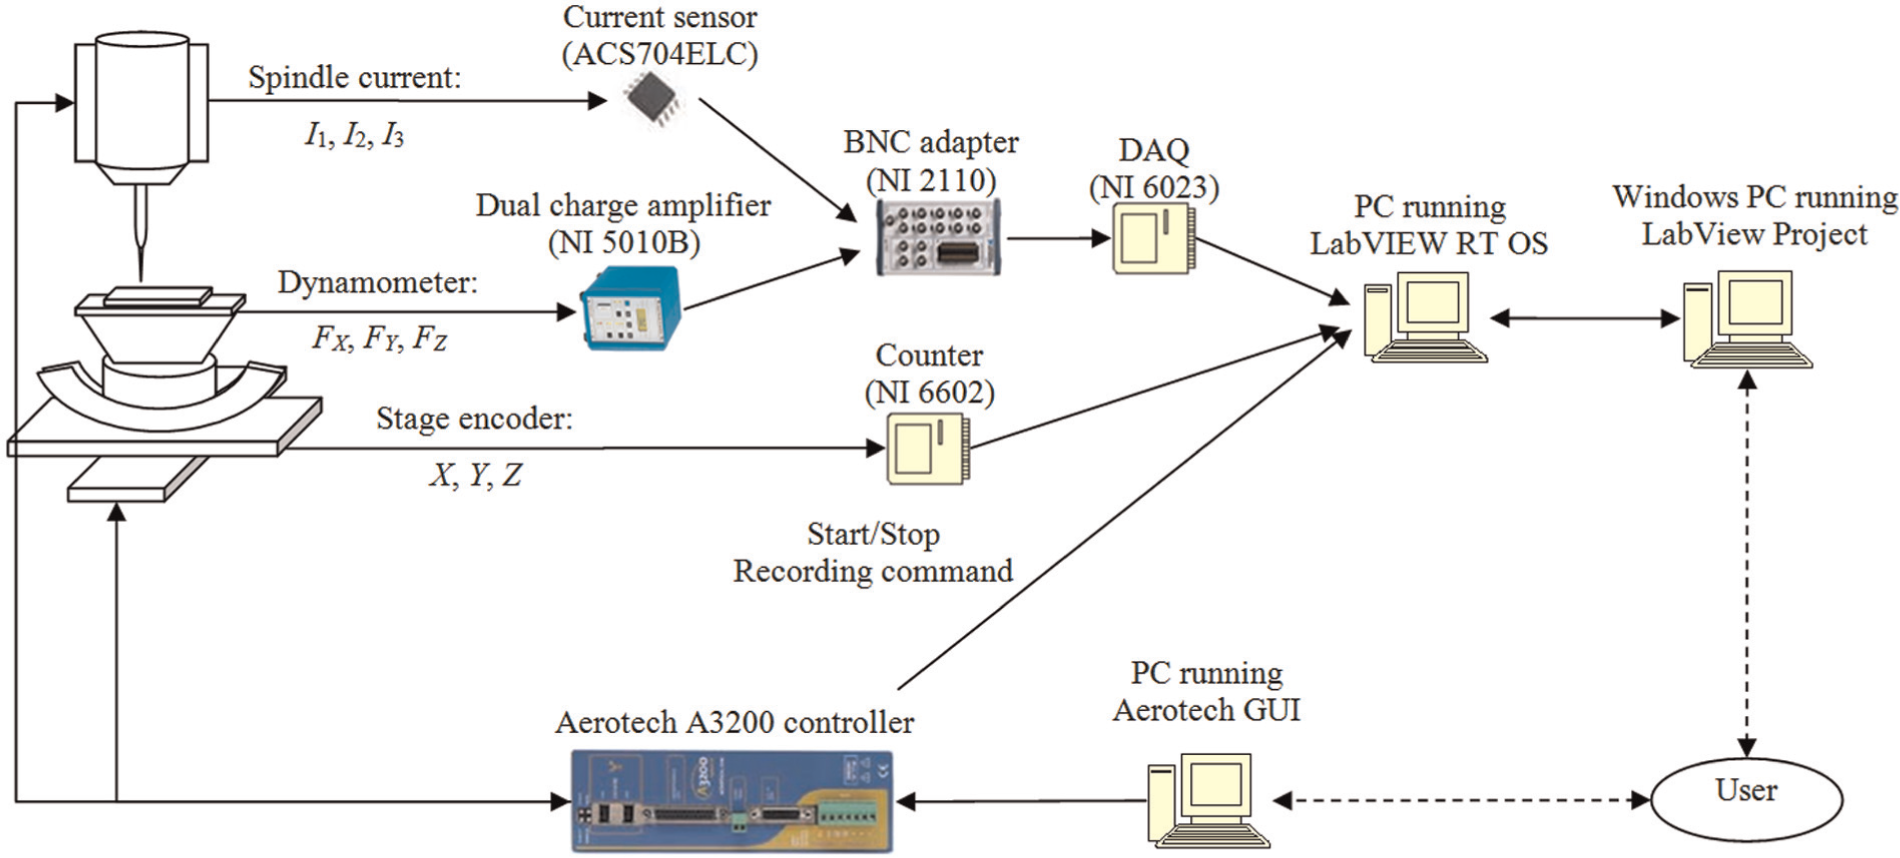
Cutting force DAQ system.
Cutting force components FX(t), FY(t), FZ(t), and spindle current I(t) were recorded in real time with a sampling frequency of 25 kHz and a threshold value of 0.002 N. The raw values of the measured cutting forces were averaged over each cutter revolution. The beginning and end of each revolution were precisely determined based on the time variation of one phase of the spindle current (Figure 9). In addition to the measured FX and FY components, a resultant cutting force FR was determined through their vectorial summation. The measured cutting forces were filtered out beyond the resonance frequency of the dynamometer of approximately 4.8 kHz.
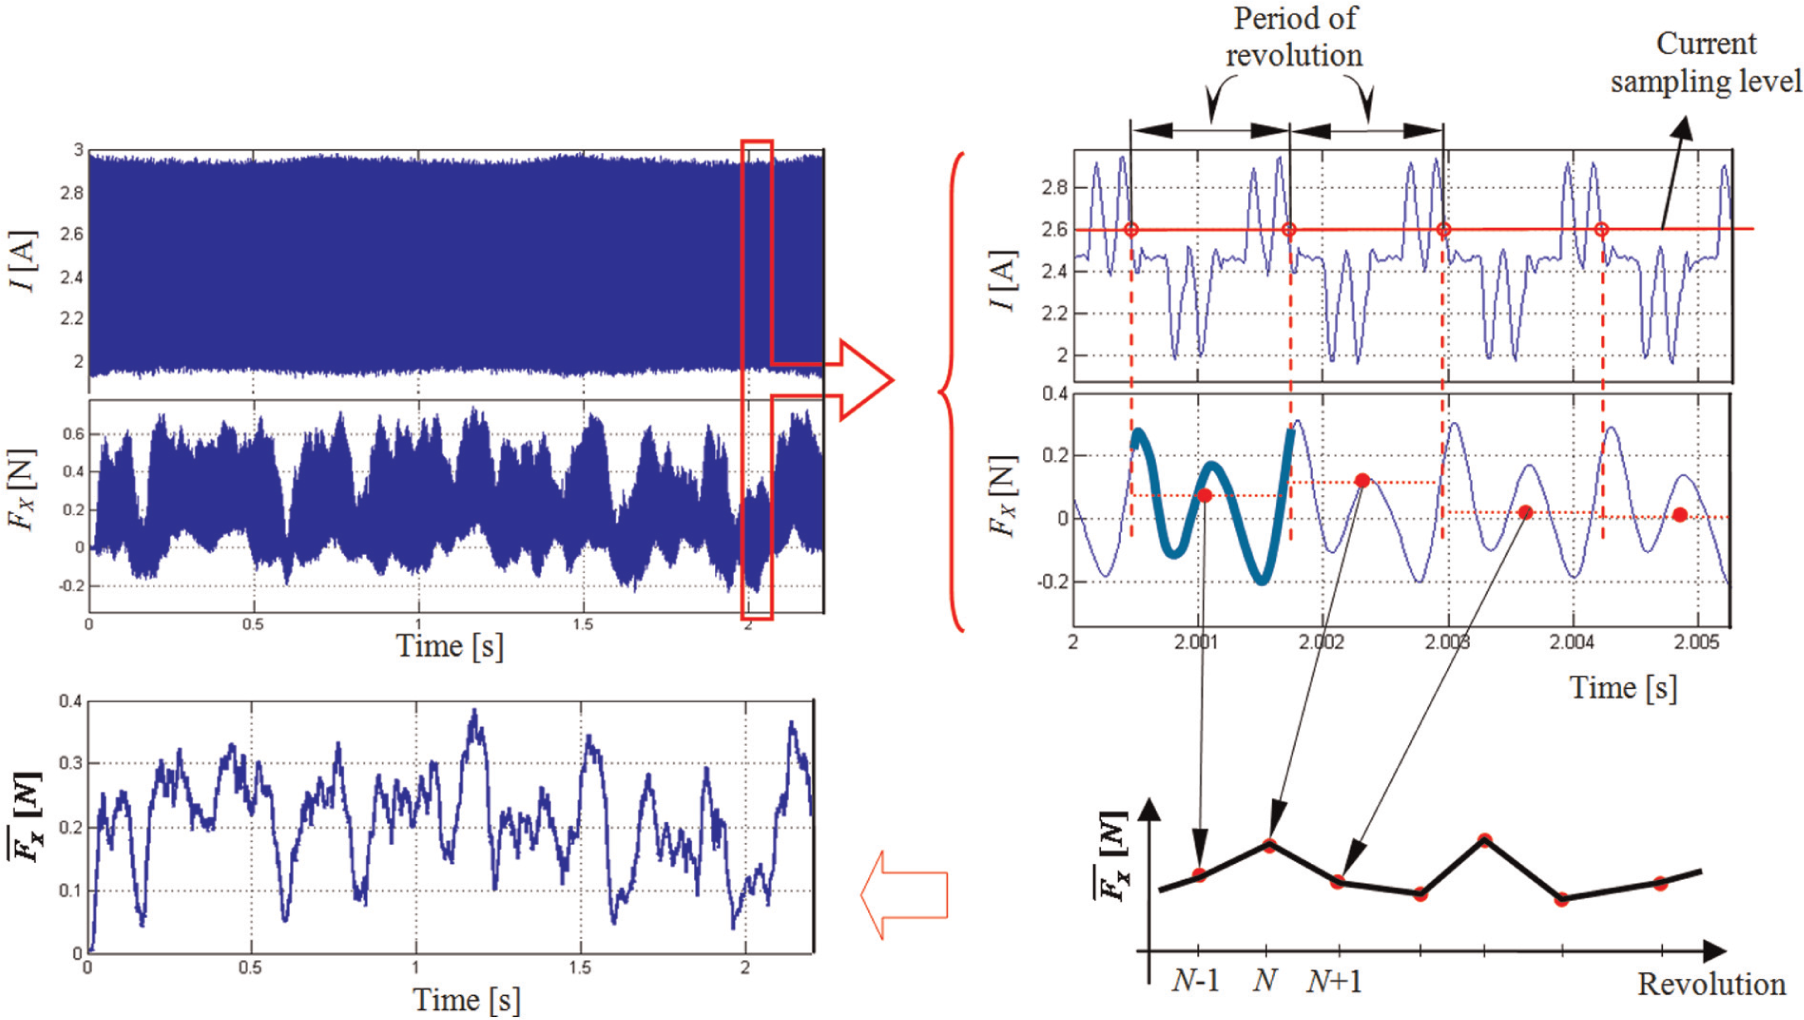
Schematic of cutting force signature determination.
Optical determination of porosity
The current study relied on an accurate method of porosity determination based on optical micrographs captured with a Wyko interferometric microscope. The images generated by the optical profilometer have a higher resolution than optical cameras and provide complete topographic chart of the analyzed surface. Since this study is focused on finish micromilling operations with depths of cut relatively small (<15 µm), it was assumed that the voids do not have significant cross-sectional changes in horizontal XY plane. Because of this assumption, porosities measured on initial (unmachined) and final (machined) surfaces were presumed as being dimensionally equivalent in XY plane, since minimal pore shape changes were noted between initial (raw) and final (micromilled) surfaces. While this assumption might be regarded as somewhat debatable since the volumetric distribution and shape change of the porosities throughout the sample are absolutely random, their noninvasive volumetric (in depth) investigation/quantification performed with high accuracy before micromachining continues to remain a challenge for the technology available today.
While other types of machining operations—typically belonging to the macroscale domain—are capable of generating significant porosity closures with important functional consequences,18,26 no comparable effects were noted during the micromilling experiments performed within the context of this study. However, while micromilling-induced smearing seems to be small, some local damage around the pores was generally noted in the form of small cracks or machined surface collapses (Figure 10(a)). Depending on the relative distribution and sizing of the pores, the local micromachining of the individual particles sintered together within the foam might become visible (Figure 10(b)).
Micromilling effects on porous titanium surface: (a) local surface damage developed around pores and (b) local material removal off sintered particles.
In this work, a number 10 objective and a field of view (FOV) of 0.5 were used to generate a 1.9 µm sampling resolution of the optical profile acquired by the system. The micrographs acquired with optical profilometer include different colors that are correlated with vertical location of each point of the analyzed surface (Figure 11(a)). The initial pictures were subsequently converted to gray scale (Figure 11(b)) and then binary images (Figure 11(c)) to define porosity contour. This conversion was performed using Otsu’s 27 technique. The resulting images were subsequently filtered out to ensure that only surface recesses deeper than 3 µm were regarded as pores. Further details on the imaging technique used can be found in the study by Abolghasemi Fakhri et al. 22
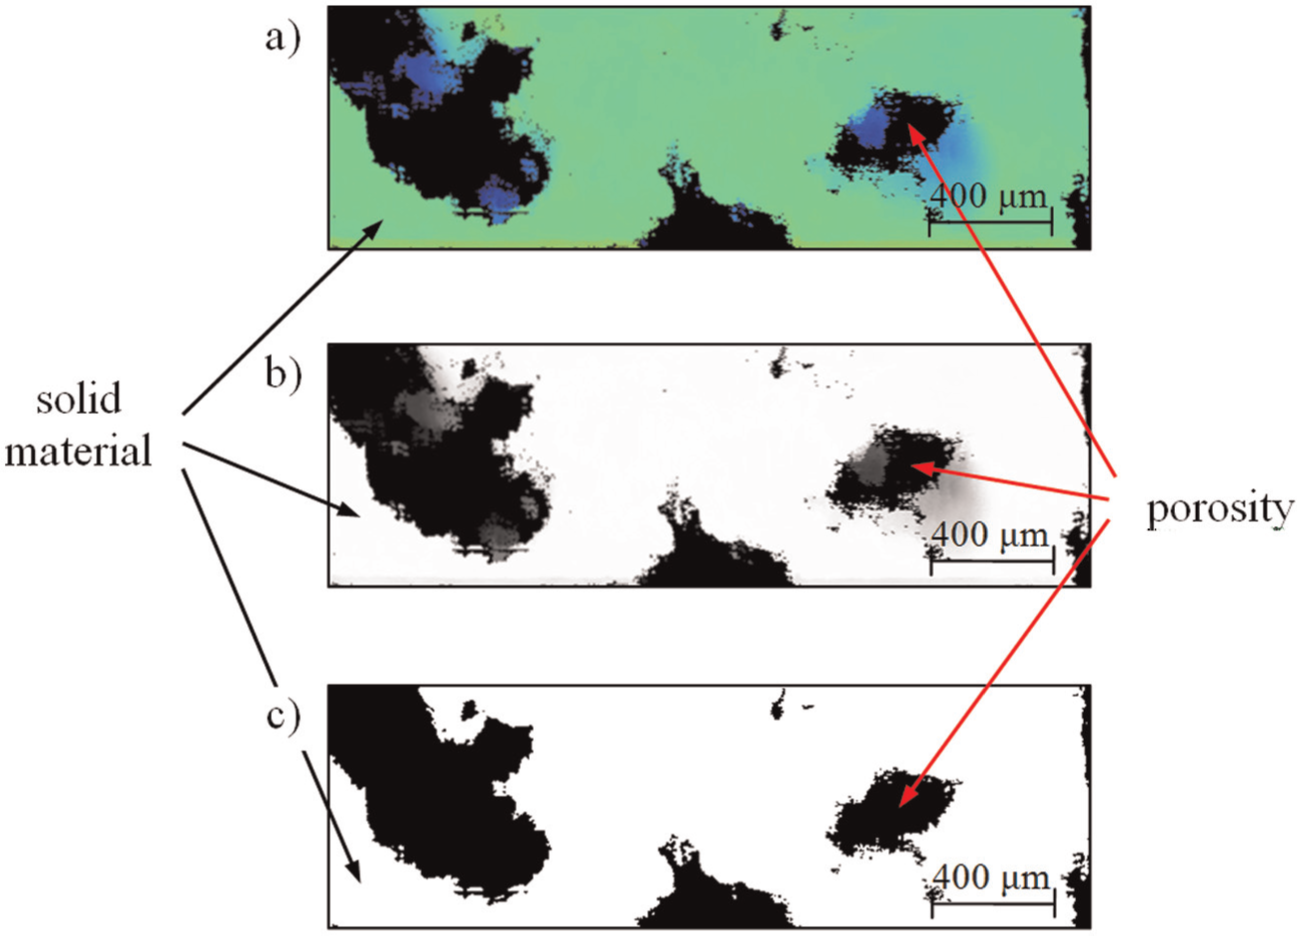
Experimental samples illustrating successive digital conversions of the optical micrographs: (a) original, (b) gray scale, and (c) binary.
In order to determine the proportion of solid material in the area swept per tooth revolution defined by equation (3), the picture showing circular cutting edge trajectories (Figure 2) was overlapped with binary map of the material surface obtained as a result of the aforementioned successive image conversions. The fraction between the “on” and total number of pixels enclosed between two consecutive cutting edge trajectories will allow determination of the space-dependent porosity profile along the analyzed tool path, as detailed in Figure 12.
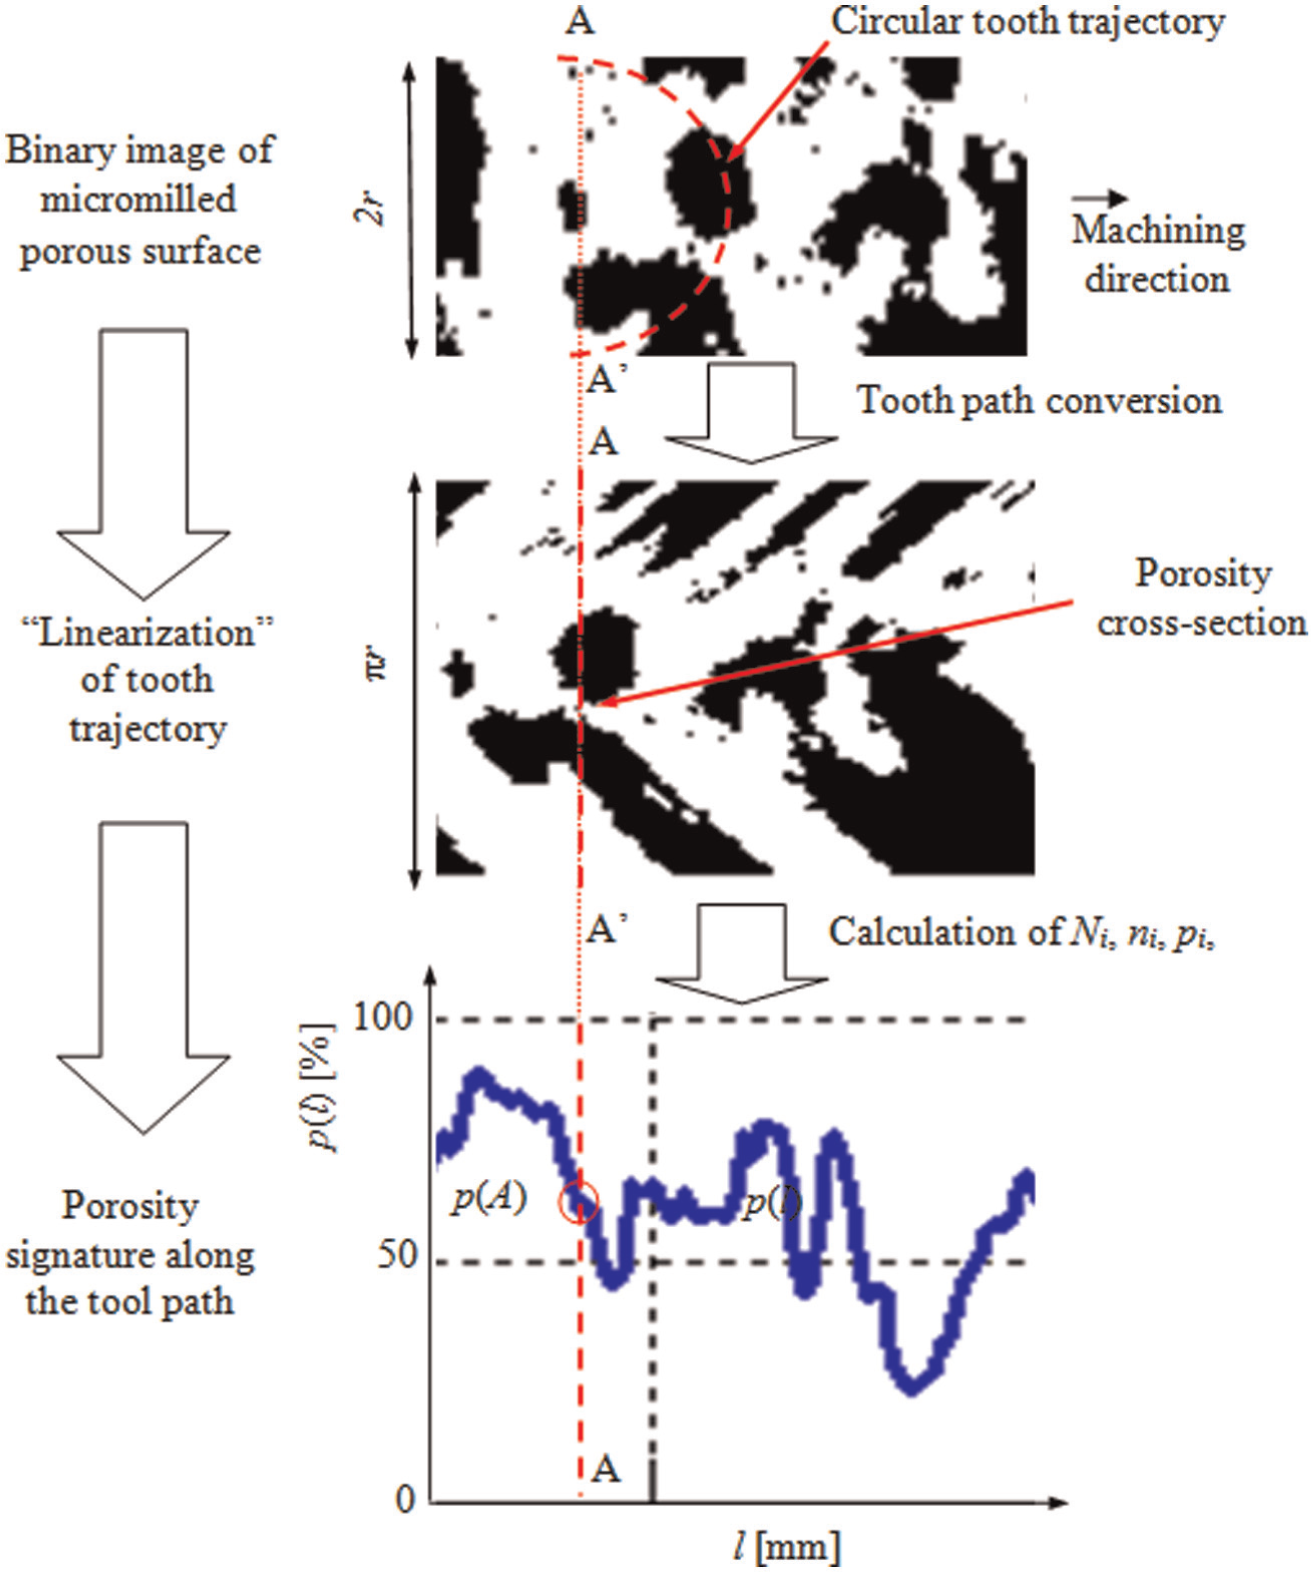
Schematic outlining the assessment of space-dependent porosity along tool path.
Analysis of porosity–cutting force correlation
Statistical analysis was used to investigate correlations between porosity and cutting forces. This analysis was performed on two datasets: (1) porous material signature determined and (2) resultant cutting force FR signature, both determined according to the procedure described in the foregoing sections. The required synchronization between the two datasets was guaranteed by converting the original time-dependent cutting force values F(t) into space-dependent representations F(l). The conversion was made possible due to the simultaneous recordings of the linear tool position (l) with the system presented in Figure 8.
Based on the general dynamics of the machining system, 28 a dynamic correlation links dynamic contact area ξ(l) and cutting forces developed at cutter/workpiece contact interface F(l) (Figure 13). The presence of voids within porous material changes the size of contact between tool and workpiece that in turn affects cutting forces developed at their common interface. Because of this, it can be inferred that a closed-loop dynamic relation exists between cutting forces and dynamic contact area
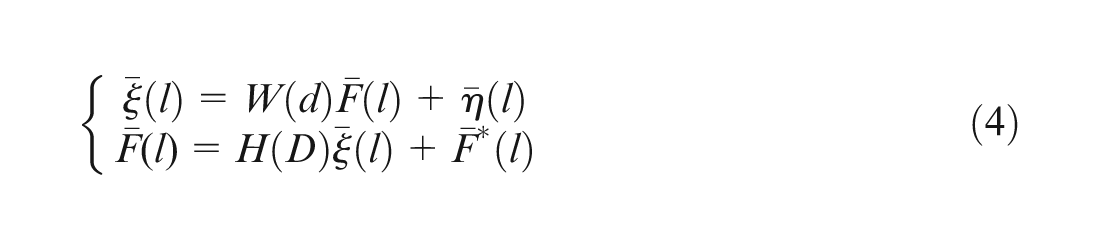
where η(l) represents porosity contribution, W(d) is the dynamic operator of the mechanical structure of the machining system, H(D) is the dynamic operator of the cutting process, and D = d/dl is the differential operator.
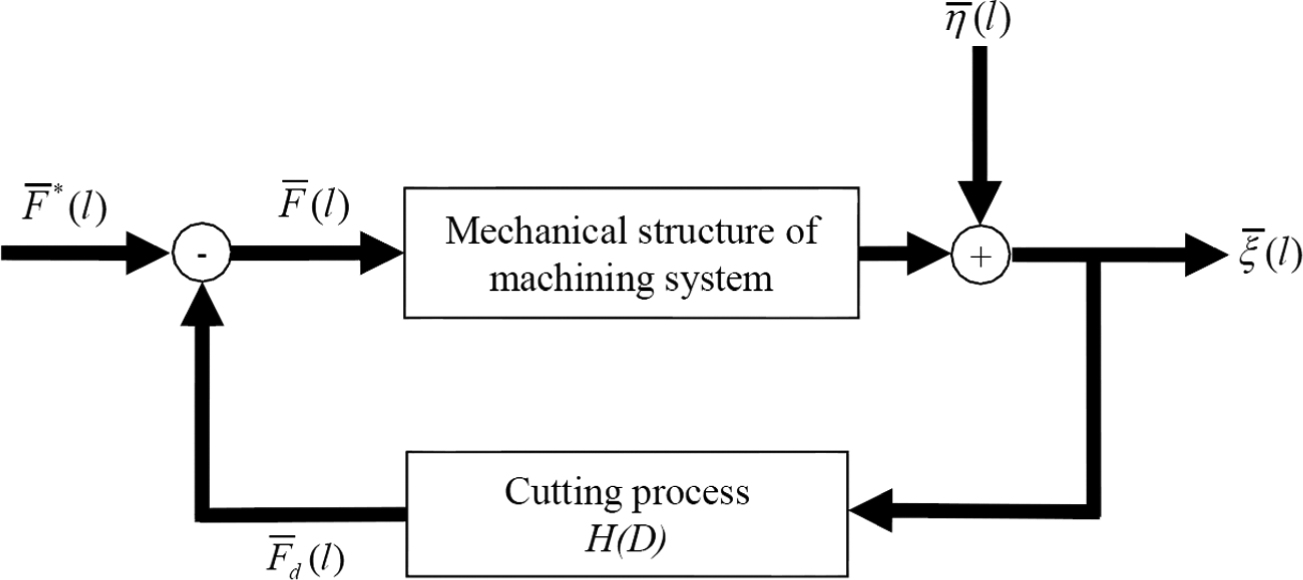
Block diagram outlining the effect of porosity on the overall dynamics of the cutting process.
The goal of this study is determination of statistical correlations between porosity and cutting forces. This can be achieved through statistical comparisons of the porosity and cutting force characteristics in spatial domain using classical theory of correlation and spectral analysis of random processes. The preliminary results depicted in Figure 14 clearly indicate that porosity pattern p—defined by equation (3) as the fraction of solid material in the area swept per tooth revolution—is followed closely by the resultant cutting force magnitude FR along the entire stable cutting region of the tool path.
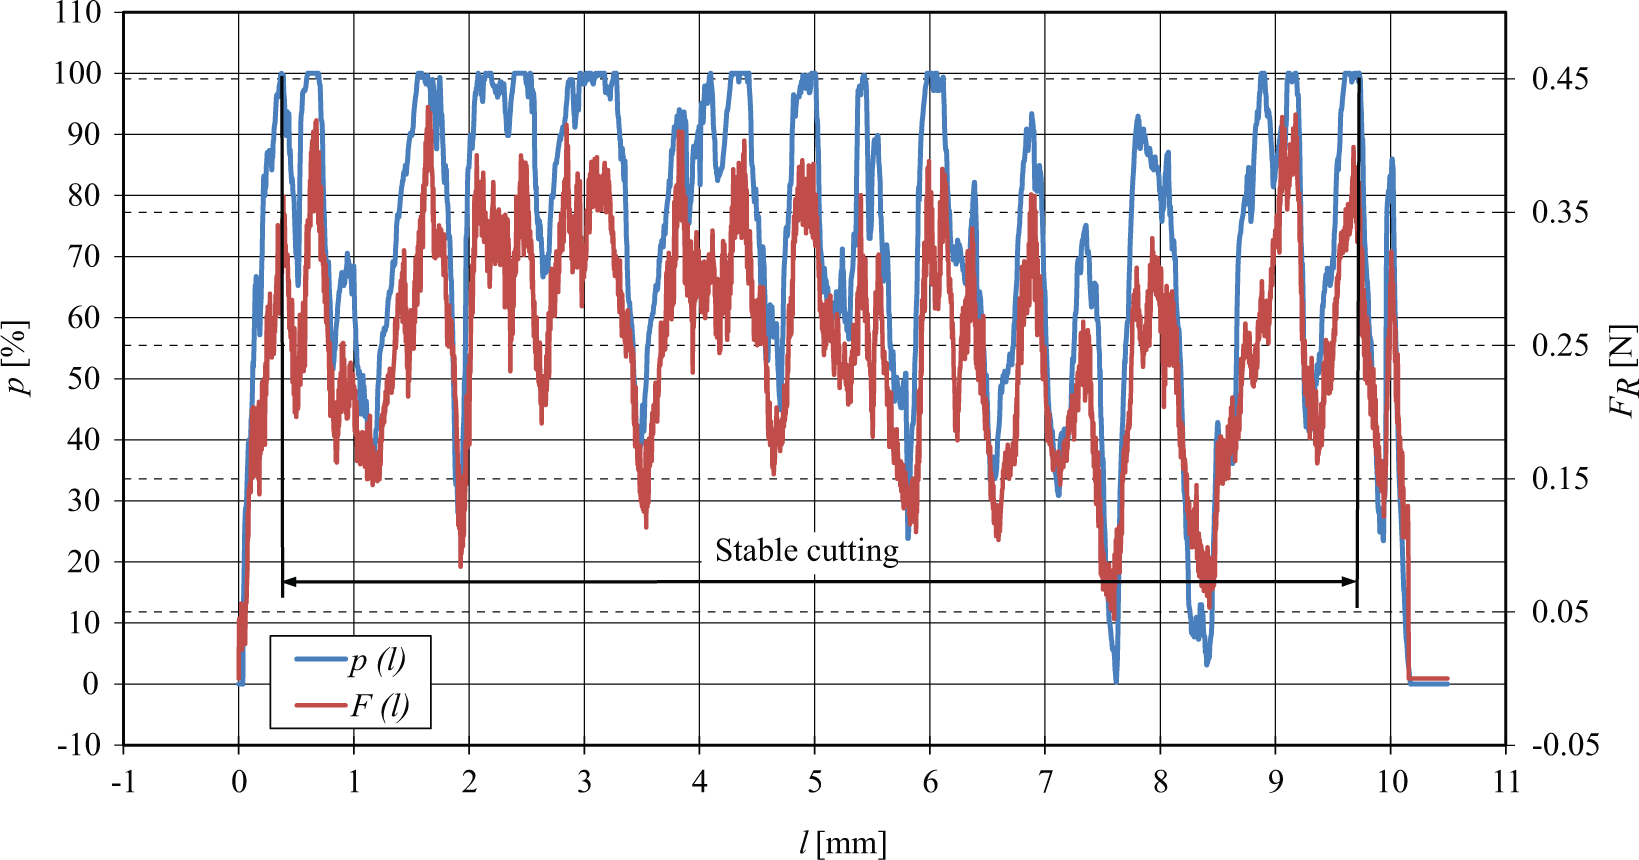
Representative sample of the relative correlation between porosity (p) and resultant cutting force (FR) signatures along tool path.
From the multitude of parameters and/or functions available in the theory of spectral analysis, the following were deemed as reliable metrics for porosity/cutting force signatures comparison: correlation coefficient (rx,y), power spectral density (Px,x), and coherence (Cx,y) between two stationary signals x(l) and y(l). Without presenting superfluous details, it will be briefly mentioned here that each of the three metrics proposed is capable of providing insightful information on a certain aspect of the comparison between the two analyzed profiles. For instance, while correlation coefficient can numerically quantify the interdependence between two random signals, power spectral density can be used as an indicator of the ranges of frequencies at which variations of the two analyzed signals are strong (or weak). Along the same lines, elevated coherence values (>0.70) are generally regarded as good indicators of the fact that the output (cutting force) is a consequence of the analyzed input (porosity). Unlike the correlation coefficient, both power spectral density and coherence functions are calculated in spatial frequency domain defined by parameter ν. However, for more comprehensive information on this topic, including detailed mathematical formulations, the reader is referred to the available pertinent literature. 29
As Figure 14 suggests, the agreement between the porosity and cutting force signals is not 100%, since a certain component of the cutting force is still influenced by primary cutting process as well as other parameters. Thus, the total cutting force generated during porous material micromilling can be represented as a sum of two components
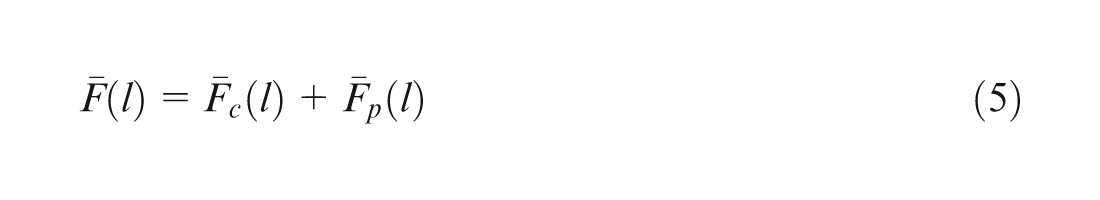
where
In order to further investigate the extent of correlations between porosity and cutting forces in spatial domain, the analysis of their power spectral densities is required. In addition, the use of coherence function will enable estimation of the individual roles played by
Effect of process parameters on porosity–cutting force correlation
In porous material micromilling, cutting force pattern is influenced not only by the proportion of solid material within the area swept by cutting edges, but also by cutting parameters like spindle speed, feed per tooth, tool size, and cutting depth. Their effect generally translates into superior or inferior correlations between cutting forces and porosity signatures. A set of experiments (Table 2) has been devised to investigate the individual effect of variable micromilling parameters on primary porosity–cutting force correlations that were quantified through statistical measures. This matrix of experiments allows paired comparisons between experiments with singular modifications in terms of cutting parameters used. To exemplify, the only change made between Experiments E2 and E6 is spindle speed, between E5 and E6 is feed per tooth, between E1 and E6 is tool diameter, and between E3 and E4 is cutting depth. As a result, these specific pairs of experiments will be analyzed and compared further in following sections. As a general comment, given the relatively reduced machinability of the titanium, the cutting speed was kept low (30 or 60 m/min) according to common machining recommendations. 30
It is important to emphasize here that given the overall qualitative focus of this work as well as the inherent variability of the porosity from one machined track to the next one, neither a more extensive design of experiments nor repetition of the machining experiments (however impractical due to the randomness of the voids) would be capable of significantly enhancing the quality of the observations to be presented herein.
Spindle speed
As shown in Figure 15(a), doubling the spindle speed decreases significantly the correlation coefficient between porosity and cutting force (rp,F), from 0.85 for 24,000 r/min to 0.74 for 48,000 r/min (13% reduction). This reduction could be attributed to an increasingly important effect of the machining system dynamics and/or local material response, which tends to interfere with primary porosity–cutting force correlation. The frequency component of both cutting force and porosity is similar (Figure 15(b)), which explains the elevated level of the coherence between them, which is above a threshold of 0.80 when analyzed within a frequency range of up to 2.8 mm−1 (Figure 15(c)). This actually means that in lower spatial frequency domain bandwidth, cutting force is influenced to a large extent by porosity distribution. Overall, all graphs in Figure 15 seem to suggest that the impact of porosity on cutting forces is more pronounced for lower spindle speeds and declines for higher spindle speeds, a conclusion that is also reinforced by the 11% drop in the coherence value Cp, F between Experiments E2 and E6 in lower spatial frequency domain.
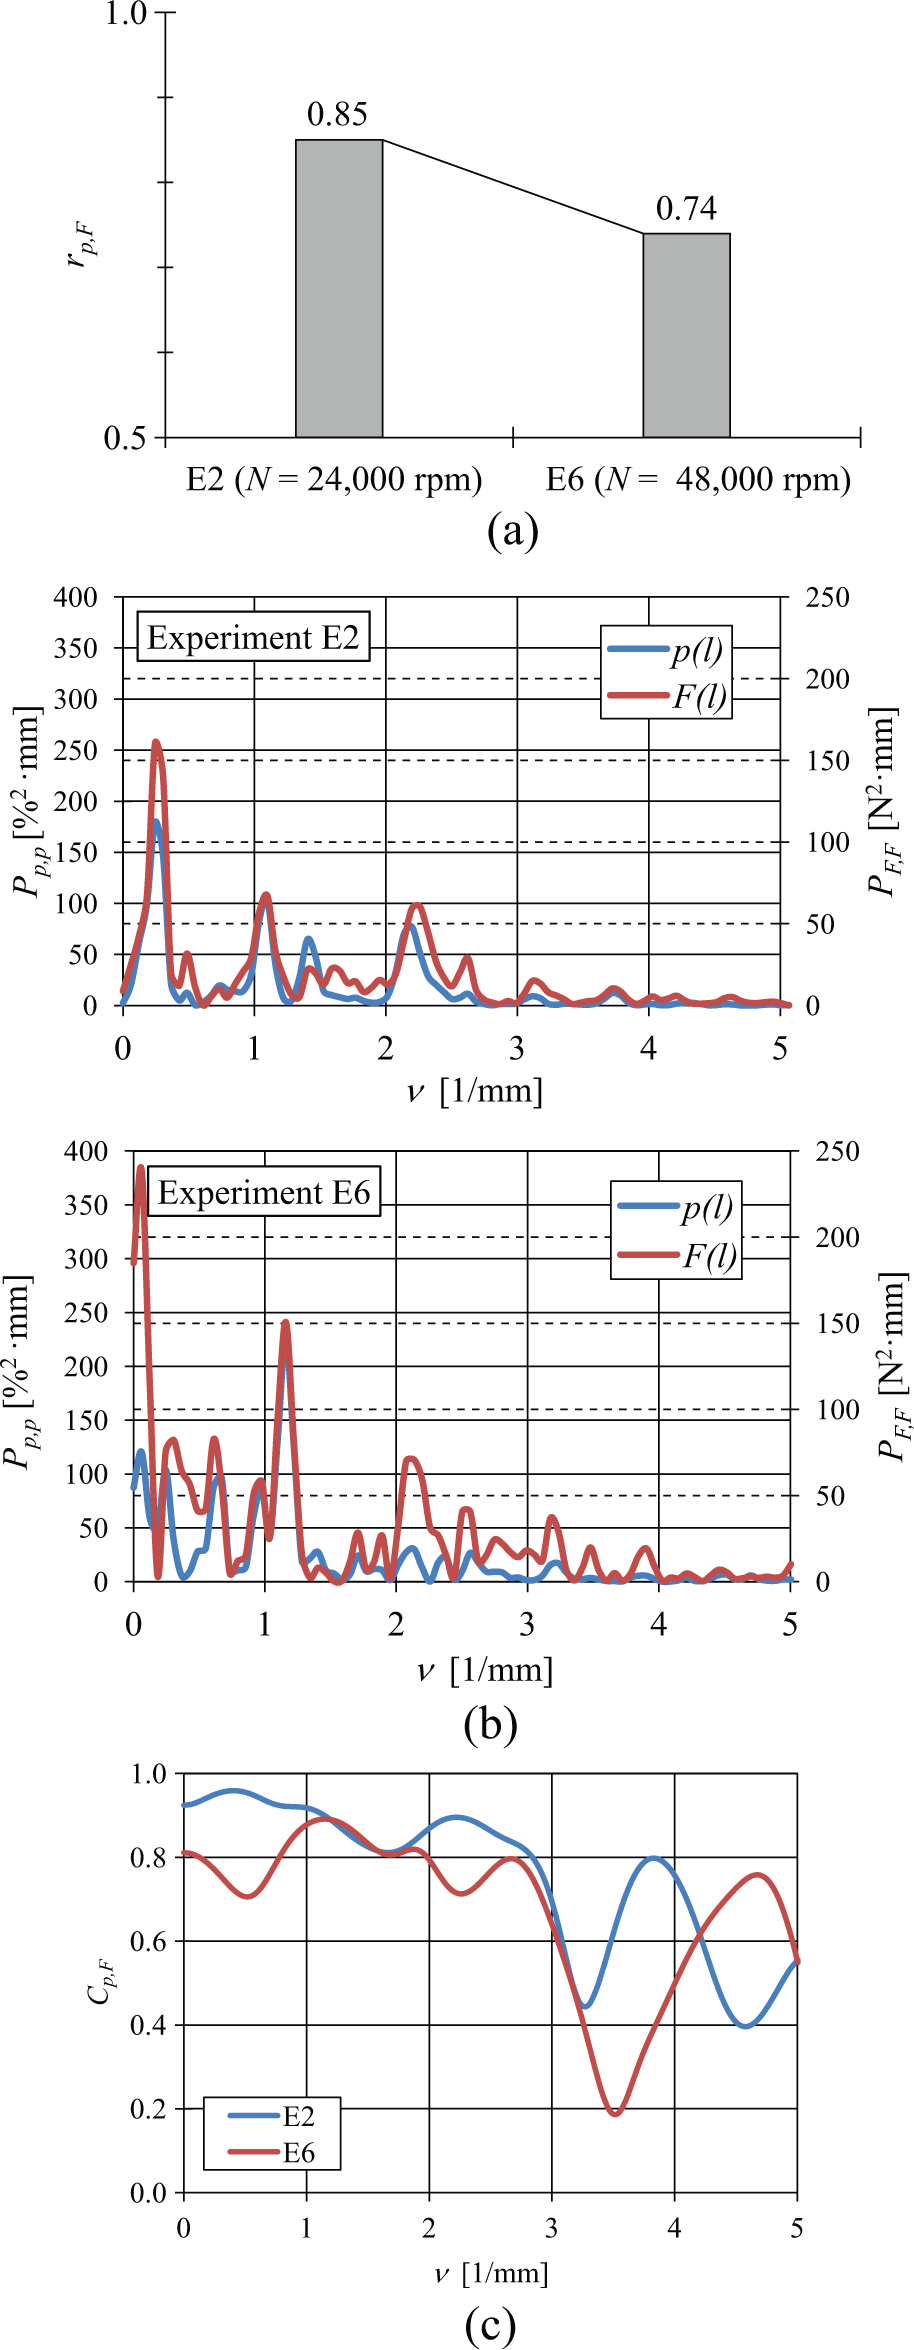
Effect of tool rotational speed (N) tool on porosity–cutting force dependence: (a) correlation coefficient, (b) power spectral density, and (c) coherence.
Feed/tooth
In machining, a relationship of direct proportionality exists between feed rate and feed/tooth. As such, a twofold increase in the feed rate from 95.54 mm/min (Experiment E6) to 191.08 mm/min (Experiment E5) translates into a double feed/tooth value changing from 1 to 2 µm/tooth. Micromilling kinematics (Figure 2) seem to suggest that feed/tooth augmentation means an increased interface (swept area) between cutter and workpiece, which in turn should translate into a more pronounced effect of the porosity on the cutting force.
As Figure 16(a) confirms, doubling up the feed rate translates into a correlation coefficient rp, F that increases from 0.74 to 0.85. Since power spectral density of the cutting force PF, F becomes closer to that of the porosity Pp, p (Figure 16(b)) and coherence value Cp, F goes up after a feed rate increase (Figure 16(c)), it can be inferred that micromilling processes with higher feed/tooth values tend to be characterized by better correlations between porosity and cutting forces, and this link is once again stronger in lower spatial frequency domain.
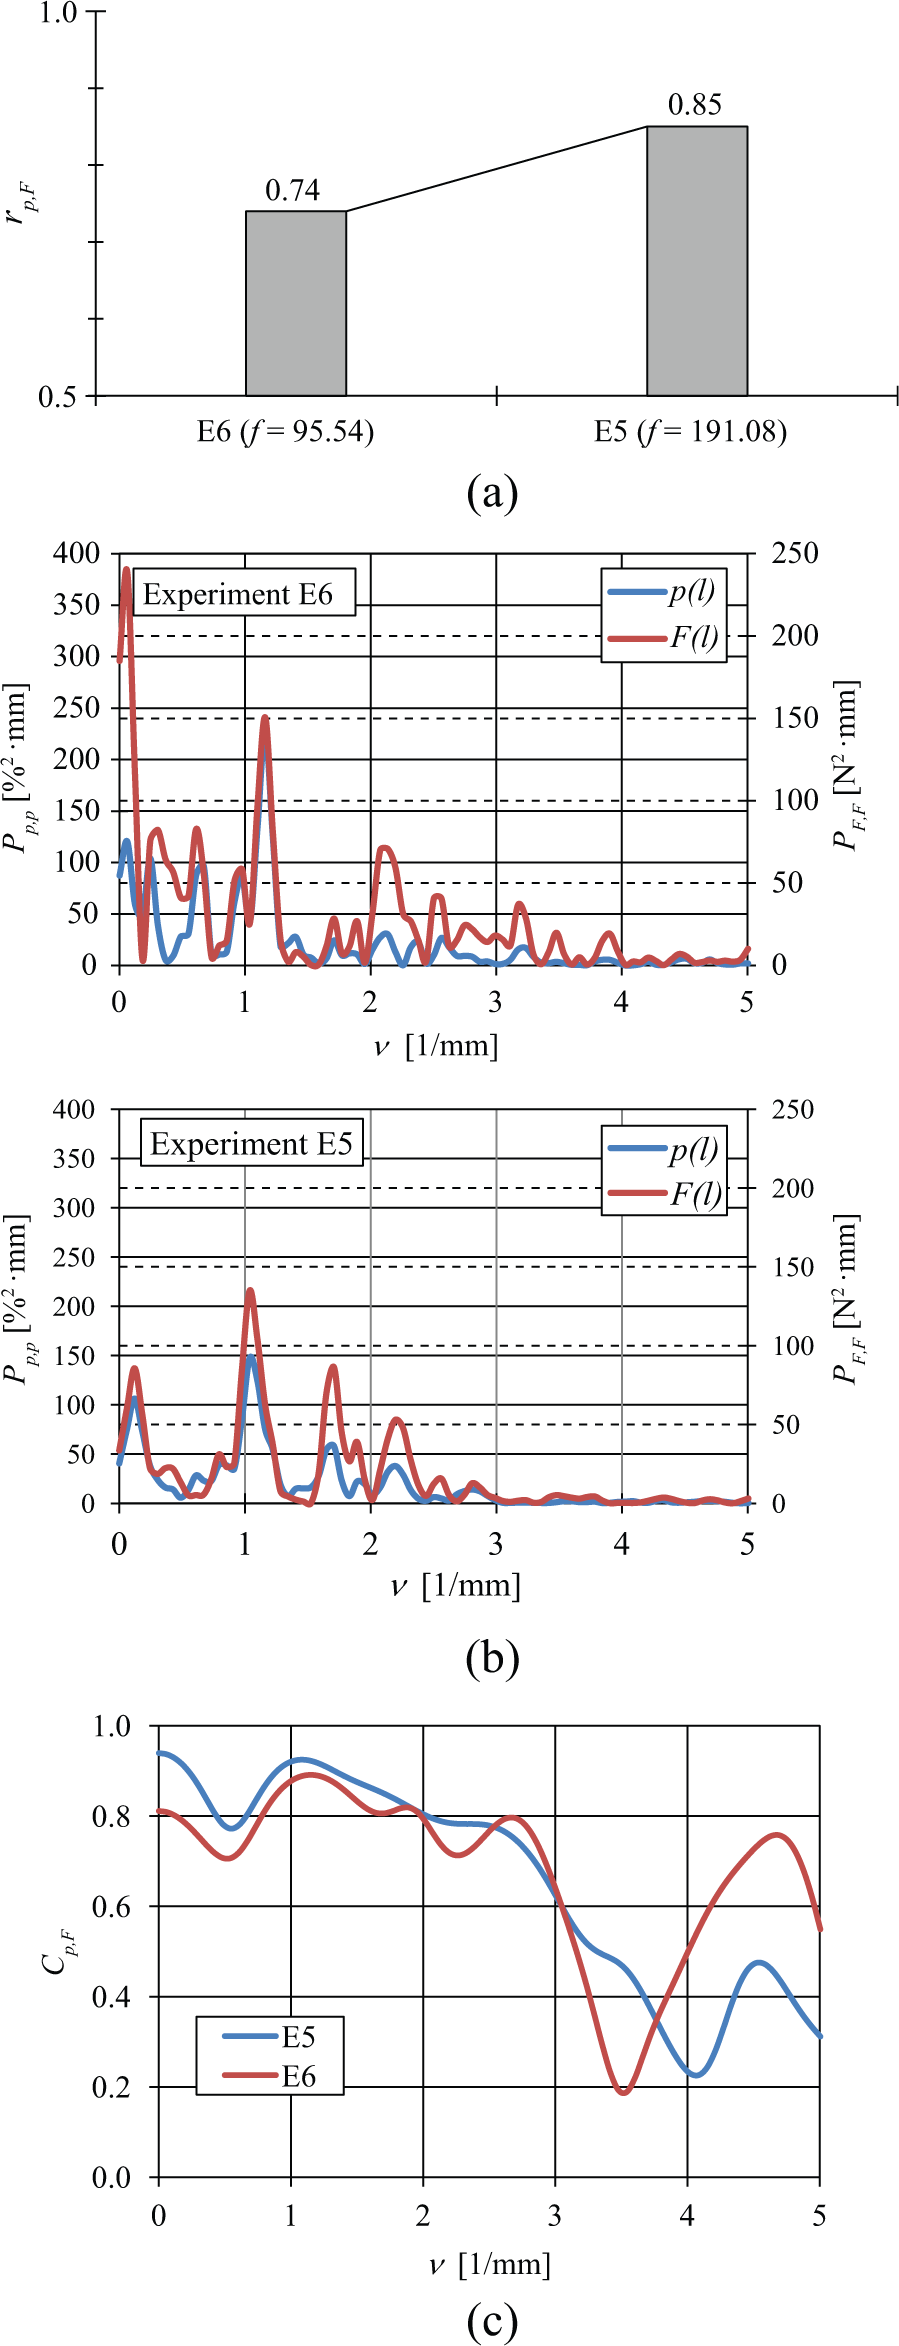
Effect of tool feed rate (f) on porosity–cutting force dependence: (a) correlation coefficient, (b) power spectral density, and (c) coherence.
Tool diameter
According to general machining theorems, a direct proportionality dependence links tool diameter and cutting speed in a manner that is absolutely similar to the relationship between spindle and cutting speed. As a result, it is reasonable to assume that tool size variations should influence the interaction between porosity and cutting forces in a mode that is somewhat analogous to spindle speed changes.
Indeed, as Figure 17(a) indicates, a double-sized tool (0.4 mm tool diameter in Experiment E6 vs 0.2 mm in Experiment E1) reduced the correlation coefficient rp, F from 0.82 to 0.74. Moreover, a good match between power spectral densities of porosity Pp, p and cutting force PF, F can be noted for small-sized tool, especially in low spatial frequency domain (Figure 17(b)). However, it is important to note that the frequency range where porosity is the main factor contributing to cutting force signature tends to be narrower for small-sized tools than for the larger ones (2.2 mm−1 compared to 2.9 mm−1), although in terms of mean coherence values, small tools still behave better (0.85 vs 0.79 in Figure 17(c)). It is important to emphasize that these results reiterate the conclusion of the section analyzing the spindle speed effect: higher cutting speeds, regardless of whether produced by higher tool diameters or higher spindle speeds tend to reduce the amount of correlation between porosity and cutting force signatures. From a practical perspective, the immediate consequence of these findings is that when machining at high speeds, the effect of porosity on cutting force is relatively minimal and therefore can be neglected. By contrast, when cutting speeds are low, the effect of porosity becomes significant, such that material discontinuities have to be accounted for in cutting force assessment.
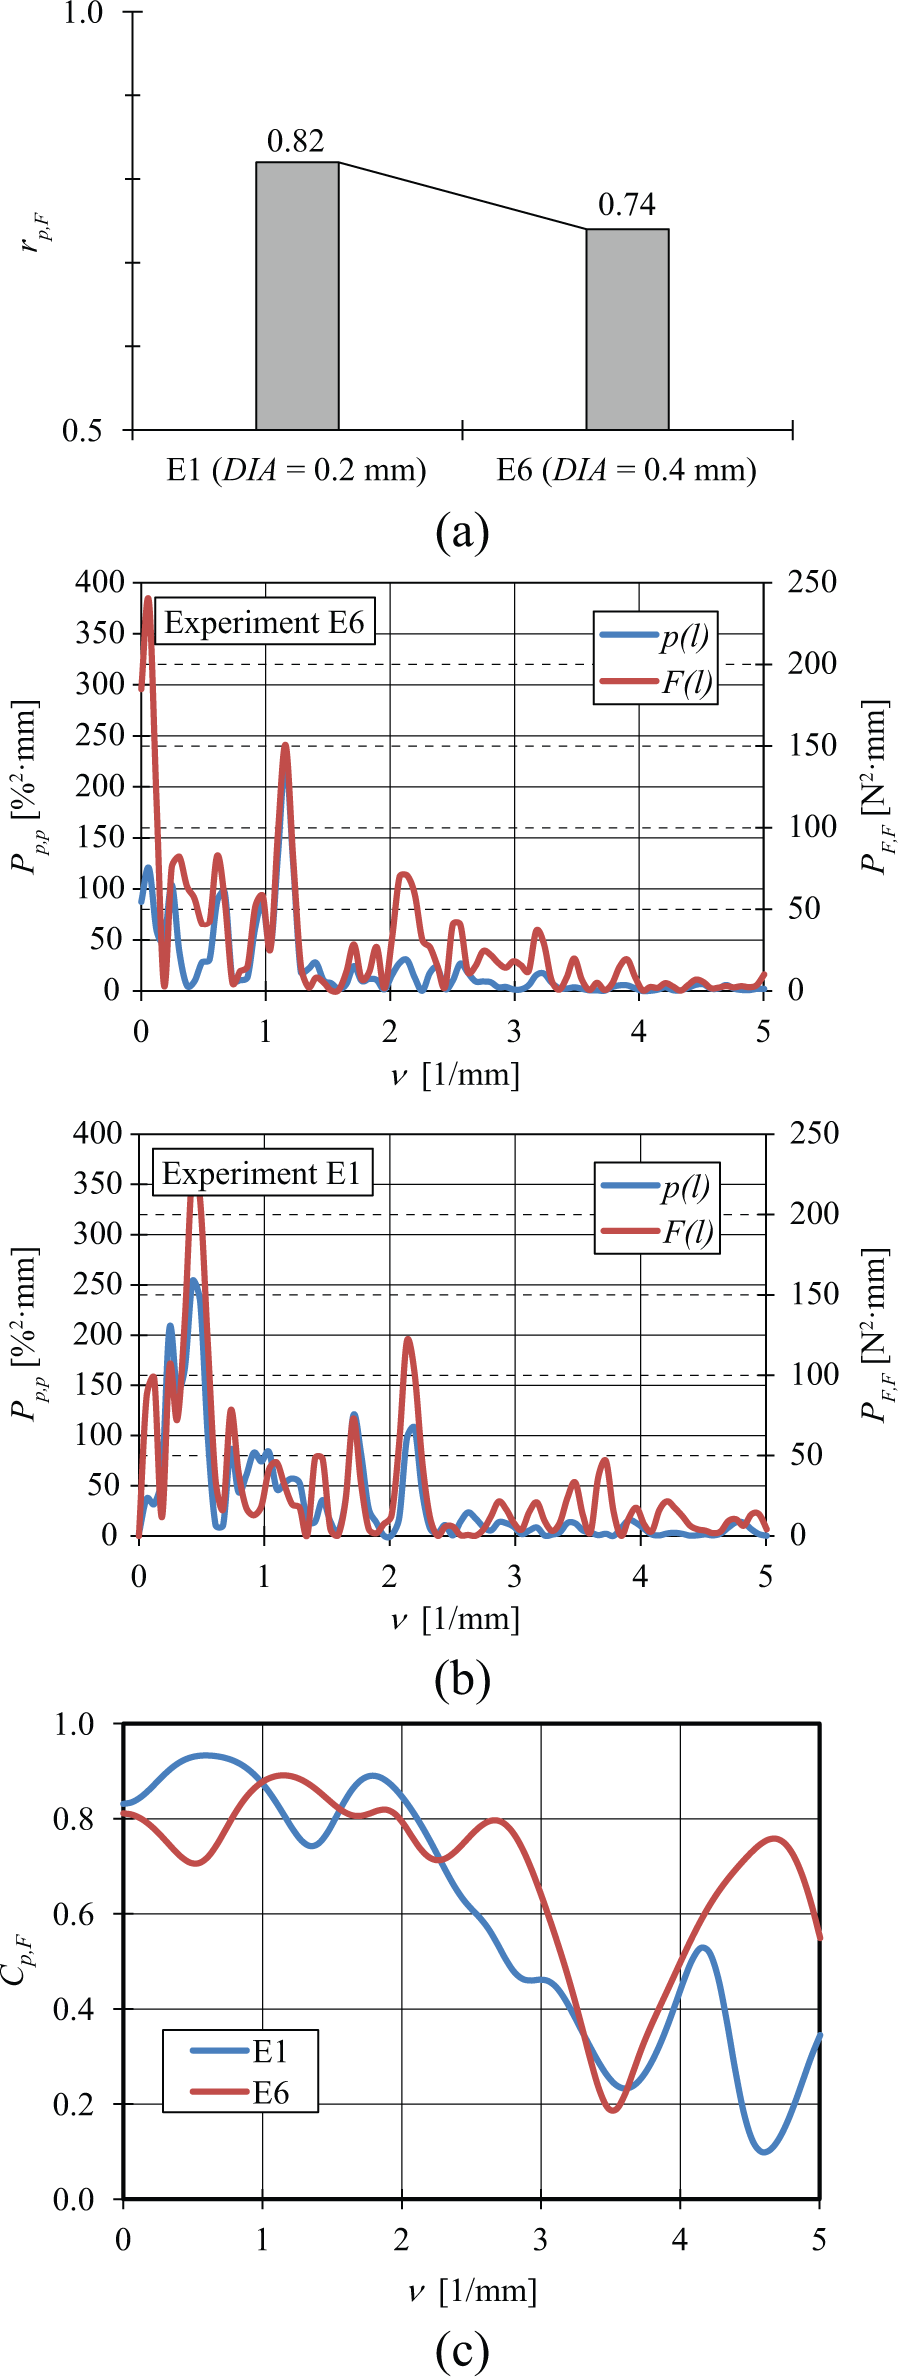
Effect of tool diameter (w) on porosity–cutting force dependence: (a) correlation coefficient, (b) power spectral density, and (c) coherence.
Cutting depth
Intuitively, when cutting depth is increased, the influence of the porosity should become more pronounced, since the contact interface between cutter and workpiece will also increase. Indeed, the results presented in Figure 18 demonstrate that when the microslot is deepened from 5 µm (Experiment E4) to 15 µm (Experiment E3), the correlation coefficient between porosity and cutting force rp, F increases from 0.79 (E4) to 0.85 (E3), as shown in Figure 18(a). For deeper cuts, the contact between tool and workpiece increases, and hence, the difference power spectral densities of porosity and cutting forces become visually negligible (Figure 18(b)). Higher mean coherence values are associated with deeper cuts when compared to more shallow ones (0.89 vs 0.77 in Figure 18(c)). These results echo appropriately the conclusion of feed/tooth effect analysis: better correlations between porosity and cutting forces are obtained for larger contact zones between tool and workpiece.
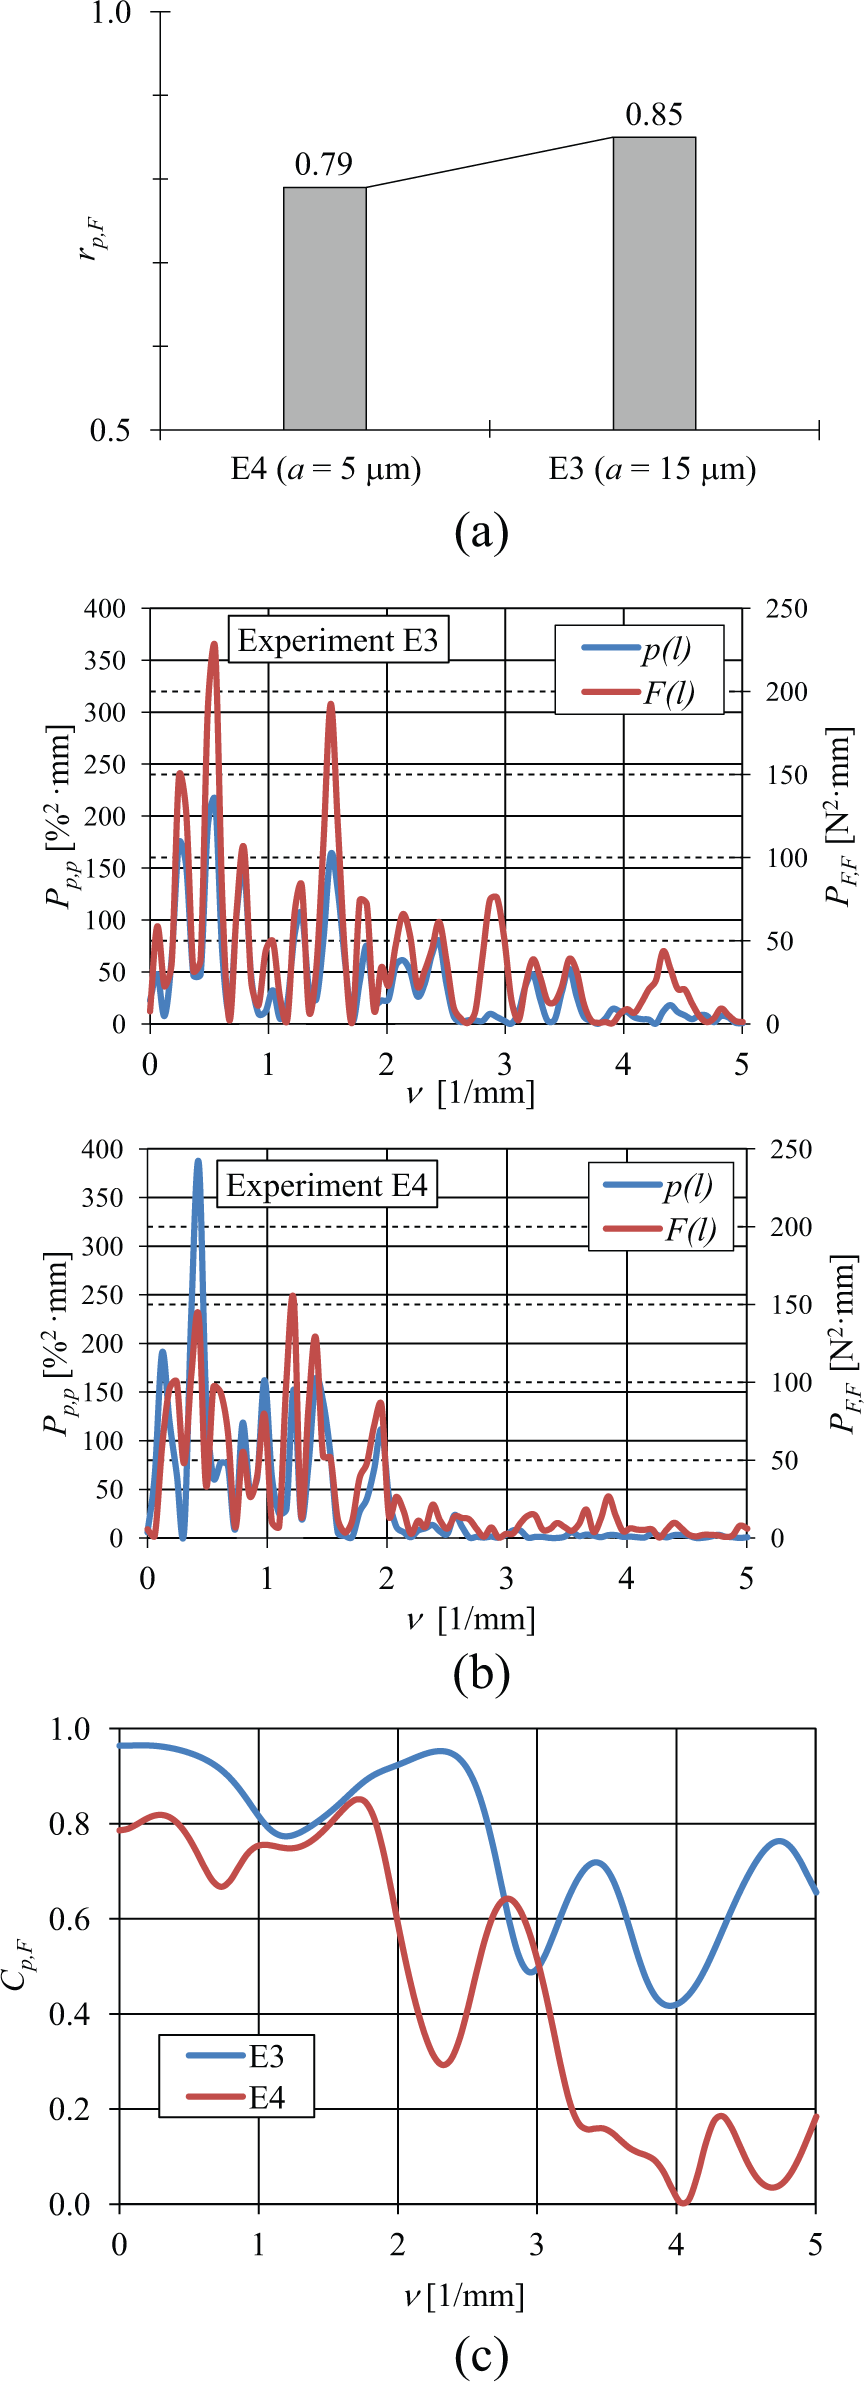
Effect of cutting depth (a) tool on porosity–cutting force dependence: (a) correlation coefficient, (b) power spectral density, and (c) coherence.
Conclusion
This study investigated in a predominantly qualitative manner the effect of several important cutting parameters on the dependence of the cutting force on the porosity as observed during porous titanium micromilling. The results obtained by comparing several statistical indicators suggest that porosity has a major contribution on cutting force signature in case of (1) less intensive cutting regimes and (2) larger contact zones between cutter and workpiece. Both options outlined tend to increase the reliability of the correlations between porosity and cutting forces in micromilling of porous titanium.
Based on these observations, it can be asserted that when micromachining highly porous foams, two possible approaches could be taken to investigate their micromilling-related behavior. On one hand, when cutting process is less intense and/or material voids are large enough compared to the size of the cutting tool engagement zone, then material discontinuities will affect more significantly the amount of cutting force generated at cutter/workpiece interface since the machining system has more time to detect and react to the changes in material structure/homogeneity. Further research is required in this direction, since no adequate analytical and/or mechanistic-oriented micromachining models have been proposed so far for materials characterized by interconnected and relatively large material discontinuities.
Conversely, when cutting process is more intense and/or cutting tool engagement zone is large compared to the size of the voids, then material discontinuities will have a reduced impact on cutting force signature since the machining system simply does not have enough time to react substantially to the changes in the structure of the machined material. In this case, the combined effect of machining system dynamics and/or local material response becomes more prominent from cutting force perspective. Once again, further research efforts will have to decide on the relative balance between these two factors in context of a reduced porosity-dependent cutting force behavior.
Since all investigations presented in this study were performed in well-defined experimental conditions characterized by relatively low feed/tooth values (1 and 2 µm/tooth, respectively) compared to the pore size (50–400 µm) as well as tool diameters (200 and 400 µm, respectively) that are sized toward the upper limit of the void dimensions, caution should be when extrapolating these conclusions outside of the aforementioned premises.
Regardless of the relative influence of large material discontinuities on cutting force profile, future developments in this area should be capable of answering presently unknown questions with practical relevance related to tool durability, tool wear, and so on, to be investigated in a more systematic manner based on conventional design of experimental approaches. While the randomness of porosities coupled with variability of the machining system and local material responses represent major impediments in determination of the “hard” thresholds between “intense” and “less intense” cutting or between “large” and “small” pores, the main contribution of this work resides in the framework proposed for identification of the investigative approach to be taken when assessing the challenges associated with cutting force-related behavior of a particular porous material. This framework enables a relatively facile identification of the porosity as a major contributor on the cutting force signature, a factor to be potentially overcome in certain instances by the “noise” coming from the micromilling process itself.
Footnotes
Acknowledgements
This study is the result of collaboration between Western University, London, Ontario, Canada, and NRC-IMI-CAMM, London, Ontario, Canada. The authors thank Louis-Philippe Lefebvre, Maxime Gauthier, and Sylvain Pelletier from NRC-IMI, Boucherville, Quebec, Canada, and Hugo Reshef, Mike Meinert, and Suwas Nikumb from NRC-IMI-CAMM for their continued technical and partial financial supports in this work.
Declaration of conflicting interests
The authors declare that there is no conflict of interest.
Funding
This study was supported in part by the Natural Sciences and Engineering Research Council of Canada (NSERC).