
Abstract
Creep age forming is often carried out under vacuum or autoclave loading conditions, where a sufficiently high, uniform pressure is required to force the workpiece into close contact with the tool surface. However, many creep age forming tests are performed to evaluate springback by clamping the workpiece to both ends of a cylindrical tool and forcing it to the tool surface, which is different from reality. In this study, a set of mechanistically based unified creep ageing constitutive equations have been incorporated into the commercial finite element code ABAQUS and used to analyse a common creep age forming tester, which employs a cylindrical tool shape. Two loading conditions are investigated: (1) end clamp and (2) uniform pressure. The amount of springback has been predicted, compared and analysed for both loading cases. A method has been introduced to assess the local curvature and springback variations. Good contact was achieved between the workpiece and tool surfaces for the uniform pressure condition (except at the plate end), providing that sufficient pressure was applied. However, for the end clamp condition, contact was limited to the vicinity of the clamps.
Keywords
Introduction
Creep age forming (CAF) is the process by which a sheet (typically of aluminium) is formed into the required shape by creep deformation, while precipitation ageing processes are performed simultaneously. The stresses generated in the workpiece, due to the restraining forces applied, gradually relax as creep strain accumulates. CAF has a number of advantageous properties, and a comprehensive review has been done by Zhan et al. 1 In the aerospace industry, for example, CAF meets the demands to form large aluminium panels into aerofoils and other complex structures, with enhanced performance including improved strength and toughness, lower weight and higher resistance to fatigue and corrosion.2,3
However, the key challenge is to accurately predict the amount of springback that will arise after CAF, so that the tool and CAF process can be designed to compensate for springback effects. To deal with this issue, integrated numerical models have been developed by several researches to evaluate springback in creep age formed components from thick aluminium sheet using physically based creep constitutive equations.4–7 These models are often combined with experimental investigations to examine springback in forming processes.
Simple experimental devices have been developed to examine stress relaxation and springback during CAF. However, these are generally based on single curvature bending conditions. The range of typical cylindrical testers, which can be used for CAF features investigations, is shown in Figure 1.8–13 A number of CAF tool designs have been studied in the literature, as illustrated in Figure 1(a)–(e), where the initial, undeformed and fully loaded configurations are shown.
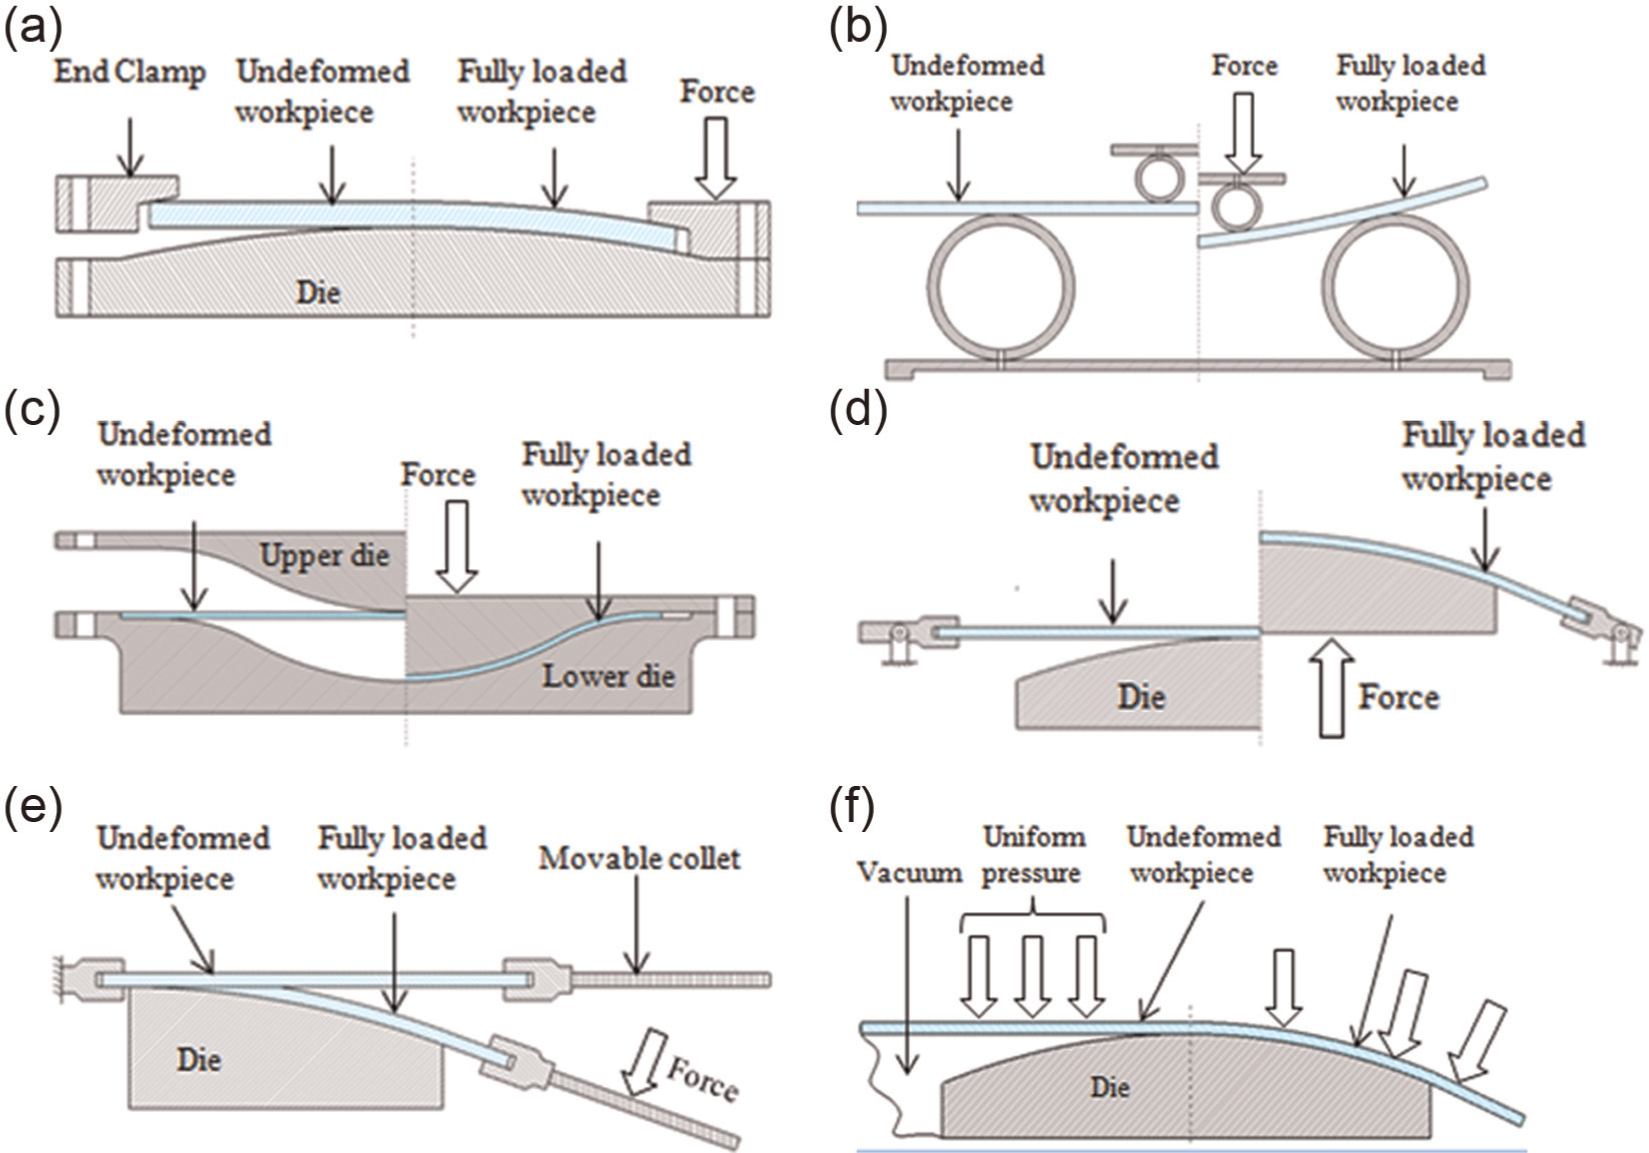
In practice, most components that are manufactured using CAF techniques contain very large curved surfaces, 2,5,14,15 for example, the Gulfstream G-5 upper and lower wing skins by STADCO, USA. 16 However, there are several manufacturing tools available for CAF large components. Vacuum or autoclave forming, illustrated in Figure 1(f), is particularly suitable for manufacturing large and complex parts, which enable co-consolidation and the manufacturing of parts even with local reinforcement in only one forming cycle and are considered in this study. This article presents a finite element (FE) model to simulate the CAF process and predict springback in the aluminium alloy 7055 (AA7055). First, a set of mechanistically based unified creep ageing constitutive equations for AA7055 are reviewed. These constitutive equations have been integrated into the commercial FE solver, ABAQUS, via the user-defined ‘CREEP’ subroutine. A cylindrical die has been modelled under two loading conditions: (1) end clamping (Figure 1(a)) and (2) uniform pressure (autoclave) conditions. The stress and contact pressure distribution on initial loading and during creep relaxation have been examined and compared for both loading conditions and springback predicted. The spatial variation of springback has been evaluated and compared for both loading configurations based on an overall ‘engineering’ definition and local curvature assessment method. Finally, for the uniform pressure condition, the influence of pressure magnitude on the degree of springback is investigated.
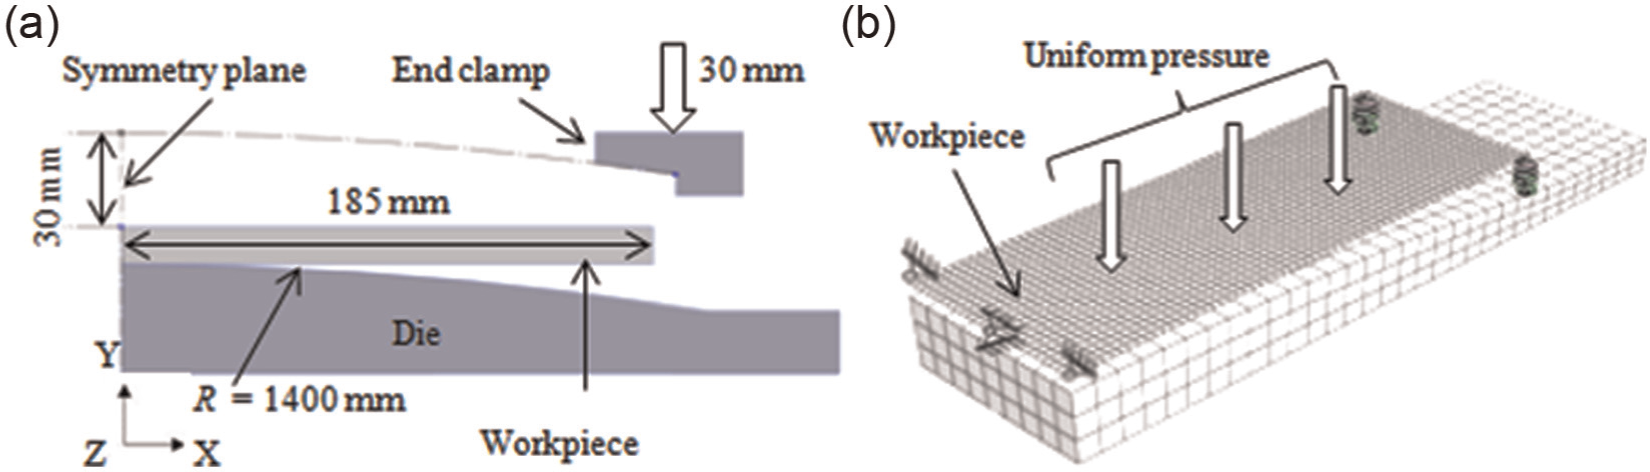
Numerical models with loading and boundary conditions: (a) end clamp loading and (b) uniform pressure loading.
Numerical procedures for CAF
Unified creep ageing constitutive equations
A unified physically based creep ageing constitutive model, formulated by Zhan et al., 17 has been employed in this study to describe the influence of ageing on the mechanical property evolution and creep deformation behaviour of the AA7055 at 120 °C under CAF conditions. For completeness, this model is summarised in the following
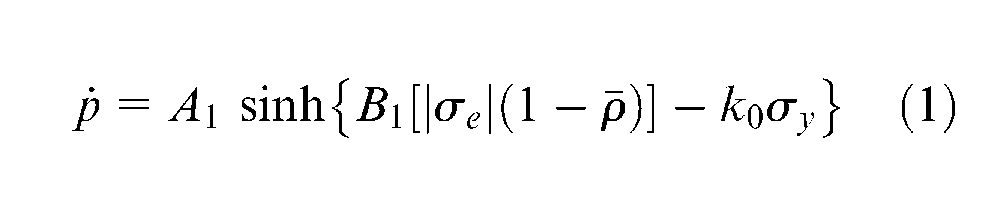


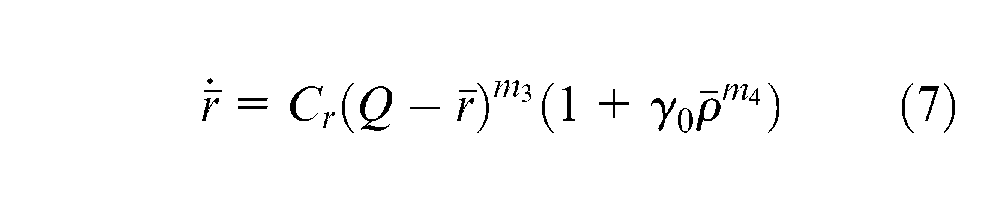
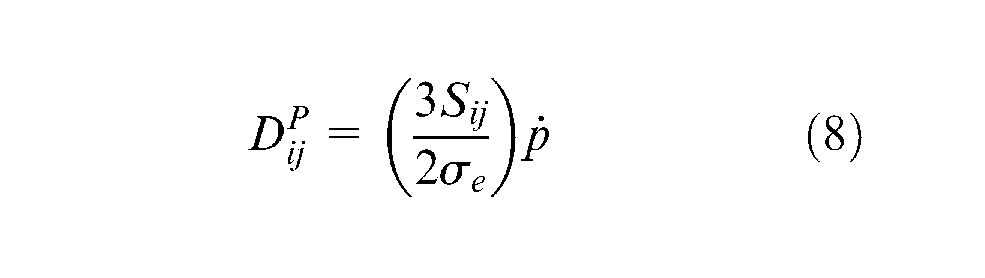
In equations (1)–(8)
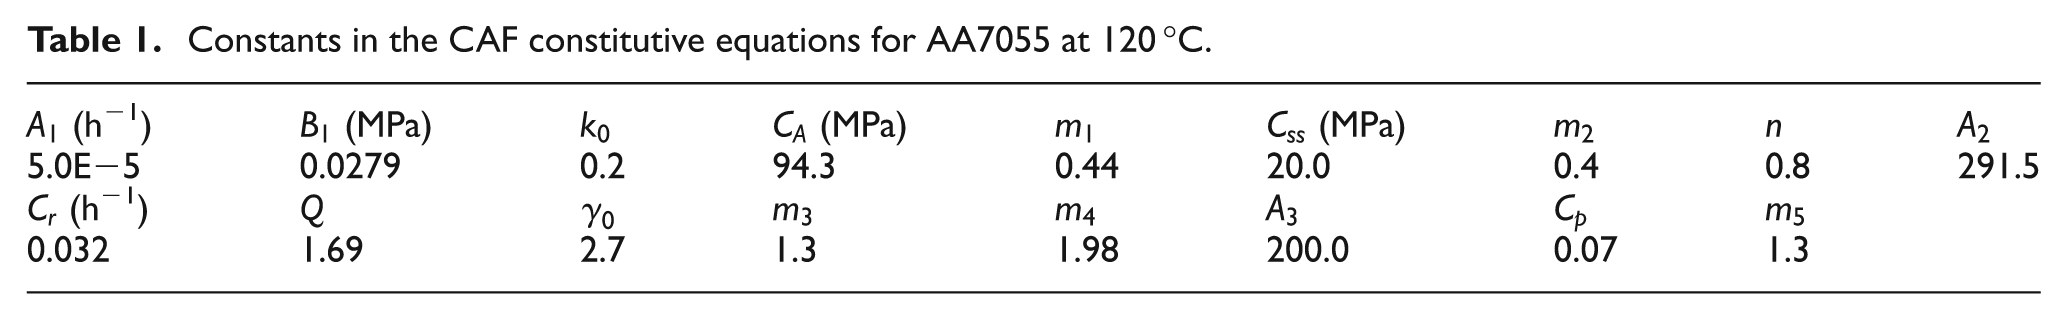
The material constants in the constitutive equations were determined by Zhan et al. 17 by fitting to experimental data using evolutionary algorithms (EA) based on optimisation methods. 18 Their resultant values are given in Table 1. A detailed explanation of the numerical optimisation method to determine these material constants is given by Li et al. 16
Constants in the CAF constitutive equations for AA7055 at 120 °C.
FE model and numerical procedures
Two FE models have been developed to represent the cylindrical die and workpiece under both loading conditions, as schematically illustrated in Figure 2(a) for the end clamp condition and Figure 2(b) for the uniform pressure condition. Due to the symmetrical nature of the geometries, a half model was created employing appropriate symmetry boundary conditions. The CAF simulation consisted of holding a 12-mm-thick, initially flat rectilinear workpiece of half dimensions of 185 mm × 80 mm × 12 mm of AA7055 against the die’s surface which was subsequently held at a constant temperature of 120 °C for 20 h. The die’s surface had a radius of 1400 mm and was assumed rigid. Four-node reduced integration shell elements were employed to model the workpiece. A friction coefficient of 0.1, which is related to the contact pair, was specified to simulate a non-lubricated condition. For the convenience of locating the workpiece on the tool surface and avoiding contact convergence in the implicit forming simulation, two ground springs of stiffness of 1 × 10⁻⁶ N mm−1, which can be compressed to zero volume, were used to support the weight of the workpiece at its corners, as shown in Figure 2(b).
To simulate the end clamp condition, initially, a 30 mm displacement was applied in the downward (−y) direction to overcome the stiffness of the two ground springs and to ensure that the corners of the workpiece were in direct contact with the tool surface. This end displacement was held for a time period of 20 h, allowing ageing, creep and stress relaxation to take place. Finally, this end clamp displacement was removed incrementally, enabling the aluminium workpiece to springback.
For the uniform pressure condition, a two-step analysis was also performed. Initially, a load of 18 MPa was applied incrementally in a static analysis, followed by a visco step where this load was held over a period of 20 h to the entire top surface of the workpiece, causing it to form the required shape. Similarly, to the end clamp condition, this pressure was held for 20 h and then released, enabling the workpiece to spring back to its final deformed shape, which was measured.
Overall CAF process and springback assessment
Equivalent stress distribution
A contour plot of the equivalent (Mises) stress distribution, which controls the creep strain rate, over the workpiece’s surface is shown in Figure 3(a) and (b) for the end clamp and uniform pressure condition (18 MPa), respectively, at three stages in time. Stage 1 (at t = 0 h) is the initial fully loaded condition where the ground springs were compressed to overcome their stiffness by the end clamp’s vertical displacement or by the applied pressure, and the whole workpiece deformed towards the die’s surface. At this stage, for the end clamp condition, around half of the workpiece experiences high stress greater than 300 MPa, whereas for the uniform pressure condition the majority of the workpiece has a relatively uniform stress distribution between 280 and 300 MPa. The maximum stress attained was around 321 and 306 MPa for end clamp and uniform pressure condition, respectively. In all cases, the stresses were below the yield stress of the material, which is around 361 MPa.
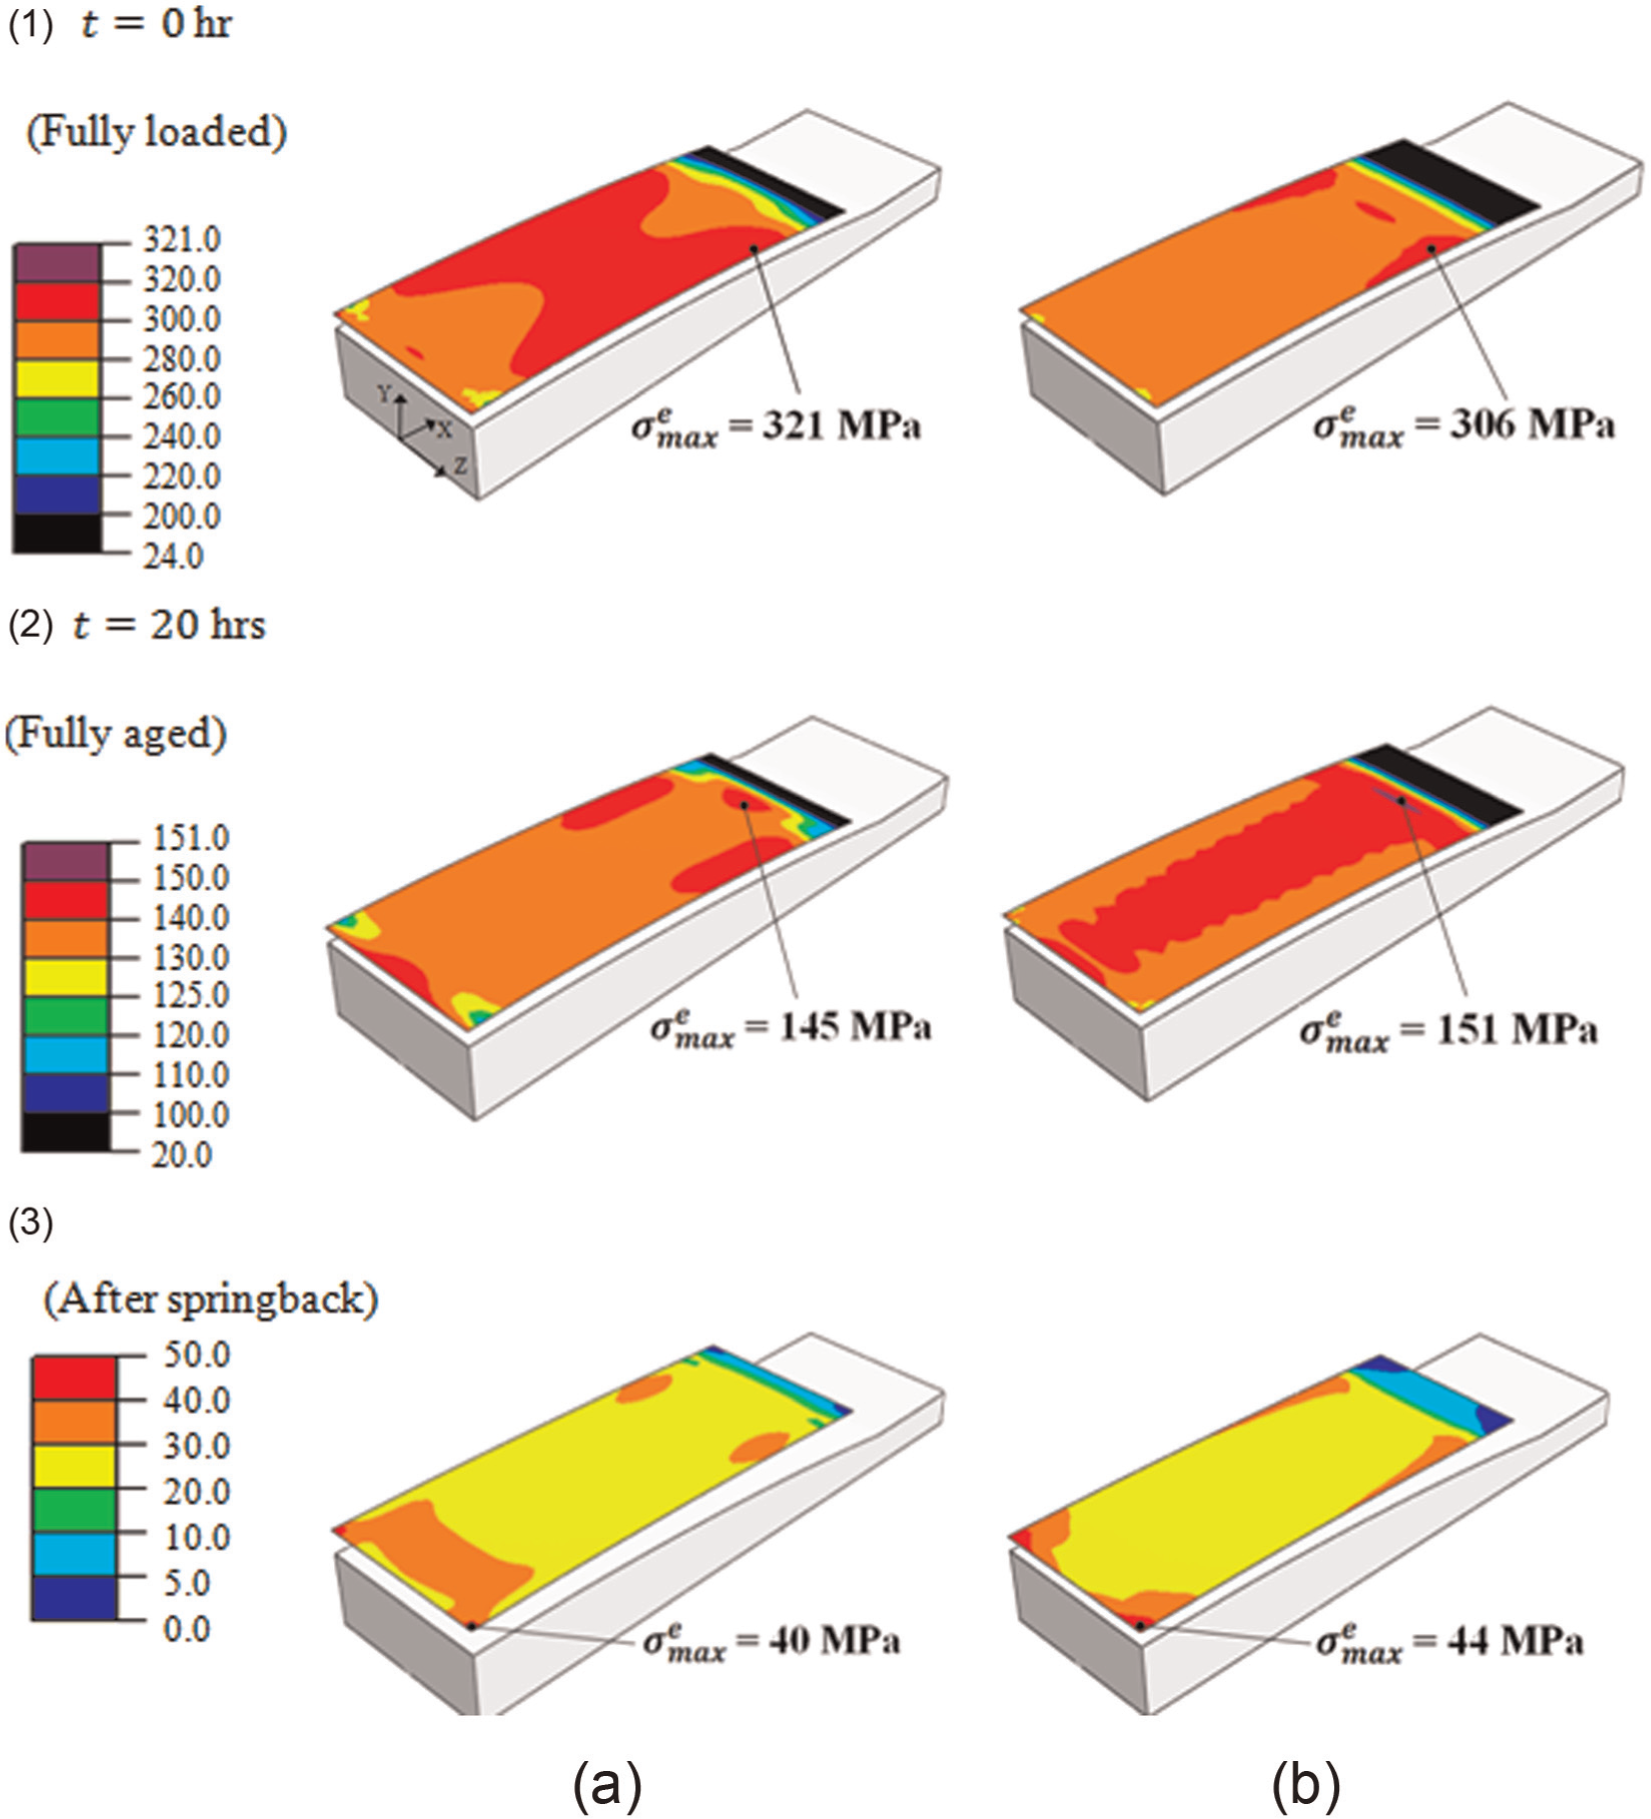
Comparison of top surface equivalent stress of the workpiece for (a) end clamp and (b) uniform pressure loading conditions at (1) fully loaded (t = 0 h), (2) fully aged (t = 20 h) stages and (3) after springback
Significant stress relaxation due to creep took place, generally reducing the equivalent stress by approximately 50% to a maximum of 145 and 151 MPa for the end clamped and uniform pressure condition, respectively, at the end of ageing period (Figure 2, at t = 20 h). Though higher stresses were initially attained on loading for the end clamped condition compared to the uniform pressure condition, stress redistribution effects have lead to marginally higher stresses in the uniformly pressurised workpiece post-ageing.
On removal of the applied loads, springback occurred, and a residual stress remained in the workpieces. As shown in Figure 3 (after springback), similar stress levels reside in the workpieces for both loading conditions. For the end clamp condition, the majority of residual stress distribution was released to below 40 MPa, which is similar to, but marginally lower than the uniform pressure condition (maximum of 44 MPa). In all the cases, as expected, the stresses are symmetrical about the workpieces’ longitudinal centre line.
Contact stress distribution
In addition to the bending stresses in the workpiece, stresses are also generated due to the reaction force between the workpiece and die. Good contact between the die and workpiece promotes the workpiece to conform to the die’s profile. Therefore, contact pressure may be used as a measure of the contact between the workpiece and die. Figure 4(a) and (b) shows the contact pressure distribution upon the upper surface of the die at (1) fully loaded and (2) fully aged stages for both the end clamped and uniform pressure condition, respectively. As shown in Figure 4(a), the contact pressure is small except in the vicinity of the clamps where a maximum pressure of 100 MPa is observed on initial loading, which reduces by approximately 20% after 20 h of ageing. Contact is achieved over the majority of the surface for the applied pressure loading condition (Figure 4(b)). The contact pressure is around 20–58 MPa except close to the workpiece edges where no contact is achieved. After ageing, a similar pressure distribution was observed with a peak value reduction of around 22.3%.
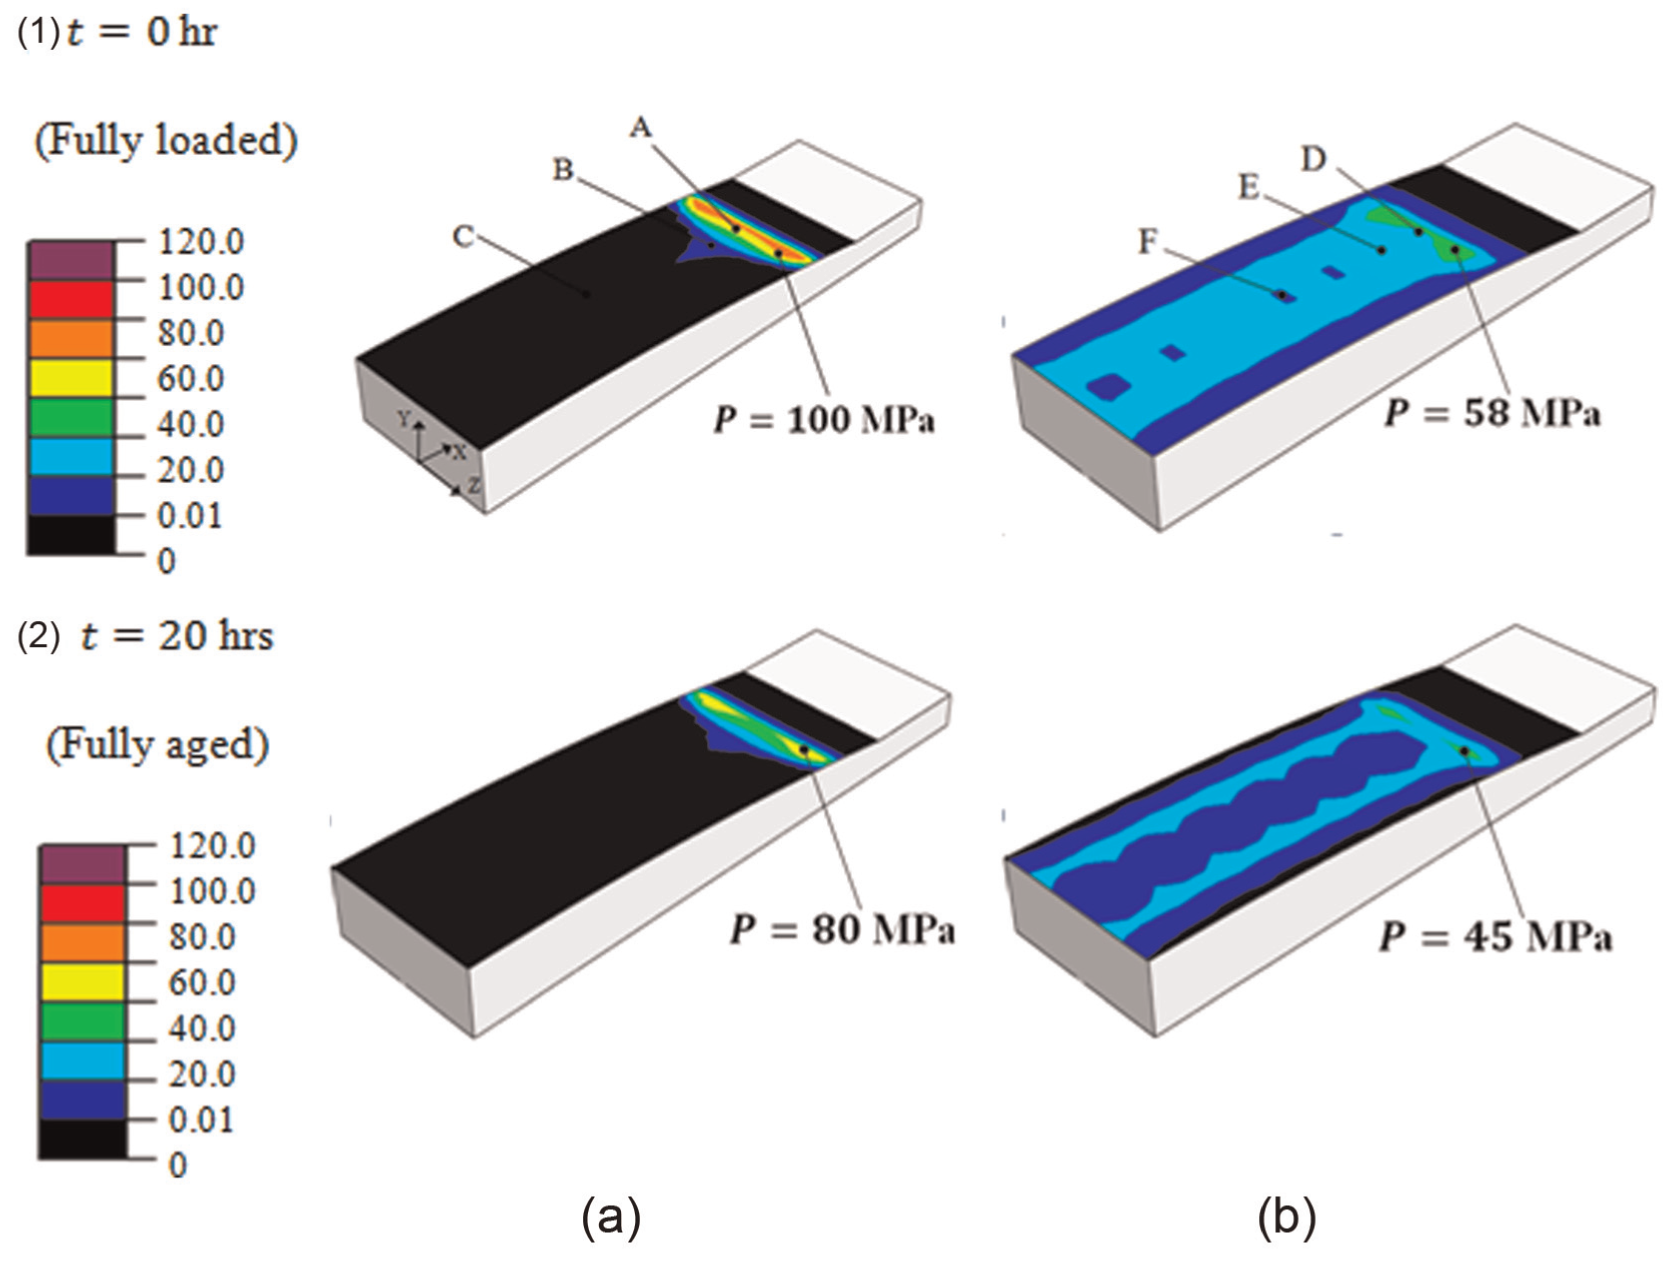
Comparisons of contact pressure on the die for (a) end clamp and (b) uniform pressure loading conditions at (1) fully loaded (t = 0 h) and (2) fully aged (t = 20 h) stages.
To examine the influence stress relaxation during CAF on the contact pressure in detail, three feature points have been identified on each workpiece, as shown in Figure 4 (at t = 0 h). Feature points A, B and C on the end clamp die are located at x coordinate distances of 182, 170 and 100 mm, respectively. Similarly, points D, E and F on the uniformly pressurised die are located at x coordinate distances of 155, 140 and 100 mm, respectively. The variations in contact pressure during CAF at these points are compared in Figure 5. Since there is no contact pressure at Node C, it is excluded from Figure 5. Note that in Figure 5 and subsequent figure, solid lines are used to signify initial loading conditions (t = 0 h) and dashed lines for data at 20 h of CAF.
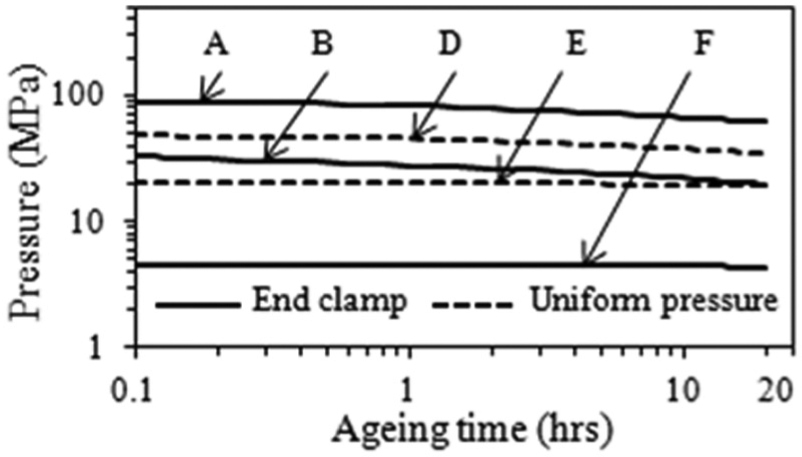
Variation of contact pressure during CAF for Nodes A and B (solid line) and Nodes D, E and F (dotted lines) on die, as shown in Figure 4.
Each curve exhibits the stress relaxation, and it can be seen that the stresses release to 26.46 MPa (Node A), 13.39 MPa (Node B), 13.28 (Node D), 1.23 (Node E) and 0.22 MPa (Node F) after 20 h of ageing. In comparison, uniform pressure presents a more stable stress relaxation rate than that of the end clamp condition. For each condition, the stress relaxation rate increased with an increase in the initial stress.
The stresses in the end clamp loading case, which resembles a three-point bending configuration, are dominated by bending stresses, and little contact is made between the workpiece and die. Therefore, the shape of the deformed workpiece is mainly related to the bending stress distribution and not to the shape of the die’s surface. For the uniform pressure loading case, 18 MPa has been found insufficient to achieve full contact between the workpiece and die’s surface, and a noticeable gap existed between the workpiece and die at its ends.
The variation in the gap between the workpiece and die, from the point of initial loading to the end of 20 h of ageing, along the workpiece for both loading conditions is shown in Figure 6. For the uniform pressure condition, there is no contact for 10.3% of the workpiece’s area on initial loading (t = 0 h), which decreases marginally to 9.4% after 20 h of ageing. While for the end clamp condition, the workpiece and die are only in contact under the clamps themselves and at the mid-length of the workpiece (i.e. the plane symmetry line on the workpiece surface). Figure 6 shows the vertical distance (gap) between the tool and workpiece as a function of distance from the mid-length of the workpiece (x = 0). A parabolic profile is seen in Figure 6 between the clamped area and mid-length of the workpiece. As explained in the ABAQUS manual, contact pressure can only be generated between two deformable surfaces and cannot be generated for line-surface contact. 19 Hence, no contact pressure can be simulated at the mid-length of the plate, and a small gap of 1 × 10⁻³ mm exists at the mid-length. The gap increases to a peak value of 0.072 mm at 85 mm from the workpiece’s mid-length on initial loading. After 20 h, a similar trend in the gap’s profile can be seen, but the peak value has almost doubled to 0.147 mm.
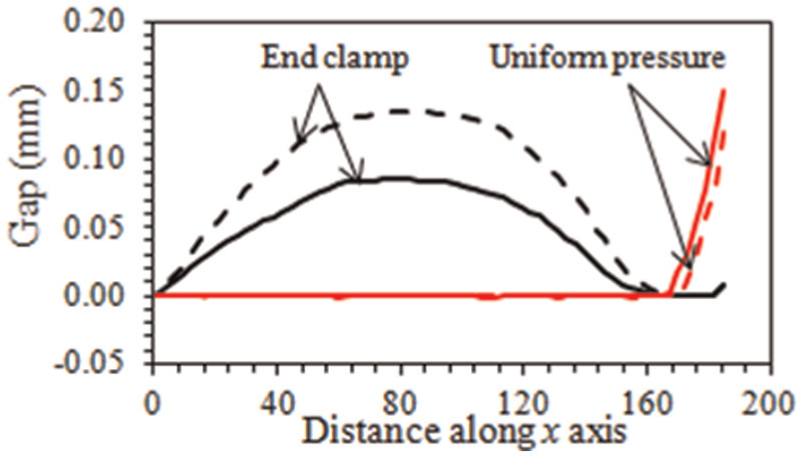
Variations of the gap between workpiece and die for end clamping and uniform pressure conditions at ageing time t = 0 h (solid lines) and t = 20 h (dotted lines).
Overall springback assessment
Significant work has been performed to assess springback of the overall structure. 4 The typical engineering approach to quantify springback is to evaluate the springback factor, S, which is given by

where
Overall springback is defined by a factor
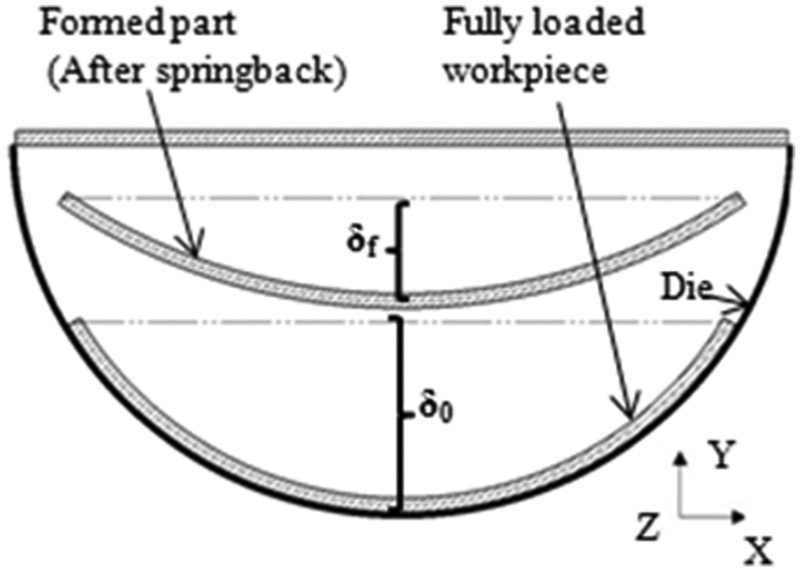
The maximum vertical distance relative to the workpiece edge (see Figure 8) was taken at two instances: (1) fully loaded and (2) after springback. These measurements were used to evaluate springback. The overall springback factor for the end clamp condition is 0.568, which is smaller than that of the uniform pressure condition, which has a factor of 0.575.
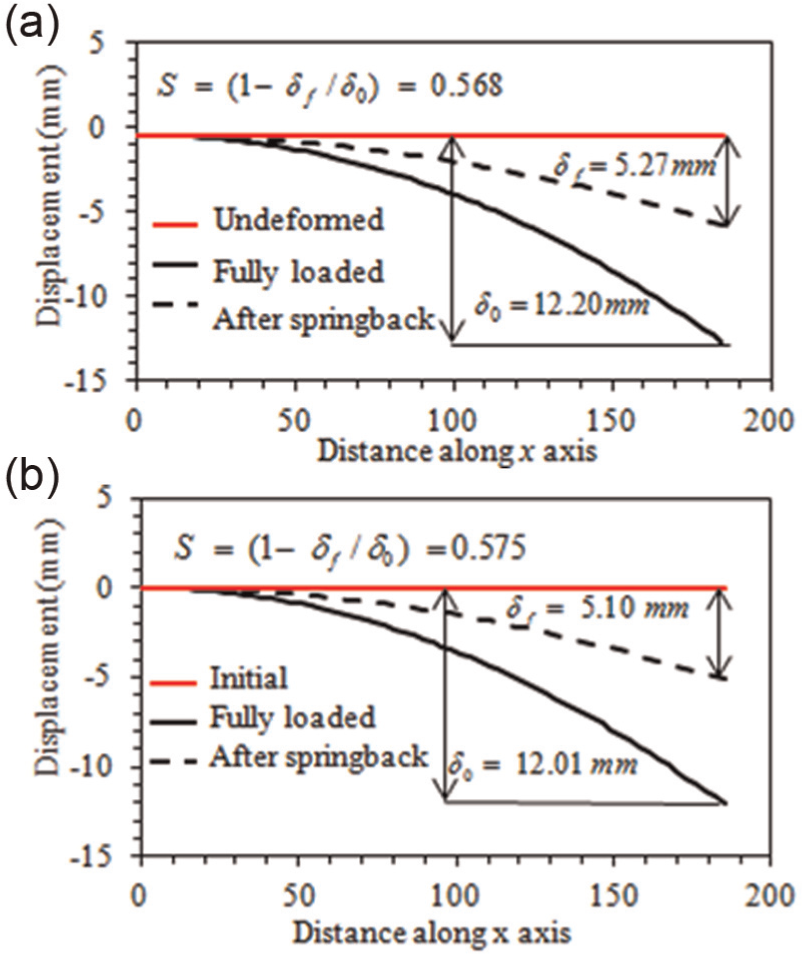
Overall springback predicted using the two loading cases of (a) end clamp and (b) uniform pressure.
Localised springback assessment
Definition of springback based on local curvatures
A detailed analysis of the deformed shape of the workpiece after springback can be obtained by local curvature measurements around the circumference of the workpiece. A schematic illustration is shown in Figure 9 to demonstrate the local curvature determination method. Along the workpiece transverse direction, several localised curvatures can be identified, and these localised features enable the ‘quality’ of the workpiece’s shape to be assessed at fully loaded and post springback conditions. To achieve a high resolution and stable curvature distribution, coordinates of three nodes located at the mid-thickness and width of the workpiece with an increment of 10 nodes between them (corresponding to an initial, undeformed separation of 30 mm) were selected. The local radius of curvature Ri of a workpiece was determined using the coordinate measurements of these three nodes using equations (10) and (11)
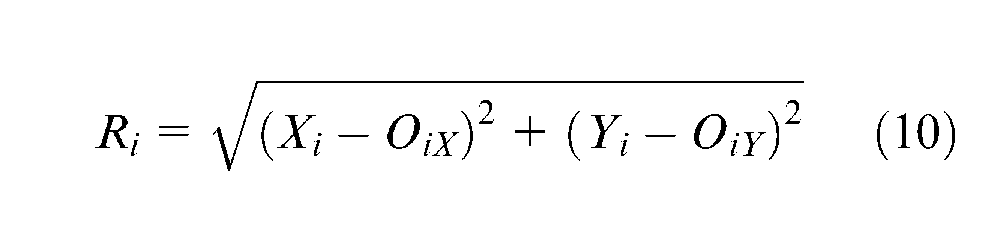
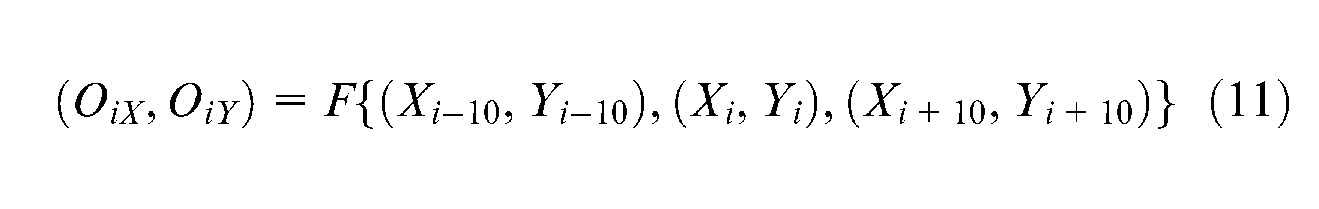
where (
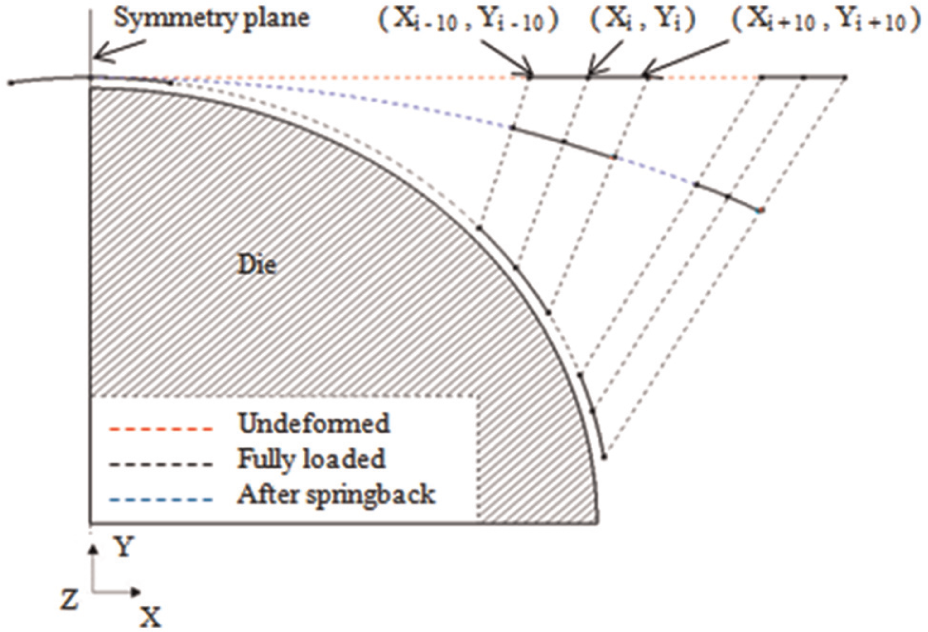
Schematic illustration for local curvature determination method.
Using these localised curvature measurements, a curvature index (CI) has been defined to quantify the deviation in the workpiece’s geometry from that of the tool at any instant during the CAF procedure. The CI is defined through equations (12) and (13)


where
A CI of unity indicates that the workpiece has no curvature and maintains its initial, undeformed shape. A CI = 0 means that the workpiece has the exact same shape as the die. This CI factor enables the workpiece’s shape to be evaluated at full load and after springback.
Similarly, a springback index (SI) is defined in equation (14) to compare the workpiece’s geometry before the load is removed at the end of the CAF process and after springback occurs. The SI is mathematically defined as

where
Local springback assessment
The variation of the CI along the length of the workpiece at the initial fully loaded condition (t = 0 h) is compared in Figure 10 for the end clamp and uniform pressure loading conditions. The distance along the workpiece is identified by the undeformed x coordinates of the mid-nodes (0–156 mm) in the set used for the curvature measurement.
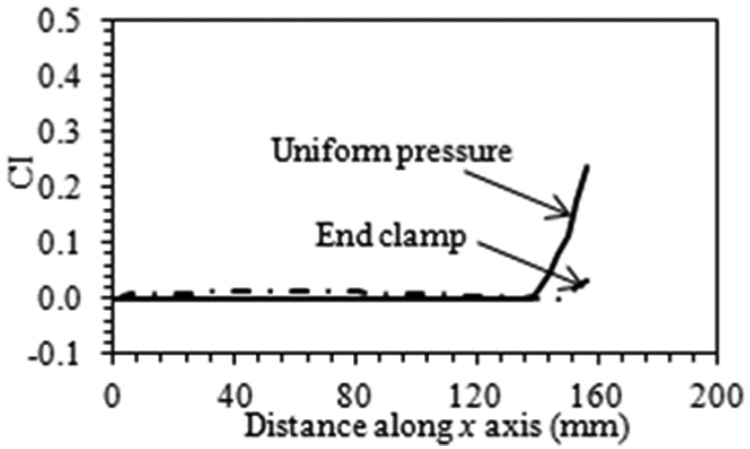
Comparison of curvature index (CI) variation along the workpiece for the end clamp and uniform pressure conditions at time t = 0 h (fully loaded).
Along the circumference of the workpiece, from its mid-point to end, the local CI, for the case of uniform pressure, starts to increase from 0 at 126 mm from the workpiece’s mid-length, which indicates that there is a small gap between the end area of workpiece and the die, and that the majority of the workpiece is pressed tightly against the die’s surface. For the end clamp condition, the localised curvature has a parabolic profile between the workpiece’s mid-length and the clamp’s point of contact (149 mm from the workpiece’s mid-length) with a peak value of 0.014 at 66 mm from the workpiece’s mid-length. At the end area of the workpiece, the CI increases again to 0.019 due to the line contact between the clamp and workpiece at 173 mm from the workpiece’s mid-length (note that there is no contact between the clamp and workpiece for a distance of 12 mm from the end of the workpiece). In general, however, the localised CI for the clamped workpiece is just above 0, indicating a small gap between the workpiece and die. These results are consistent with those observed in Figure 6 and demonstrate that there are some significant differences in the CAF process for both loading conditions.
The effect of springback on the local curvature of the workpiece for both loading conditions has also been evaluated, as shown in Figure 11. The trend clearly indicates that the springback results depend on the loading conditions.
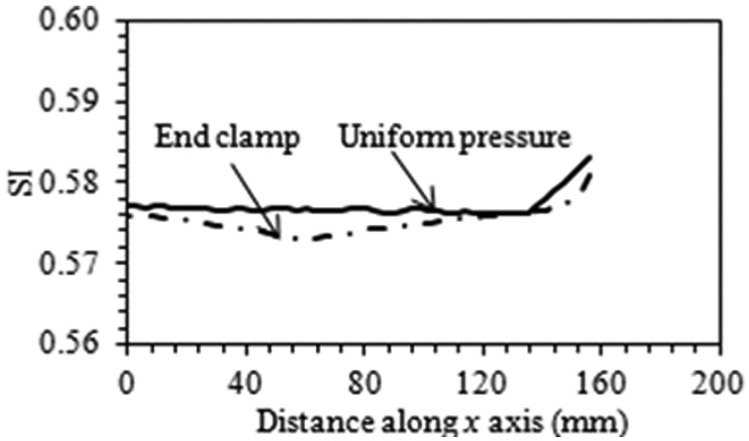
Comparison of springback index (SI) variation along the workpiece for the end clamp and uniform pressure conditions after springback.
The localised SI for uniform pressure conditions increases significantly at the end of the workpiece, but is relatively uniform at other regions. Similar trends are seen for the end clamp condition. However, there are greater fluctuations in the SI values observed. The average SI value for end clamp condition is 0.575 with a standard deviation of 0.11%, and the average SI value for the uniform pressure case is 0.578 with a standard deviation of 0.03%.
The SI value for the end clamped condition is less than that of the uniform pressure loading condition on average by 0.56%. This corresponds to that found in the overall springback assessment (Figure 8), where the overall springback factor for the end clamped condition was 1.2% less than that for the uniform pressure condition. However, the lower standard deviation in the SI for the uniform pressure case indicates that springback is relatively consistent over the workpiece. Therefore, a uniform springback factor over the workpiece can be achieved, which enables tools to be designed to compensate for springback more easily.
Sensitivity of springback to vacuum loading pressure
A sensitivity study has been performed to determine the influence of the pressure magnitude on the CI. Three values of pressure have been considered in total, that is, 10, 18 and 30 MPa. For each load, the local CI has been evaluated on initial loading (t = 0 h) and after springback, as shown in Figure 12(a) and (b), respectively.
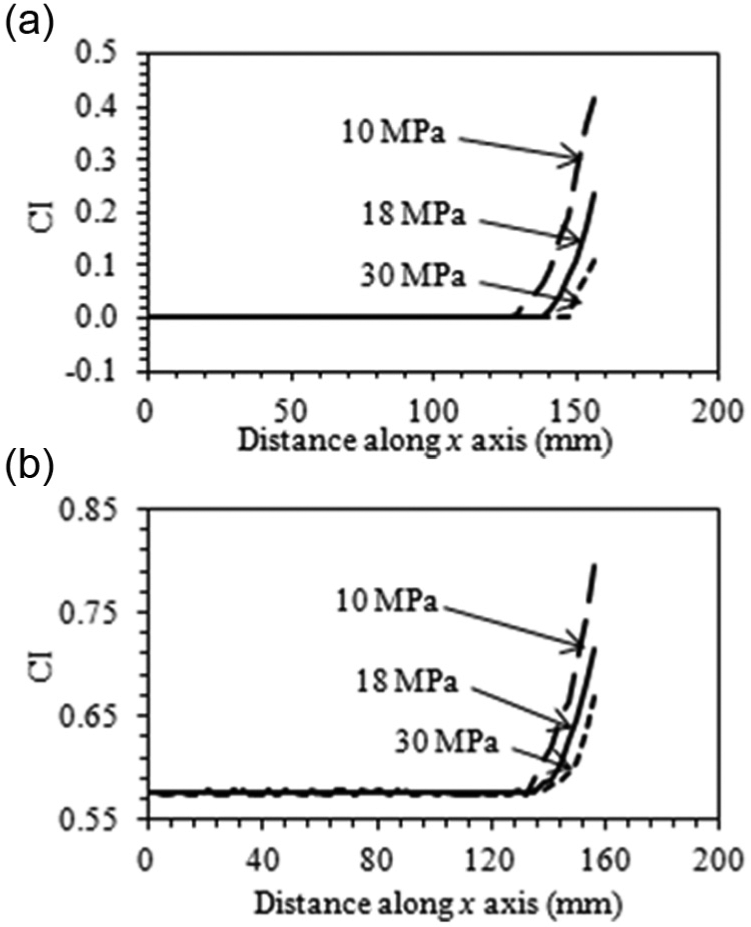
Effect of uniform pressure magnitude on the curvature index (CI) variation along the length of the workpiece from its centre point: (a) fully loaded and (b) after springback.
Under full load, the CI at the end of the workpiece with a pressure of 30 MPa is four times less than that at 10 MPa. An increase in pressure enables the CI to reduce to a stable value of 0 over shorter distances from the workpiece edge. Similar overall trends are seen in Figure 12(b) after springback. The CI at the end of the workpiece at a pressure of 10 MPa reaches 0.82, while for 18 and 30 MPa, this reduces to 0.721 and 0.673, respectively. The CI for all three cases stabilises at value of around 0.575 with a standard deviation of 0.03%. These results indicate that with a sufficiently high pressure, a workpiece with a stable CI distribution can be achieved.
Conclusions
Numerical models have been established to analyse the difference in springback predictions between the two loading cases: end clamp and uniform pressure. The former is often used in small-scale laboratory testing and the latter in real industrial forming processes.
Good contact between the tool and workpiece’s surfaces was achieved for the uniform pressure condition, providing sufficient pressure was applied, except close to the plate edge where no contact was observed. In contrast, contact was only achieved at the mid-length of the end clamped specimens, and that contact was in the vicinity of the clamps themselves. A parabolic profile was found to exist between the middle of the specimen and the end clamp position, which attained a maximum of 0.065 mm for the test piece investigated, which further increased by about 50% during 20 h of age forming. For the uniform pressure condition, the size of the gap decreases with pressure magnitude and ageing time. A method has been established to assess the local curvature and local springback values for the formed parts. For the uniform pressure loading, the springback is relatively uniform apart from at the ends. However, for the end loading case, the amount of springback varies noticeably along the length of the workpiece. These differences observed between the two loading conditions will increase with component size and hence will cause significant variation in the curvature of the formed parts. Thus, for a large-scale component, the springback evaluated from end clamping could not be used for assessing the springback from uniform pressure loading. It is recommended that laboratory-scale end clamping tests should not be used to model springback features for the real vacuum forming processes as the local springback distributions are significantly different, even if the overall magnitudes are similar.
Footnotes
Declaration of conflicting interests
The authors declare that there is no conflict of interest.
Funding
This study was sponsored by the capital aerospace machinery company (CAMC), China. Catrin M. Davies acknowledges the support of the Engineering and Physical Sciences Research Council (EPSRC), UK, under grant EP/I004351/1.