
Abstract
In this article, we present an in-line model that can be used for predicting the front end bending of a material frequently produced by hot plate rolling under asymmetric rolling conditions. The in-line model was formulated by examining the relationship between asymmetric rolling conditions and front end bending slope and by expressing front end bending slope as a function of asymmetric rolling conditions as well as roll-bite profiles (shape factor and reduction ratio). We also performed a pilot hot plate rolling test to verify the usefulness of the proposed in-line model. Before the rolling test began, a board-shaped specimen that had been heated in a reheating furnace at 1100 °C was half submerged, horizontally, in a bathtub filled with cold water to derive temperature variation of the specimen along the specimen’s thickness direction, which is one of the asymmetric rolling conditions that produce front end bending. Results show that front end bending slopes formulated as a double-linear function of asymmetric rolling conditions as well as roll-bite profiles (i.e. shape factor and reduction ratio) were successful. The proposed in-line model computed immediately the amount of front end bending whenever the roll-bite profiles and asymmetric rolling conditions changed during rolling. The results predicted by the in-line model were within 6.5%–10.3% of the front end bending slopes measured from the pilot hot plate rolling test.
Introduction
In a plate rolling process, material undergoes a forward and backward journey with no coiling as its thickness is decreased step by step by rolling. The front end of the material is frequently bended upward or downward, when viewed from the side of the material. This behavior is termed “front end bending (FEB),” which occurs due to asymmetric rolling conditions such as circumferential speed deviations between the upper and lower work rolls, temperature difference along the material thickness direction, or various minor causes at interface between the material and the work rolls.
In tandem rolling like strip rolling, FEB occurred in the preceding stand (pass) makes it difficult for the material to be bitten by the work rolls of the next stand. A stand implies a unit machine that has work rolls and backup rolls. In particular, a large amount of FEB damages the surfaces of work rolls and shortens the life of the work rolls since the head of the material hits the work rolls before it is squeezed in the work rolls. Therefore, it is very important for mill engineers to quantitatively assess FEB and to minimize it. (Hereafter, “work roll” is called “roll” for convenience.)
When FEB occurs, the upper and lower contact lengths at the interfaces between the rolls and the material during rolling become unequal. Based on this observation, previous studies1–6 introduced a dimensionless parameter called the shape factor, defined as the ratio of mean contact length to mean thickness of the material. Yoshii et al. 1 examined FEB behavior as a function of the shape factor in plate rolling. Park and Hwang 2 studied the effect of the shape factor, incoming material thickness, and reduction ratio on FEB behavior in plate rolling. Lu et al. 3 introduced a mean shape factor to investigate FEB behavior in strip rolling in cases where the diameters of the upper and lower rolls were different. Nilsson 4 performed both a pilot rolling test and a numerical study to analyze FEB behavior. Using the finite element (FE) method, Philipp et al. 5 showed that the direction of FEB is dependent on the material thickness. Mousavi et al. 6 carried out a series of FE analyses and showed that FEB behavior of thin sheets depends on the shape factor in the cold rolling process.
These previous studies,1–6 however, did not consider the fact that a variety of roll-bite profiles are possible for a single shape factor. The roll-bite profile indicates the dimensions and profile of a material when the material is deformed between rolls. The roll-bite profile can be determined if the incoming thickness of the material, its exit thickness, and the diameters of the rolls are given. In other words, a roll-bite profile can be described if the shape factor and the reduction ratio are specified.
Recently, Byon et al. 7 computed a distinct value of FEB for a given roll-bite profile by introducing a geometric factor (defined as the ratio of the roll radius to the incoming material thickness). They revealed the relationship between roll-bite profiles and FEB but did not investigate the effect of the combination of roll-bite profile and asymmetric rolling condition on FEB. No study has been undertaken on how the combination of roll-bite profile and asymmetric rolling condition influences FEB. In addition, an in-line model that explicitly calculates FEB as a function of roll-bite profile and asymmetric rolling conditions has been sought to control FEB in real time for actual plate rolling processes. This is the basis of this study.
In this article, we propose an in-line model for predicting the FEB in hot plate rolling. The proposed model can be established in two steps: In the first step, a series of FE analyses are performed to examine the relationship between asymmetric rolling conditions and FEB for diverse roll-bite profiles. Circumferential speed deviations between the upper and lower rolls and temperature differences along the material thickness direction are selected as representative asymmetric rolling conditions. In the second step, an equation of the plane is formulated, so that FEB can be expressed explicitly in terms of the asymmetric rolling conditions for diverse roll-bite profiles. The equation of the plane can be a practical in-line model that directly computes the amount of FEB whenever the roll-bite profiles or asymmetric rolling conditions change during rolling.
We also performed a pilot hot plate rolling test to verify the usefulness of the in-line model. We imposed an artificial temperature variation in the material’s thickness direction by carefully immersing half of the board-shaped material, horizontally, in an open-type cooling bathtub. This temperature variation generated an asymmetric rolling condition across the material’s thickness during the hot rolling test.
In-line FEB slope model
Roll-bite profile and FEB slope
Figure 1(a) demonstrates the roll-bite profile and relevant parameters for the case in which FEB occurs due to different circumferential speeds of the upper and lower rolls. Parameters
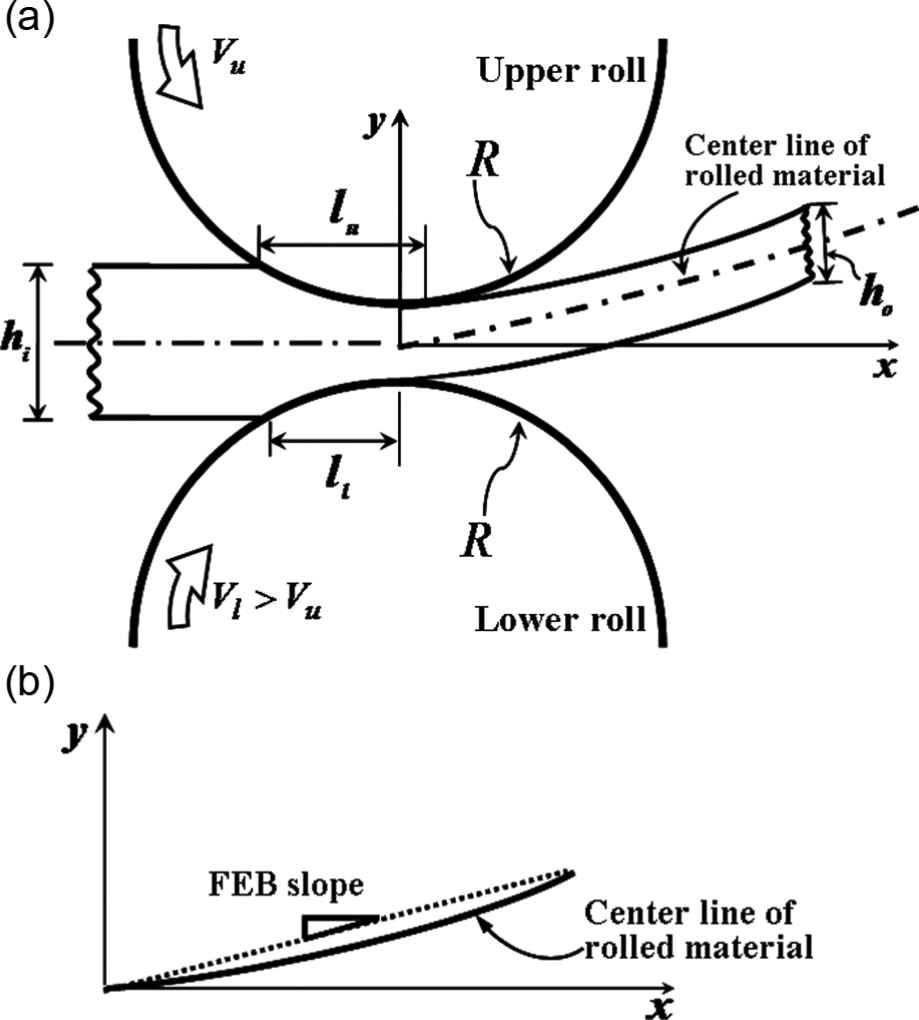
(a) Parameters and notations required to depict the roll-bite profile and FEB and (b) a definition of FEB slope.
Dimensionless parameters depicting the roll-bite profile
Shape factor s, a dimensionless parameter depicting the roll-bite profile, is expressed as follows: 8
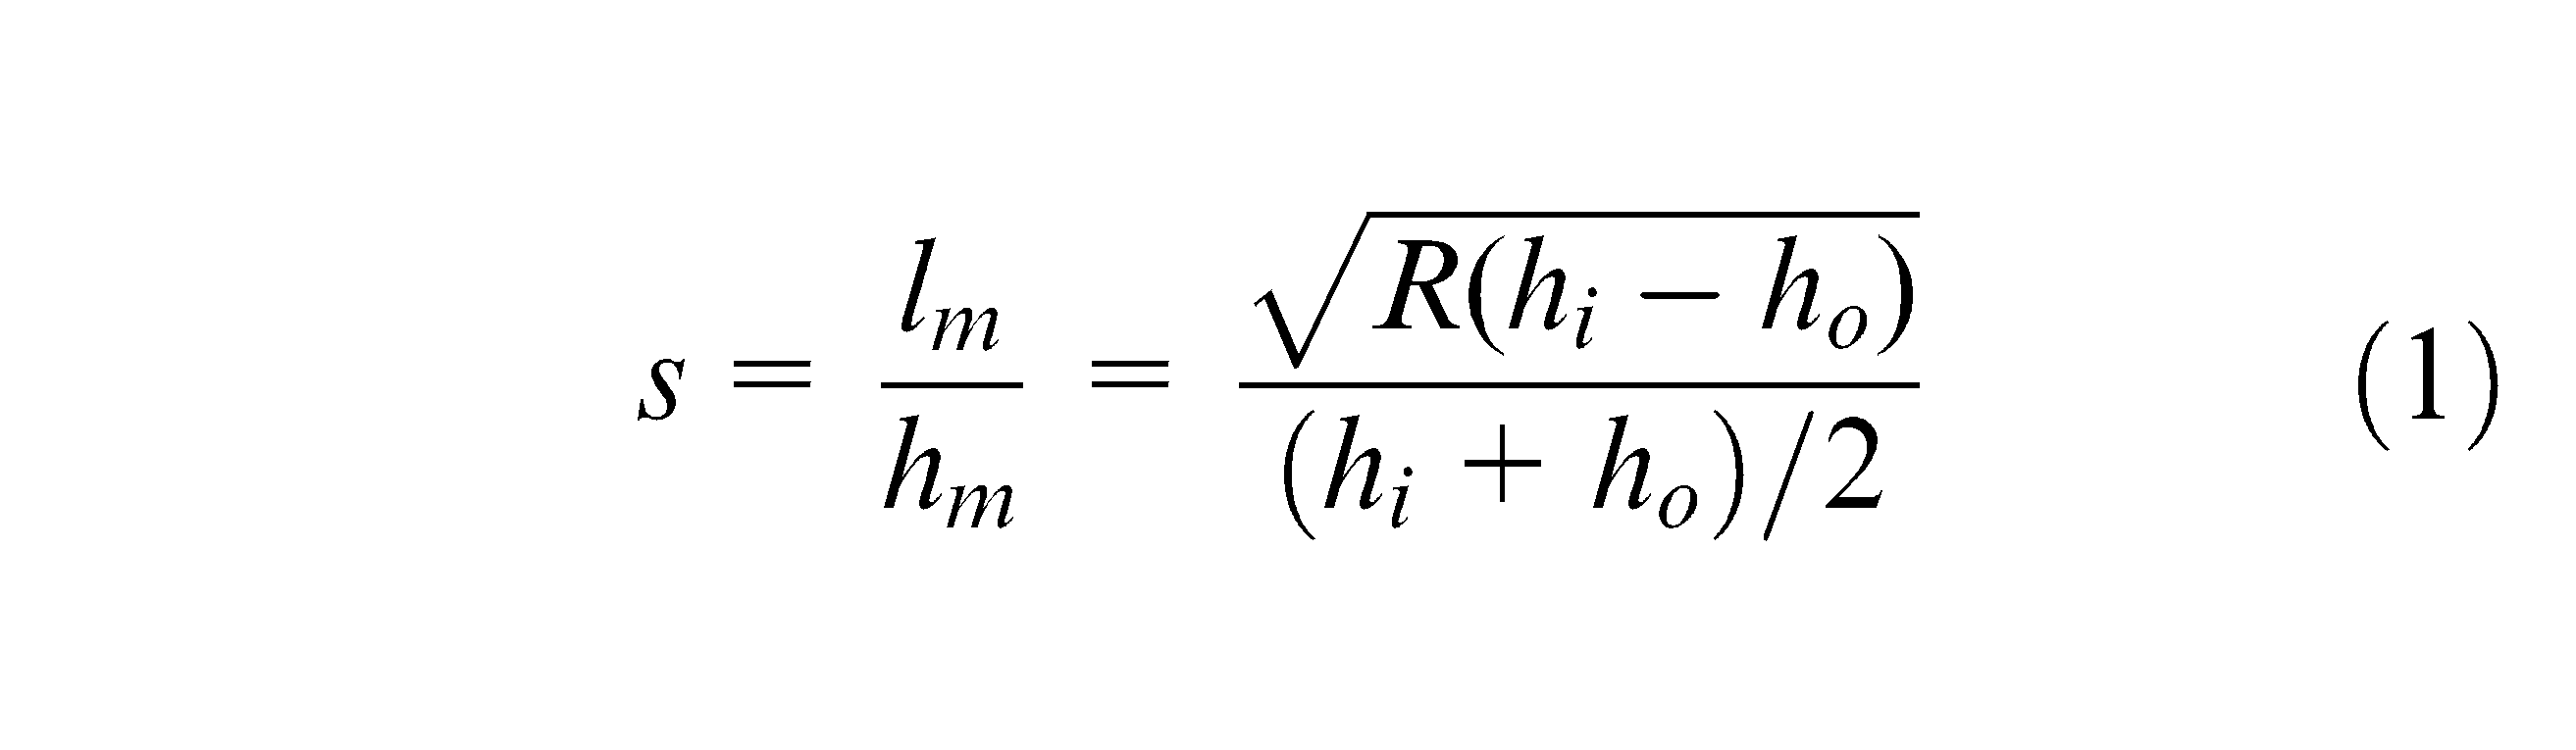
lm denotes the mean contact length and is approximated as
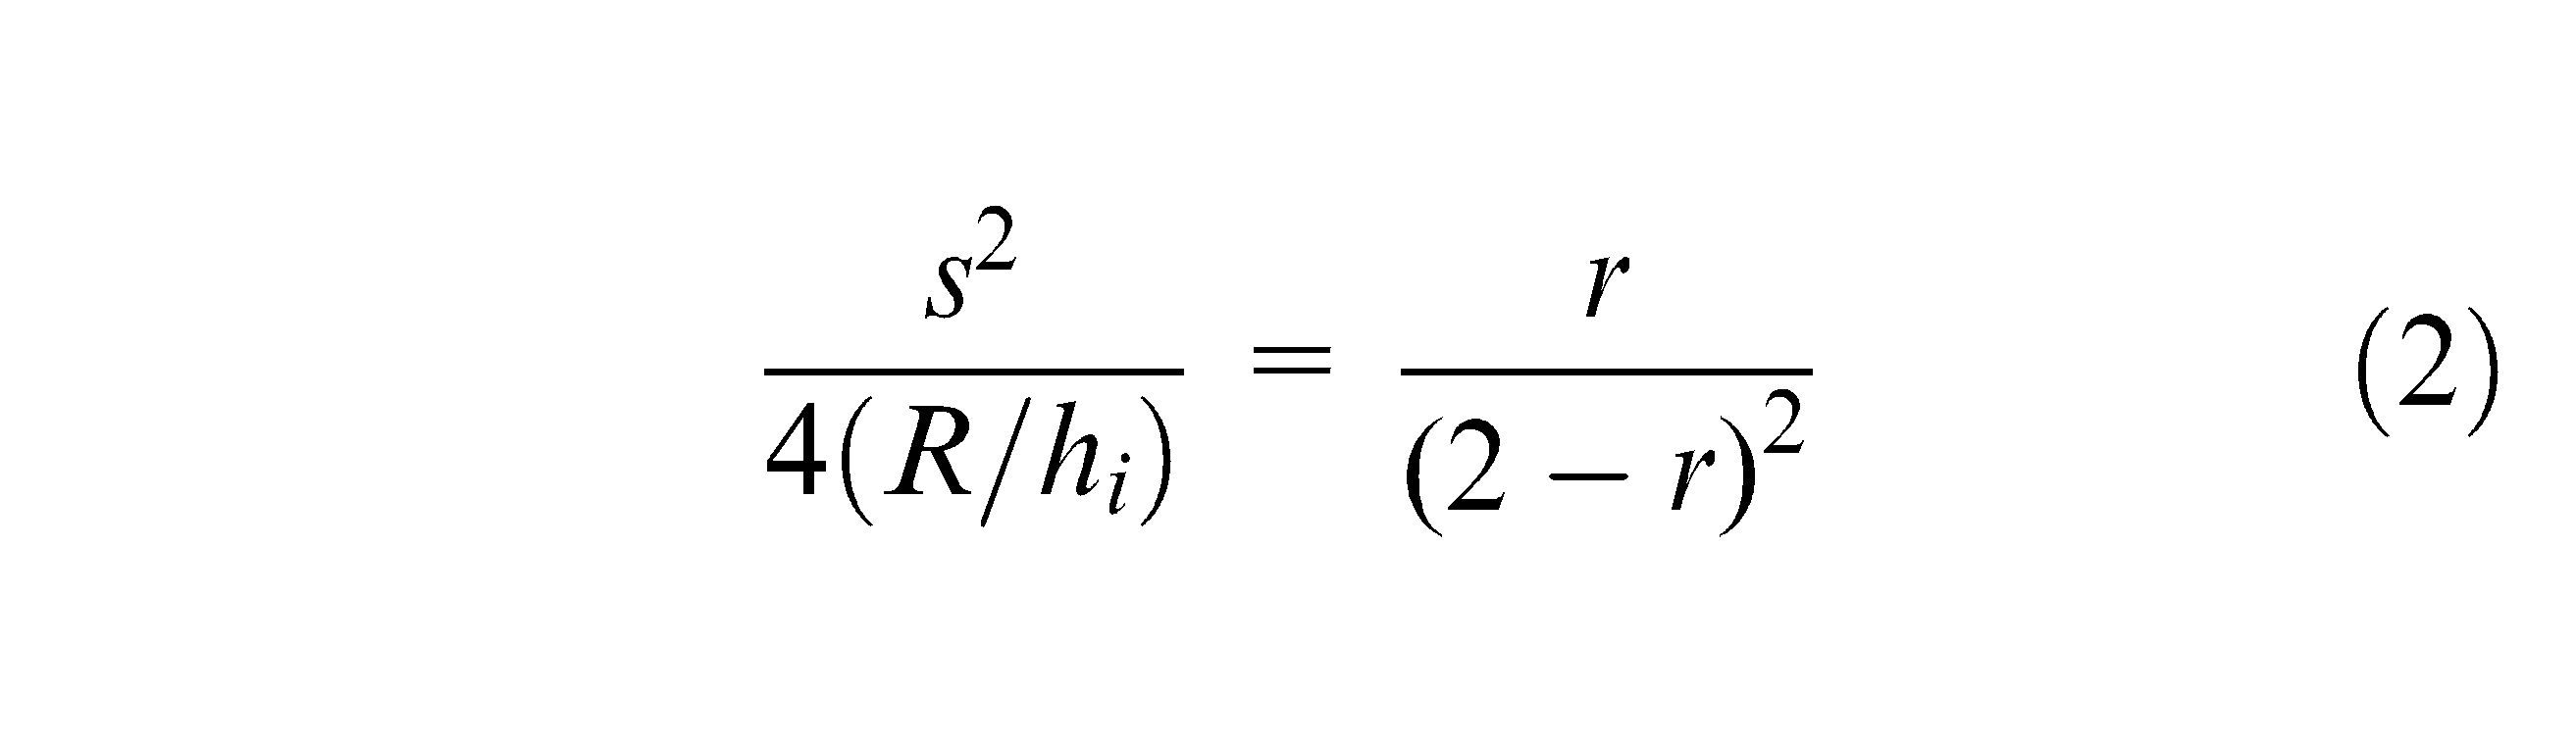
Equation (2) indicates that dimensionless parameters s, r, and R/hi depicting the roll-bite profile are interrelated. Since three dimensionless parameters s, r, and R/hi are coupled through equation (2), we know that the number of dimensionless parameters required to depict the roll-bite profile is two. 7 Hence, we selected the shape factor s and the reduction ratio r as the dimensionless parameters to depict a roll-bite profile.
Formulation of equation for the in-line FEB slope model
The preceding section showed that the dimensionless parameters for depicting the roll-bite profile are shape factor s and reduction ratio r. If variations in temperature along the material thickness direction and differences in circumferential speed between the upper and lower rolls are selected as asymmetric rolling parameters, equation for FEB slope
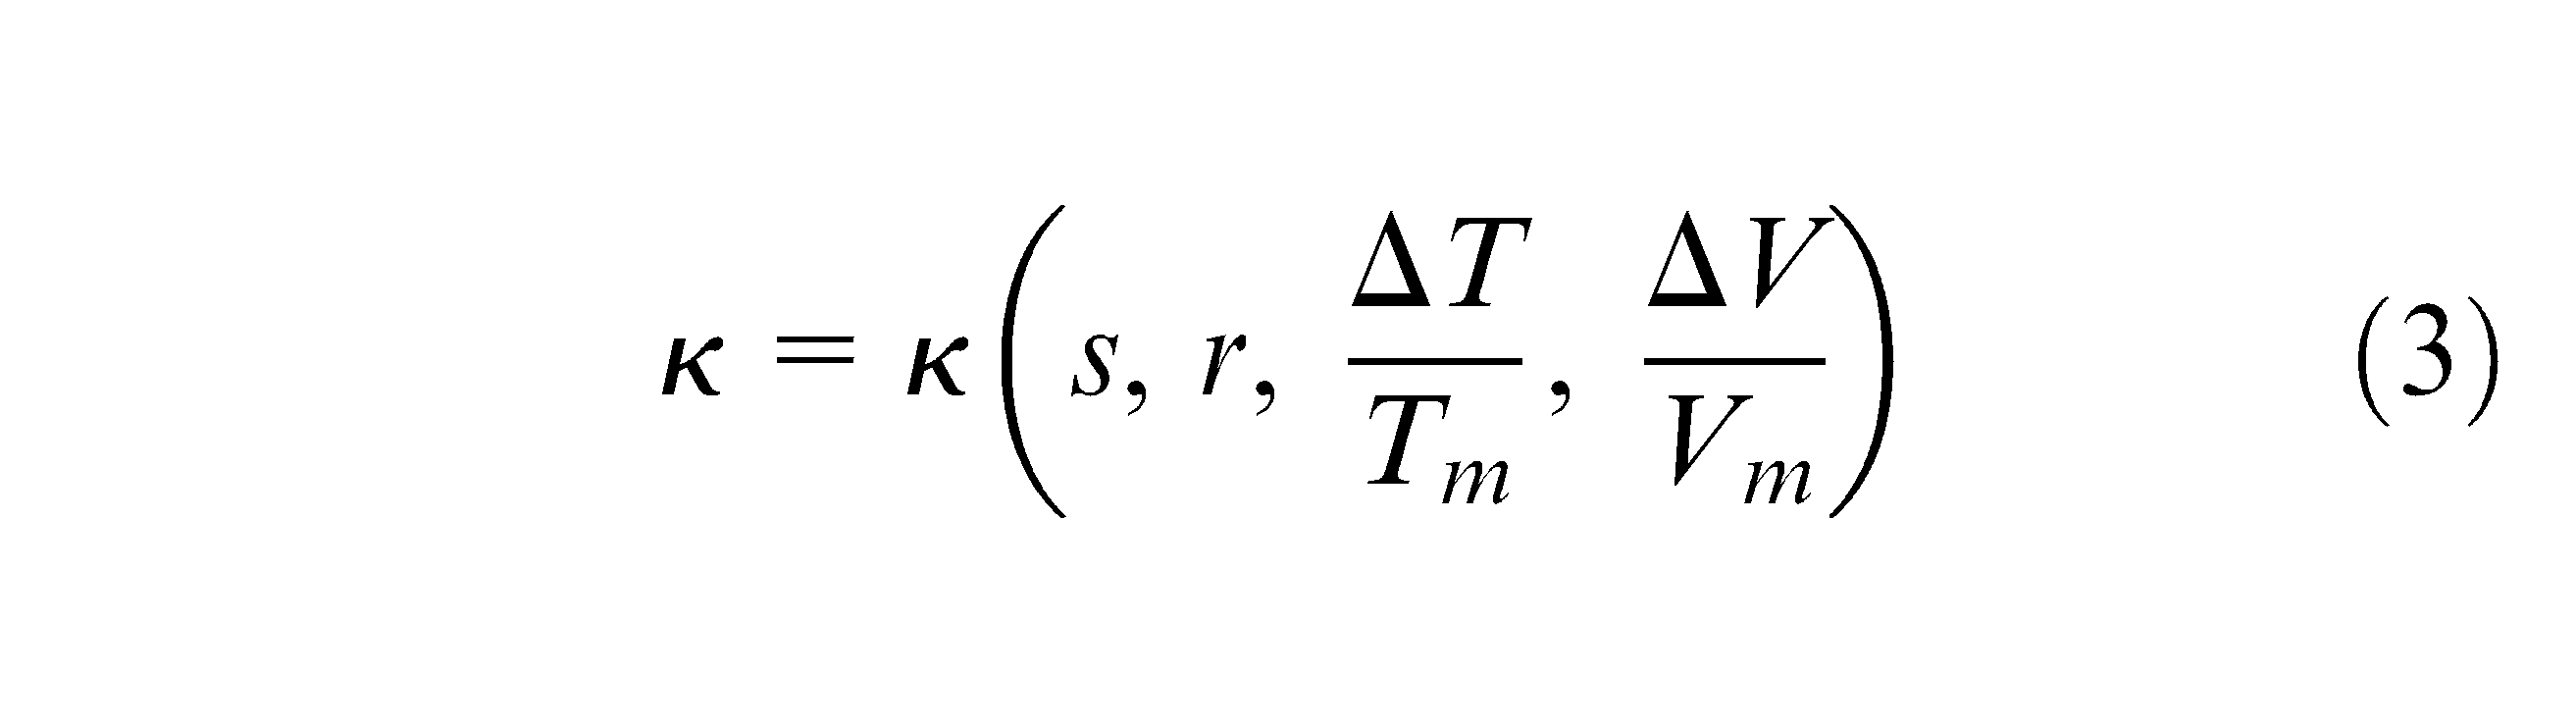
The in-line model is developed to instantly predict FEB frequently occurring in an actual plate mill. Since the control algorithm embedded in the Programmable Logic Controller (PLC) in an actual plate rolling mill has linearity, the equation for FEB slope should also have a linear form. Viewed in this light, equation (3) can be rewritten as follows:
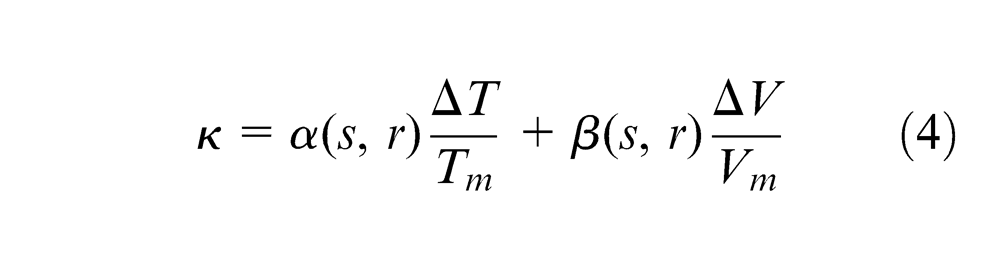
α and β denote the coefficients and are to be determined if the shape factor s and the reduction ratio r are given. Requirements were placed on the choice of such a form to ensure boundary conditions and linearity, simultaneously. To confirm the validity of equation (4), the boundary conditions of the proposed model were examined. If variations in temperature along the material’s thickness direction,
Equation (4) indicates that FEB slope can be expressed explicitly in terms of
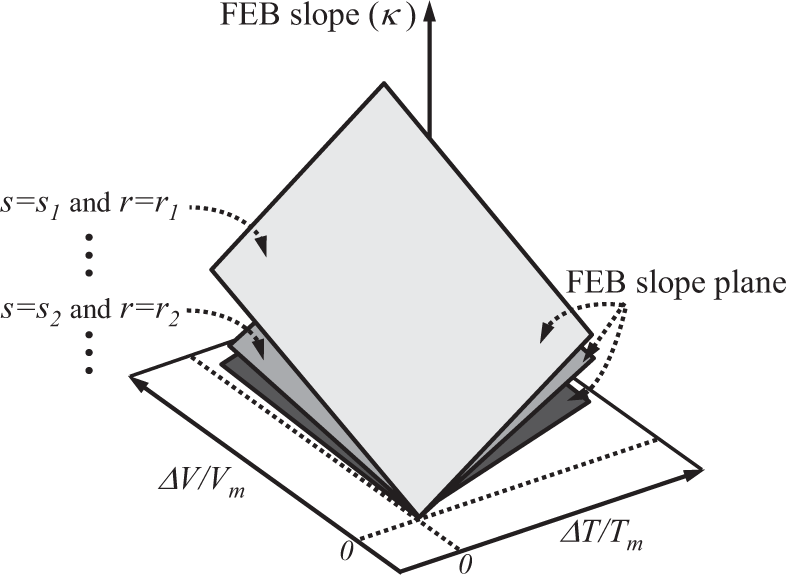
Schematic representation of possible planes of FEB slope for a given shape factor s and reduction ratio r.
Coefficients α and β represent the slopes of the planes rotating on the axes of
For an actual plate rolling mill, the changeable range of the dimensionless geometric parameters (shape factor s and reduction ratio r) and dimensionless asymmetric process parameters (temperature variations across the material’s thickness,
Equations (4) and (5) are very useful to predict FEB slope of material in an actual plate mill. The biggest advantage of using the equations (4) and (5) is that we can predict FEB slope of material in real time at an arbitrary various roll-bite profile (reduction ratio change and roll diameter change due to roll dressing) and asymmetric rolling conditions (i.e.
Experiment
Pilot rolling mill and specimen
Figure 3 shows a single-stand two-high pilot rolling mill, driven by a constant torque direct current (DC) motor of 11 kW power. The pilot rolling mill has a maximum torque of 5 kN m. Ductile casting iron (DCI) with a roll of 160 mm diameter and 240 mm barrel length. The board-shaped specimens were machined from a billet. The specimen length, width, and thickness were 140, 60, and 15 mm, respectively. The billet used in this test was plain low-carbon (0.1%) steel.
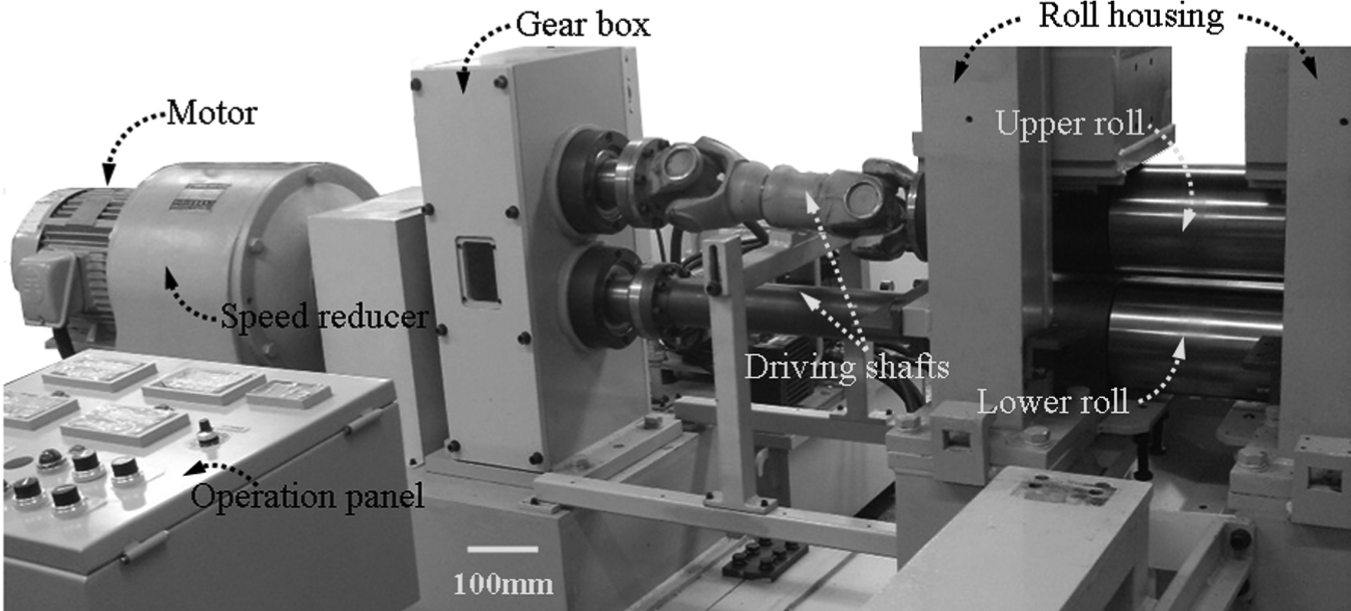
Single-stand two-high pilot rolling mill used in the hot rolling test.
Preliminary test to give temperature variation across specimen thickness
The board-shaped specimen was heated in a reheating furnace at 1100 °C for 20 min to ensure its homogenous temperature distribution. The specimen was then half submerged in the bathtub filled with cold water (15 °C), horizontally, to obtain the temperature variation across the specimen’s thickness direction, which is one of the asymmetric rolling conditions that produce FEB (see Figure 4). We performed preliminary tests to determine the time for the half submerged specimen to achieve the target temperature variation across the specimen’s thickness. The target temperature variation was confirmed from the analysis of the thermal image of the specimen taken by an infrared camera.
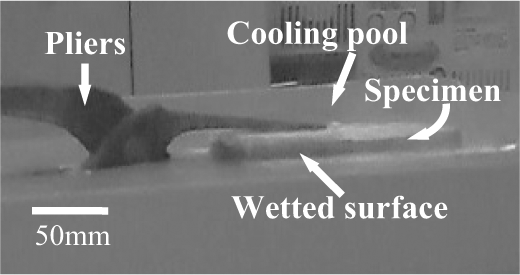
Board-shaped specimen is half submerged, horizontally, in a bathtub filled with cold water (15 °C).
Test procedure
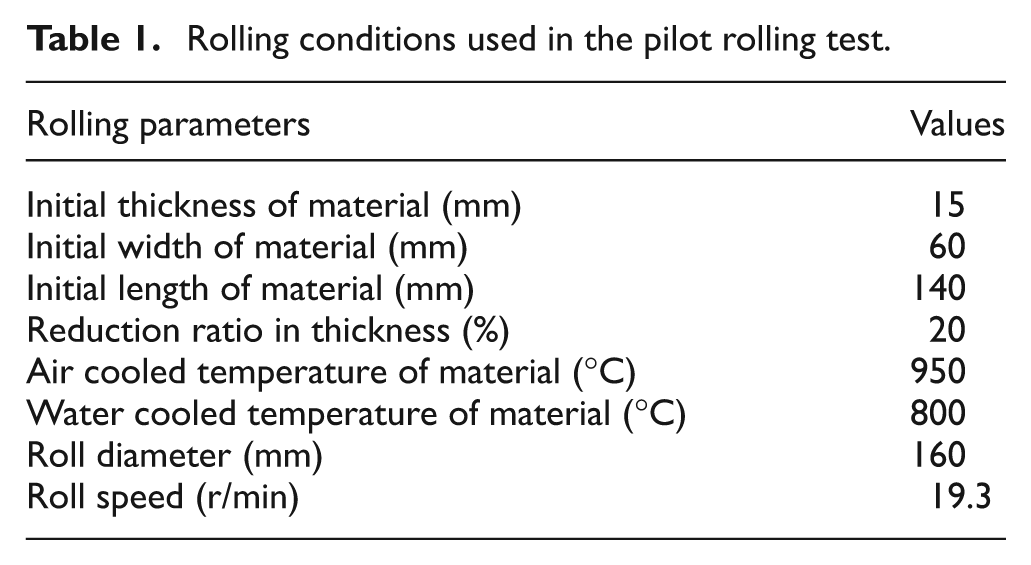
Before rolling, the specimen with temperature variation across its thickness was placed on the guide device such that the part cooled down by water faced upward (see Figure 5(a)). An insulation structure made of refractory bricks was positioned on the guide device to prevent heat transfer between the guide device and the high-temperature specimen. Figure 5(b) shows upward bend of the specimen’s front end, which was due to temperature difference along the specimen’s thickness direction, as viewed from the side of the specimen. The angular speed of the roll was 19.3 r/min. No lubricant was used in the rolling experiment. The rolling conditions used in the pilot rolling tests are given in Table 1.
Rolling conditions used in the pilot rolling test.
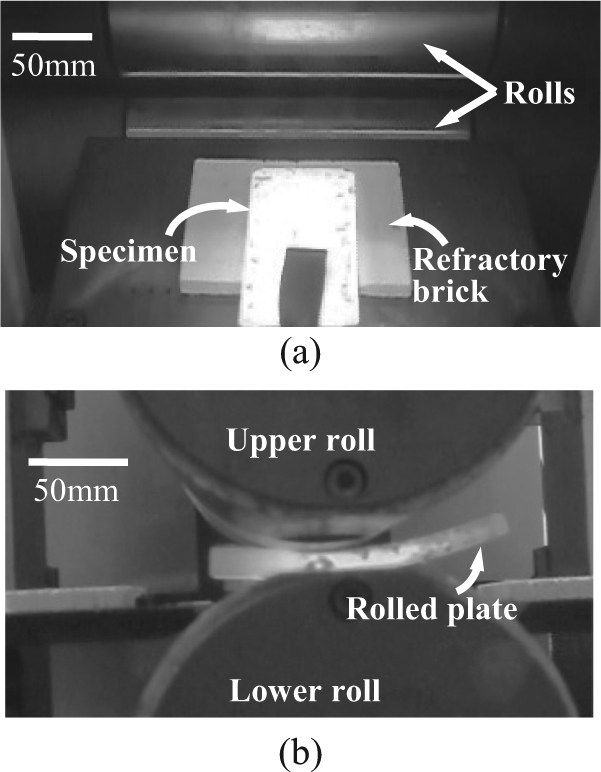
Rolling route: (a) specimen is about to be rolled and (b) FEB occurs during rolling.
FE model
We used a commercial FE program, Abaqus, which is suitable for analyzing nonlinear elastic-plastic deformations of materials. Figure 6 shows the two-dimensional FE model used in this study. The dimensions of the rolls and the material as well as the mesh and boundary conditions of the material are shown. The symbolic parameters used for explaining the boundary conditions are listed in Table 2. The front end of the material tapered to some extent so that the material is bitten easily by the rolls. Contact boundary condition was assigned at the interface of the roll and the material. The friction at the interface between the roll and the material was assumed to follow the Coulomb friction law, and the friction coefficient was set to 0.35. A guiding table was modeled for the material to be bitten by the rolls in a straight line and no friction between the top side of the guiding table and bottom side of the material. Traction free condition (σn = σt = 0) was assigned to the other boundaries. The rolls are treated as rigid bodies since the influence of material’s plastic deformation in the gap between the rolls on the elastic deformation of the rolls is very small when material’s temperature is high, for example, greater than 800 °C.
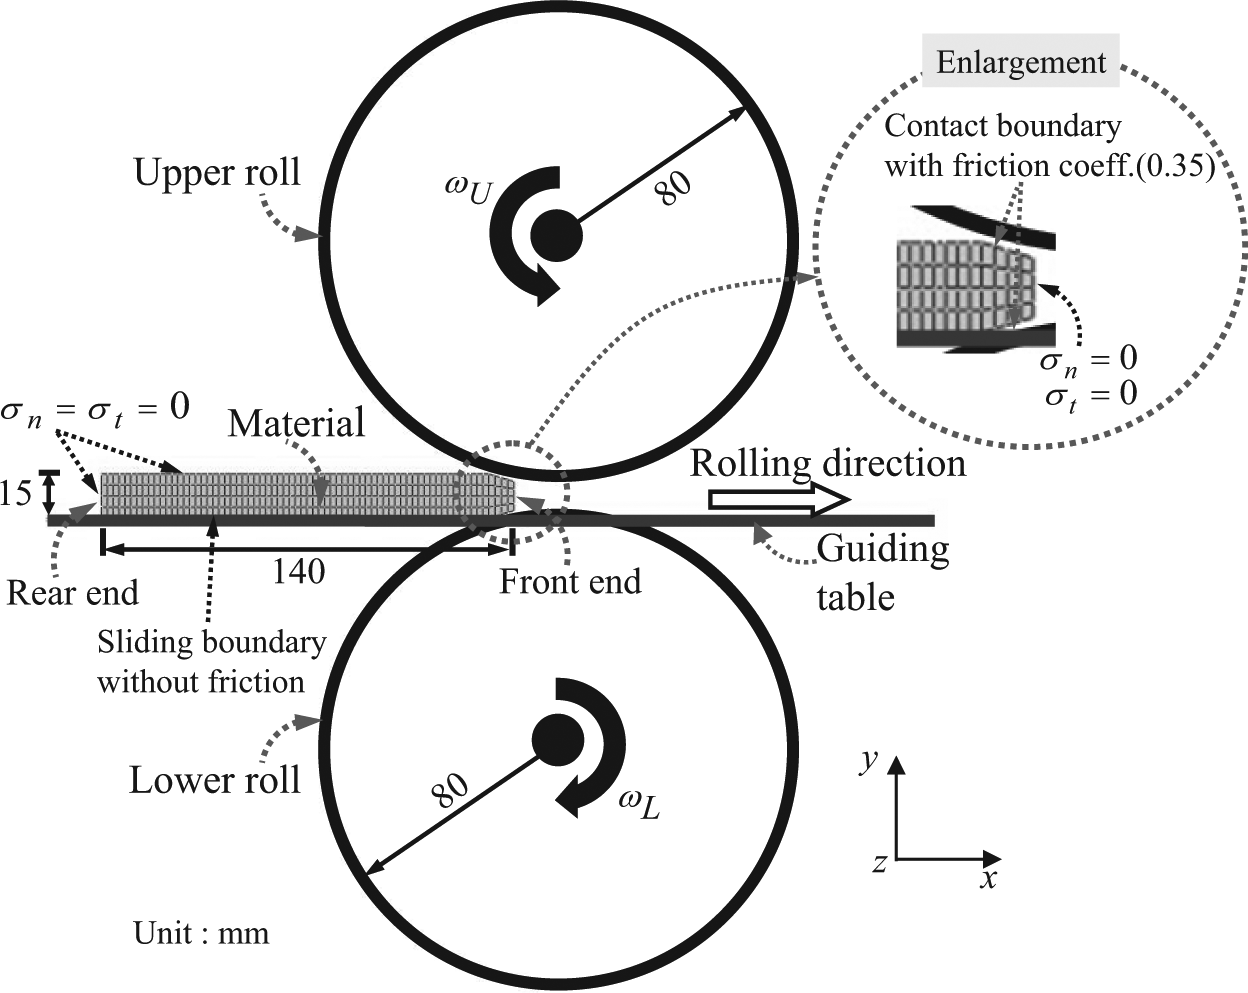
Finite element model used to simulate front end bending during plate rolling.
Description of parameters used in the finite element analysis.
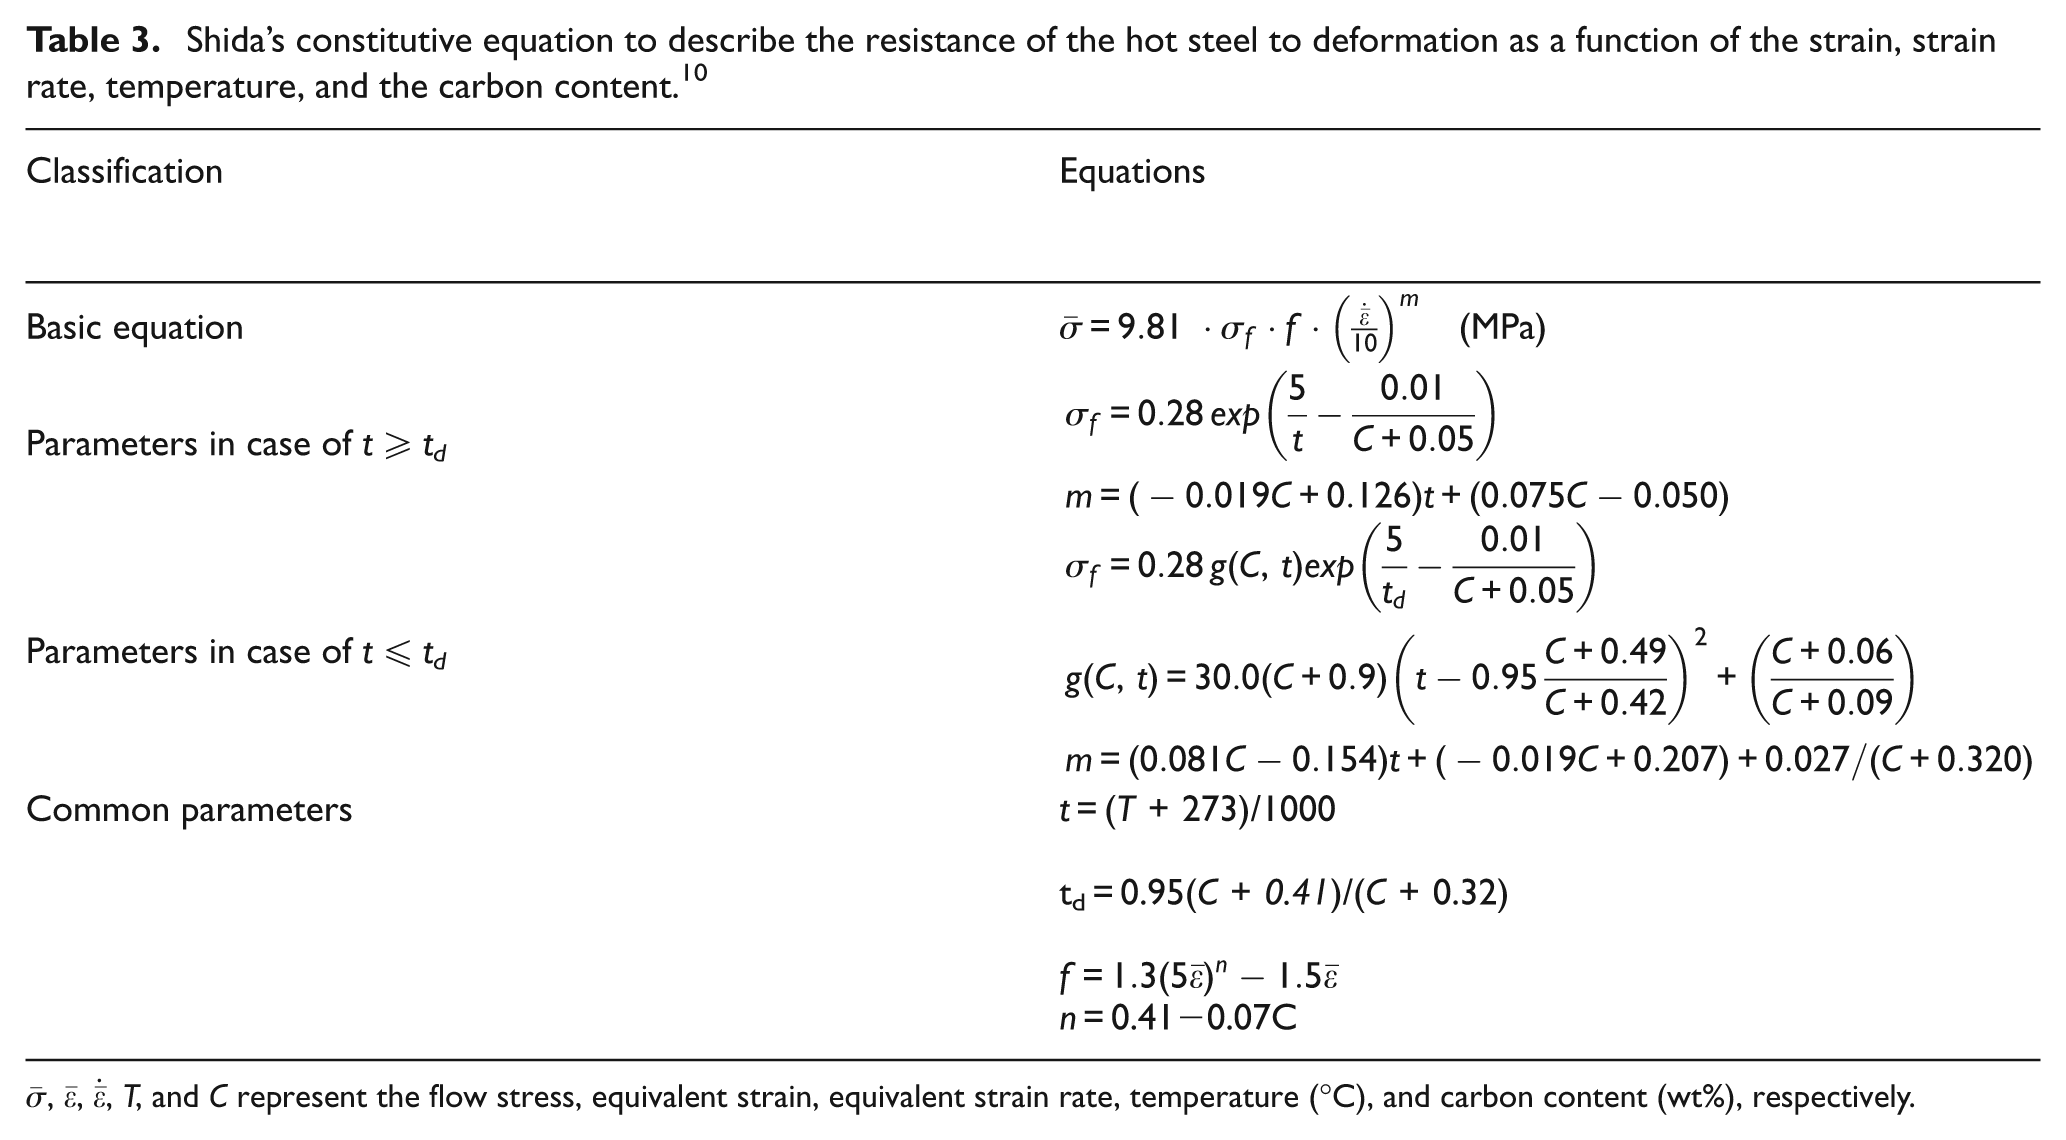
We assigned a temperature value to each element in the material, which was obtained from the preliminary test mentioned in “Preliminary test to give temperature variation across specimen thickness,” to reflect the temperature variation across material thickness. Shida’s 10 equation that depicts the flow stress of carbon steel as a function of temperature, strain, strain rate, and carbon content of material (see Table 3) was used as constitutive equation in the FE analysis. Its application ranges are as follows: carbon content, 0.07%–1.2%; temperature, 700 °C–1200°C; and strain, up to 0.7.
Shida’s constitutive equation to describe the resistance of the hot steel to deformation as a function of the strain, strain rate, temperature, and the carbon content. 10
Results and discussion
Comparison of the measured FEB with FE analysis results
In Figure 7, the predicted FEB (represented by a dashed, dotted, and dash–dotted line) is compared with the measured FEB shape (represented by a solid line) when the mesh density and friction coefficient are changed. The effect of mesh density on the predicted FEB is shown in Figure 7(a). The number of elements over the material thickness direction varies as follows: two, four, and six. When the number of elements is two, the prediction underestimates the measurement. Meanwhile, when the number of elements is four and six, the prediction overvalues the measurement. The effect of the Coulomb friction coefficient value on the predicted FEB is shown in Figure 7(b). The prediction comes close to the measurement as the friction coefficient values increase. In this study, friction coefficient of 0.35, which was generally used in the FE analysis of hot flat rolling, was chosen.
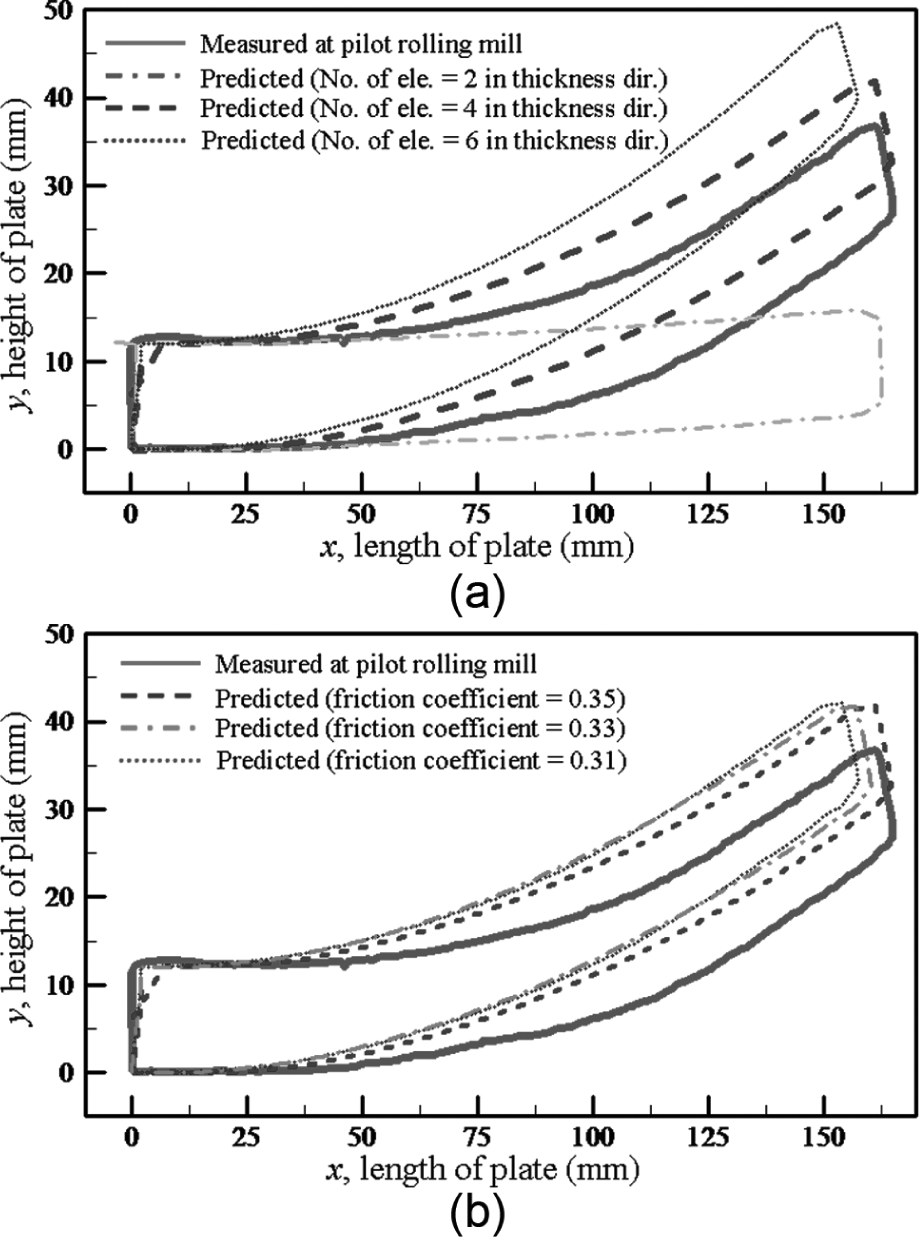
Predicted and measured shapes of specimen as viewed from the side: (a) change of specimen shapes with mesh density varied and (b) change of specimen shapes with friction coefficient varied.
The discrepancies between the predictions and measurements are attributable to followings. First, there are inevitably some differences between the temperature distributions assigned to the FEs and the actual temperature distribution over the material thickness. Second, the ratio of width to thickness of the specimen w/t = 4 (see Table 1) is not large enough for assuming a plane strain deformation problem, which has been adopted in the FE model of this study. Selection of this insufficient ratio in this work is due to limitation of the capacity of the pilot rolling mill employed in this study.
Planes for FEB slope in terms of shape factor and reduction ratio
In “Comparison of the measured FEB with FE analysis results,” the FE model was refined by comparing the measured FEB shape with the FE analysis results. Then, the FE model for predicting FEB slope was used to check the appropriateness of equation (4). For this purpose, a series of FE analyses were performed to obtain the planes of FEB slope in terms of the dimensionless geometric parameters (shape factor s and reduction ratio r) and the dimensionless asymmetric process parameters (temperature variations across the material’s thickness (
Combinations of dimensionless parameters used in finite element analysis.
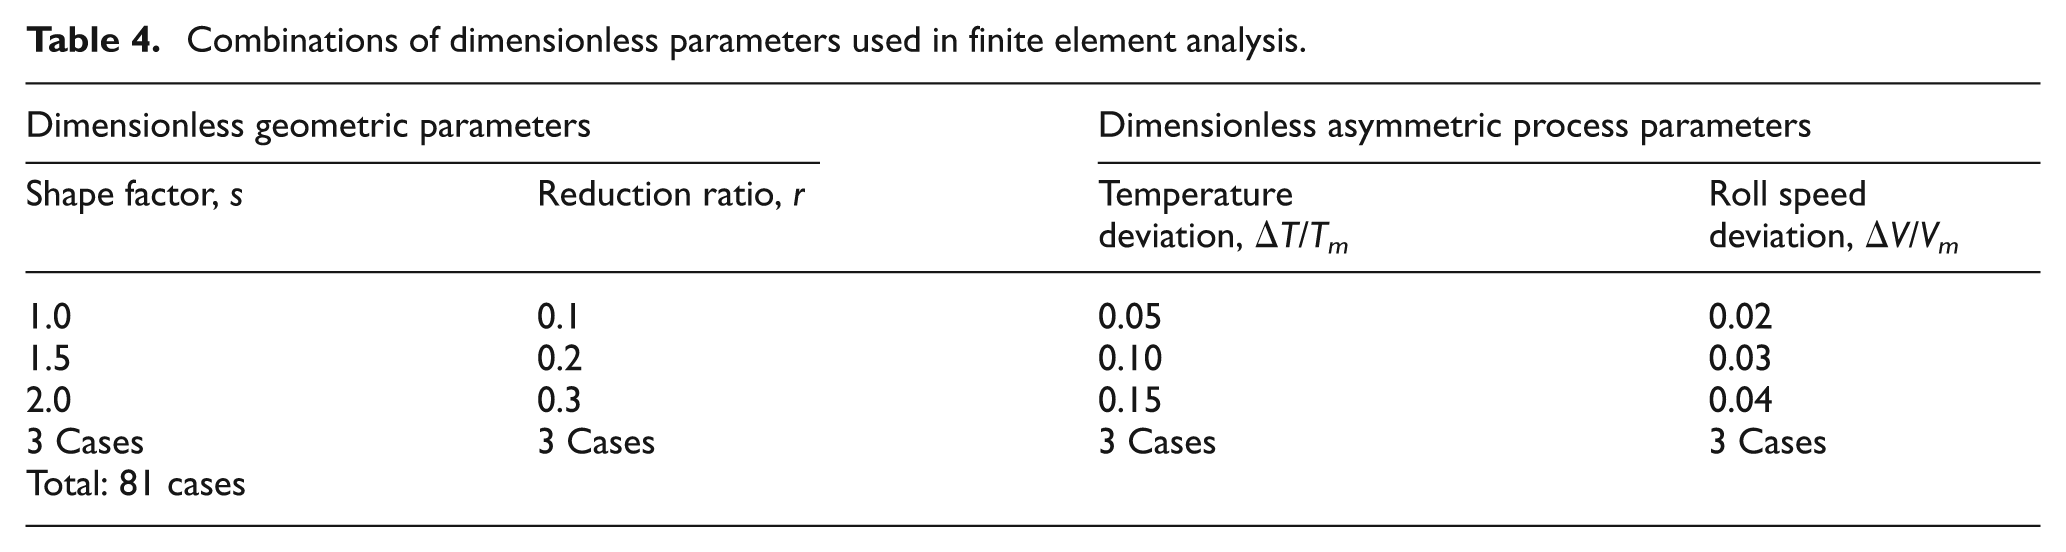
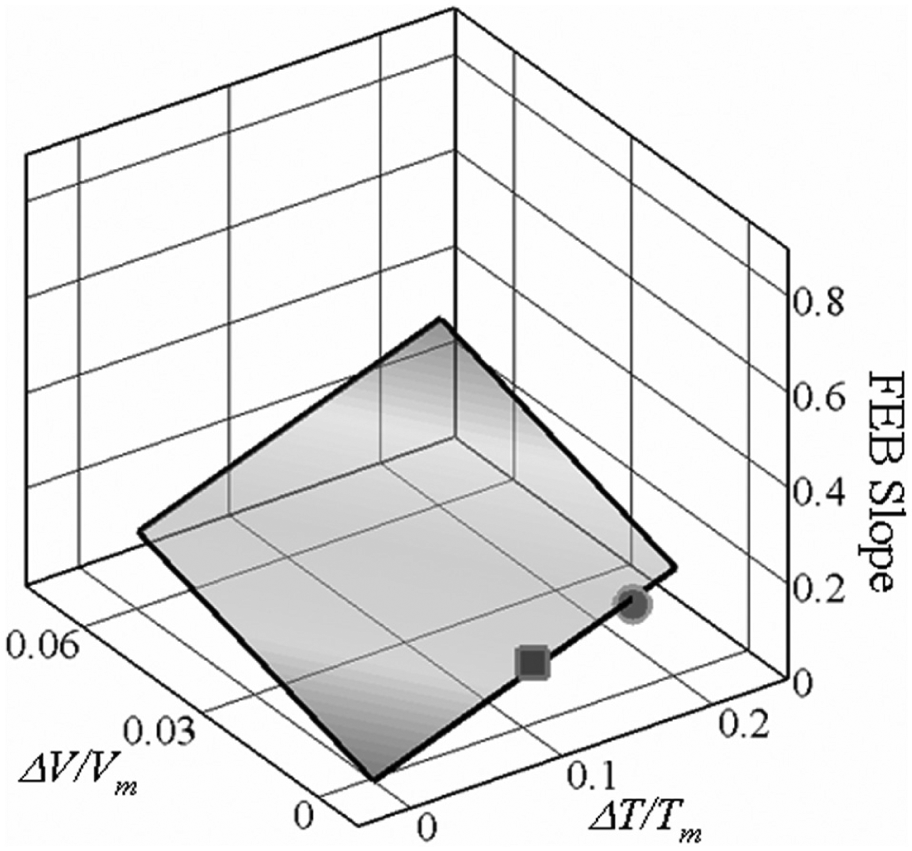
Figure 8 shows the planes of FEB slope for three sets of the shape factor s and reduction ratio r when temperature across the material’s thickness (ΔT/Tm) and roll speed difference between the upper and lower rolls (ΔV/Vm) vary. These planes were obtained by determining the constants ai and bi (i = 1, 2, 3) in equation (5) with the least square method. Empty triangle symbols indicate the FEB slopes computed by FE method and are positioned above the plane of FEB slope. Empty circle symbols denote the FEB slopes computed by FE method and are positioned below the plane of FEB slope. Since FEB slopes computed by FE method were in favorable tendency with the planes of FEB slope. For the other six sets of the shape factor s and reduction ratio r, FEB slopes computed by FE method matched up with the planes of FEB slope. Therefore, it is deduced that equation (4), which models a set of FEB slopes as a plane, is appropriate.
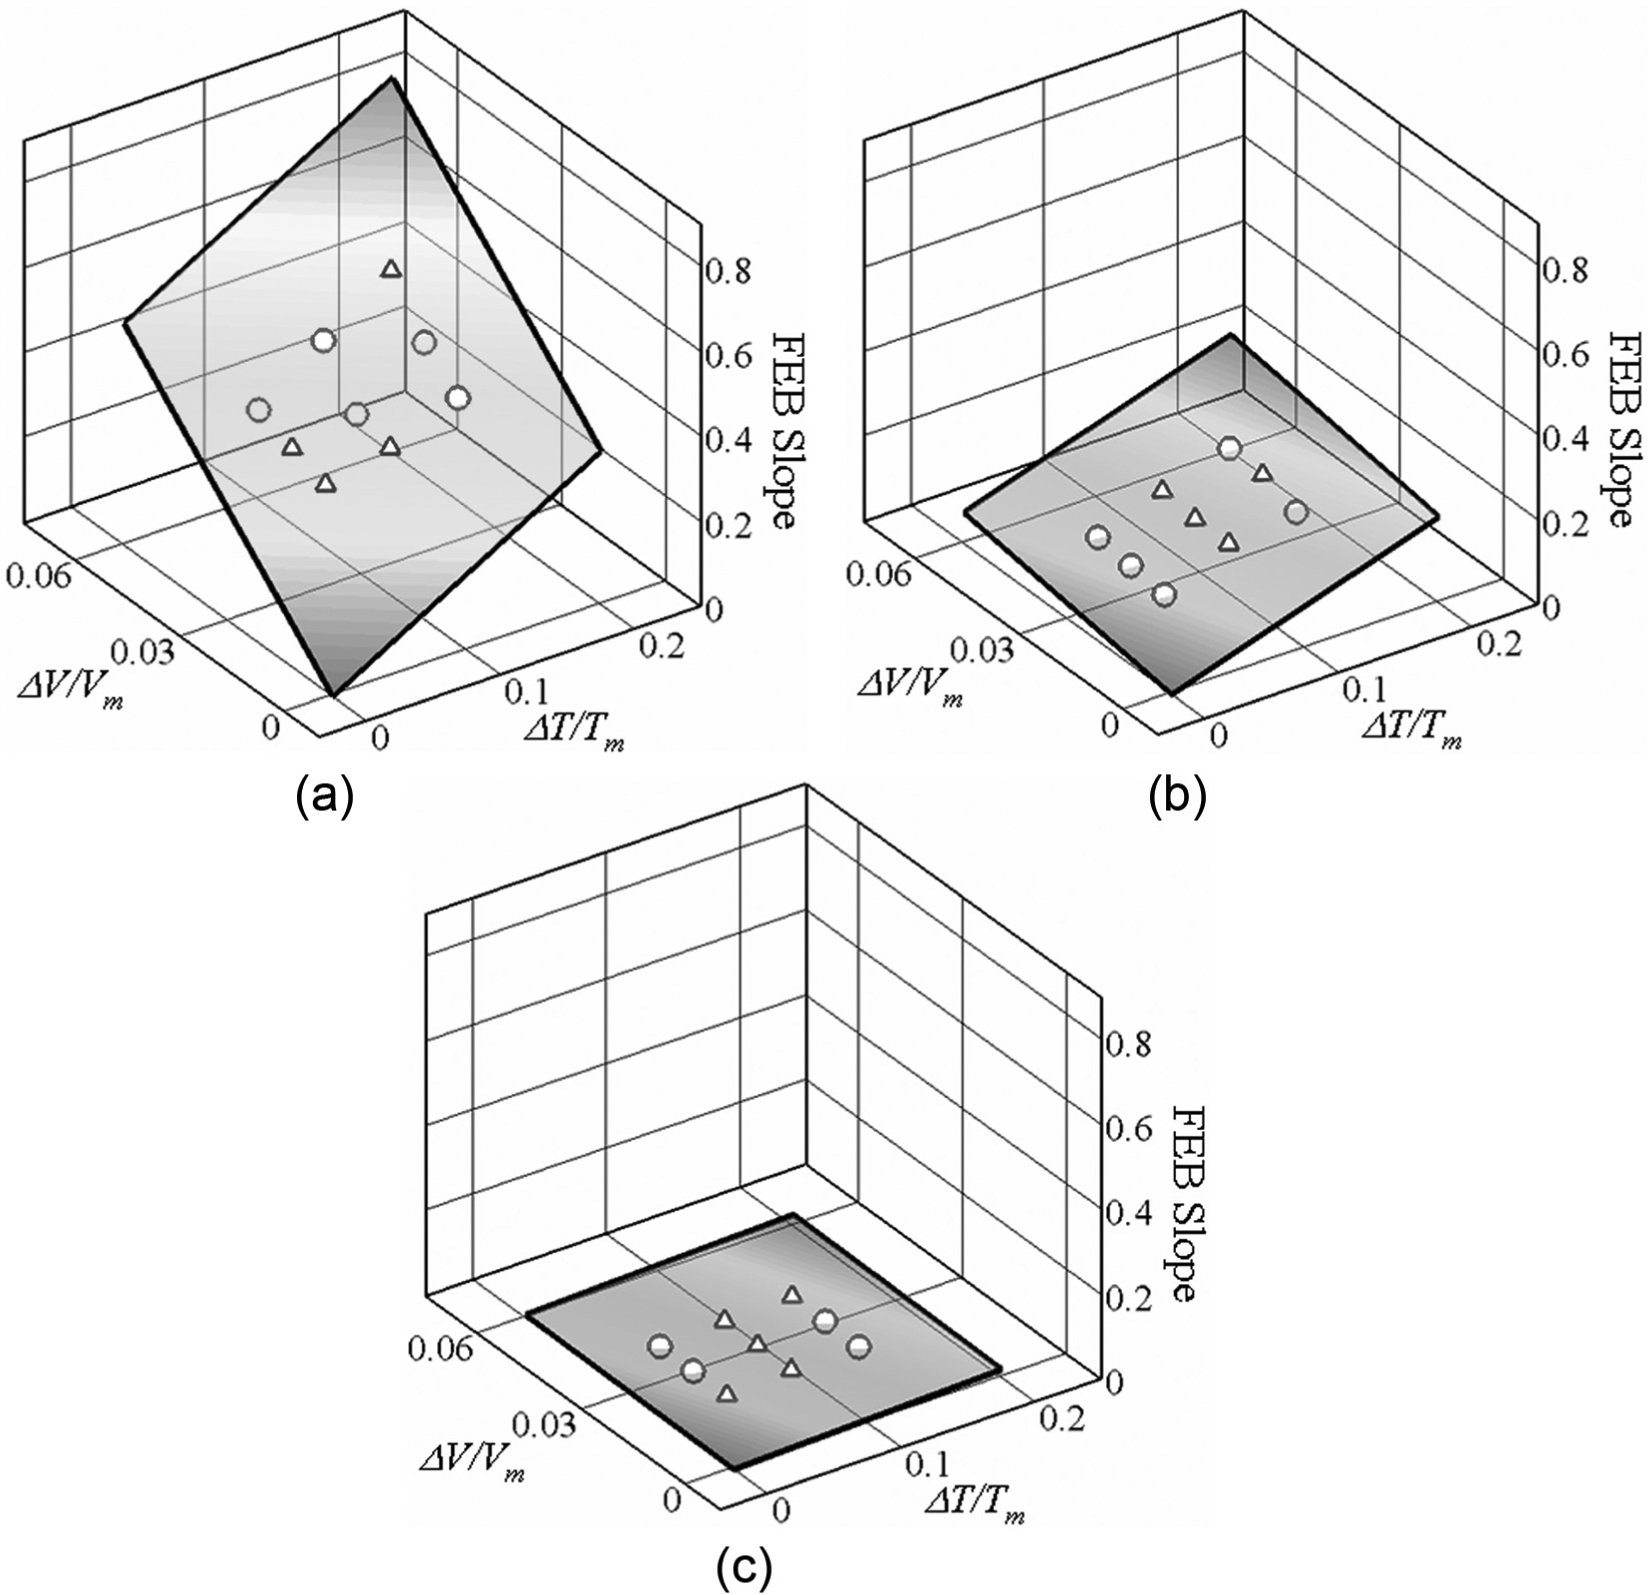
Values of FEB slopes (marked by empty triangle symbols and circle symbols) calculated by finite element method. Planes of FEB slope are plotted based on the values when (a) ΔT/Tm and ΔV/Vm vary for a given shape factor s = 1.0 and reduction ratio r = 0.3, (b) s = 1.5 and r = 0.3, and (c) s = 2.0 and r = 0.1.
Three data points for each variable such as s, r,
Figure 9 shows the variations of planes of FEB slope for three different shape factors (1.0, 1.5, 2.0) and reduction ratios (0.1, 0.2, 0.3). We can see the effect of the variations in shape factor and reduction ratio on the plane of FEB slope. As the shape factor reduces and the reduction ratio increases, the gradient of plane of FEB slope increases. The gradient of plane of FEB slope is the highest when the shape factor is 1.0 and reduction ratio is 0.3. The magnitudes of the gradients of planes of FEB slopes as well as the computed values of α and β for the given shape factors and reduction ratios are listed in Table 5. Coefficients α and β represent the gradients of the planes rotating on the axes of
Coefficients of planes for FEB slope, α, and β, for all combinations of the shape factor s and reduction ratio r.
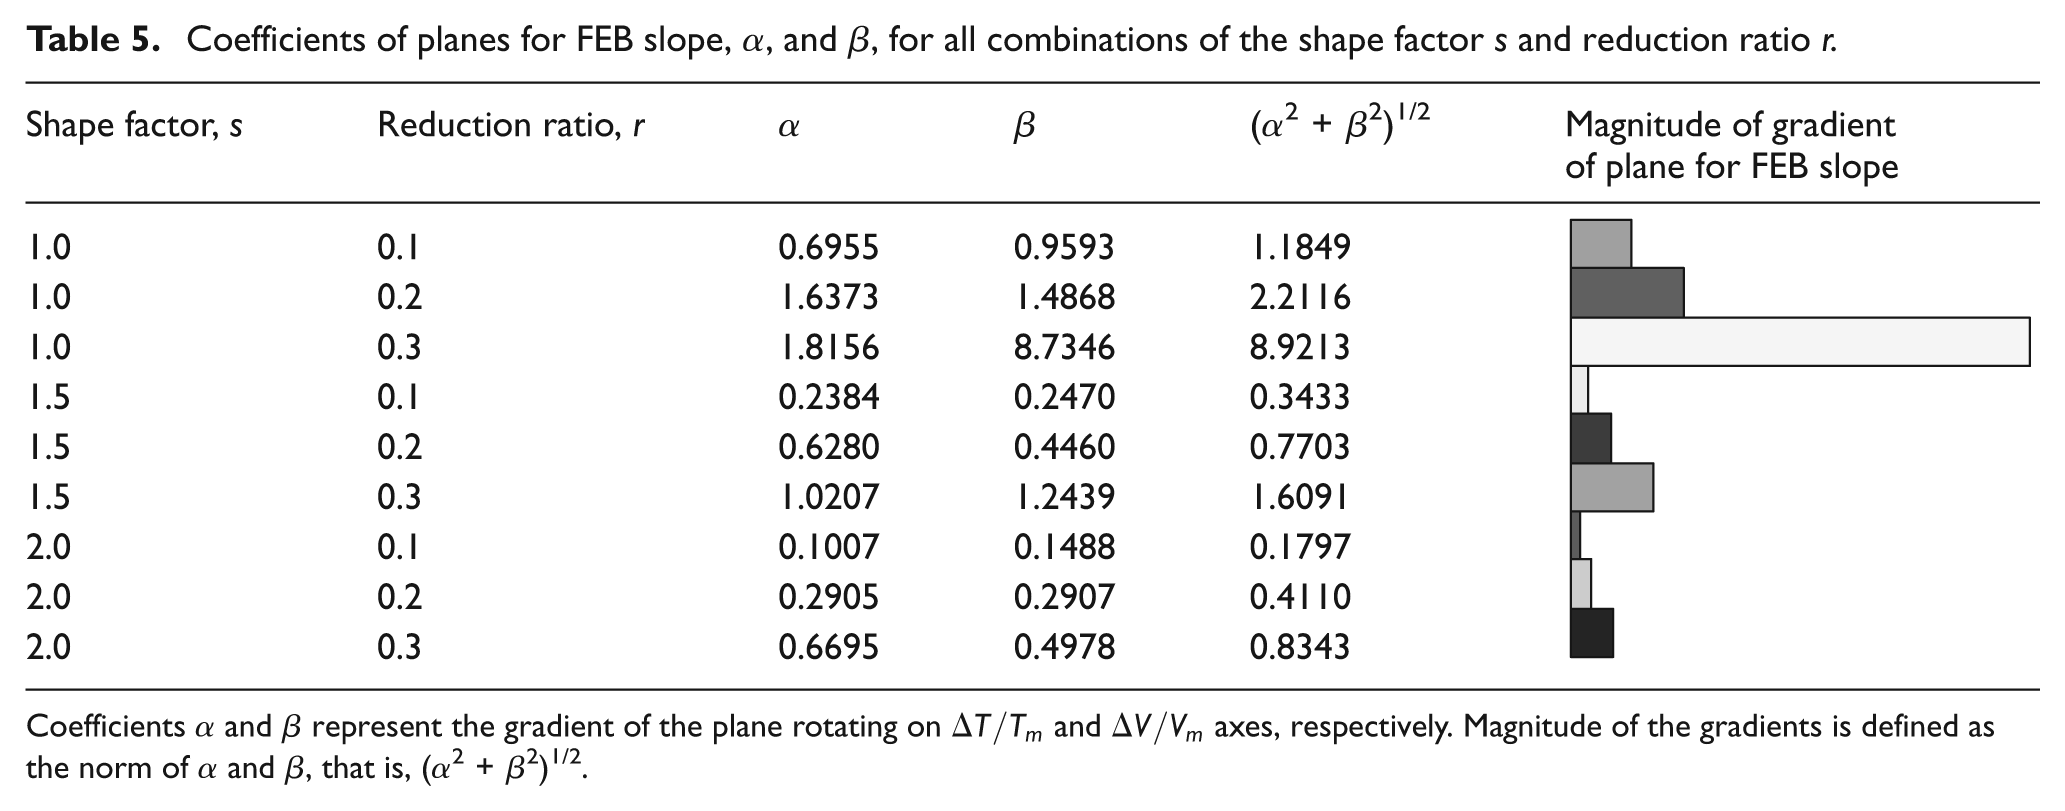
Coefficients α and β represent the gradient of the plane rotating on
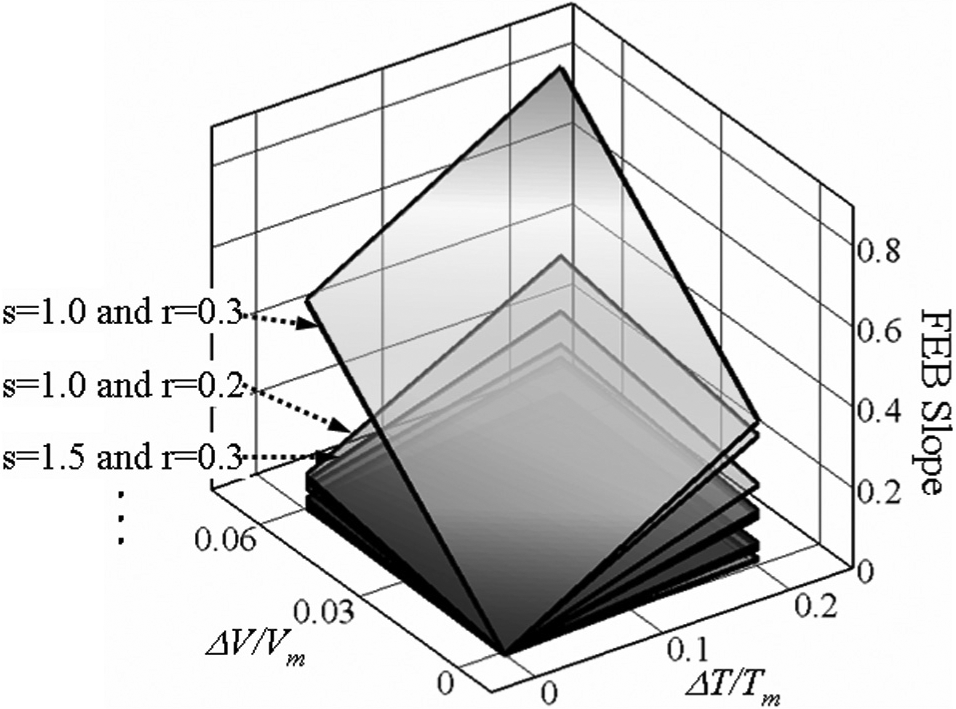
Planes of FEB slope for all combinations of shape factors (1.0, 1.5, and 2.0) and reduction ratios (0.1, 0.2, and 0.3) (i.e. total of nine cases).
Equation for FEB slope
Since the coefficients of the planes of FEB slope
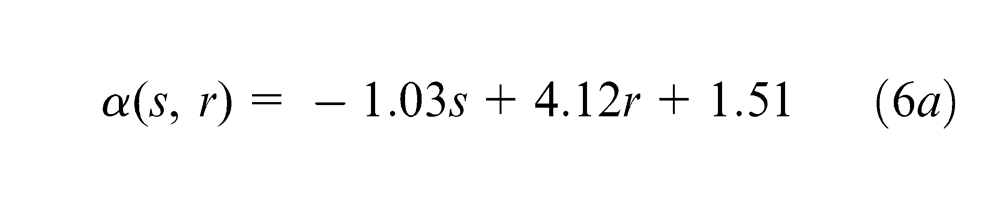
Substituting equation (6) into equation (4), we obtain the relationship among the dimensionless geometric parameters (shape factor and reduction ratio), dimensionless parameters of asymmetric rolling conditions (
Equation (7) represents the in-line model that computes instantly the FEB slope whenever the roll-bite profile and asymmetric rolling condition changes during rolling.
Figure 10 shows the range of validity of the linear relations of equation (7), that is, the proposed in-line model. The axis of abscissas stands for FEB computed by FE analysis and the axis of ordinates does that by the in-line model. If the symbols are positioned in the solid line, linearity of the equation (7) is good enough. Dashed line represented by “+30% line” denotes that FEB predicted by the proposed in-line model is higher than FEB calculated by FE analysis. On the contrary, dotted line represented by “−30% line” denotes that FEB predicted by the proposed in-line model is lower than FEB calculated by FE analysis. It indicates that deviations are within ±30% from the viewpoint of linearity of the in-line model.
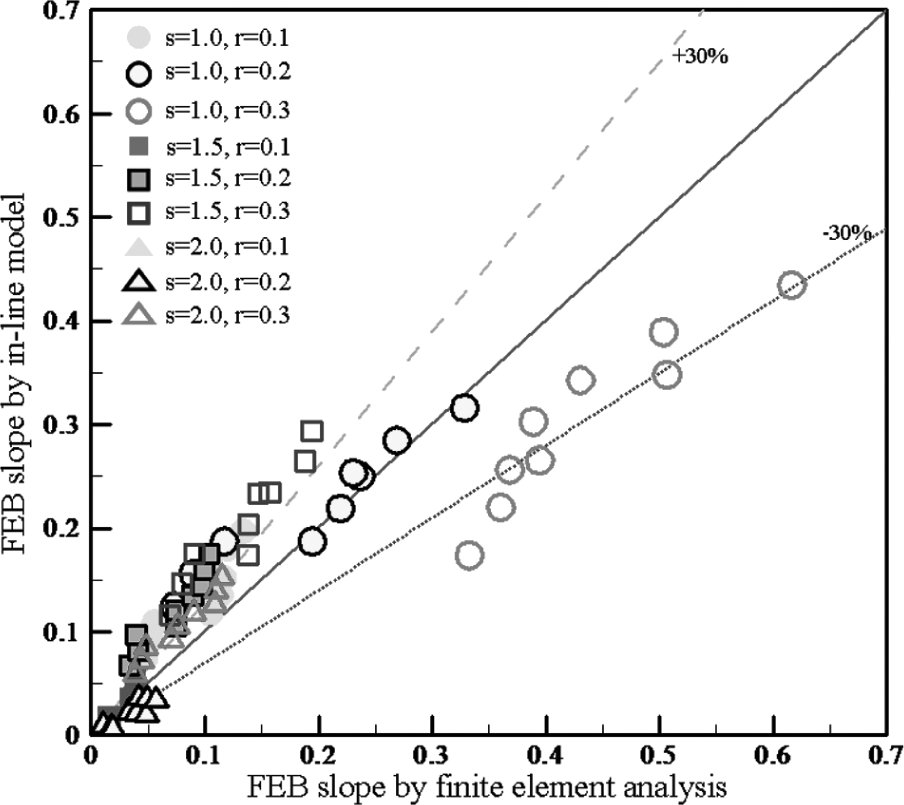
Comparison between the values of FEB slope predicted from the in-line model and those predicted from the finite element analysis.
Note that the deviation range of ±30% is not a major drawback since the values predicted by the in-line model are used as an initial reference value for controlling FEB. In an actual plate mill, FEB slope is detected and measured as the material comes out of the work rolls to some extent. Even though there are errors between the measurements and the predictions, ±30% of errors can be removed gradually since the gap between the actual FEB slope and the reference FEB slope is decreased by feedback control system embedded in the mill stand.
Applications of the in-line model
To verify the usefulness of the in-line model (equation (7)), we compared the FEB slope measured from a pilot rolling test with FEB slope calculated by equation (7), as shown in Figure 11. The shape factor and reduction ratio used in the pilot rolling test were 1.15 and 0.2, respectively. The plane of FEB slope was directly obtained by substituting the values of the shape factor (s = 1.15) and reduction ratio (r = 0.2) into equation (7). The solid circle symbol denotes the FEB slope measured from the pilot hot plate rolling test for the dimensionless parameter of temperature variations over material thickness (ΔT/Tm) of 0.17, which is shown in Figure 7. The solid square symbol indicates the FEB slope measured from pilot rolling test for ΔT/Tm of 0.11. The solid circle symbol is below the plane and the difference is 6.5%. However, the solid square symbol is above the plane and difference is 10.3%. These differences imply that the in-line model can be applied to predict the behavior of FEB in an actual plate rolling process.
Comparison of FEB slope measured from pilot rolling test with FEB slope calculated from equation (7).
The in-line model proposed in this study is valid when a material is rolled in the single-stand rolling mill and rolled by only once. Therefore, the in-line model cannot be applicable to the real production hot plate mill in which the material passes through from the one side to the other side and then comes back through the mill again. It can be said that the in-line model provides a basic tool to control the FEB of material in plate rolling mill in real time.
Concluding remarks
This article proposed an in-line model to predict the FEB of a material in plate rolling process. A series of FE analyses were performed to examine the relationship between FEB behavior for diverse roll-bite profiles and asymmetric rolling conditions. We selected the shape factor s and reduction ratio r as dimensionless parameters to depict the roll-bite profile. Circumferential speed difference between the upper and lower rolls and temperature difference along the material thickness direction were selected as representative asymmetric rolling conditions. We established the in-line model by formulating a set of FEB slopes into an equation of a plane to compute the FEB slope explicitly in terms of asymmetric rolling conditions for diverse roll-bite profiles. We also performed a pilot hot plate rolling test to verify the accuracy of the in-line model. The conclusions are summarized as follows.
The approach that formulates a set of FEB slopes into an equation of a plane of FEB slope was successful since FEB slopes computed from FE analyses were approximately on the planes of the FEB slope for diverse roll-bite profiles. When FEB slopes measured from pilot hot rolling test were compared with those predicted by the in-line model, the differences were in the range of 6.5%–10.3%. This indicates that the proposed in-line model can produce appropriate reference values for the feedback controller (algorithm) implanted in the PLC that minimizes FEB in the plate rolling process. Therefore, the proposed in-line model can be used to control FEB in real time in plate rolling process.
Footnotes
Declaration of conflicting interests
The authors declare that there is no conflict of interest.
Funding
This work was supported by the Dong-A University research fund.