
Abstract
A fast optimization approach is described for design optimization of the multipass wire drawing process with genetic algorithm. The analytical models for calculation of the drawing force, power consumption, and the temperature rise are addressed by considering the real steel wire drawing condition, and a new die wear factor indicating die wear and life is established based on the slab method. The genetic algorithm has been implemented to build up a single objective optimizer for minimizing the total power consumption and a multiobjective optimizer for minimizing both the total power consumption and temperature rise under several deliberate design constraints. The numerical examples show that the multiobjective optimizer presents better performance in finding the optimal solution, compared with the single objective optimizer. Different types of optimization methods especially designed for real demands are demonstrated under multiobjective optimization set. Compared with a reference design, it indicates that significant improvements in the total power consumption and the control of maximum temperature, delta factor, and die life have been achieved by the optimization. It has been proved that the optimizer for the multipass wire drawing processes is highly effective and efficient.
Introduction
In the wire drawing process, initial rod after preparation is drawn in several passes through conical dies where its diameter is reduced successively. Similar to most product manufacturing processes, steel wire drawing process involves several process parameters and product properties. Selection of the drawing process parameters such as pass schedule (pass number/partial reduction), speed, die angle, and back-pull dramatically influences the qualities of the final products, heat generation, die wear, power consumption, and risk of fracture.
For multipass wire drawing, plenty of work has been done in the study of the whole processes using both analytical method and finite element method. Joun and Hwang 1 proposed a rigid–viscoplastic finite element model to calculate the energy consumption, which was applied to the pass schedule design problems in multipass axisymmetric extrusion and drawing. Celentanoa et al. 2 were devoted to the simulation of multipass wire drawing via finite element analysis that accounts for both large viscoplastic strains and friction effects and the experimental validation of drawing forces under different drawing velocities. Jo et al. 3 and Lee et al. 4 calculated the temperature in a multipass wire drawing operation by analytical model for high carbon steels. Singh et al. 5 presented a comprehensive finite element model for multipass wire drawing operation considering both deformation and thermal effects during drawing and cooling of wires on the drawing capstan.
Optimal selection of the process parameters combined with optimal product properties guarantees the success of the production. With genetic algorithm (GA) based on finite element analysis, Roy et al. 6 developed a design tool to minimize the difference between maximum and minimum effective plastic strains in the final products and the total deformation energy. Celano et al. 7 proposed an optimization approach consisting of simulated annealing (SA) algorithm and permitted to the determination of both the optimal number of passes and the optimal number of reduction rate sequence. Singh et al. 8 developed an optimization method of multipass wire drawing by establishing a response surface from finite element modeling. The optimization was carried out for energy, strain uniformity, temperature, and wire breakages during wire drawing. However, the die wear was normally neglected. In addition, the optimizers combined with finite element model must take many days to obtain an optimum result, which is time-consuming and limits its application in industry, and the optimizers combined with a response surface based on finite element modeling (FEM) are lack of accuracy due to the difficulty in the establishment of an accurate response surface.
Therefore, a fast approach for the optimization with GA combined with analytical model is proposed. The multipass drawing processes are analyzed using analytical methods, and the formulas used to calculate the drawing force, power consumption, temperature rise, and die wear are presented in our study. The aims of the optimization are to minimize the power consumption and enhance the die life, besides keeping high quality of products.
Theoretical analysis of the wire drawing processes
Calculation of drawing force
The classic drawing force model based on slab method is well know and has been proven to be accurate for the real application. Herein, based on the slab method, all the factors according to the real condition in steel wire drawing process, involving the homogenous deformation, the redundant deformation, the back-pull, and the bearing length, are considered. Figure 1 shows the plastic deforming zone and stress analysis for wire drawing. According to the slab method, a complex equation that permits the effects of friction, die angle, and back-pull to be explicitly considered can be obtained 9
where
Plastic deformation and stress analysis for wire drawing
In the multipass wire drawing processes, the back-pull is widely used to reduce the die load and thus enhance the die life. Eytelwein’s equation 10 is used to calculate the value of the back tension
where m is loops on capstans,
When the wire enters the reduction zone of a drawing die, material layers close to the surface would undergo deformation because of the reduction in area and the change in flow direction. Consider the redundant deformation due to the internal distortion, an additional drawing stress
In order to keep the properties and shape of the wires, the bearing zone is used in wire drawing processes. The drawing stress would increase so as to overcome the friction stress from the bearing zone. Somehow, traditionally, the effect of bearing zone is neglected. Herein, the contribution of the friction on the bearing zone to the drawing stress is calculated using an empirical formula
where
Taking equations (2)–(5) into consideration, the drawing stress in the die can be expressed by equation (6)
Then, the drawing force is easy to obtain by
Calculation of die wear factor
The die wear and die life are essentially important and must be considered for the wire drawing design and optimization. In this study, a factor evaluating the die wear and die life is developed in the function of the die pressure and drawing speed, as they are the main factors influencing the die wear and life. First, based on the slab method, a die pressure model is established. The die angle and friction coefficient are very small, and the approximate yield criterion is considered
From equations (1) and (8), the die pressure could be obtained
Equation (9) shows that the die pressure takes the maximum value at the point where the wire initially contacts the die. Thus, maximum wear usually occurs at the entrance of the die. Upon integration, the average die pressure during drawing can be calculated
Therefore, the die wear factor can be expressed in function of die pressure and drawing speed as
where
Calculation of total power consumption
The total work consumed at a drawing pass involves three components: (a) the volumetric deformation power (useful work required to reduce the cross section), (b) the redundant deformation power (redundant work required to change the flow direction), and (c) the friction power at the die–wire interface (work required to overcome frictional resistance).
The calculated drawing force represents the total force required to overcome the volumetric deformation work, redundant work, and friction work. The power consumption could be calculated by multiplied drawing force and drawing speed. The back-pull power should be subtracted to obtain the effective power. The total power is a summation of effective power required at each pass, and it could be calculated by the following equations
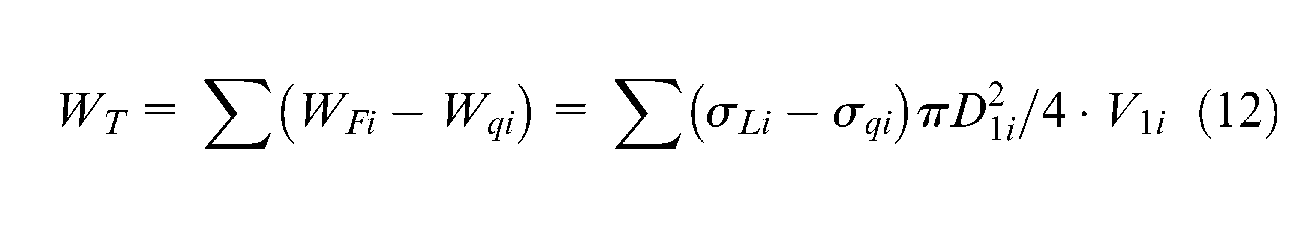
where
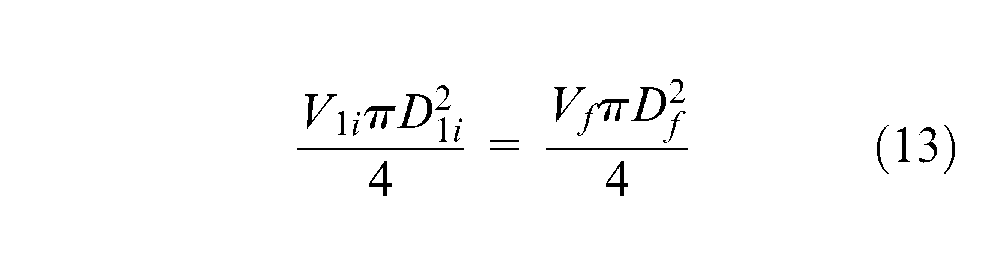
The mass flow rate of wire through the die keeps constant for each pass, and this means that the volumetric rate of wire entering a die must be the same as that exiting. Once the take-up speed
Calculation of temperature rise
It is essential to calculate the wire temperature rise, since temperature control often proves to be the limiting factor with respect to productivity in the multipass wire drawing processes. The heat generation during drawing would also influence wire properties, lubrication effectiveness, and accelerate die wear. The temperature control could prevent fracture of wire and the tendency for embrittlement from strain aging. The heat effects are a result of volumetric deformation, redundant deformation, and friction work. The volumetric deformation energy, the redundant deformation energy, and friction energy can be obtained from the following equations, respectively 4
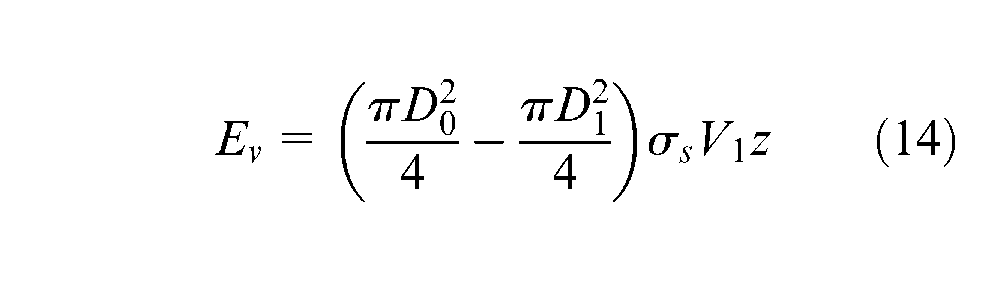
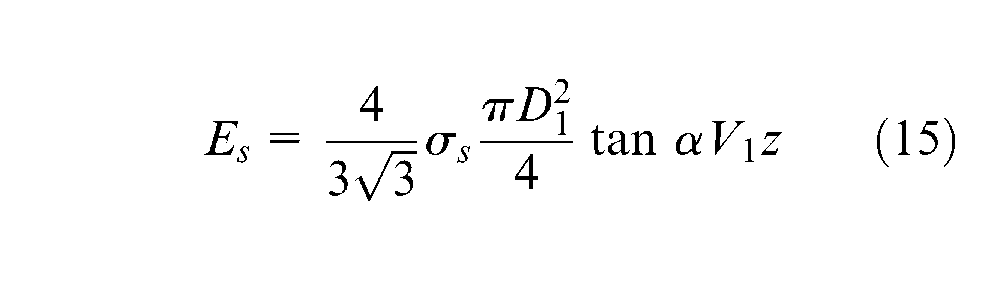
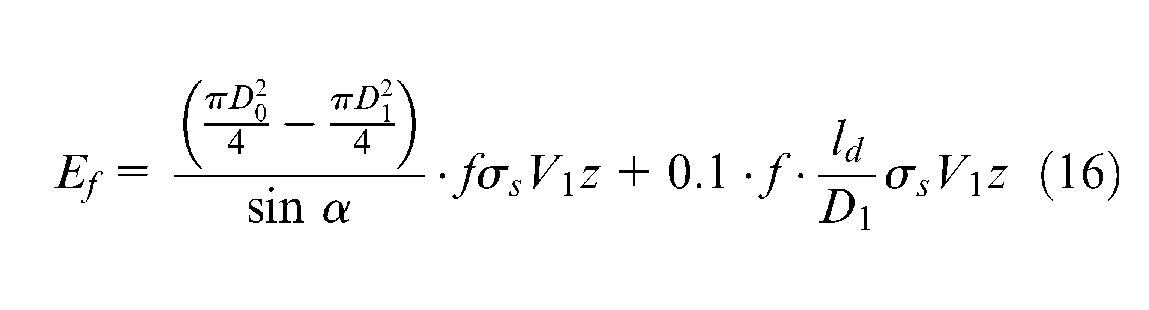
where z is the deformation time of the wire.
The temperature rise could be calculated on the basis of thermal equilibrium equation
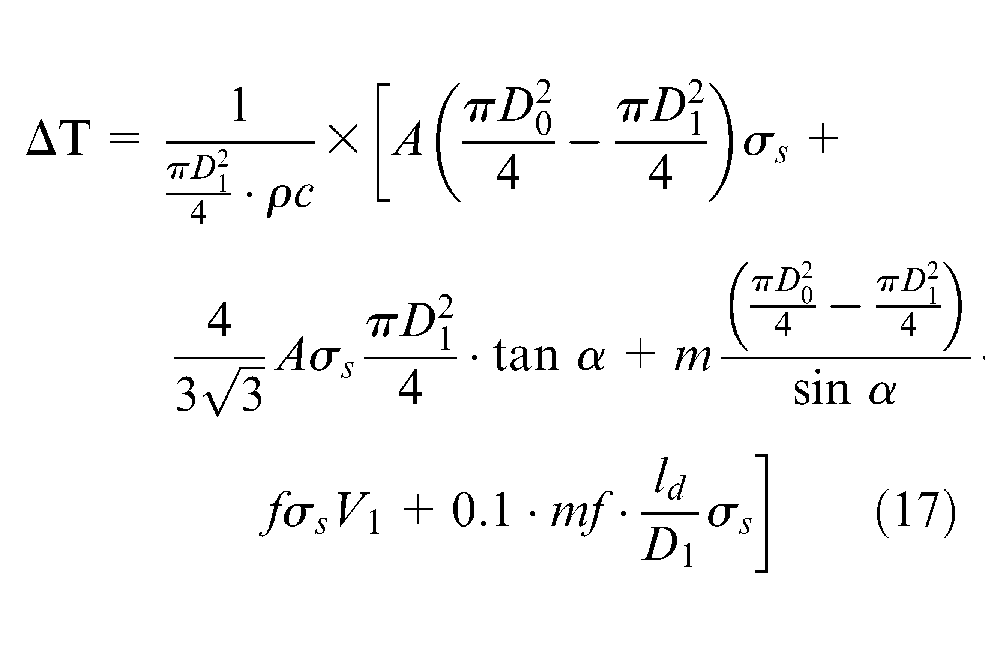
where A is the mechanical equivalent of heat. In this study, about 55% of mechanical energy in the deformation energy is transferred into heat during the drawing process.
12
ΔT is the temperature rise,
Calculation of delta factor (Δ-factor)
In wire drawing, the geometry of the working part of a die is a critical factor. This geometry can be defined by the delta factor, which is the ratio of the circular arc spanning the midpoints of the die face to the length of contact between wire and die. 13 For conical dies, the Δ-factor is
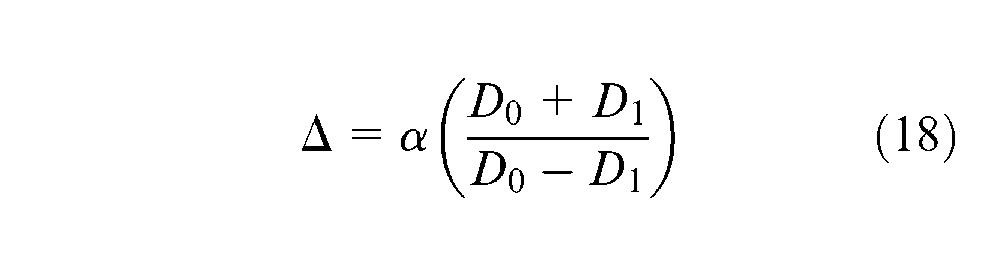
Low Δ values mean small die angle and higher reduction in area, which results in high levels of friction work due to longer contact length. While higher values of Δ represent large die angle and lower reduction in area, which indicate more redundant deformation because of excessive direction change during wire drawing.
Optimization approach
Design variables
The first step in the design optimization study is the selection of variables. The main parameters in the wire drawing process involve the inlet and outlet wire diameters, die angle, and bearing length of each pass. It is dependent on the die diameter between two neighbor passes, where the outlet wire diameter must be smaller than that of its previous pass. Therefore, because of this dependence, it is a wise option to select the partial reduction as the design variable for the optimization instead of wire diameter, as the partial reduction of individual pass is independent. Similarly, in order to avoid the pass dependence, the bearing length is characterized using the ratio of bearing length-to-outlet wire diameter, named as the bearing length ratio. Finally, the design parameters involving the total number of passes, partial reduction, die angle, bearing length ratio, and loops in capstan are selected as the input design variables of the optimization, which are listed in Table 1.
Boundary conditions
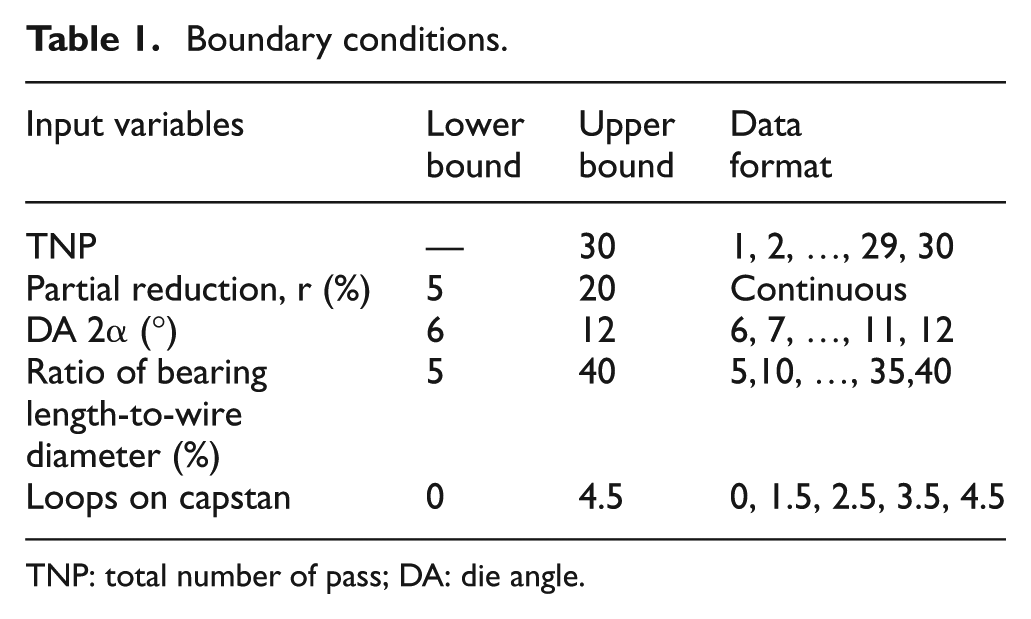
TNP: total number of pass; DA: die angle.
It is very practical to limit the design variables varying in the defined bounds, such as a case study listed in Table 1, where the maximum number of allowable passes is 30, the partial reduction is limited between 5% and 20%, the die angle varies between 6° and 12° with a step of 1, the bearing length ratio ranges from 5% to 40% with a step of 5%, and the loops on capstans take five values. Based on the practical die manufacturing and wire drawing operation, a step data format is used to control the change in the die angle, bearing length ratio, and loops on capstan.
Objective functions and constraints
The objectives are set considering the following aspects, which are highly interlinked:
The ratio of drawing stress-to-yield stress (DS/YS). Any plastic deformation taking place outside of the die resulting from the drawing force is unallowable. Thus, the ratio of DS/YS must be less than 1, in order to avoid the necking during wire drawing.
Maximum die wear factor. The die pressure and drawing speed significantly influence die wear. The maximum die wear factor among all the passes is a indicator evaluating the shortest die life of a die set.
Total power consumption in the drawing process. The total power is a sum of power consumption per pass.
Maximum temperature rise. As discussed earlier, thermal effect is particularly important for wire drawing processes. If the wire surface temperature excesses a desired value, it would adversely deteriorate the wire properties and lubricant and decrease the die life.
Delta factor for each pass. Higher values of delta factor are indicative of more inhomogeneous deformation and redundant deformation, leading to an increase in power consumption.
Optimization objectives in wire drawing include the desired product properties, enhanced die life, and reduced power consumption. An optimal design problem can be generally expressed as
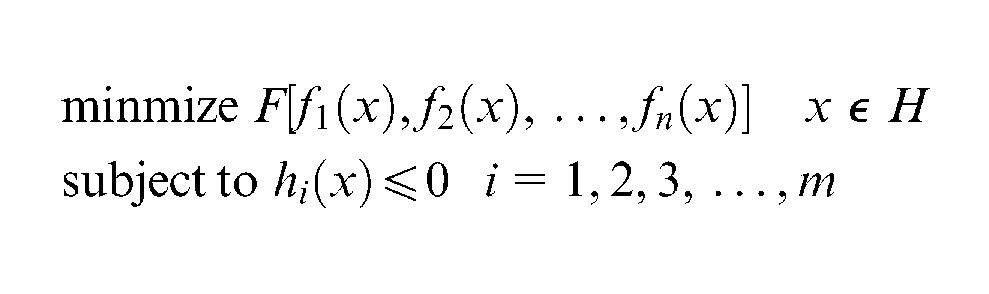
where
Optimization algorithm
The GA is utilized as the optimization algorithm in this article. The GA works on a population of potential solutions using the survival of the fittest strategy to improve successive generations, which involves several distinct operations such as selection, crossover, and mutation. The population type of design variables is double vector. The selection function is tournament, the crossover function is intermediate, and the mutation function is adaptive feasible.
Optimization design
Figure 2 presents the procedure of the optimization design for a multipass wire drawing process. With giving initial and final wire diameter together with wire material properties and setting the limits for the design variables as well as the constraints for the objective variables, the optimizer is going to find an optimum solution with the best pass schedule. Both the single objective and multiobjective optimizers have been implemented as a MATLAB toolbox.
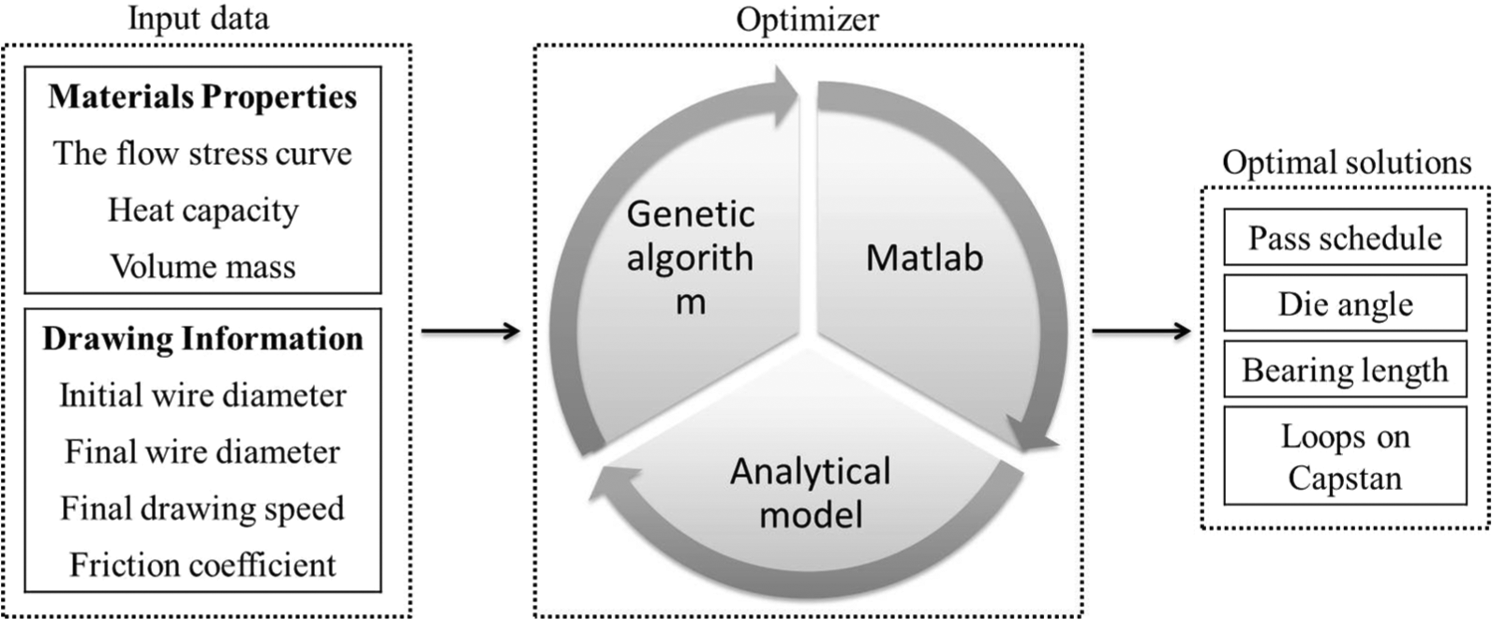
Optimization design procedure of the multipass wire drawing processes.
Results and discussion
Optimization reference
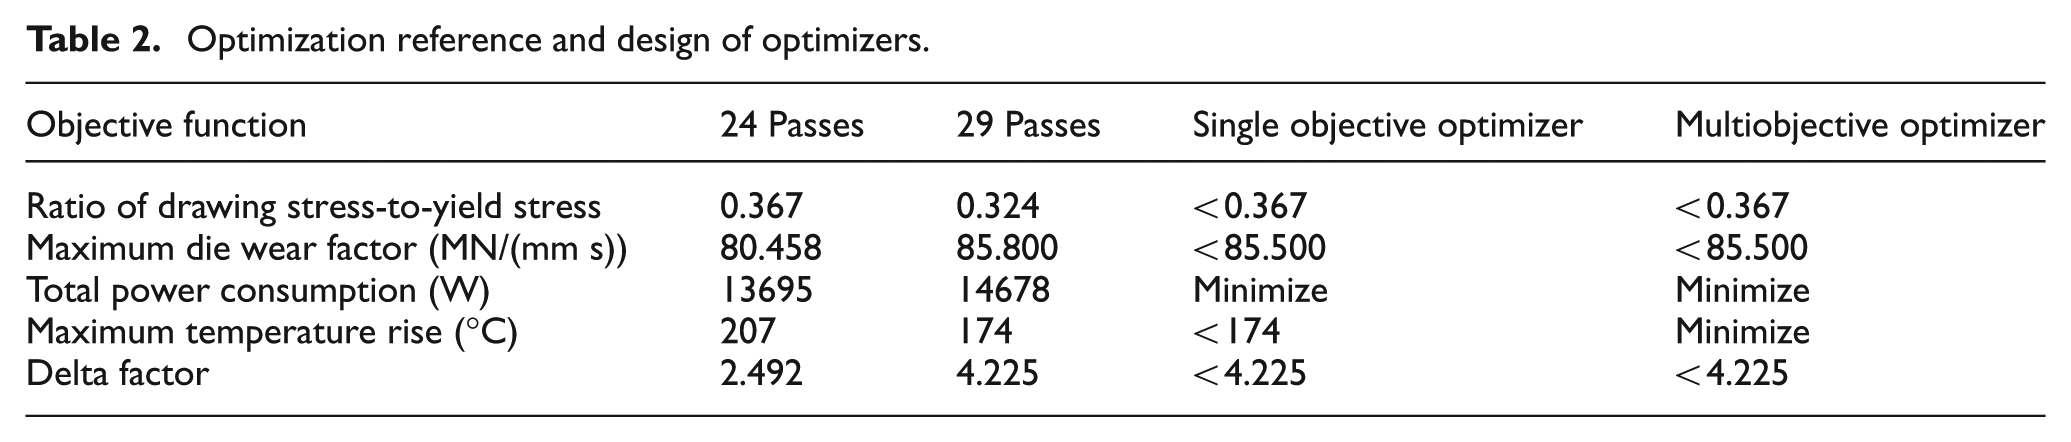
Lee et al.’s 4 study on optimization of temperature to increase the drawing speed from 1100 to 2000 m/min for wet wire drawing of low carbon steel is selected as a reference for evaluating the performance of the optimizers. In Lee et al.’s 4 study, in order to reduce the temperature rise, it adapted a straight–taper reduction rate alignment and increased the number of passes from 24 to 29, but it did not take the risk of fracture (delta factor), die wear (die wear factor), and power consumption into consideration. A wire drawing design or optimization must be able to minimize one or two objectives but keep others in the allowable levels, by which the optimized pass schedule can fit for use. Taking 24 and 29 passes with a drawing speed of 2000 m/min of Lee et al.’s 4 study as the references, their results in maximum ratio of DS/YS, maximum die wear factor, maximum temperature rise, and total power consumptions are listed in Table 2. Based on the results of 24 and 29 passes, the constraints for the single objective optimizer and multiobjective optimizer are also listed in Table 2, taking the larger values of ratio of DS/YS, die wear factor, and delta factor, and the smaller temperature rise between 24 and 29 passes as the upper limits for the optimization.
Optimization reference and design of optimizers.
Four cases are designed to evaluate the performance of the optimizers, as shown in Table 3. In Case 1, it minimizes the power consumption with the single objective optimizer, while setting the limits for the design variables and objective functions, as shown in Tables 2 and 3, under the formats listed in Table 1. Case 2 minimizes both the power consumption and temperature rise, while keeping the constraints the same as that in Case 1. Case 3 is based on Case 2, it fixes the die angle and bearing length ratio and loops on capstan, while keeping the number of passes free. Based on Case 3, Case 4 fixes the total number of passes as 29.
Optimization designs for case study.
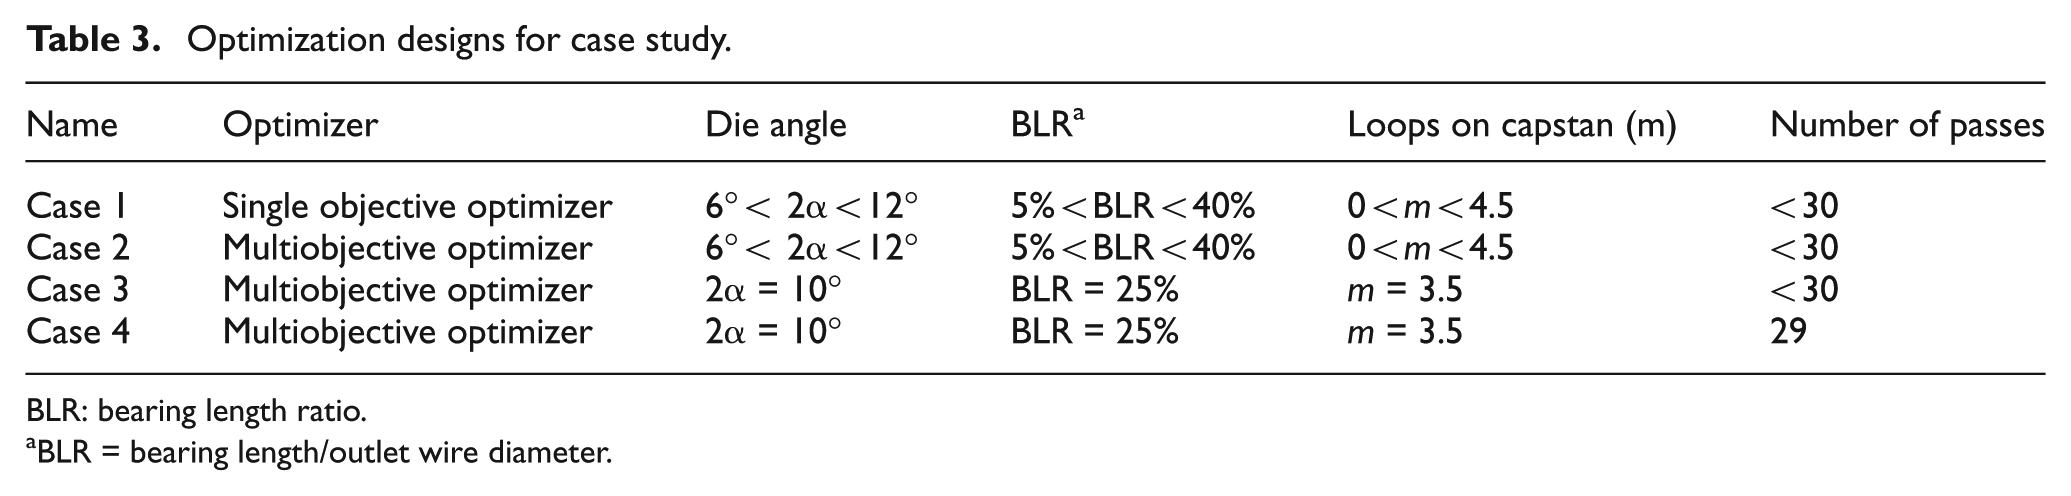
BLR: bearing length ratio.
BLR = bearing length/outlet wire diameter.
Comparison of single objective optimizer and multiobjective optimizer
The optimization results including power consumption, maximum temperature rise, die wear factor, delta factor, and ratio of DS/YS are listed in Table 4 as well as the reference of 29 passes. Compared with the reference of 29 passes, optimizations based on these four cases reduce the power consumption by about 200 W, while the other factors including temperature rise, die wear factor, and delta factor are smaller than that in reference, and a little increase in DS/YS will not lead to the necking problem as they are less than 0.37. Therefore, it can be concluded that both the single objective optimizer and multiobjective optimizer have very good performance in finding a better pass schedule compared with the reference.
Optimization results.
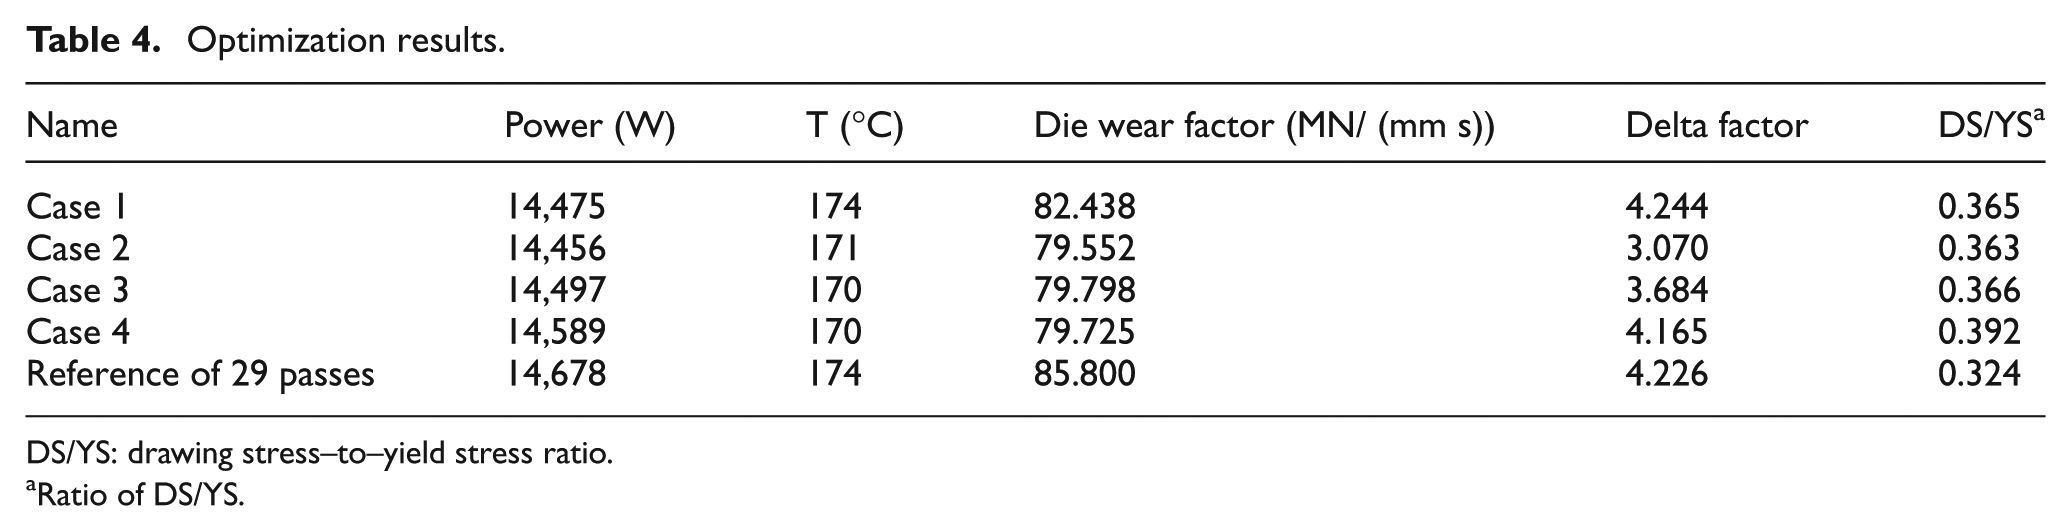
DS/YS: drawing stress–to–yield stress ratio.
Ratio of DS/YS.
Figures 3 and 4 show the temperature rises and reduction rate alignments optimized by the single objective optimizer (Case 1) and multiobjective optimizer (Case 2), respectively. It indicates that the optimized pass schedules between Cases 1 and 2 are very similar as a shape of increasing–decreasing with fluctuating in the middle passes. Compared with the reference pass schedule, the reduction rates of the final 10 passes increase, while the inlet passes have smaller reduction rate. Temperature results show that the optimized pass schedule presents the same temperature rise in the final 10 passes, which can meet the requirements of high-speed wire drawing.
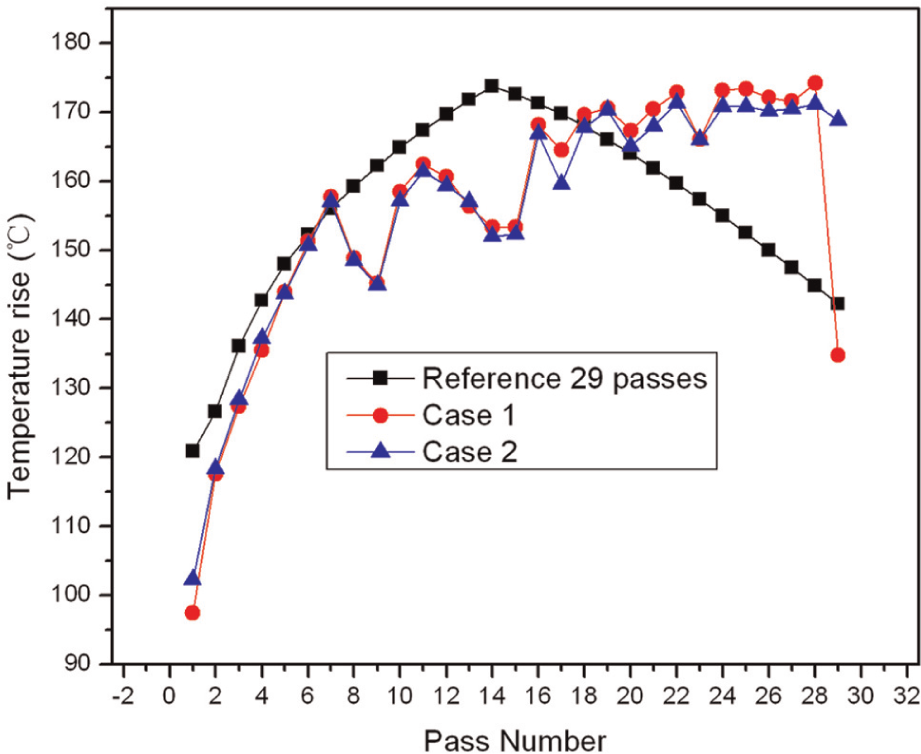
Temperature rise at the reference and the optimized pass schedules for Cases 1 and 2.
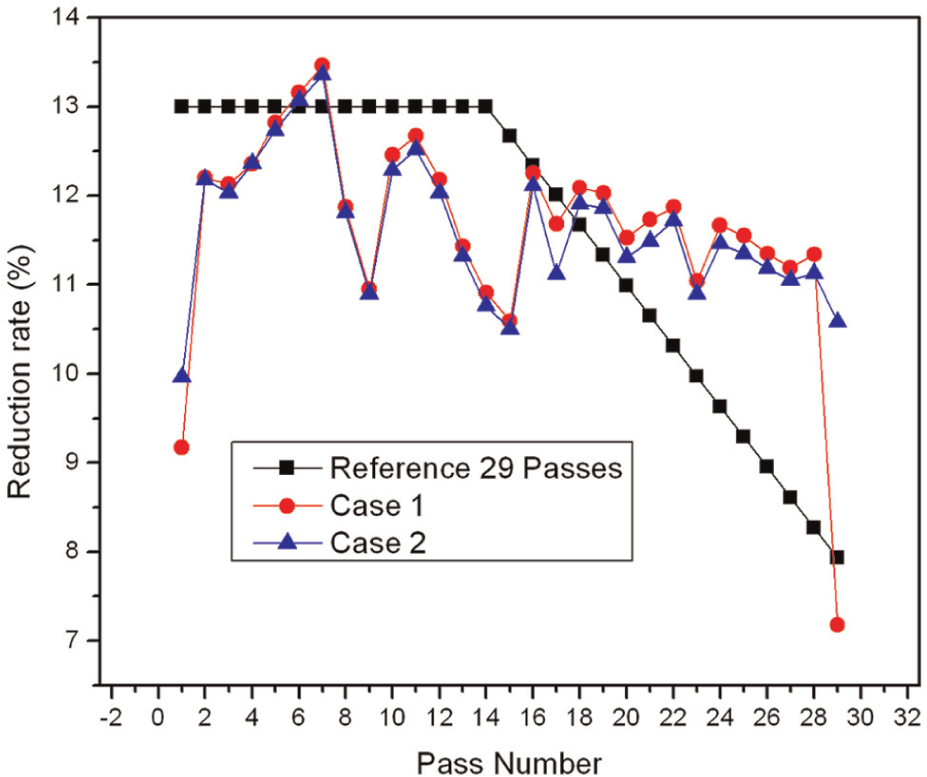
Pass schedules at the reference and the optimization in Cases 1 and 2.
Comparing single objective optimizer (Case 1) and multiobjective optimizer (Case 2), it can be found that the multiobjective optimizer presents a better performance, where all the values in the power consumption, temperature rise, delta factor, and DS/YS are smaller than that in the single optimizer. The multiobjective optimizer is able to find a global optimum result since it gets a set of solutions that are optimal in an overall sense. As can be observed from the comparison, results obtained based on the single objective optimizations are contained in those obtained according to the multiobjective optimization. The multiobjective optimization inherits all the favorable properties of the single objective optimizations and thus shows its priority on application.
Multiobjective optimization with and without fixed die angle and bearing length
In the real production, in order to facilitate the die manufacturing and operation, the die angle, bearing length ratio, and loops on capstan are fixed as the same for all the passes. Here, Case 3 is an example to fix these three parameters, while optimizing the partial reduction rates and number of passes to minimize both the temperature rise and the power consumption, with multiobjective optimizer. From Table 4, the results in Case 3 are close to that in Case 2, except that Case 3 has a slight higher value in delta factor. As smaller delta factor contributes to lower risk of fracture; therefore, the pass schedule obtained in Case 2 may be better than that in Case 3. The reason leading to the lower value of delta factor is that die angle of Case 3 is fixed at 10°, while the die angle of Case 2 is varying from 6° to 11°. Optimization will find a smaller die angle in order to reduce the delta factor, which is a constraint in the optimization.
Figures 5 and 6 plot the optimized temperature rise results and optimized pass schedules in Cases 2 and 3, respectively, as well as the reference results. In Figure 5, compared with the reference, it is clear that Cases 2 and 3 present a more uniform temperature rise along the passes. As it can be found from Figure 6, in Case 3, a near straight–taper profile in pass schedule is obtained, which is quite similar to the reference pass schedule. In Case 3, the optimized pass schedule has 28 passes, which is different with the reference, and its taper slope is smaller than that in the reference.
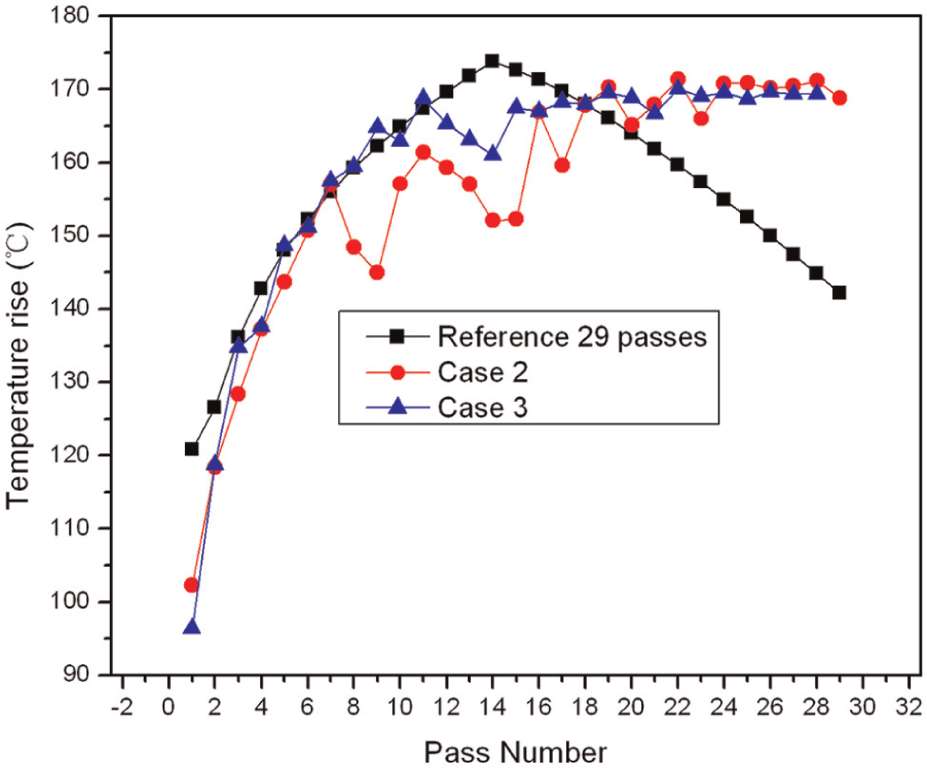
Temperature rise at the reference and the optimized pass schedules for Cases 2 and 3.
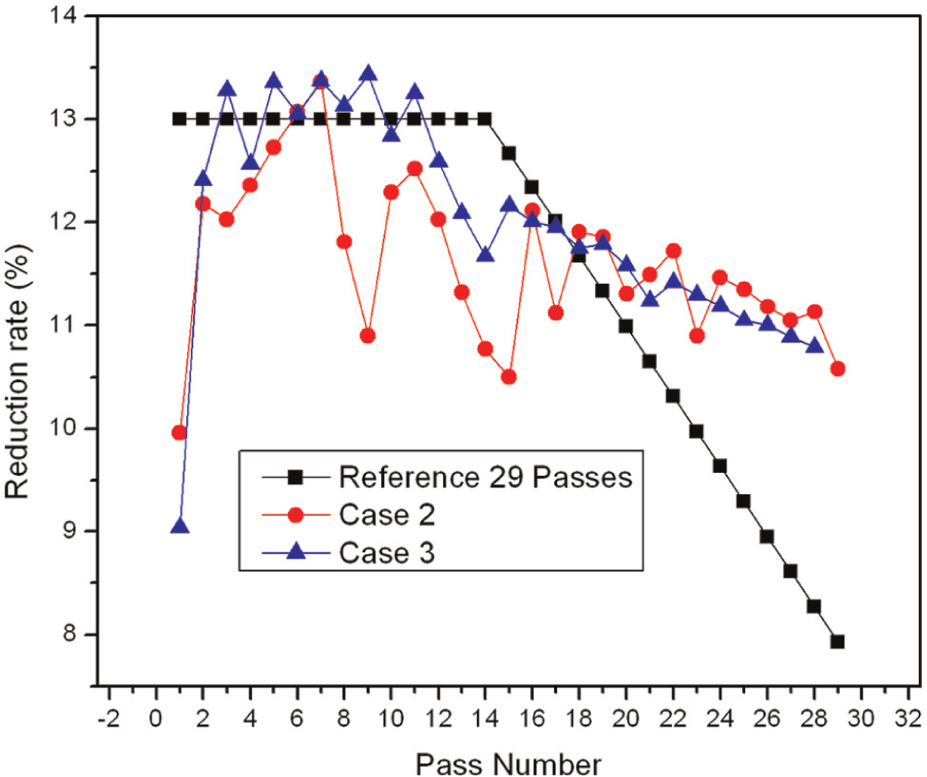
Pass schedules at the reference and the optimization in Cases 2 and 3.
Multiobjective optimization with and without fixed number of passes
Optimization under fixed number of passes is also conducted with multiobjective optimizer in Case 4, as shown in Table 3. The optimized temperature rise and pass schedules with 29 passes are plotted in Figures 7 and 8, respectively. Similar to Case 3, the temperature rises of the final 10 passes approach to 170 °C. An increasing–decreasing pass schedule is obtained in Case 4, as shown in Figure 8. From Table 4, it can be found that Case 4 presents higher value in power consumption and delta factor, compared with Cases 2 and 3. It means that the restriction in number of passes will limit the searching scope of optimization, which will lead to the difficulty in finding a global optimum solution.
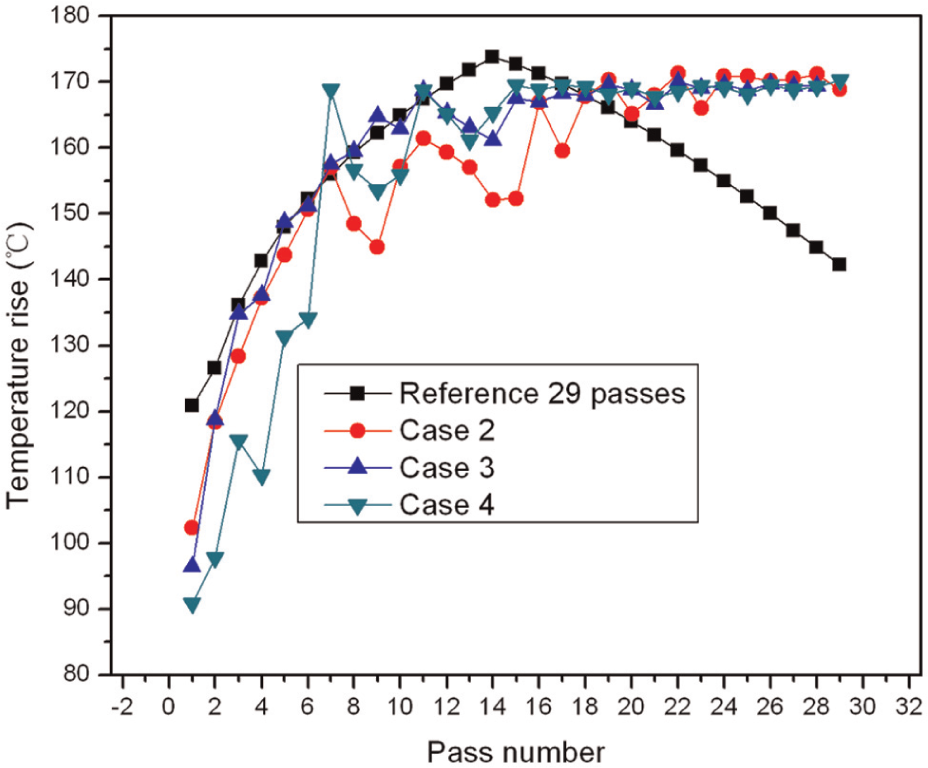
Temperature rise at the reference and the optimized pass schedules for Cases 2–4.
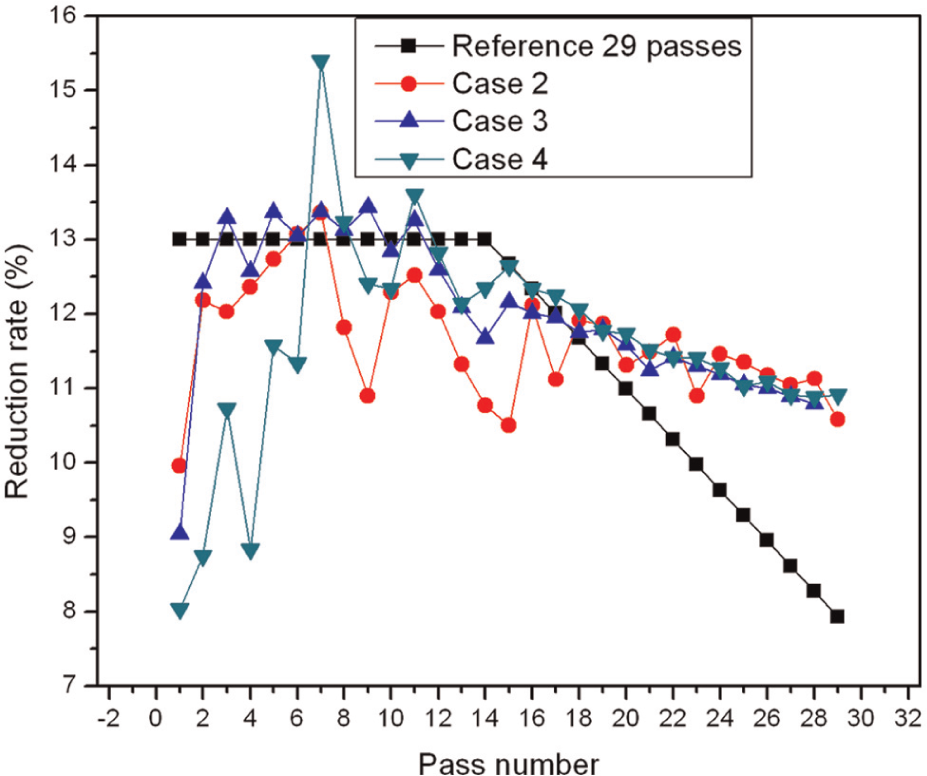
Pass schedules at the reference and the optimization in Cases 2–4.
Performance of the optimization approach
Currently, trial-and-error methods are widely used to design the multipass wire drawing processes in the industrial practice. Depending on their own experience and historical data, the designers attempt to arrive at a desirable solution after numerous experiments. However, our new approach, optimization with GA, provides an extremely cost saving and high-efficiency way to design the drawing processes. It required less than 100 iterative generations for single objective optimization and about 200 iterative generations for multiobjective optimization to obtain optimal solutions. The whole optimization process could be accomplished on a PC (CPU is Quad 3.3 GHz Intel Pentium III and Memory is 3242M) within less than 3 min. For the optimization process based on finite element model, it may take 1h to finish one iterative generation under the same condition, and thus, a total number of 100–200h are needed to accomplish the final results. Therefore, it is firmly expected that this new approach will be used as a solid basis for process design and control in wire drawing.
Conclusions
In this study, a reliable analytical model employed to calculate the drawing force, die pressure, power consumption, and temperature rise in the multipass wire drawing processes is proposed. Based on this analytical model, a new approach to optimal design of the multipass wire drawing processes with GAs is presented. In this approach, the total number of passes, partial reduction, die angle, bearing length, and loops on capstan are selected as design variable to be optimized. The optimization is conducted under various design constraints. Limitations are set on the maximum drawing stress, maximum die wear factor, and delta factor. The minimum of total power consumption and the minimum of maximum temperature rise are used as goals for optimization. Both single objective and multiobjective optimization are chosen and compared. The multiobjective optimization has been proved to enjoy more benefits, and thus, it is in preference to the single objective optimization. Based on the multiobjective optimization, different kinds of optimization methods designed for actual requirements are compared and discussed. It is shown that the optimal solutions are much better than the reference design, in terms of the total power consumption, delta factor, heat generation, and die wear. A significant merit of this approach is its capability in optimizing the multipass drawing processes in a very short time (less than 3 min in a normal PC).
Footnotes
Acknowledgements
The authors thank NV Bekaert for providing the pearlitic steel wires and computers and also thank Ali Sarban from Bekaert Technology Center for his efforts and time in preparing the article.
Funding
This study was financially supported by NV Bekaert.
Conflict of interest
The authors declare that there is no conflict of interest.