
Abstract
Process capability indices have been extensively used to determine whether the quality characteristics of the product meet the preset targets of the customer in manufacturing industries. However, these existing process capability indices cannot categorically determine improvement priorities for substandard quality characteristics. Besides, process capability indices also cannot effectively identify and measure deficiencies in process capability owing to accuracy, precision, or both. In this study, we combine the process capability index Cpm, minimum individual process capability C0, accuracy A, and precision P to develop a new process capability analysis chart. Managers can apply process capability analysis chart to identify the substandard quality characteristics of the product. Furthermore, if the budget for all substandard quality characteristics improvements is limited, we use the discrimination distance method to measure and determine improvement priorities for substandard quality characteristics. Moreover, we construct an implementation flowchart of the process capability analysis chart to derive the results easily. Finally, an example of a chip resistor is presented to illustrate the applicability of the process capability analysis chart for manufacturing quality management.
Keywords
Introduction
Owing to enterprise globalization and rapid development of technology, product-selling methods have changed substantially. Moreover, customer requirements are changing rapidly with an increasing emphasis on high quality, which not only leads to shortened product life cycles but also to increased research and development (R&D) cost. For this reason, it is crucial for both the manufacturer and the customer to achieve maximum quality at minimum cost. In addition to the above, in practice, manufacturers are confused about how to prioritize quality improvements and identify deficiencies in process capabilities if the process has many substandard quality characteristics and if resources for improvements are limited.
Weber et al. 1 and Dickson 2 indicated that process quality has been increasingly emphasized in the highly competitive electronics industry. Some quality experts have also proposed process improvement and quality management techniques that are crucially important for enhancing the quality and yield of products, satisfying customer requirements, creating competitive advantages, and increased market share for manufacturers.3–6 Chen et al. 7 indicated that process yield, process expected loss, and process capability indices (PCIs) comprise three basic parameters that have been widely applied to measuring product potential and performance. They further expressed that larger PCI value infer a higher process yield as well as lower expected process loss. Pearn and Lin 8 proposed PCIs provide numerical measures on process reproduction capability, which are effective tools for quality measurement and assurance. Many statisticians and quality engineers have emphasized research into PCIs to propose more useful methods of evaluating process potential and performance.9–13 Therefore, PCIs can be regarded as a powerful method for testing process capability for manufacturing a product that meets specifications; it means that the manufacturer should not incur extra costs for process improvement and should promote quality management through PCIs.
PCIs have been developed as a practical tool by many advocates of statistical process control in manufacturing industry. Juran 14 first proposed the concept of PCI and developed a PCI Cp when data follows normality, which combines the process parameters with product specifications. This index is defined as
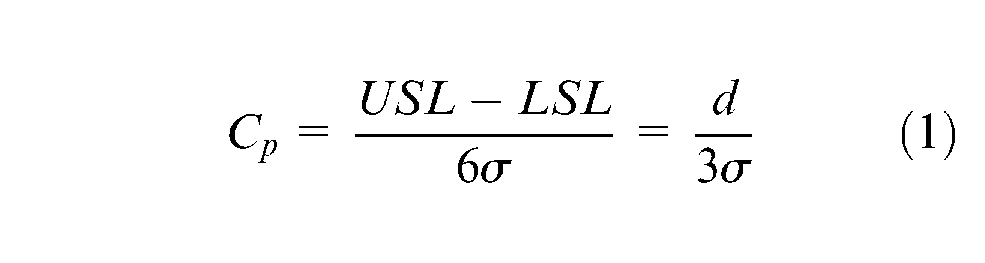
where USL and LSL are the upper specification limit and lower specification limit of the process, respectively; σ is the process standard deviation; and d = (USL − LSL)/2 is half of the length of the specification closed interval [LSL, USL].
However, index Cp does not consider any process shift. If the process mean µ is not centered relative to the specification limits, index Cp will give misleading results. Therefore, PCI Cpk was introduced by Kane 15 as a way of handling the process mean µ. This index is defined as follows
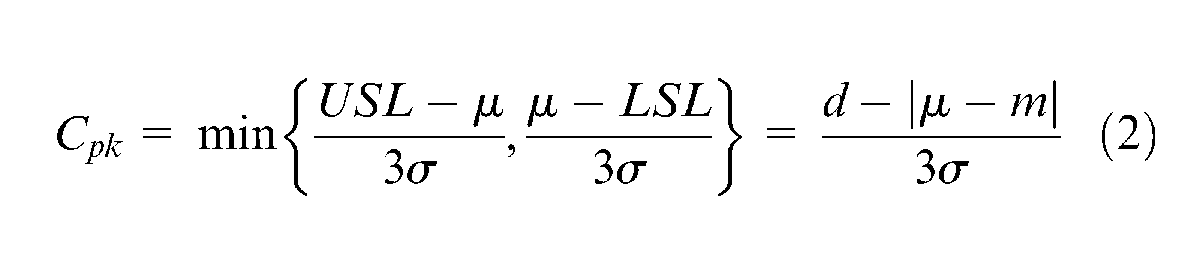
where m = (USL + LSL)/2 is the midpoint of the specification closed interval [LSL, USL].
In fact, the two indices Cp and Cpk are irrelevant to the process target T. A new PCI Cpm was introduced by Chan et al. 16 This index reflects the degrees of process targeting, which is defined as
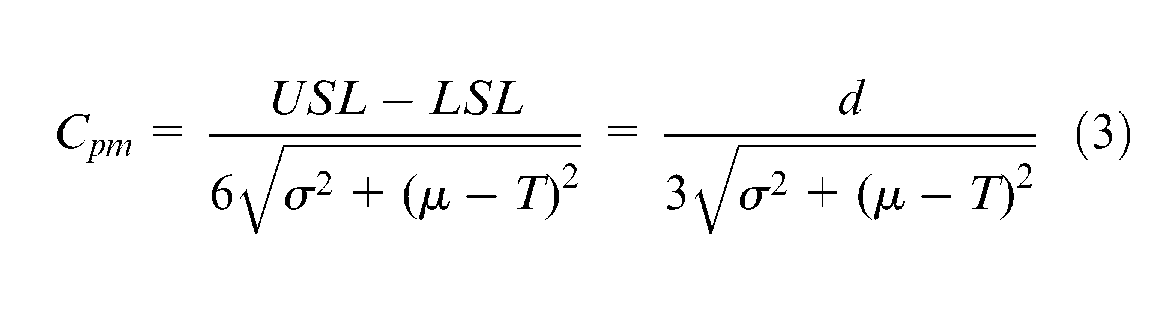
where T is usually set at the target of the specification limits.
In recent years, many production managers and quality experts have proposed improvements that suggest enhancements in the capability and performance of processes via PCI analysis.4,17–20 Moreover, there also have been increasing efforts to develop and apply PCIs; for example, Chen et al.
7
developed a process capability analysis chart (PCAC) based on Cp, Cpu, Cpl, and Cpk, which can be precisely measured for an entire product with symmetric and asymmetric tolerances, as well as larger-the-better and smaller-the-better characteristics. Chen and Chen
21
presented a novel method to select or judge the better of two suppliers or processes based on a confidence interval for the ratio Cpm1/Cpm2. Pearn and Liao
22
illustrated Cpk in the presence of gauge measurement errors. Chen and Huang
4
developed a new
Although PCIs have been widely used in various manufacturing industries, majority of research on PCIs has focused on identifying substandard quality characteristics or deficient process capabilities. Little attention has been paid to how to prioritize improvements in substandard quality characteristics.18,23,26,27 Moreover, PCIs also cannot effectively identify and measure deficiencies in process capability owing to accuracy, precision, or both. Therefore, the purpose of this study is to develop a PCAC based on a PCI Cpm, which is helpful to identify substandard quality characteristics and determine deficiencies in process capability owing to accuracy, precision, or both. Furthermore, if the budget for all substandard quality characteristics improvements is limited, we can compute the discrimination distance (DD) to determine the improvement priority of substandard quality characteristics. Then, we construct an implementation flowchart of the PCAC to derive the results easily. Finally, we also present an example of a chip resistor manufacturing process to illustrate how we can apply the PCAC and DD approaches to actual process data collected from the manufacturer.
The rest of this article is organized as follows. In the next section, we develop the new PCAC. In section “Illustrative example,” an example is discussed to illustrate the procedure for solving the model, and concluding remarks are provided as an illustration. Conclusions are given in section “Conclusion.”
PCAC based on Cpm
The three most commonly used PCIs Cp, Cpk, and Cpm have been widely applied in the manufacturing industry for evaluating, measuring, analyzing, and improving the process capability for manufacturing a product that meets specifications. Chan et al. 16 pointed out that Cpm is considered as the specification limits and the deviation with respect to a specified target value T that can be reflected in the process yield compared with Cp and Cpk. Pearn and Kotz 28 also illustrated the ranking of the three indices Cp, Cpk, and Cpm in terms of sensitivity to deviation of the process mean from the target value, from the most sensitive to the least sensitive as Cpm > Cpk > Cp. In addition, we know that Cpm can be effectively measured better than Cp and Cpk to determine whether the process levels satisfy customer requirements.
While all seem to agree that the PCIs can be used to observe process quality as well as to avoid substandard quality characteristics in the production process, a single PCI cannot be used effectively to determine the key item for improving substandard quality characteristics. Furthermore, it also cannot be useful to identify problems in process capability because of problems of accuracy, precision, or both. Therefore, we define accuracy
Furthermore, when the product has many quality characteristics, Chen et al. 7 proposed the integrated process capability, CT, which is defined as
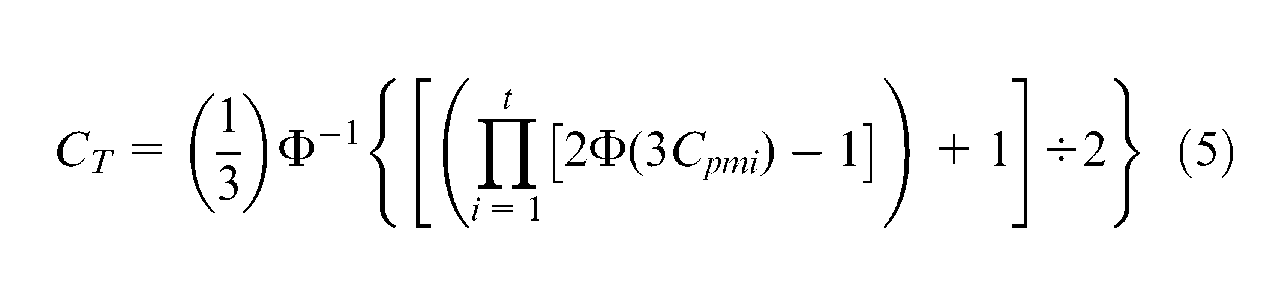
where t is the total number of quality characteristics, Cpmi is the Cpm of the ith quality characteristic, and Φ denotes the standard normal cumulative distribution function.
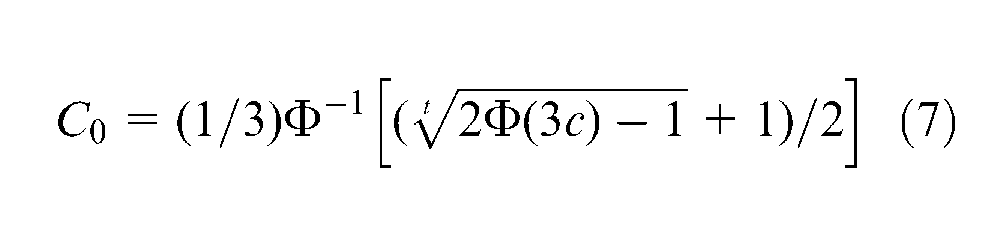
If the manufacturer takes the value c as the required level of the multiprocess product, and C0 is the minimum individual process capability (i.e. let CT = c and Cpmi = C0, for all i = 1, 2, …, t), then from equation (5), we can obtain
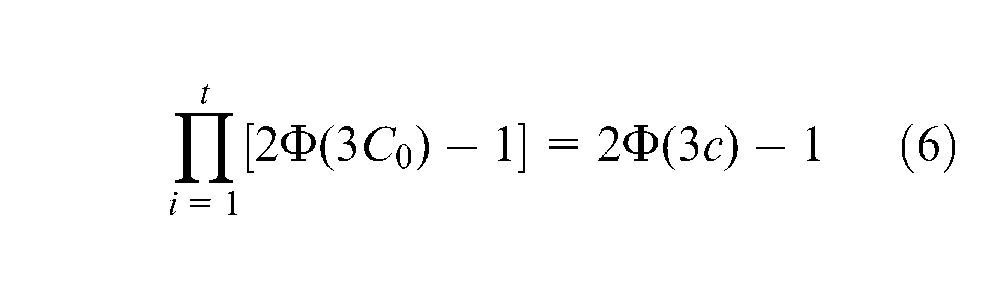
which implies
In addition, Chen et al. 7 established the following rule to determine the value of c for multiprocess product: a process is called “inadequate,” if the value of c is less than 1.00, meaning the process is not adequate to meet the preset manufacturing specifications; a process is called “capable,” if the value of c is between 1.00 and 1.33−, indicating that some process control is needed; a process is called “satisfactory,” if the value of c is between 1.33 and 1.50−, indicating that process quality is satisfactory; a process is called “excellent,” if the value of c is between 1.50 and 2.00−; and finally, a process is called “super,” if the value of c is greater than or equal to 2.00. These five levels are summarized in Table 1.
Five quality levels.
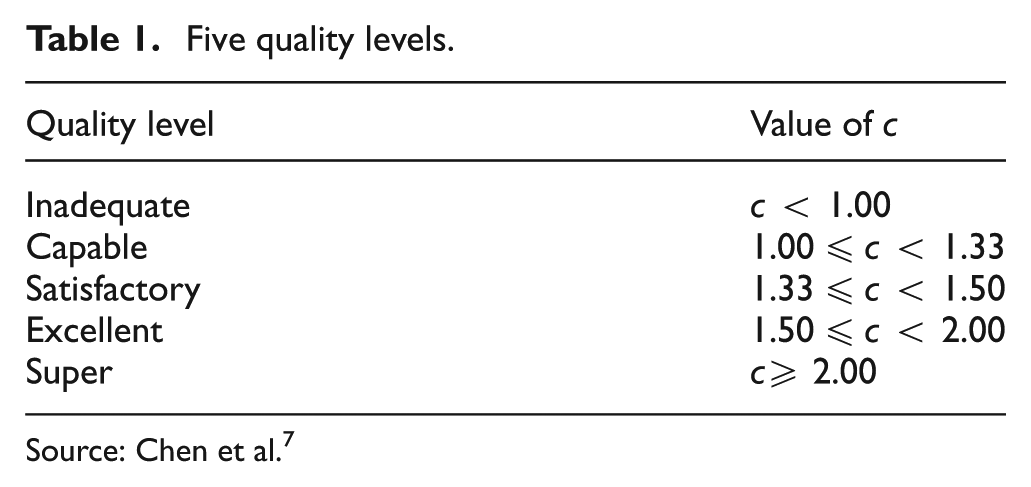
Source: Chen et al. 7
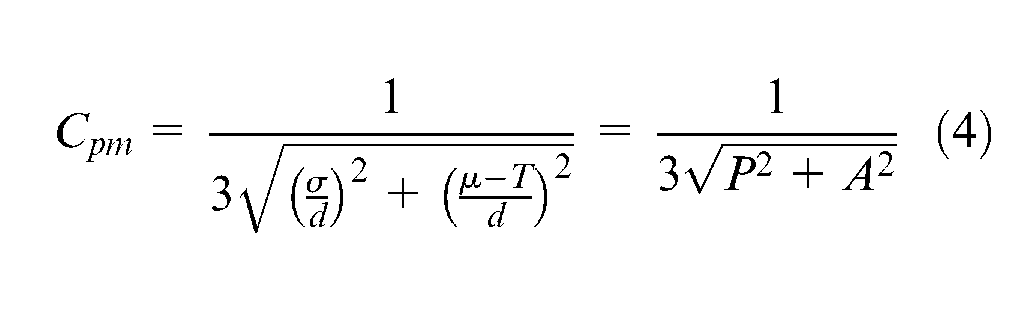
Let Cpm = C0, and substituting equation (4) into this equation, we can obtain

then

According to equation (9), we can construct a plot of a half-circle where A (x-axis) and P (y-axis) are the coordinate axes, the origin is the center,
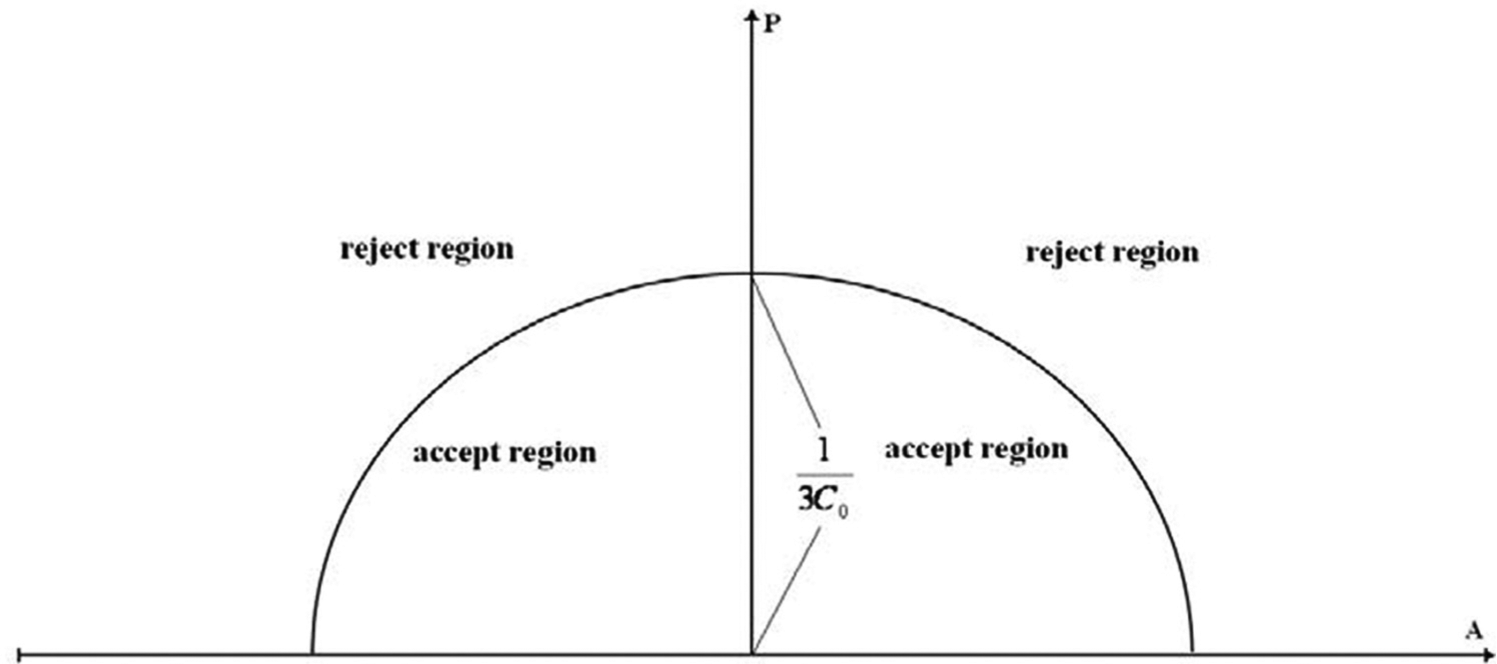
Process capability analysis chart.
As indicated, Figure 1 shows that the process is accepted if the quality characteristics are all within the semicircular region, which is often referred to as the “accept region”; the process is rejected if the quality characteristics are outside this region, which is often referred to as the “reject region.” In fact, when the quality characteristics are within the reject region, we should determine the improvement priority for the substandard quality characteristics. In practice, if the quality characteristics are far from the accept region, they should be given priority for considered improvement. On the basis of the above arguments, we assumed that a product has t quality characteristics, and Ai and Pi represent the accuracy and the precision of the ith quality characteristic, respectively. Thus,
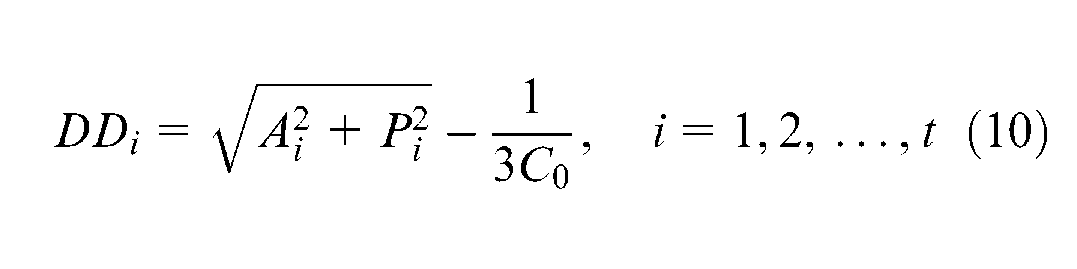
where C0 is the minimum individual process capability of t quality characteristics.
Hence, we can establish two rules for whether the quality characteristics should be improved as follows:
If DDi ≤ 0, the ith quality characteristic is “accept.”
If DDi > 0, the ith quality characteristic is “reject,” which will be considered for improvement.
Then, if q (
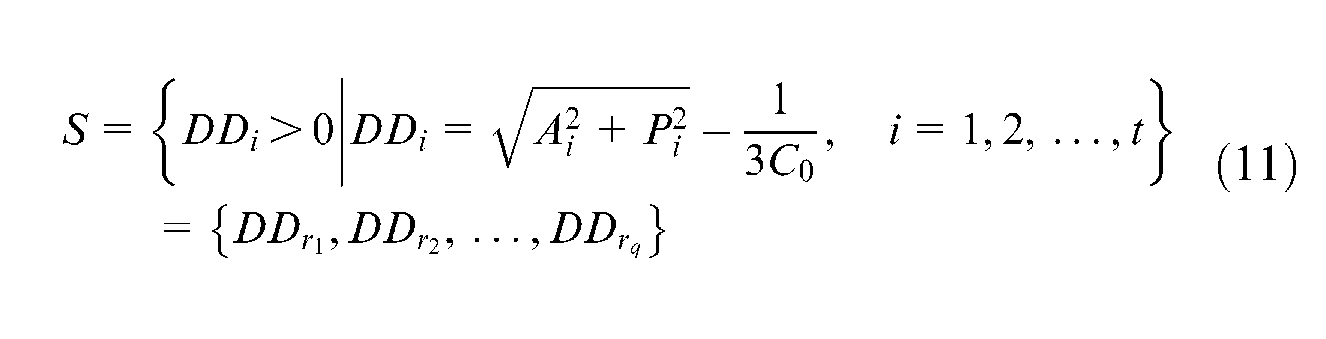
Let
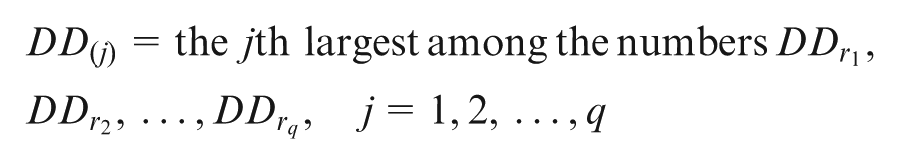
It follows that DD(1)≥DD(2)≥…≥DD(q). Therefore, the top priority quality characteristic for improvement corresponds to DD(1), the second priority quality characteristic corresponds to DD(2), and so on, and finally, the lowest priority quality characteristic corresponds to DD(q).
Furthermore, assume that the manufacturer considers the improvement cost of each substandard quality characteristic, and given that the cost of improving the quality characteristic C(j) corresponds to DD(j), j=1, 2, . . ., k. When the budget (B) for all substandard quality characteristic improvements has limited application and
In practice, the population mean µi and standard deviation σi of the ith quality characteristic, i = 1, 2, …, t, are usually unknown. Let X1, X2, …, Xn represent a random sample of size n from a given population, and let xi1, xi2, …, xin be the corresponding sample values of ith quality characteristic, i = 1, 2, …, t. Then, the sample mean
On the basis of the above arguments, we can construct an implementation flowchart of PCAC to evaluate and measure whether the process capability of each product characteristic meets the preset targets of the customer. Besides, we can determine improvement priorities for substandard quality characteristics by the DD. This implementation flowchart of the PCAC includes five steps, which are organized as follows (see Figure 2):
Step 1. Determine the required level of multiprocess product c from Table 1. Then, substitute c into equation (5) to obtain the minimum individual process capability C0 and then use the result to construct the PCAC.
Step 2. Determine
Step 3. Mark the given values
Step 4. From the scatter diagram of
Step 5. Find the quality characteristics that are outside the “accept” region of the PCAC. We assume the substandard quality characteristics as
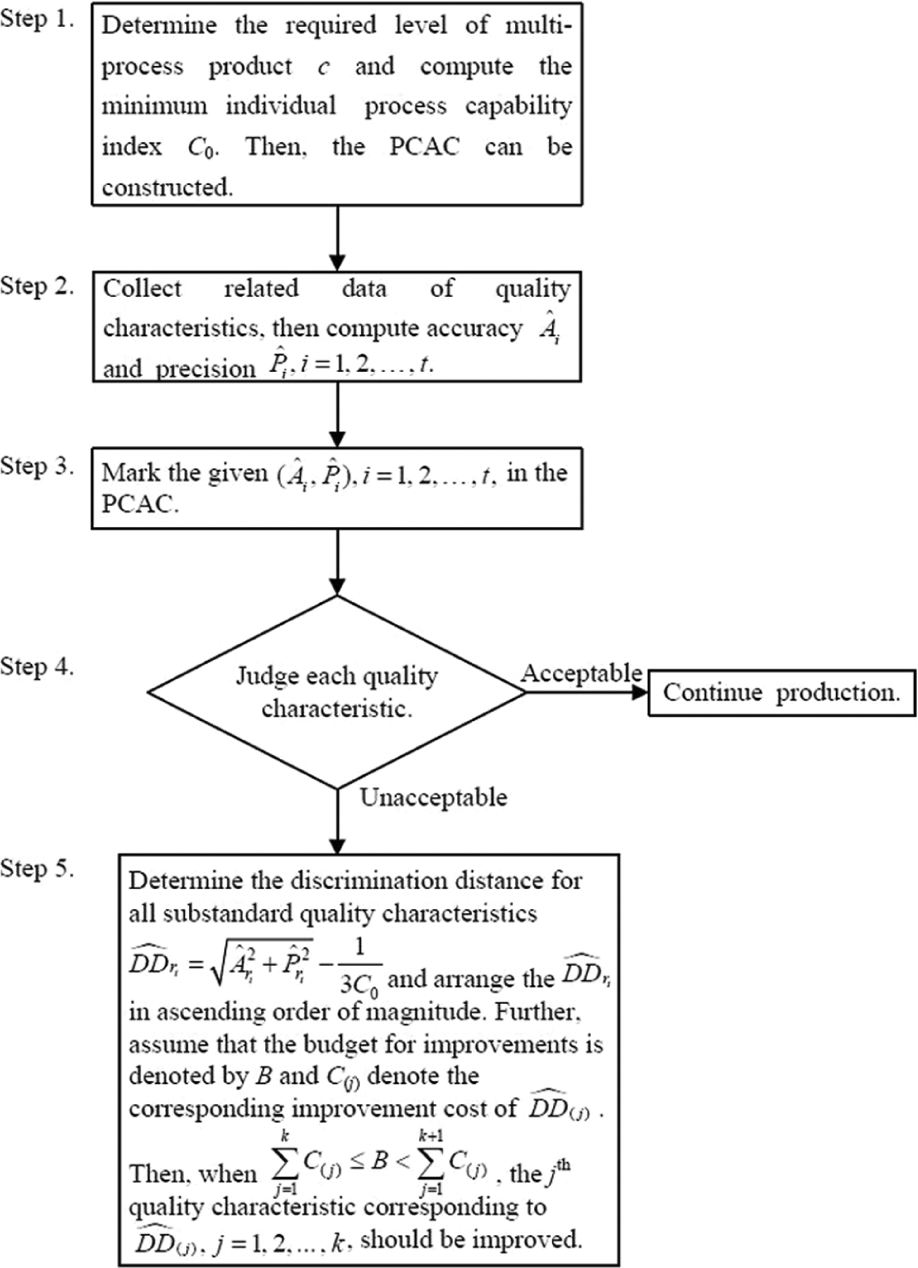
Implementation flowchart of the PCAC for evaluating and determining the improvement priority for the substandard quality characteristics of the product.
Illustrative example
C company is a professional manufacturer of chip resistors in Taiwan, whose H-type chip resistor is a major product. The H-type chip resistor is composed by vacuum depositing a resistive alloy on a high-purity alumina substrate of ceramic. The final geometry and interconnecting traces are defined through photo-lithographic or similar techniques. The technology not only offers for close ratio matching in a network but also gives low temperature coefficient and resistance tolerance. The H-type chip resistor material composition includes alumina ceramic substrate, bottom inner electrodes, top inner electrode, edge electrode, Ni plating, Sn plating, resistive layer, overcoat, and marking. The H-type chip resistor has five mechanical quality characteristics including length (L), width (W), height (H), upper width (UW), and lower width (LW) (see Figure 3).
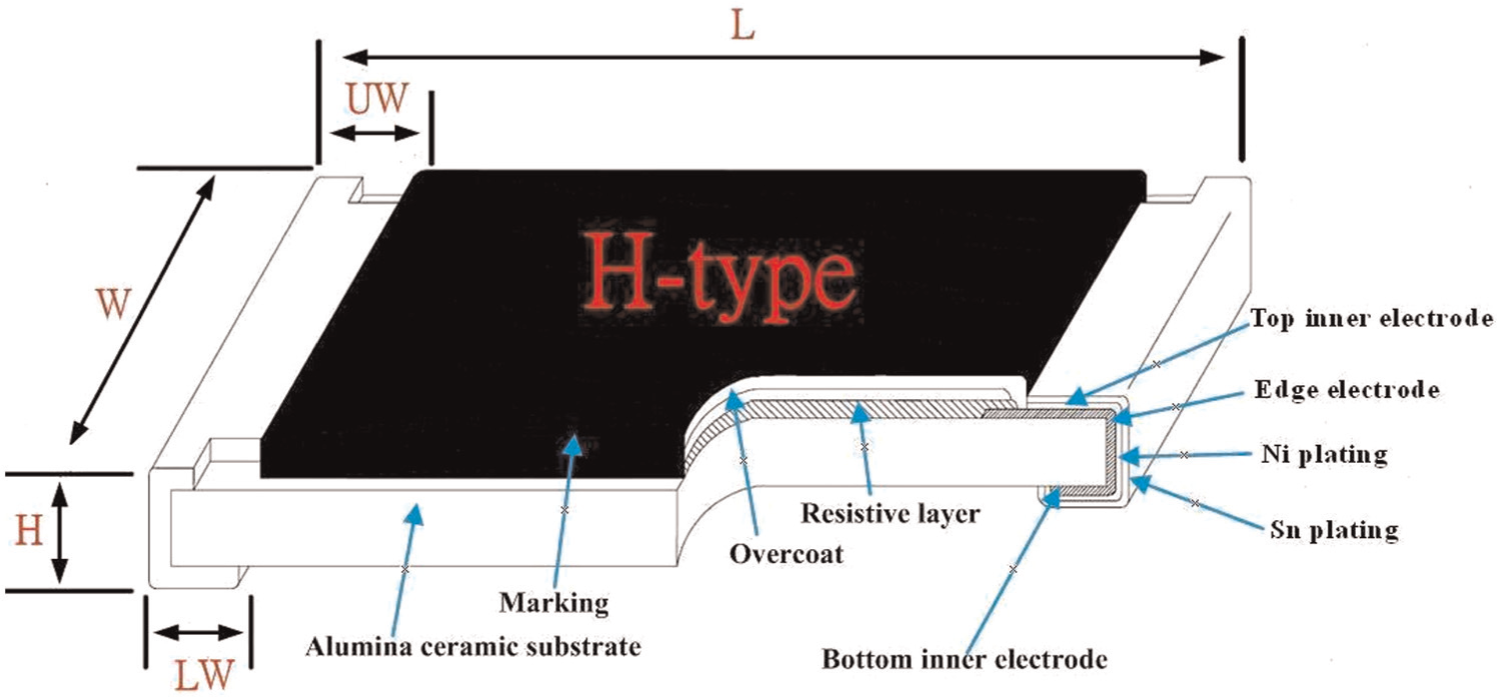
H-type chip resistor.
The chip resistor is a key component in high-tech electronic products (e.g. thin film transistor liquid crystal displays (TFT-LCDs), smart phones, notebook computers, and digital cameras). The chip resistor is a passive electronic component that is generally used for reducing current and voltage as well as releasing heat in electronic circuits. An electronic product can often have 10–1000 chip resistors with different tolerances. Therefore, the product can be unstable if a chip resistor is defective or fails to meet the specification.
For these reasons, we used the PCAC to perform product quality evaluation simultaneously and to efficiently determine the substandard quality characteristics of the chip resistor. The data were collected during five random samplings, averaging half an hour each, by a process engineer. For sample size n = 50 (>30), it can be seen that the sample mean is approximately normally distributed based on the Central Limit Theorem. Then, we determined and computed related data for the five quality characteristics of an H-type chip resistor, which is displayed in Table 2.
Process capability of the quality characteristics of the H-type chip resistor (unit: mm).
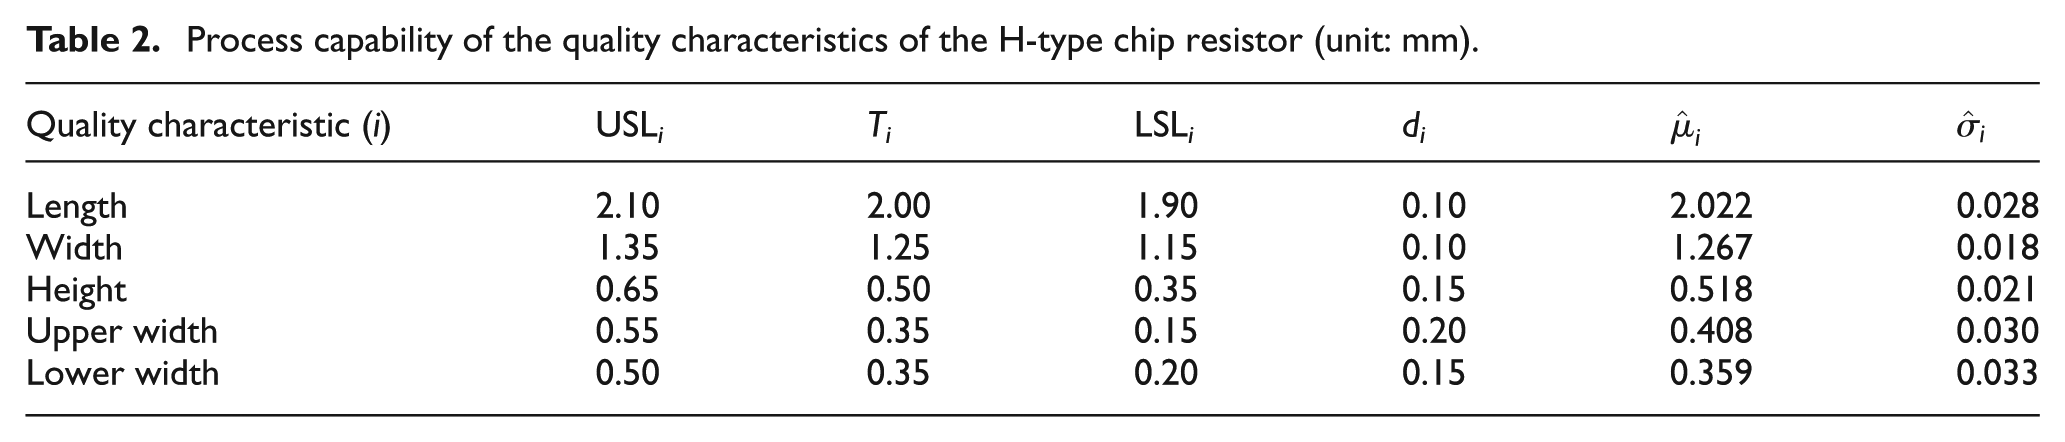
According to Table 2, we used the five steps in section “PCAC based on Cpm” to evaluate whether the process capability for the H-type chip resistor meets the acceptance standard. Furthermore, we determined the improvement priority for substandard quality characteristics using
Step 1. C company determines that the manufacturing process meets the capability requirement “capable.” As noted in Table 1, the required level of the multiprocess product is c = 1.00, and hence, the minimum individual process capability C0 can be obtained as
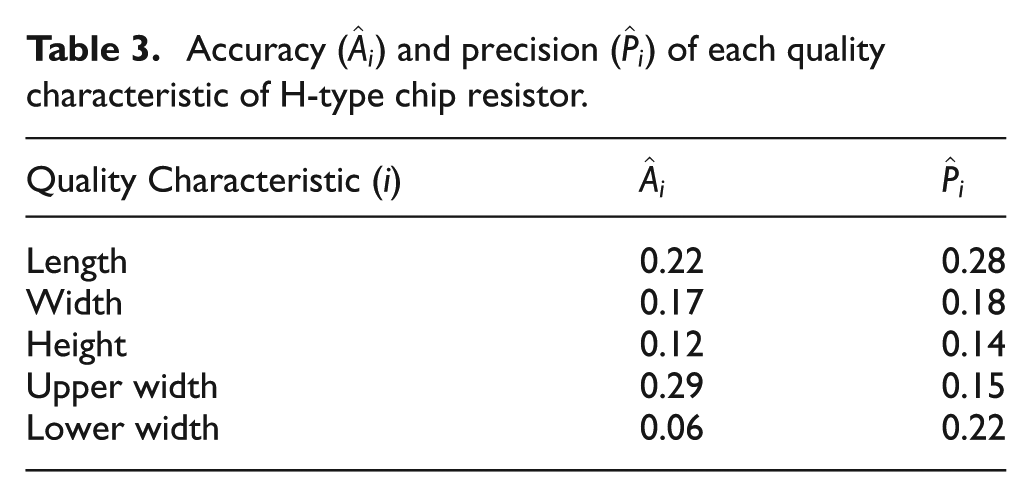
Step 2. From the collected data
Step 3. Mark the given values
Step 4. As shown in Figure 4, three quality characteristics, namely, width, height, and lower width, are located within the accept region, meaning that these three processes are “capable.” On the other hand, two quality characteristics, namely, length and upper width, are located within the reject region, indicating that these two processes are “not capable.”
Step 5. Calculate the length discrimination distance as
Accuracy (
PCAC of an H-type chip resistor.
Conclusion
In this study, we combined the PCI Cpm, minimum individual process capability C0, accuracy A, and precision P to derive the relation formula
The proposed method was conducted to justify the integrated product capability and to compute
In this study, we assume that the data following normally distributed or the sample size are large enough and the statistical analysis method is to use the point estimation. In future work, we would like to consider the situation where the data do not follow normally distributed and the sample size is small. Also, it should be possible to replace the approach of point estimation with the interval estimation and so on.
Footnotes
Acknowledgements
The authors would like to thank the anonymous referees for their many useful comments and suggestions that helped improve the article.
Funding
This research received no specific grant from any funding agency in the public, commercial, or not-for-profit sectors.