
Abstract
This article presents how to do stability analysis, variation simulation and tolerance envelopes for deformable cables and hoses. In this way, the well-established methods for analyzing and minimizing the propagation of geometric variation are extended from rigid and sheet metal assemblies to large deformations of slender parts. This extension is highly motivated, not at least, by the increased amount of cables and hoses in electrified and hybrid solutions in the automotive industry. To secure the geometric correctness of the analysis, we use a nonlinear rod approach in the implementation of a simulation model of flexible cables that accounts for large deformations and supports a wide range of common cable clip types, cable joints and branches. A selection of measures and visualizations that reflect the spatial effects of geometric variation in deformable cables is incorporated in established variation analysis techniques. In particular, the concept of tolerance envelopes for rigid parts has been extended to also handle system of slender parts such as cables and hoses. This article extends previous research on robust design and variation simulation to cables subject to large deformations and has been successfully applied on two typical industrial cases: a wiring harness attached with various types of clips to a static surrounding and a cooler hose subjected to a high-frequency sampled engine motion.
Keywords
Introduction
Geometric variation, originating from individual manufacturing and assembly processes, often propagates and accumulates during production, resulting in nonnominal products. Geometric quality problems are often discovered during preproduction or when the product is getting ready for market introduction. A change in the product or production concept at this stage often results in huge costs for product and/or production changes, market delays and bad publicity. Therefore, more and more efforts are made in early concept phases to virtually verify product and production concepts with respect to geometric variation.
Recently, we have seen a shift of focus of the automotive industry toward electrified and hybrid solutions; controlling and predicting the geometric variation in deformable parts such as electric harnesses and hoses become increasingly important as the competition for unoccupied space is intensified. For example, both conventional combustion engines and battery supplied electrical engines need to fit in an already densely packed vehicle. The placement of each component must be evaluated with respect to geometrical interference with other disciplines and their components considering component and assembly variations.
The geometry assurance process
The process aiming at controlling geometric variation throughout the whole product realization process is called the geometry assurance process. In the concept phase, the design concept and the production concept are developed. In the verification phase, the design and production concepts are physically verified by prototypes and test series. In the production phase, the product is in full production. The effect of geometric variation may be avoided, identified and controlled by a number of activities in these three main phases.
In the concept phase, the effect of variation is avoided by robust design concepts. 1 Tolerances are simulated and verified with respect to fulfillment of product requirements; see, for example, studies by Gao et al. 2 and Glancy and Chase. 3 Robust fixture design is considered by Cai et al. 4 and Wang. 5 The philosophy of robust design is combined with the philosophy of axiomatic design by Söderberg and Carlson 6 in order to achieve an assembly concept that is also easy to adjust and control.
In the verification phase, physical prototypes and test series are used to verify the concept geometrically. Prototypes verify the overall concept with respect to nominal fit and function, whereas test series verify the concept with respect to manufacturing and assembly variation under more realistic circumstances. These verification activities are quite expensive and time-consuming. Therefore, simulation techniques are being used more and more for nonnominal verification to reduce the needs for physical test series, see, for example, studies by Spensieri et al. 7 and Van den Berg et al. 8
In the production phase, inspection data are used for diagnosis and root cause analysis. Individual processes are monitored and kept under control using techniques for statistical process control. Overall trends are identified using univariate or multivariate techniques, see, for example, the study by Johnsson and Wichern. 9 Fault isolation in the auto-body assembly process using inline measurements has been addressed by, for example, Hu and Wu, 10 Ceglarek and Shi, 11 Jin and Shi, 12 Ding et al.,13,14 Camelio et al. 15 and Carlson and Söderberg. 16
Variation simulation and robust design are an active research area, from which methods in order to control and reduce variation in rigid assemblies have evolved and are now also well established in the industry. When dealing with compliant parts, which is not that well established yet in industry, there are still many significant published results. Flexible assemblies have been treated by Liu et al. 17 Ceglarek and Shi 18 used a linear beam–based model for tolerance analysis in sheet metal assemblies. Sellem and Rivière, 19 Camelio et al. 20 and Cai 21 used finite element analysis (FEA) for the same purpose. Hu and Wu 10 presented the “stream-of-variation” theory for automotive body assembly. Wärmefjord et al. 22 investigated the impact of spot welding sequences for variation in sheet metal assemblies. When the product involves complicated systems of deformable cables such as wiring harnesses, however, the linear FEA is not sufficient to properly capture the highly nonlinear geometric response in the material even when subject to small variations.
Scope of the article
The research of this article extends a set of well-established simulation methods for analyzing and controlling the propagation of geometric variation in assemblies to also handle deformable cables, hoses and wiring harnesses. In order to accomplish this, new components need to be in place. Crucial for the geometric correctness of the analysis are the choice and implementation of a simulation model for cables that accounts for large deformations and supports a wide range of common cable clip types, cable joints and branch breakouts. A computationally efficient implementation of the model allows then for carrying out a variation simulation by means of Monte Carlo iterations. In addition, a selection of critical measures and visualizations that reflect the spatial effects of geometric variation in deformable cables is incorporated in existing variation analysis techniques. In particular, a novel method to generate tolerance envelopes for compliant parts is introduced.
Structure of the article
The article is structured as follows. The next section describes Cosserat rods, the simulation model that is used in order to fast and accurately compute the static equilibrium of flexible cables. The proposed simulation methodology is presented in the section “Variation analysis”: different geometric similarity measures for flexible cables are discussed and the concepts of stability analysis, tolerance envelopes and full-scale variation simulation are introduced. The methodology is then applied to two different industrial cases in the “Case studies” section, and the results are finally concluded in the “Conclusion” section.
Cosserat rods
The cable simulation model must both account for large deformations and be computationally efficient. Cosserat rods are gaining widespread popularity for exactly these reasons and constitute a specialized topic geometrically nonlinear structural mechanics.23,24 By using innovative mathematical techniques in combination with numerical procedures specifically tuned to the application problem, it is possible to retain the necessary physical accuracy even on very coarse grids. 25
Rod kinematics
Cables are in this article regarded as deformable objects geometrically characterized as one-dimensional slender structures. This type of objects can express large overall deformations although locally the stresses and strains remain small. Under the assumption that the cable cross section always remains planar and rigid, the kinematics of a cable are captured in a framed curve.
A Cosserat rod of undeformed length L is a framed curve parameterized by arc length s


where
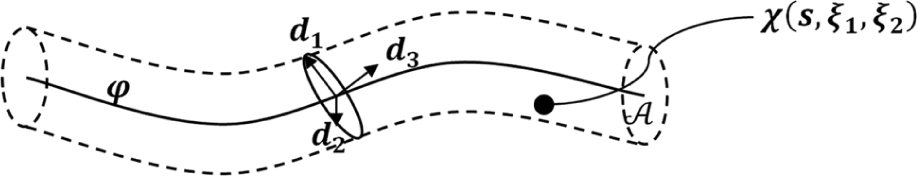
A Cosserat rod represented by a center curve and a frame field describing the cross-section orientation.
Mechanical equilibrium
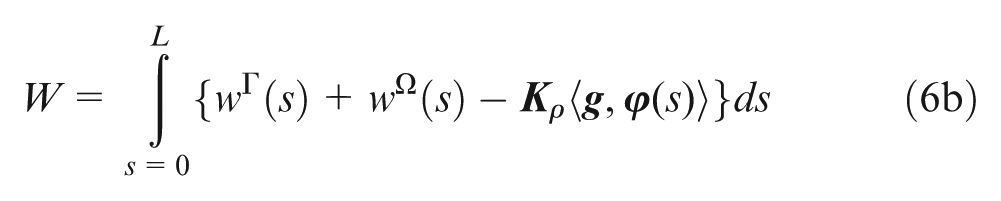
To find the (static) mechanical equilibrium, one seeks a stationary point to the potential energy functional W of which the elastic part is composed of quadratic forms in terms of frame-invariant strain measures.
The stretching/shearing strain vector
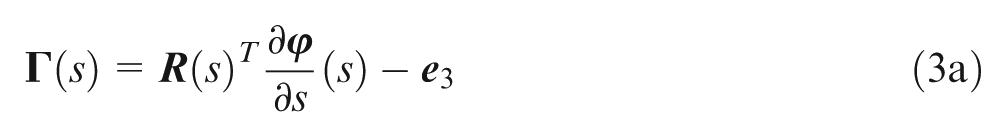
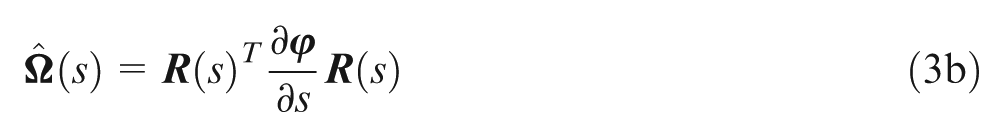
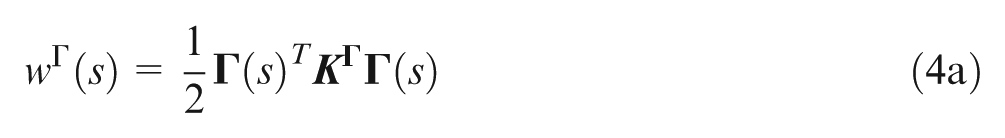
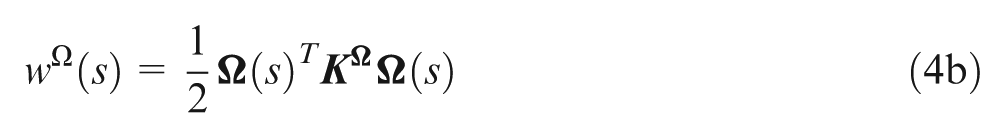
for some stiffness tensors
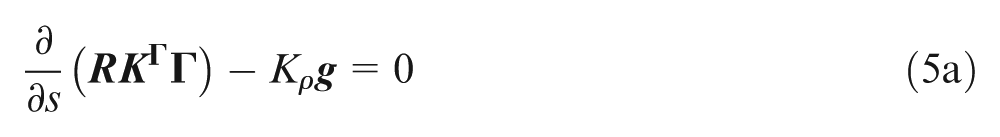
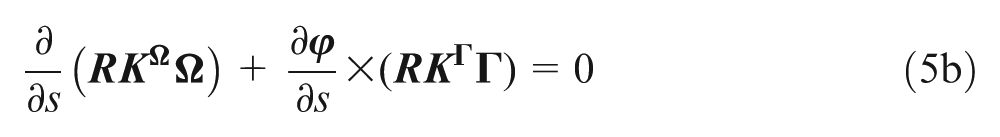
or (equivalently and more efficiently) as the stationary states to the total potential energy

An adaptive finite difference discretization of a Cosserat rod coupled with an efficient quasi-Newton method to minimize the energy together with a set of boundary conditions forms the foundation of our cable simulation.
Boundary conditions
A wide range of common cable clips and different cable joints and branches are encountered in many industrial cases (Figure 2). It is geometric variation in the realization of these boundary conditions that we later wish to analyze. For this purpose, a general collection of boundary conditions needs to be supported.
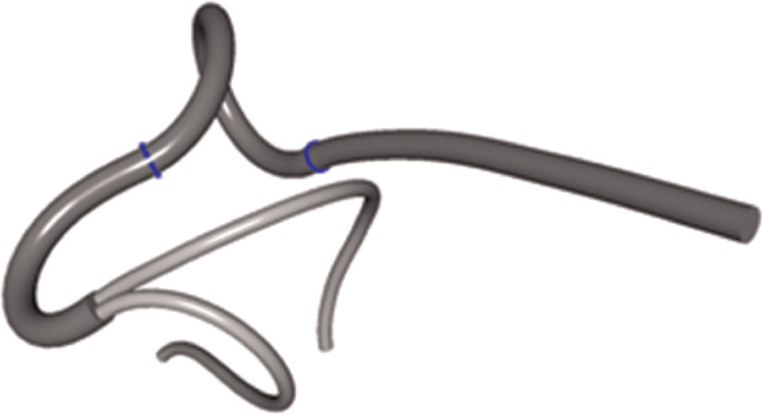
A wiring harness with clip and branch breakouts.
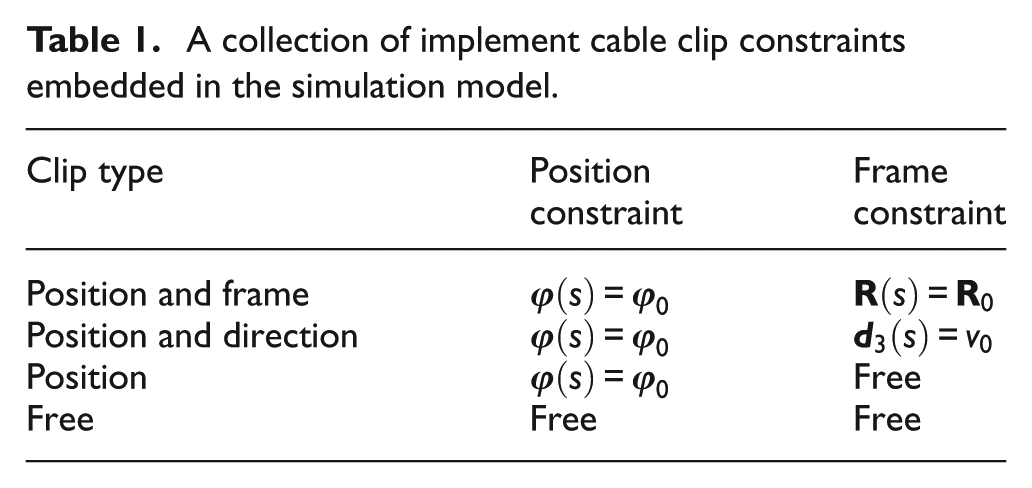
A cable clip can constrain the cable in different ways. For example, a clip can lock the position and the
A collection of implement cable clip constraints embedded in the simulation model.
An efficient implementation of a discrete Cosserat rod model together with the generalized set of boundary conditions allows us to gather large quantities of physically reliable cable simulation data to fully support the methodology presented in the next section.
Variation analysis
A manufacturing process is always afflicted by variation in various product design variables, causing deviation from nominal values in critical measures on the final product. Variation analysis aims to early in the geometry assurance process detect design and assembly solutions that are sensitive to variation and may cause problems later on during production.
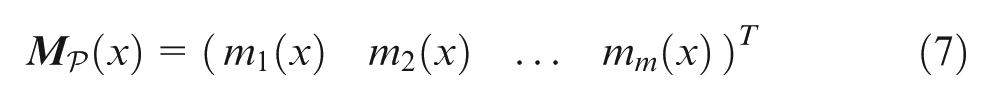
Formally, we assume that the configuration of a product
For deformable cables, design variables could mean the length of the cable, the orientation of the cable clips or material parameters, while critical measures of interest could be the maximum stress in the cable, normal force exerted on a cable clip or the shortest Euclidean distance between the cable and the surrounding.
This section describes a methodology for variation analysis of deformable cables with a focus on controlling the spatial effects of variation in geometric design variables. The methodology is tailored for early stages in the geometry assurance process when real prototypes and inspection data are not available and consists of the following:
Stability analysis. Evaluation of the robustness of a cable design by linearization around the nominal design. The analysis indicates how design variables contribute to design sensitivity and how they may be updated in order to achieve a cable design less sensitive to fixture variation.
Tolerance envelope analysis. Generation of the smallest volume enclosing all cable shapes satisfying a specified set of tolerances. A tolerance envelope can be used to validate that variation in a cable design does not interfere with components in the surrounding—or reversely—to serve as a forbidden region when considering the design and location of the surrounding components.
Variation simulation. Geometric variation simulation by means of Monte Carlo iterations. The simulation captures nonlinearities and provides a good knowledge about the variation effects and serves as good feedback to the tolerancing of the design.
Geometric design variables
The geometric design variables considered in this article describe either the geometric part properties of the undeformed cable shape (cable length, radius, etc.) or fixturing variables that control the locations of the cable clips.
Typically, a cable clip is rigidly attached to a specific component, inheriting the location scheme of that component. Conventional assembly locating schemes such as the 3-2-1 system have been studied in the context of robust fixture design.
1
We will additionally assume that there might be a variation in the assembly of the clip itself. For simplicity, we assume that the variation in clip orientation

Here,
Variation measures
A variety of measures can be used to quantify the geometric variation in the final product. A measure can estimate the total variation for a body by, for example, statistical root sum square (RSS) methods, or it can relate to a dimension critical for the functionality or the aesthetical appearance of the product. In our study, two types of measures are of additional interest: shortest distance to a surrounding component and a geometrical similarity relation with respect to the nominal cable shape.
The cable response function
If there is little knowledge about the surrounding or a strong confidence that the nominal cable design is the best from a geometric perspective, then any geometric deviation from that is associated with a risk. Given a perturbation
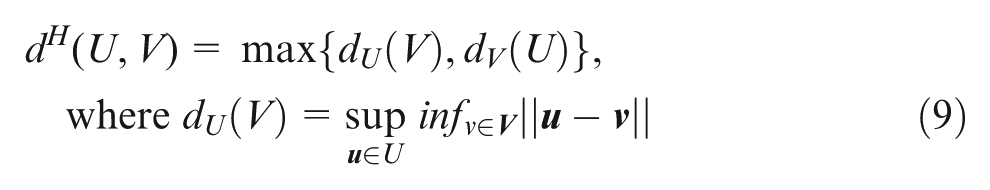
Proximity queries between triangulated objects and/or space curves represented by polylines have been efficiently implemented, 26 and Aspert et al. 27 described how a discrete Hausdorff distance can be computed (Figure 3). The similarity measures presented in this section are true worst-case measures.
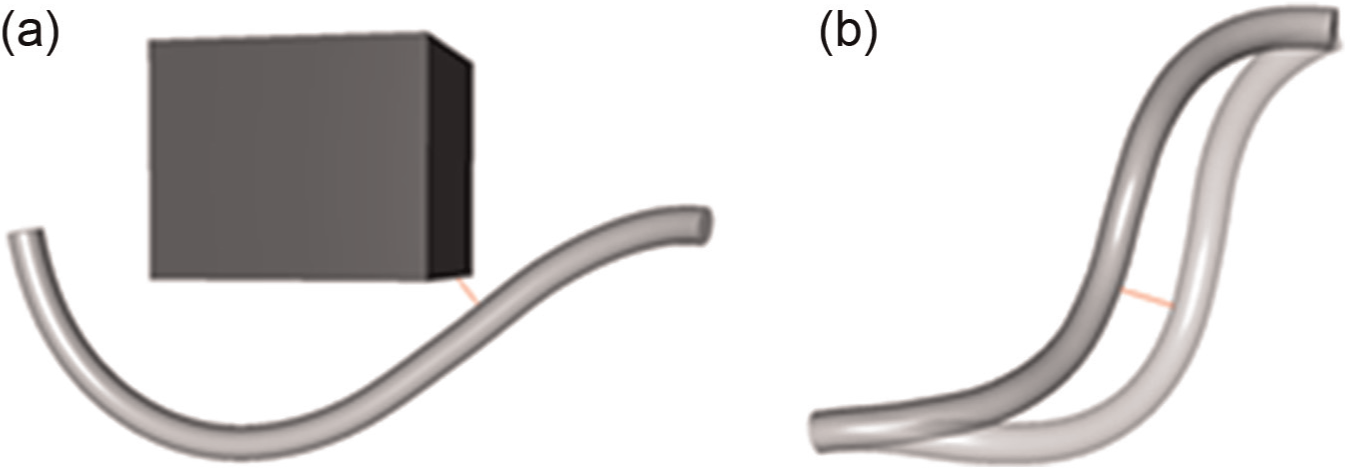
(a) A distance measure between a cable shape and a static geometry. (b) The Hausdorff distance between a perturbed cable and its nominal shape.
Stability analysis
A stability analysis evaluates the robustness of the nominal design and indicates how design parameters contribute to variation and how a location scheme or design variable may be updated in order to achieve a cable design less sensitive to variation. The analysis is carried out by linearizing the design equation and studying the Jacobian, commonly referred to as the sensitivity matrix, at the nominal design
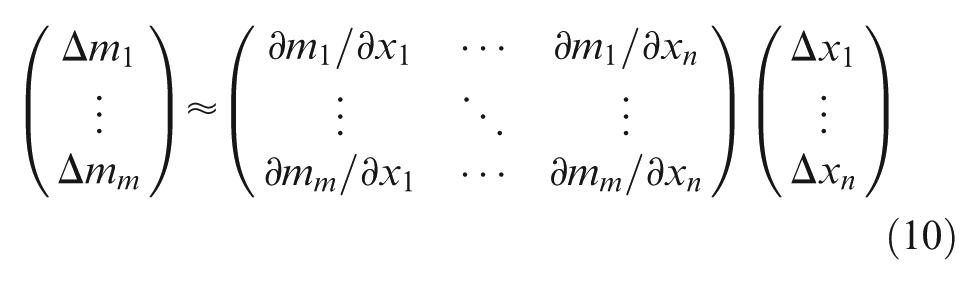
In the case of our Hausdorff similarity measure, we cannot evaluate the Jacobian since the measure is not even differentiable at the nominal design. For this measure, we will consider
Following the concept of Suh, 28 a good coupled design is generally one with a distinct coupling between as few variables and with as little amplification as possible. A more robust design is achieved by an iterative procedure where the contribution to sensitivity is identified by the sensitivity matrix and resolved by updating the configuration of the product, for example, changing positions of the corresponding locators.
Tolerance envelopes
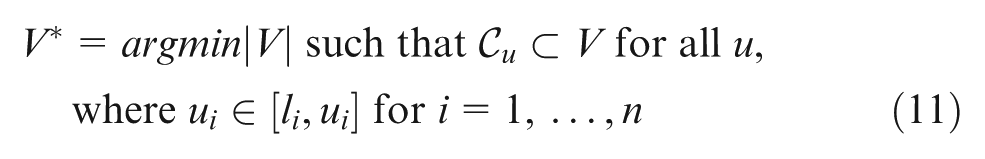
A tolerance envelope
Lööf et al.
29
generated a motion envelope for rigid bodies by computing the convex hull of a large set of variation simulation outcomes combined with convex partitioning. To generate a tolerance envelope of a triangulated cable shape, we instead deterministically sample the tolerance regions for all design variables and build up a collection of cable shape extrema, each with the same number of triangles generated via the deformation mapping
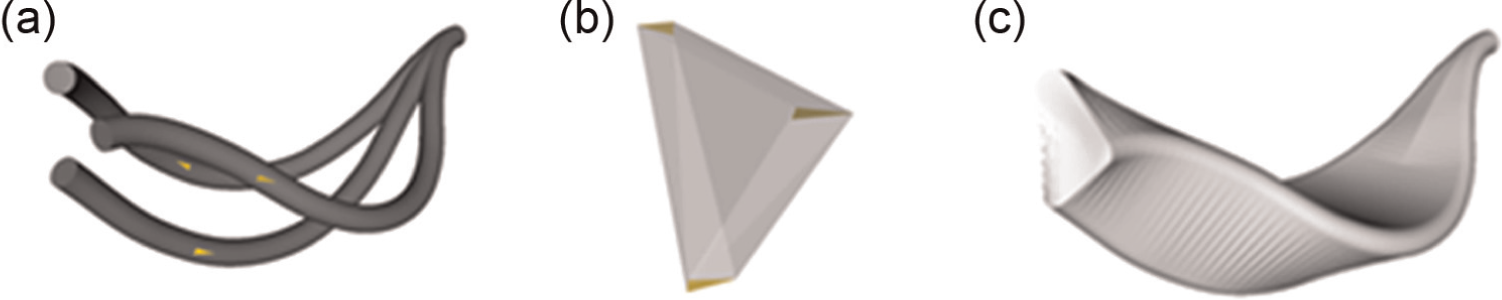
(a) A set of tolerance extreme shapes and (b) the corresponding convex hull of one material triangle. (c) The entire tolerance envelope.
Variation simulation
A variation simulation analysis is carried out in order to gain knowledge about how the variation in the design variables propagates to the critical measures. It validates the robustness and serves as feedback to the tolerancing of the design. Typically, in a CAT software, the variation is color coded in order to get a good overview of areas with high and low degree of variation (see Figure 5).
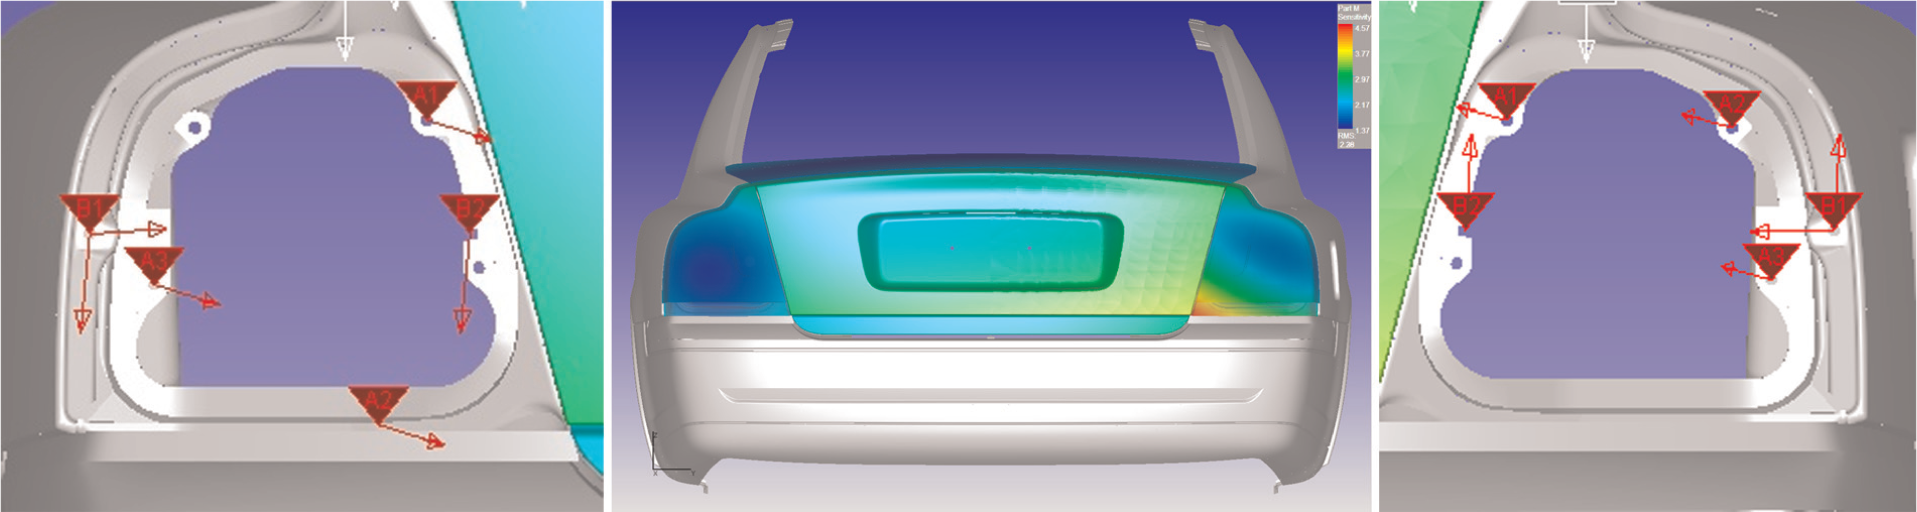
This figure illustrates two rear lamps of a car with different locating schemes. The left lamp has a more spread out set of locating points and as the color coding suggests is clearly the best locating scheme with respect to part variation.
To perform the variation simulation, the Monte Carlo simulation method (MC) is used. MC samples a large population of design variable values randomly (within their specified statistical distributions) and evaluates the critical measures in order to estimate their statistical properties. The method captures nonlinearities and allows any kind of statistical distribution as input parameter variation.
Case studies
Two industrial case studies have been conducted in order to test the methodology in real-life scenarios. The cases consist of highly detailed triangulated data and complex motions sampled with high frequency.
Wiring harness installation
This case considers a wiring harness of length 312 mm with a breakout at arc length position s = 258 mm. The three ends are mounted to parts of a car, see Figure 6. The task is to verify the robustness of the design with respect to the cable connector WH_Start as indicated in the figure. WH_Start has a rotational variation around the local y axis with tolerance ±5°.
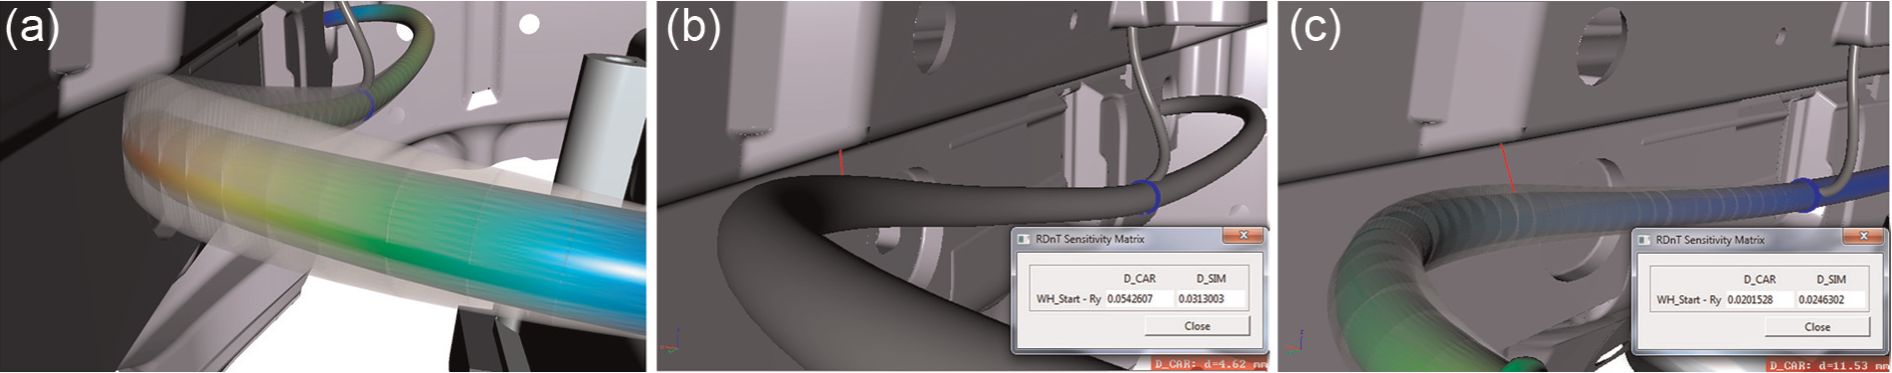
(a) Tolerance envelope and color-coded variation. (b) WH_Start and the sensitivity matrix of the initial design. (c) The final robust design at a safe distance from the car.
First, a tolerance envelope is generated to detect geometrical interference with other components within the estimated set of tolerances. It turns out that the tolerance envelope intersects the car geometry. A color coding indicates that the variation of the harness is indeed the largest in areas where the interference occurs. In order to improve the robustness of the design, the stability matrix is computed for the distance to the car D_CAR and for a similarity measure D_SIM. D_SIM is 31 mm/°, indicating that a perturbation of 1° in WH_Start affects the design of the cable with 31 mm. WH_Start is rotated by 3° around the local z axis toward the other harness ends, and we observe that both sensitivities are now reduced. The procedure is reiterated until we arrive at a design that is both robust and at a safe distance from geometric interference with other components.
Engine motion
In this scenario, a cooler hose of length 330 mm is attached to an engine, and the engine follows a recorded engine motion. The point of the hose connected to the cooler has a variation of size in the translatory degrees of freedom. Similar to the previous case, in order to analyze the motion, a tolerance envelope for the hose with respect to the entire motion is needed. To generate such a volume, we first divide the motion into a large number of motion time segments. For each such time segment
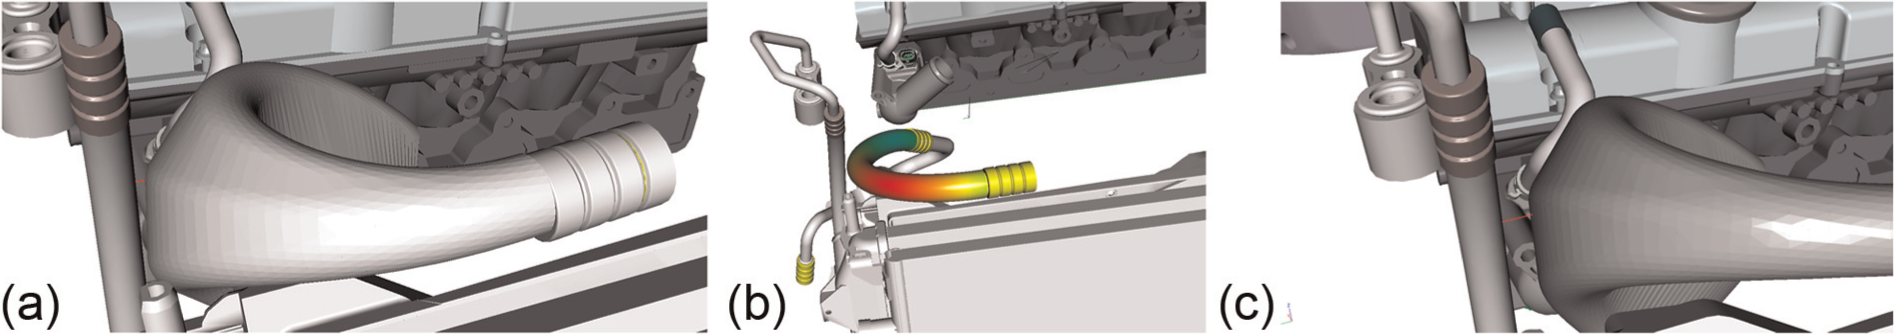
(a) A tolerance envelope for the entire motion indicates a potential interference with the surrounding (distance 4 mm). (b) Color coding of variation with respect to cable length (330 mm). (c) The tolerance envelope of the hose motion with respect to new cable length 300 mm.
Validation
The variation simulation methods described in this article have been carefully validated by the research community for rigid and sheet metal assemblies. Crucial to the correctness of the analysis when extending the methods to deformable cables is the underlying simulation model. The Cosserat rod model has been verified against higher order finite element method (FEM) simulation as well as against real measurements provided by Delphi. Figure 8 shows the deviation of computer tomography (CT) scans of three different specimens and their average centerline compared to the result of the simulation model. The maximum deviation from the average center curve of the specimens is approximately 1 mm and for the individual specimens at most 3 mm, which indicates a very good alignment between simulation and measurement data.
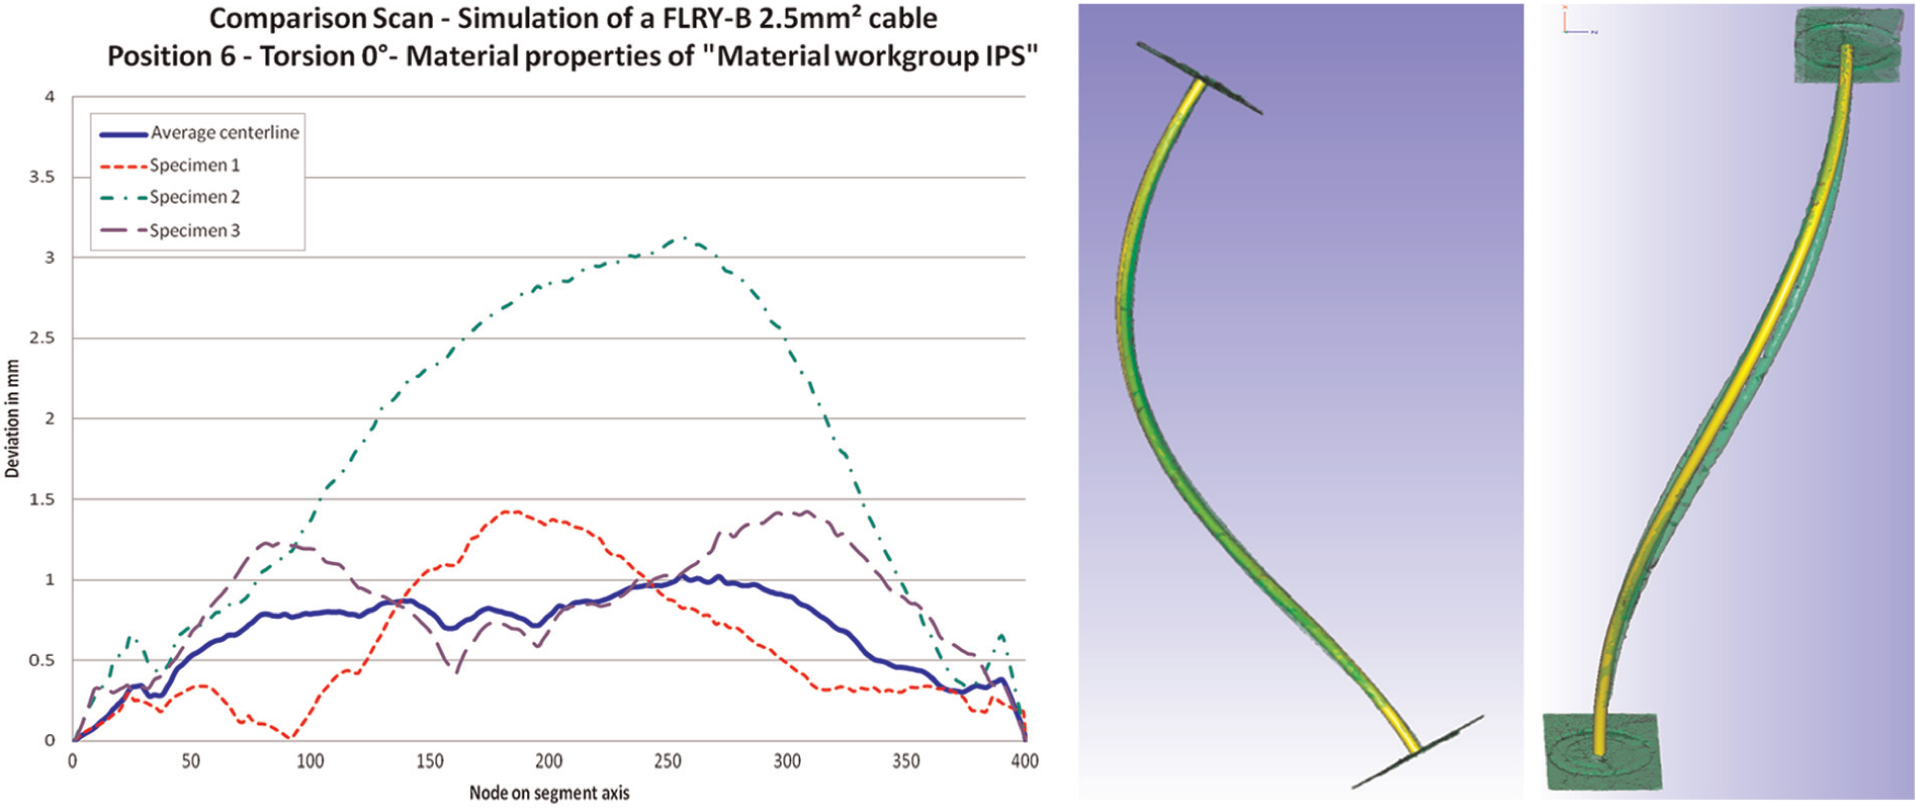
Comparison of simulation model and CT scan data (courtesy of Delphi). The plot shows the deviation between the simulation and scans of three different material specimens, and the pictures show the setup from two different views (the bright shape is the simulated shape and the dark shape is the scans). The maximum deviation from the average centerline of the specimens is very small: approximately 1 mm.
Conclusion
This article has presented a set of simulation methods for analyzing and controlling the propagation of geometric variation in deformable cables and hoses. Efficient implementations of a cable simulation model, similarity measures for triangulated geometries and tolerance envelopes have been combined with state-of-the-art variation simulation methods in order to strengthen early stages of the geometry assurance process. The methodology was successfully applied on two industrial cases.
The main scientific contribution of this work is the extension of existing simulation methods and tolerance envelopes to handle systems of deformable slender objects where large deformations need to be accounted for.
Footnotes
Acknowledgements
This work was carried out within the FFI Sustainable Production Technology program, the Wingquist Laboratory VINN Excellence Centre and the Sustainable Production Initiative and the Production Area of Advance at Chalmers University of Technology.
Funding
This research was supported by the Swedish Governmental Agency for Innovation Systems.