
Abstract
In the last decade, tube hydroforming has made a great progress in the automotive and aerospace industry. Robust tube hydroforming requires proper consideration of the influence of process uncertainty on process reliability. In this article, uncertainty variables in the tube hydroforming process are identified according to their characteristics. The design variables and noise factors that influence the corner filling process are subsequently screened through a variance analysis. Assuming that the design variables and noise factors follow the normal distribution, the probability distribution of the corner radius is evaluated by incorporating random process variables into the response surface model and implementing the Monte Carlo simulations. A reliability model for the corner filling process is developed in terms of the permissible corner radius interval. The optimal design point with the maximum probability of process safety is obtained using this model.
Introduction
Tube hydroforming (THF) is a process for making tubular parts, in which pressurized fluid is used to deform the tube blank to the desired shape. Since the 1990s, THF has gained a wide acceptance in the automotive and aerospace industries due to its numerous advantages over the stamped and welded assemblies, that is, part consolidation, weight reduction, fewer secondary operations, enhanced part quality, and so on.1–5 Many tubular parts possess complex cross-sectional shapes with small or sharp corners, such as square or triangular cross-sections. During the hydroforming of these components, the friction force at the die–material interface hinders the flow of the material into the die corner and causes a non-uniform thinning distribution with maximum thinning at the corners. Due to excessive thinning, bursting failure may occur prior to complete filling of the corner. Thus, complete filling of small corners or sharp corners in the THF process is difficult.
Various studies on the characteristics of the corner filling in the THF process have been performed using the analytical models, finite element analysis (FEA), and experimental investigations. Hwang and Chen6,7 developed mathematical models to analyze tube expansions in the rectangular die with a sticking friction condition and in the square die with a sliding friction condition. Yuan et al. 8 examined the effects of internal pressure and axial feeding on the tube expansion in a rectangular die. They discovered that the parts hydroformed without axial feeding may burst in the transient areas of the parts. Chen et al. 9 proposed a theoretical model to explore the relationship between the hydraulic pressure and the outer corner radius of the deformed tube in the hydrforming process. FEA was used to verify the proposed model. Loh-Mousavi et al. 10 utilized pulsating internal pressure to prevent tube wrinkling and bursting in the corner filling process of a box-shaped die. Orban and Hu 11 carried out a parametric study on the effect of the coefficient of friction on the thickness distribution along the cross-section of a hydroformed tube. Based on the results of their study, they made two conclusions: (1) the coefficient of friction does not affect the variation in the corner radius with internal pressure, and (2) the increase in the interface friction produces a greater thinning distribution in the corner. Similar conclusions were also made in studies by Hwang and Chen.6,7 Elyasi et al. 12 designed a new THF die to improve die corner filling for cylindrical stepped tubes. Compared with a conventional die, the new die-set produced a more uniform thickness distribution on the hydroformed part. Smith et al. 13 introduced closed-form formulas for the two-dimensional (2D) analysis of THF based on purely geometric analysis and assumed sticking friction conditions. Yang and Ngaile 14 presented a closed-form analytical model based on deformation theory for hydroforming tubular parts with polygonal cross-sectional shapes. This analytical model can be used to predict the corner-fill radii and their corresponding forming pressure, which can benefit hydroforming process designers substantially in the early stages for determining feasibility of THF before embarking into extensive FEA simulations.
The aforementioned studies on corner filling are based on deterministic approaches, in which the process parameters in the THF process are considered to be constant. However, uncertainty is involved in the process parameters in real hydroforming processes, such as material properties, tube sizes, friction conditions, and load paths. This uncertainty may cause fluctuations of the quality, distortion of geometries, reduction of the die life, as well as instability of the process. Thus, the uncertainty in the process parameters should be identified and controlled to reduce their negative impact on process reliability.
A product with satisfactory quality and performance is dependent on not only a successful design, but also a reliable manufacturing process. Some process reliability analyses have been performed in sheet metal forming processes, forging, and THF processes. Jansson et al. 15 investigated the accuracy of linear and quadratic response surface functions in a reliability assessment of sheet metal forming. Belur and Grandhi 16 analyzed the root causes of geometrical variations in the hot forging processes and found that certain combinations of the variations in the process parameters may result in defective parts. Repalle and Grandhi 17 identified various uncertainties in the forging process and evaluated their effects on the life of forging tool. Subsequently, they developed a robust design methodology in which a reliability-based optimization technique was incorporated to obtain sound forging parts. They also applied a robust design method to the preform shape design of an engine component to improve product quality and robustness. 18 Li et al. 19 developed a reliability model for the THF process that was based on the thinning ratio of the tube wall thickness. The Taguchi method was used to determine optimal forming parameters to minimize the variation in and the average value of the thinning ratio. Kim et al. 20 proposed a probabilistic model for the tube bulging process that was based on a stress forming limit diagram with confidence levels. The process reliability was calculated using the first-order reliability method and was verified by Monte Carlo simulations (MCSs). Li et al. 21 created a reliability model with a forming limit diagram to assess the failure probability of the THF process. Using this technique, failure was avoided in the free bulging test.
Robust THF processes require proper consideration of the effects of process uncertainties on process reliability. The research objectives are as follows: (1) to identify and analyze the process uncertainties in corner filling of the THF process, (2) to develop a reliability model of corner filling, and (3) to improve the process reliability of the THF process.
Tube expansion in a die with a square cross-sectional shape
In this study, the reliability analysis of corner filling is carried out by hydroforming a tubular part in a die with a square cross-sectional shape as shown in Figure 1(a) and (b). The dimensions of the cross-section shown in Figure 1(c) are 60 mm by 60 mm and the length of the forming zone is 60 mm (Figure 1(a)). The diameter, wall thickness, and length of the tube blank are 50 mm, 2.5 mm and 260 mm, respectively. The tube material is SS304, the material properties of which are listed in Table 1. The tube material fills the die corner under the combined loads of internal pressure and axial compression. The die corner filling rate reflects the formability of the material and can be used as a criterion to assess the reliability of the hydroforming process. Due to the difficulty in the direct measurement of the corner filling rate, the corner radius r (shown in Figure 1(c)) is used as the process response instead of corner fill ratio to evaluate the process reliability. The allowed maximum thinning ratio is set to 30% to prevent bursting failure.
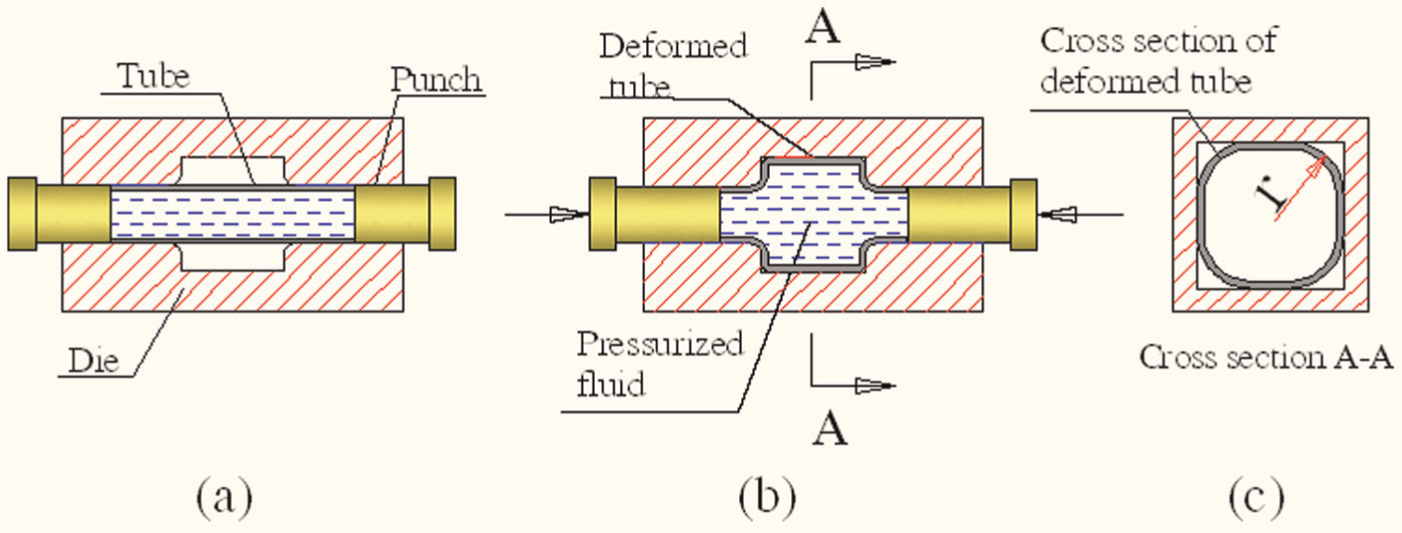
Corner filling test. (a) tube before pressurization; (b) tube after pressurization; (c) cross section of pressurized tube.
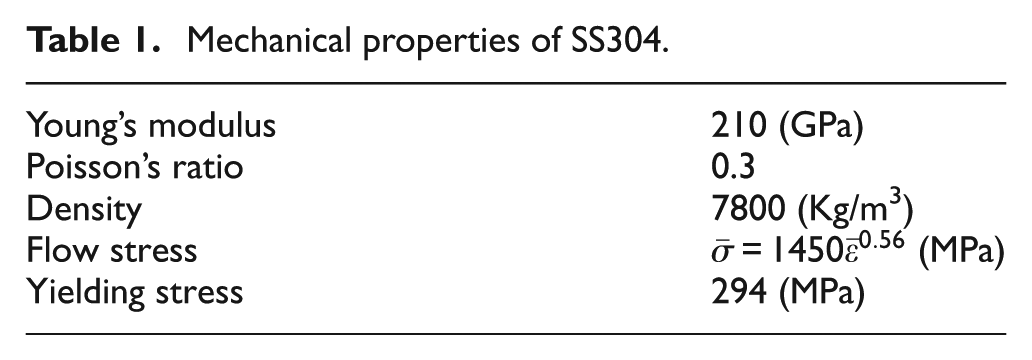
Mechanical properties of SS304.
Screen the critical variables
Depending on the nature of the uncertainties in the THF process, the uncertainty variables in THF can be classified into three categories: (1) uncertainties in the material properties (K, n), if the power law of flow stress is applied, (2) uncertainties in the process parameters, such as the coefficient of friction (µ), the forming speed, and the forming temperature, and (3) uncertainties associated with the shapes and sizes of the tube and dies. In this study, four uncertainty variables—the strain hardening exponent (n), the internal pressure (P), the axial feed (f), and the coefficient of friction (µ), which affect the corner filling radius—are identified as the probability variables. Variance analysis and the design-of-experiment (DOE) technique are used to quantitatively investigate the effects of the probability variables on the corner radius. In the variance analysis, the percentage contribution by each parameter to the total sum of the squared deviations of the process response is used to evaluate the importance of the change in parameters on the process response.
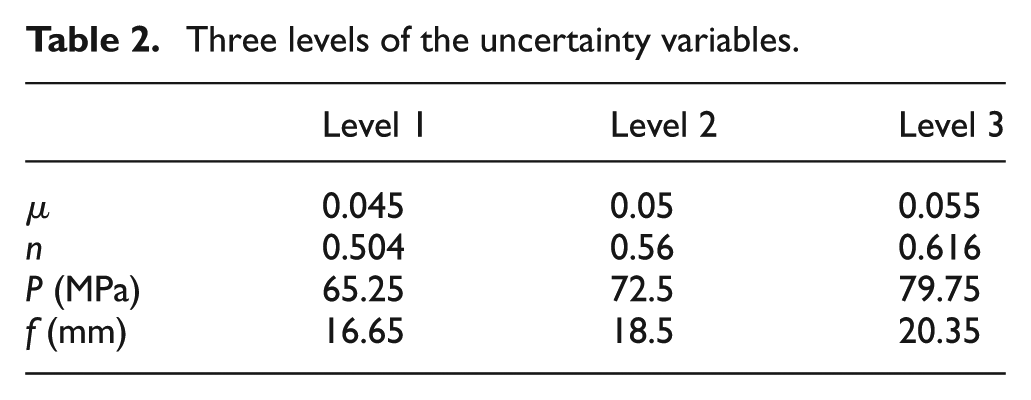
In the corner filling test, the tube material is stainless steel SS304, the material properties of which are shown in Table 1. The flow stress of SS304 is assumed to obey the power law, in which the strain hardening exponent n and the strength coefficient K are 0.56 and 1450 MPa, respectively. The friction condition at the tube–die interface is prescribed by Coulomb’s friction law and the coefficient of friction µ is assumed to be 0.05. The amount of axial feeding f is estimated through the following procedure: (1) calculate the ideal amount of axial feed with the assumption that the tube wall thickness is constant during hydroforming, and (2) the actual axial feed is approximately 60%–80% of the ideal axial feed for the consideration of the actual thinning of the tube wall. In this corner filling test, the ideal axial compression of the tube blank is estimated to be 49 mm; 75% of this value is used as the actual axial compression, which is approximately 37 mm. Therefore, an axial feed of 18.5 mm is employed in the corner filling test. The internal pressure simultaneously and linearly builds up to a maximum value of 72.5 MPa as the axial feed increases to its maximum. The identified uncertainty variables n, P, f, and µ are established with 10% fluctuation around their mean values in the variance analysis. A three-level orthogonal test is used to generate the simulation data as shown in Table 2. Figure 2 shows the simulation results of the corner filling test using FEA code Dyna-form. The values at level 3 (as shown in Table 2) of the process variables n, P, f, and µ are used in this simulation. The thinning distribution along the length of the deformed tube is shown in Figure 2(a), in which the maximum thinning rate is approximately 8%. The cross-section in the middle of the deformed tube is used to measure the corner radius r, as shown in Figure 2(b).
Three levels of the uncertainty variables.
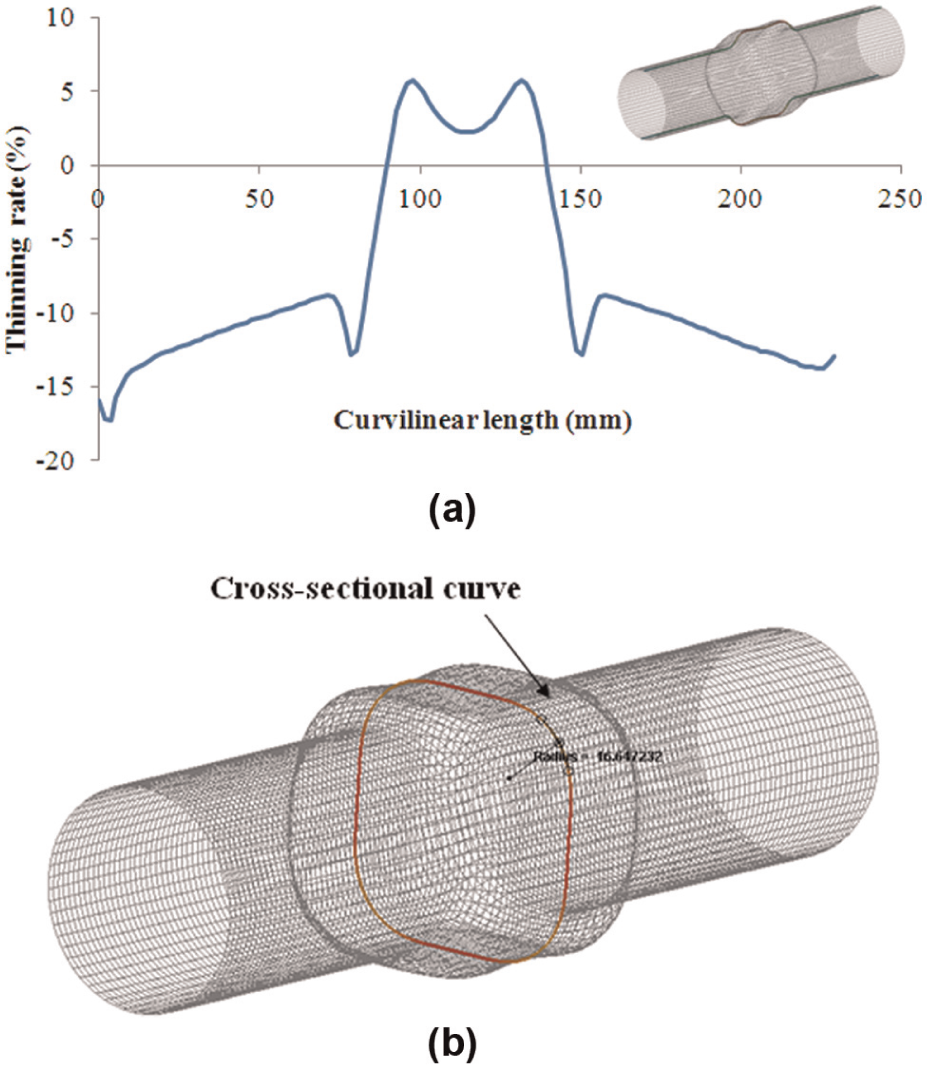
The FEA simulation of the corner filling test: (a) thinning distribution along the length of the deformed tube and (b) cross-section of the deformed tube.
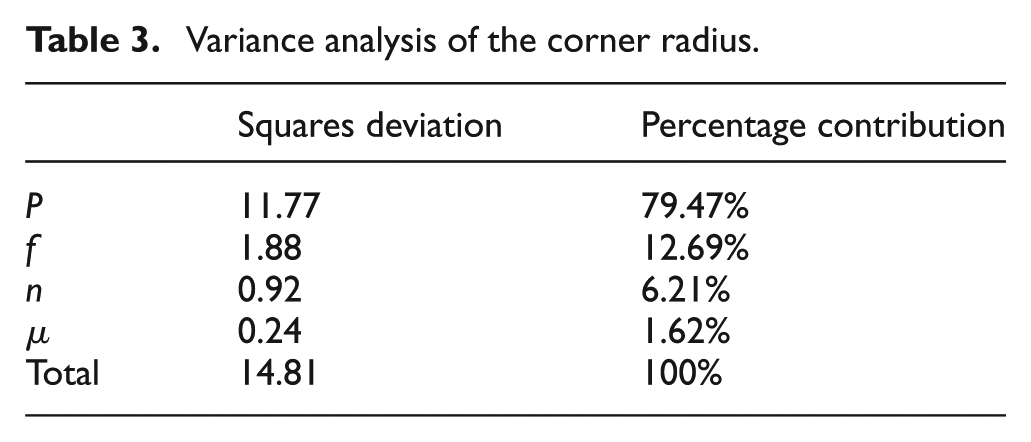
The results of the variance analysis are listed in Table 3. The internal pressure P and axial feed f contribute 79.47% and 12.69%, respectively, to the total variation in the corner radius r, which indicates that the internal pressure P and the axial feed f significantly contribute to the variation in corner radius. Thus, the internal pressure P and the axial feed f are considered to be design variables in the corner filling. The coefficient of friction, which contributes 1.62%, is a minor factor that affects the corner radius. This conclusion is similar to the conclusion obtained by Orban and Hu. 11 During hydroforming, the friction condition at the tool–tube interface may change due to variations in the tribological variables, such as contact pressure, sliding velocity, sliding distance, surface roughness of the surfaces in contact, and the type of lubricant used. Thus, the friction condition is uncontrollable during the hydroforming process. In addition to the friction condition, the strain hardening exponent n of the tube material is also difficult to control. Therefore, both the strain hardening exponent n and the coefficient of friction µ are considered to be the noise factors.
Variance analysis of the corner radius.
Response surface model of the corner radius
Generally, the explicit relationship between the process inputs and the process response is either unavailable or expensive to compute in complicated plastic deformation problems. The effects of the process inputs on the process response are evaluated through FEA simulations, which are time consuming. To prevent the repetitive FEA simulations and to save the simulation time in the process reliability assessments, the relationship between the process inputs and the process response is approximated using surrogate models, such as polynomial response surface models, neural networks, and kriging models. In this study, the process response (corner radius r shown in Figure 1(c)) is represented by the following quadratic surface response function
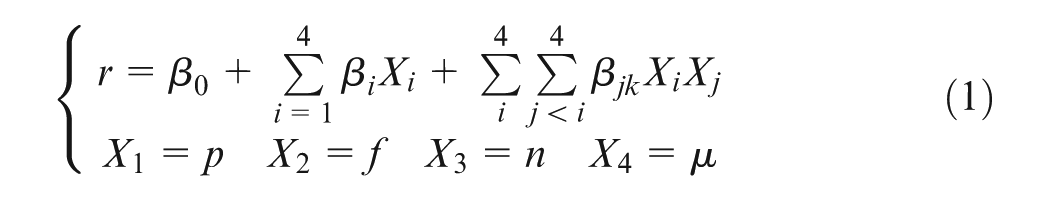
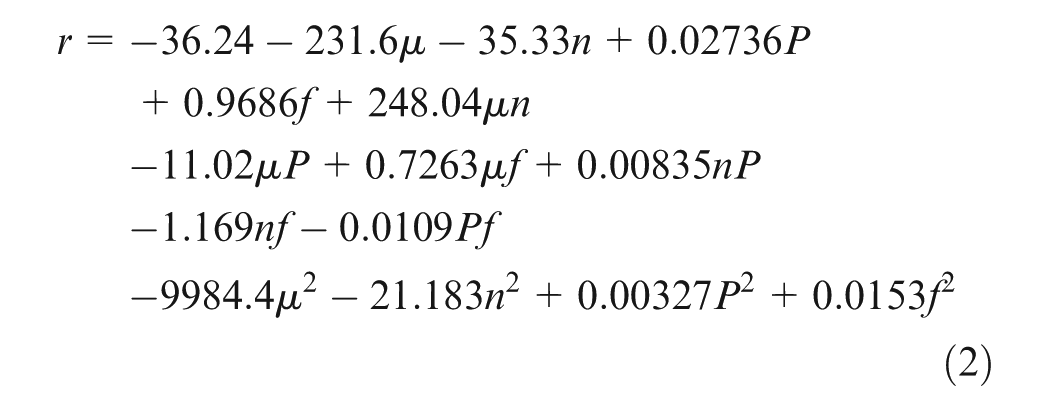
where βi and βjk are the regression coefficients for the linear terms and the quadratic terms, respectively. They are evaluated using the least-squares method, which minimizes the sum of the squares of the differences between the predicted responses and the experimental responses at the design points. The design points are distributed in the region of interests based on the central composite method. The design variables P and f vary in the ranges of 70–90 MPa and 16–20 mm, respectively. In actual experiments, such as the tensile test or the free bulging test for measuring the flow stress, and the ring compression test for measuring the coefficient of friction for the lubricant used in the metal forming process, measurements with a relative error below 5% are considered to be good and effective. Therefore, the noise factors—strain hardening exponent n and the coefficient of friction µ—are assumed to vary 5% around their mean values of 0.56 and 0.05, respectively, in this study. In this response surface model, the effects of the noise factors n and µ on process reliability are also analyzed, and the process reliability is optimized by considering the effects of the noise factors. The surface response model is fitted with a total of 29 design points, which are oversampled to increase the modeling accuracy. The process responses (corner radius r) for the 29 design points are measured on the deformed tubes in the FEA simulations. The fitted function is given as equation (2). Figure 3 shows the comparison between the measured corner radius and the predicted corner radius using equation (2) for the 29 design points. The coordinates of the data points in this plot consist of the measured corner radius and the predicted corner radius. The distance from the data point to the 45° line represents the prediction error. A short distance signifies a small prediction error. The maximum absolute prediction error is 0.48 mm, which is approximately 2.5% of the measured value. It indicates that fitted equation (2) is a suitable model for navigating the interested design space.
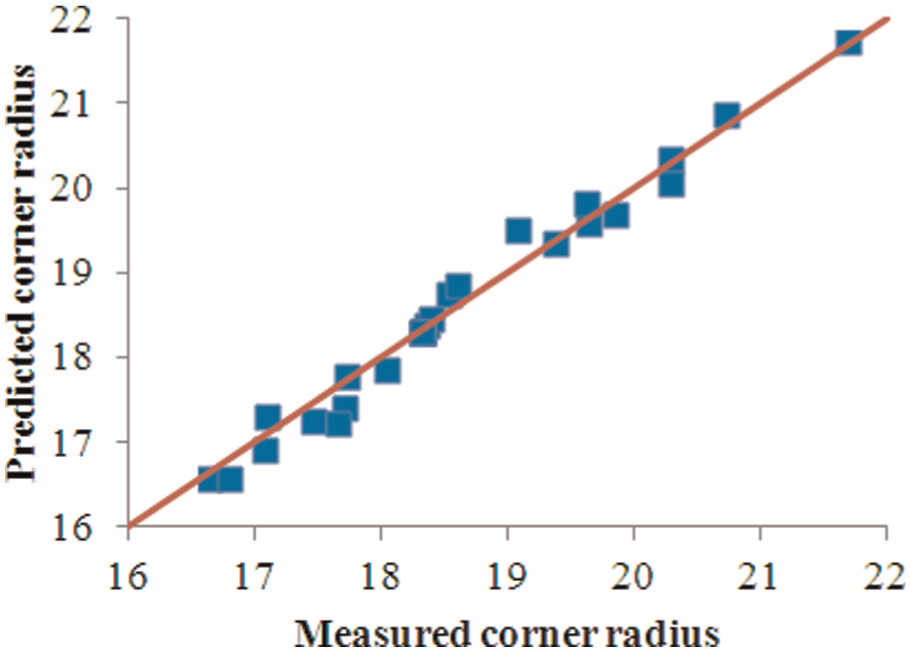
Measured corner radius versus predicted corner radius.
Reliability model of corner filling
The process uncertainties in the corner filling test are expressed in the form of the variability distribution of random process variables. The random variables follow a certain distribution such as normal, uniform, and Weibull distributions. In a normal distribution, which is the most extensively employed distribution, the center and the variance are measured by the mean value and the standard deviation, respectively. In this study, two assumptions are employed: (1) design variables P and f follow normal distributions with standard deviations being 1% of the mean values (Table 4), and (2) the noise factors n and µ also exhibit normal distributions, in which the mean values of n and µ are 0.56 and 0.05, respectively, and the standard deviations are 5% of the mean values (Table 4). The probability distribution function (PDF) of the corner radius r at the specified design point (P, f) can be evaluated by implementing the MCSs and incorporating the random variables P, f, n, and µ into the response surface model. MCSs randomly generate values of the random variables P, f, n, and µ within their limits and with a frequency that adheres to their distributions. The corner radius r is subsequently computed by substituting the values of random variables P, f, n, and µ into the surface response equation (2). After PDF of r is obtained, the cumulative density function (CDF) of r can be calculated by integrating the area under the distribution curve.
Mean value and standard deviation of the design variables and noise factors.
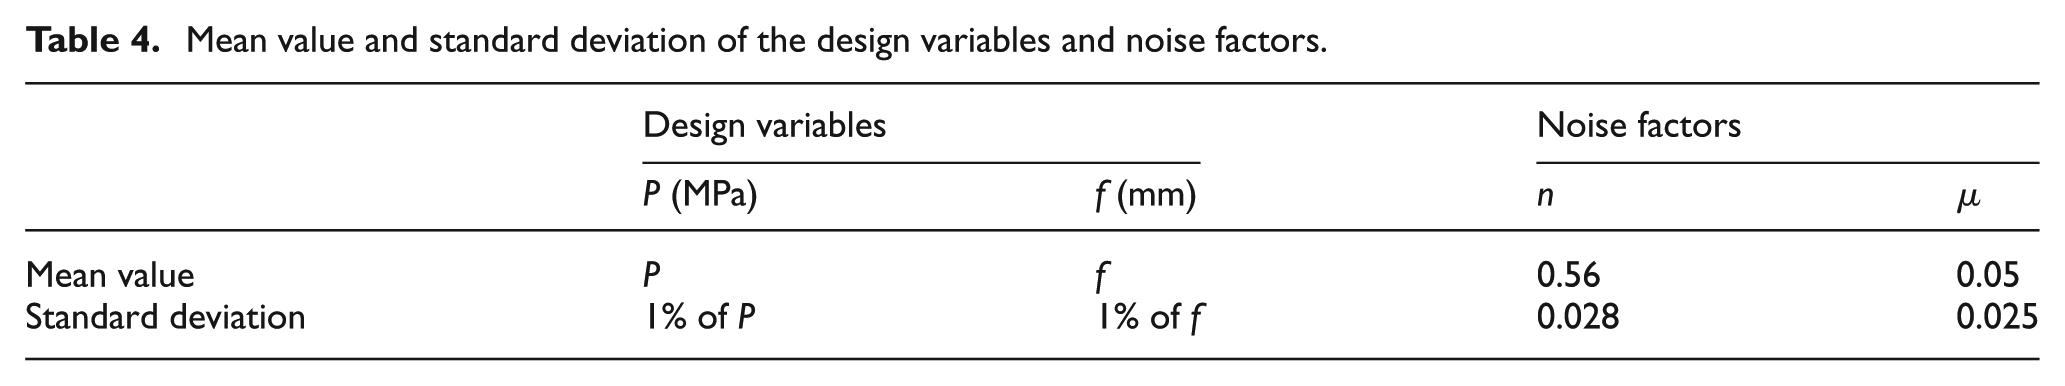
Figure 4 shows the histogram of the PDF of the corner radius r at the design point (P = 80 MPa, f = 20 mm). The mean value and the standard deviation of the corner radius for this design point are 18.27 and 0.66 mm, respectively. The black hidden line in Figure 4 represents a normal probability distribution, in which the mean value and the standard deviation are equal to those of the corner radius r for the design point (P = 80 MPa, f = 20 mm). The histogram of the probability density distribution of the corner radius matches the normal distribution curve. The Shapiro–Wilk test is used to check the normality of the distribution of the corner radius r. The sample size and the statistical significance level are set to 2000 and 0.05, respectively, in the Shapiro–Wilk test. The p-value computed in this test is approximately 0.64, which concludes that the distribution of the corner radius r for the design point (P = 80 MPa, f = 20 mm) is normal.
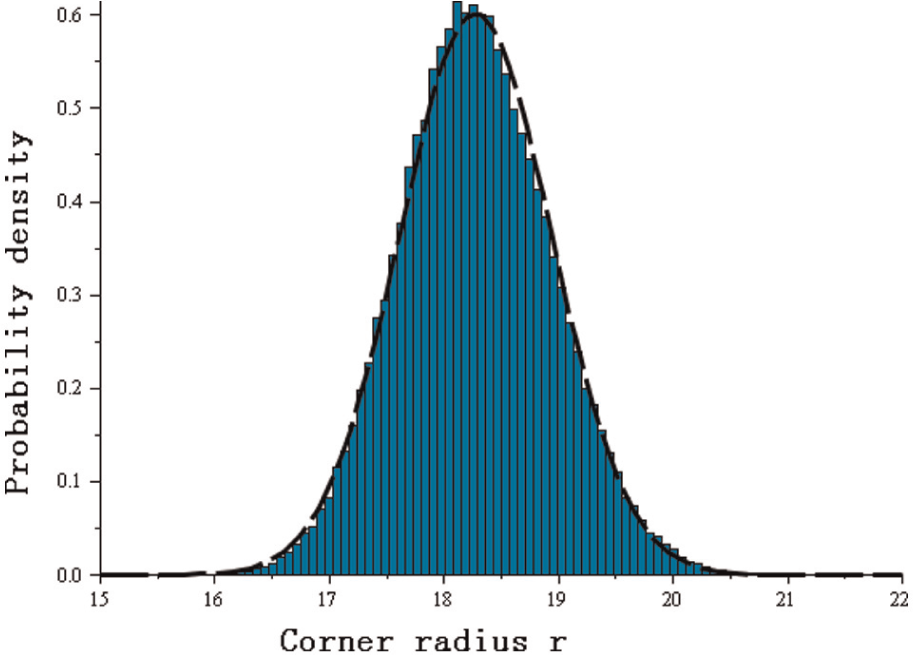
PDF of the corner radius for the design point (P = 80 MPa, f = 20 mm).
As shown in Figure 4, the corner radius r at the specified design point is distributed around its mean value. The permissible corner radius r for a hydroformed part can be expressed in terms of the tolerance interval, such as (r0−Δr, r0+Δr), in the corner filling test. Thus, the limit state function of the process reliability model can be formulated as follows
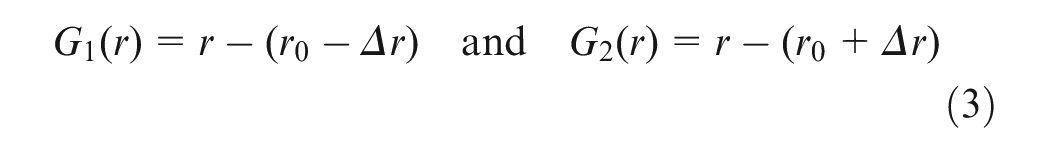
The limit state function G1 = 0 or G2 = 0 is the boundary between process failure and safety. Failure occurs when the corner radius r does not fall within the specified interval (r0−Δr, r0+Δr) or when the condition (G1 < 0 or G2 > 0) is satisfied. Therefore, the probability of process failure Pf and process safety Ps can be expressed as equations (4) and (5), respectively. The sum of the probabilities of process failure Pf and process safety Ps is 1. Computation of the safety probability Ps can be performed by integrating the area under the probability density curve in the permissible interval (r0−Δr, r0+Δr). For example, if the permissible corner radius interval is (17 mm, 19 mm), the probability of process safety Ps for the design point (80 MPa, 20 mm) is 83.8%, which is calculated by integrating the area under the probability density curve shown in Figure 4 for the permissible interval (17 mm, 19 mm). The probability of process failure Pf for the design point (80 MPa, 20 mm) is 16.2%, which is obtained by substituting Ps into equation (6)


If the given corner radius interval (17 mm, 19 mm) is fixed and the design point continuously changes within the design space, the corner radius distribution for each design point covers the given interval (17 mm, 19 mm) with a different probability of process safety. Figure 5 plots the probability of process safety for each design point in the design space (70 MPa ≤P≤ 90 MPa, 16 mm ≤f≤ 20 mm) with the given corner radius interval (17 mm, 19 mm). This plot demonstrates the maximum probability of the given corner radius interval. Thus, the process reliability of the corner filling test can be optimized in terms of the permissible corner radius interval. The optimization problem for the process reliability can be expressed as follows
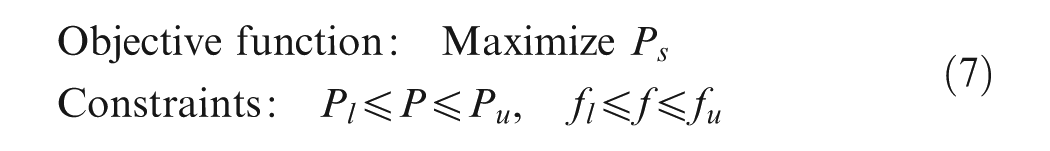
where Pl, Pu, and fl, fu are the limits of the design space.
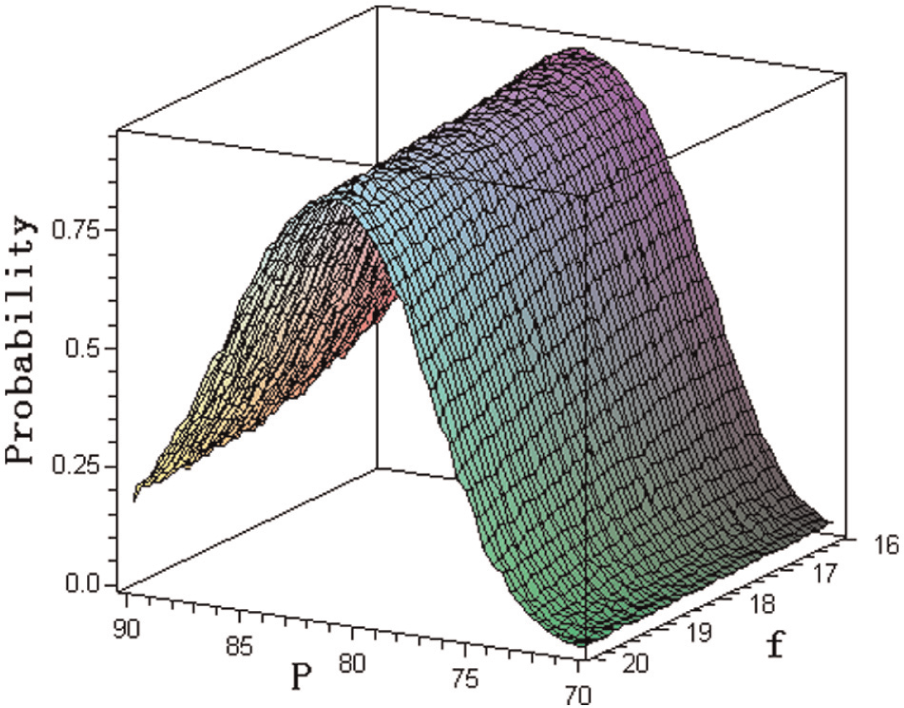
Process safety probability of the corner radius interval (17 mm, 19 mm).
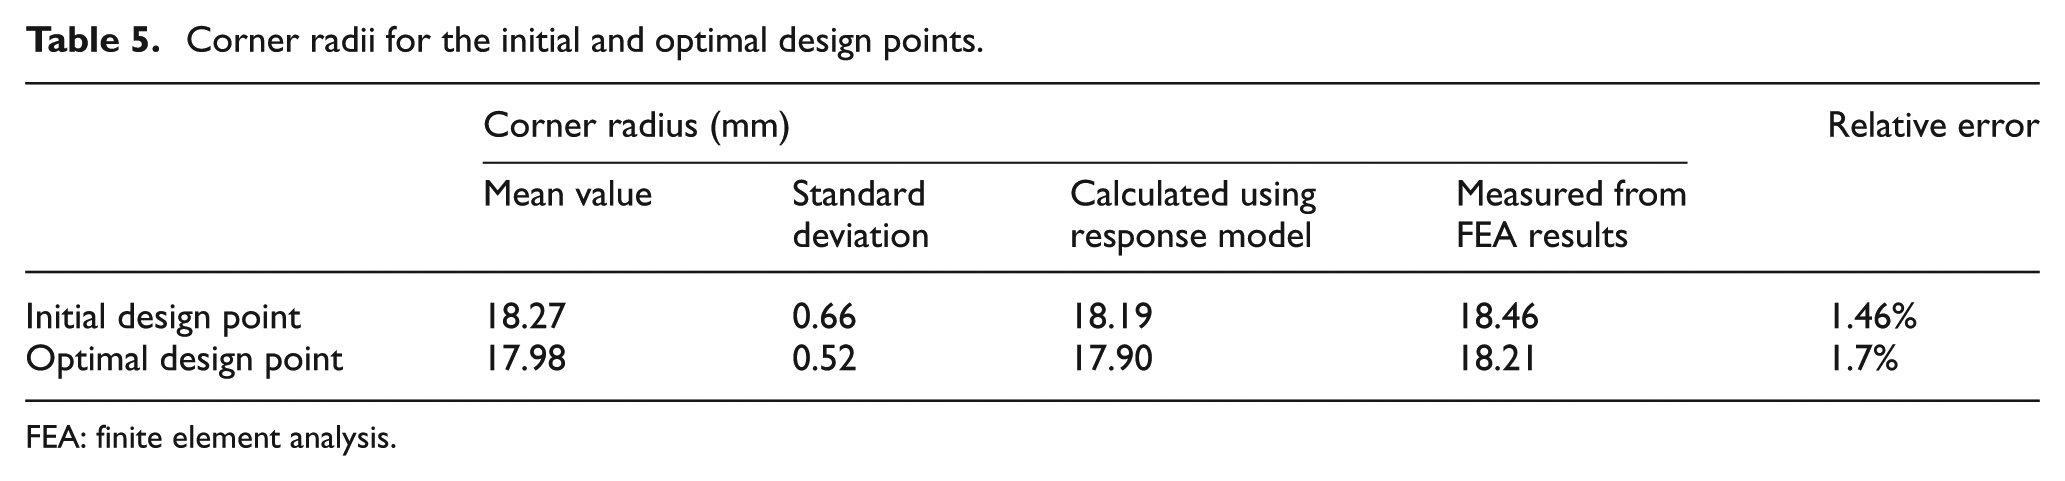
The optimal design point in the design space (70 MPa ≤P≤ 90 MPa, 16 mm ≤f≤ 20 mm) is found to be (81.2 MPa, 16 mm), with a process safety probability of 94.5%. The distribution of the corner radius for the optimal design point has a mean value of 17.98 mm, which is closer to the median of the given interval (17 mm, 19 mm) than the mean value of the corner radius distribution for the initial design point, and a standard deviation of 0.52 mm, which is smaller than the standard deviation of the corner radius distribution for the initial design point. Figure 6 shows the probability density curves for the corner radius for the initial design point (80 MPa, 20 mm) and the optimal point (81.2 MPa, 16 mm). Figure 6 shows that the probability density curve for the optimal point has more parts within the given interval (17 mm, 19 mm) compared with the probability density curve for the initial point. Due to the consideration of the influence of the noise factors n and µ, the optimal process safety probability is not 100%. The increase in the probability of optimal process safety requires an expansion of the permissible corner radius interval, which results in a loose size tolerance in the actual hydroforming process. The plastic strain distributions on the deformed tubes in the FEA simulations of the corner filling tests for the initial design point and the optimal design point are shown in Figures 7 and 8, respectively. The corner radii from the FEA simulation results and calculated using response surface models for the initial design point and the optimal design point are listed in Table 5. The prediction errors for these two points are 1.46% and 1.7%, respectively, which indicates a satisfactory performance of the response surface model.
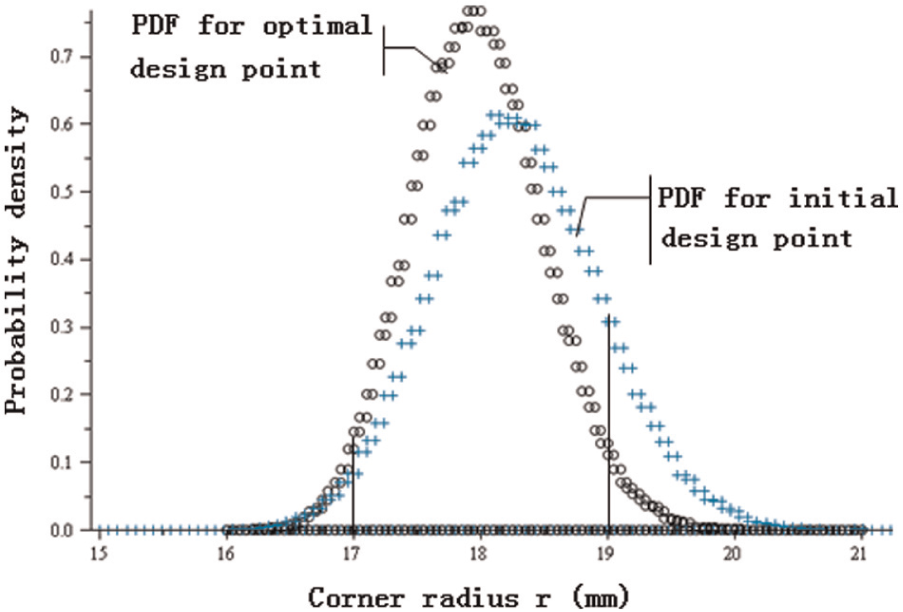
PDF for the optimal design point and the initial design point.
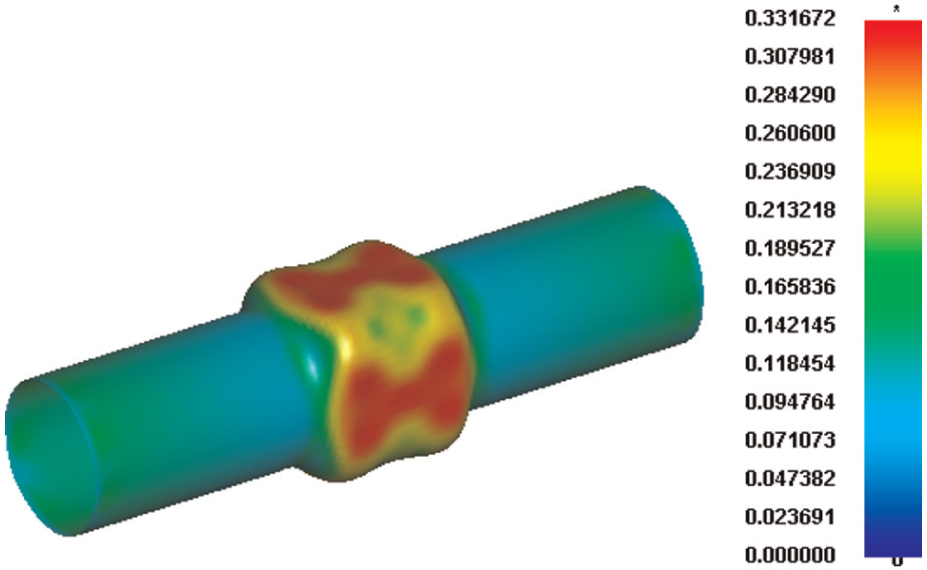
Plastic strain distribution on the deformed tube for the initial design point.
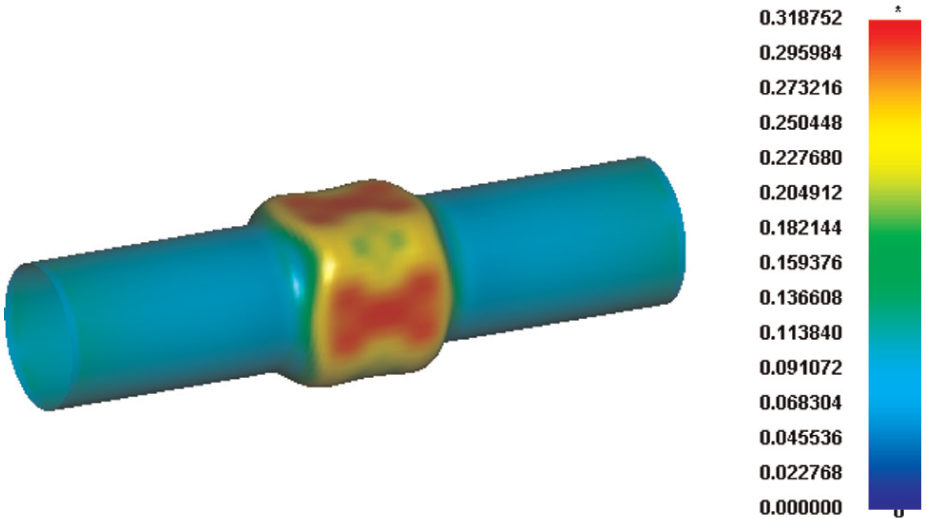
Plastic strain distribution on the deformed tube for the optimal design point.
Corner radii for the initial and optimal design points.
FEA: finite element analysis.
Discussion
In the THF process, many process outputs are required to be controlled in reasonable and desired ranges, such as the sizes of the hydroformed parts, the variation in the tube thickness, forming load, stress, and strain. However, due to uncertainties in the process parameters in the real hydroforming process, the process outputs do not always fall within the desired range. Based on the method used in this study, the optimal design parameters maximize the probability for limiting the process response to a desired range, which yields better quality control of the hydroformed part or better process reliability control in the real THF process.
Conclusion
In this study, process variables such as the strain hardening exponent (n), the internal pressure (P), the axial feed (f), and the coefficient of friction (µ), which affect the corner radius, are identified as uncertainty variables in the corner filling test. Using the variance analysis, the internal pressure (P) and the axial feeding (f) are considered to be the significant design variables, whereas the strain hardening exponent (n) and the coefficient of friction (µ) are considered to be the noise factors.
To prevent repetitive FEA simulations in the process reliability assessments, the process response (corner radius r) is represented by a quadratic surface response function with the design variables P and f and the noise factors n and µ as input parameters. Assuming that these input parameters follow the normal distributions, the probability distribution of the corner radius r is evaluated by implementing the MCSs and a response surface model. A reliability model in terms of a permissible corner radius interval is developed to assess the probability of process failure in the corner filling test. Using the optimization based on this reliability model, the optimal design point in the design space (70 MPa ≤P≤ 90 MPa, 16 mm ≤f≤ 20 mm) is found to be (81.2 MPa, 16 mm), with a process safety probability of 94.5%, which is significantly higher than the process safety probability of 83.8% for the initial design point (80 MPa, 20 mm).
Footnotes
Appendix 1
Declaration of conflicting interests
The authors declare that there is no conflict of interest.
Funding
This work was supported by the Foundation Research Project (Natural Science Foundation) of Jiangsu Province (Grant No. BK2012805) and the Research Fund for the Doctoral Program of Higher Education of China (Grant No. 20123219120006).