
Abstract
In this research work, an experimental investigation has been carried out on underwater laser microchanneling on polymethyl methacrylate, using a pulsed Nd:YAG laser system. The underwater laser processing has been used to minimize the heat-affected zone, microcracking and burr formation around the microchannel. The process parameters that have been taken into consideration are lamp current, pulse frequency, pulse width and cutting speed. The microchannel characteristics that have been taken into account as responses are microchannel width, microchannel depth, burr width and burr height. Response surface methodology has been used to develop the mathematical relationships between the process parameters and microchannel characteristics. The adequacies of the models have been tested using analysis of variance. The interaction effects of process parameters on the microchannel characteristics have been analyzed and discussed. In addition to that, single-objective and multiobjective optimization of the process parameters have been performed to obtain desired values of microchannel characteristics.
Introduction
Microchannels are used in miniature microfluidic devices that are basically used for biological analytical techniques like electrophoresis, chromatography, blood protein analysis, DNA studies, micro total analysis systems, telecommunications, binary storage devices, microvia inkjet printer nozzles and so on. They reduce sample consumption, cost and time to result and also result in better performance and portability. Laser microchanneling is essentially based on removal of the material due to high-power laser pulses interacting constantly with the solid surface. These laser beams have very high energy, which after striking the surface causes the decomposition of material bonds. The surface temperature of solid also rises rapidly in this process, which causes the material to melt. Hence, the basic method of removal consists of melting and vaporization and decomposition of material bonds. Earlier, these microfluidic devices have been mainly created on glass and silicon substrates using standard etching and photolithographic techniques. Hot embossing and micromilling have also been used for creating microchannels with low aspect ratios. But in recent years, some polymeric materials have been used by different researchers due to some favorable properties. Creating microchannels on glass substrates are time-consuming, and clean room facilities are required. Therefore, the microfeatures created on these substrates are quite expensive and cannot be used for disposable devices. Characteristics such as good optical properties, efficiency in dissipating heat, high mechanical stress resistance and well defined surface characteristics make them manufacturer’s first choice. However, polymethyl methacrylate (PMMA) has been found as a good alternative in a recent research at Technical University of Denmark. 1 It possesses high absorbance in the infrared zone with a low heat capacity and low heat conductance, which means that any absorbed heat results in rapidly rising temperature instead of creating thermal cracks. But because of its high thermal energy content, the basic problem of heat-affected zone (HAZ), high rate of burr formation and removal of decomposed material pose some restriction over the use of laser processing as a micromachining tool. Underwater processing during laser microchanneling reduces the HAZ, burr formation and microcracks and produces cleaner structure than in open air processing. Figure 1 shows the difference between an open air microchanneling and underwater microchanneling processes. From this figure, it is clear that underwater processing not only minimizes the HAZ but also produces clean microchannel. The HAZ in open air cutting conditions is very wide, and the edges of the microchannel are neither sharp nor straight as compared to underwater cutting conditions. In this research work, PMMA has been used as a substrate material due to advantages like low cost, nonreacting nature and nonporosity of the material. It further decomposes into products like monomers, CO2 and other gases that are mostly volatile in nature, which helps to generate clean structures unlike other polymers that, after burning, produce large amount of soots, which are difficult to remove.
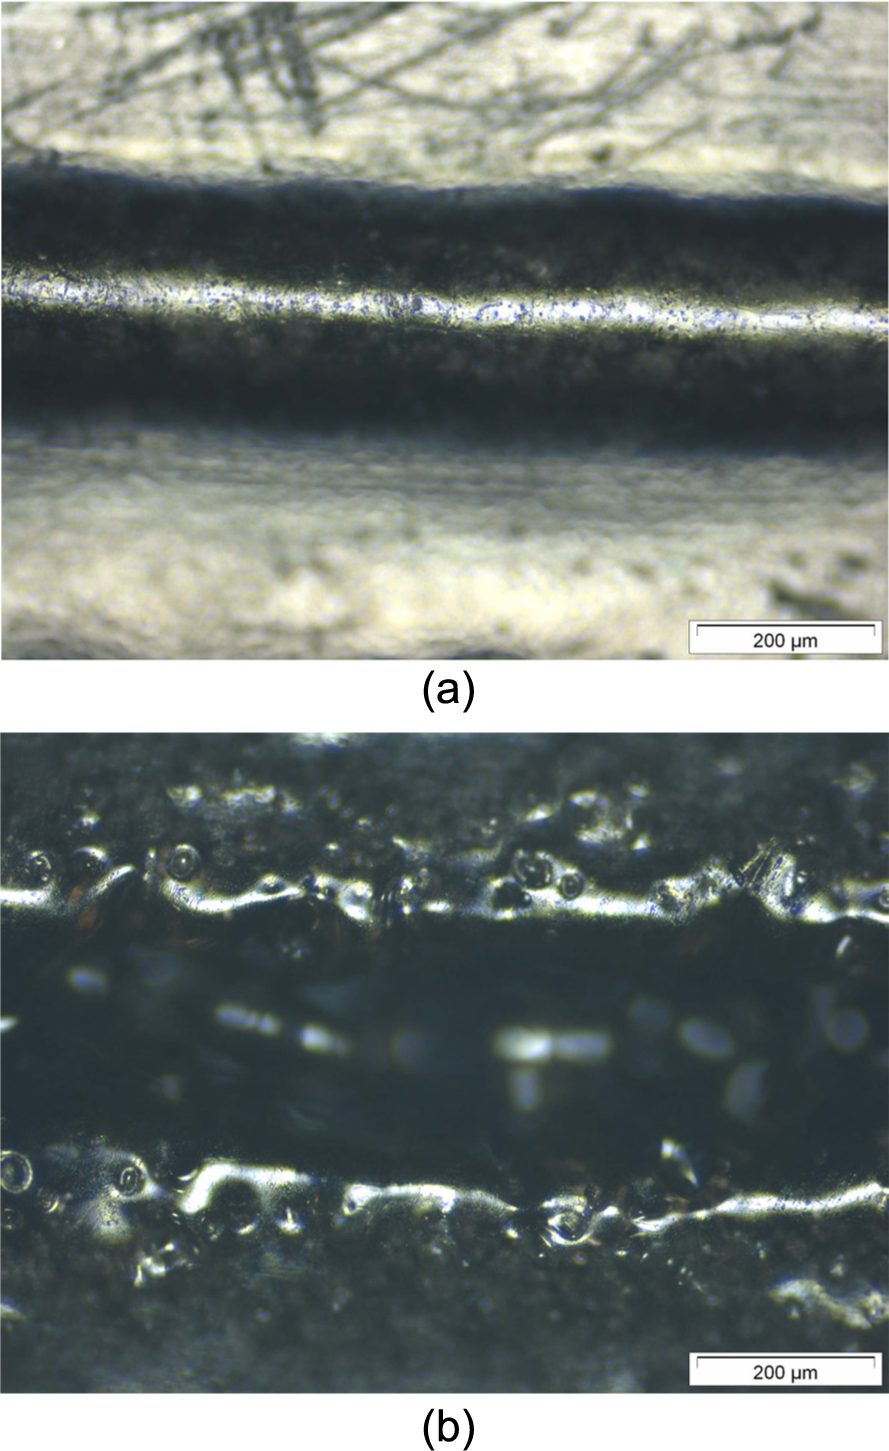
Microscopic view of microchannels created in (a) underwater processing and (b) open air processing.
Brief review of literature
Liquid-assisted laser processing has already been studied by various authors in different context. Lim et al. 2 used high-brightness diode-pumped Nd:YAG laser with slab geometry for fabricating multiple-level microfluidic channels on silicon wafers. The channels with flat walls and staggered herringbone ridges on the floor have been successfully fabricated. Choo et al. 3 studied the micromachining of silicon using a short-pulse excimer laser. In his experiment, he conducted drilling test on a silicon workpiece both in air and in underwater. Heng and Tao 4 fabricated microfluidic channel on a PMMA sheet of 1.5 mm thickness by using a 248-nm excimer laser direct-writing technique. Tiaw et al. 5 used third harmonic diode-pumped solid-state (DPSS) Nd:YAG laser to achieve high-quality precision cuts of thin polymer films through microdrilling and microcutting as well as surface patterning of microchannels through direct beam scanning. Chen and Darling 6 investigated both the near-ultraviolet (UV) laser and the mid-UV laser micromachining systematically. The materials used in their research were sapphire, silicon and Pyrex glasses that are commonly used in microfluidic applications. Elaboudi et al. 7 studied the photoablation kinetics of polyethylene terephthalate (PET), polycarbonate (PC), polyimide (PI) and polystyrene (PS) in both air and water. Issa et al. 8 studied and fabricated microchannels on the surface of soda lime glass sheets by using 1.5 kW CO2 laser with 10.6 µm wavelength. Karazi et al. 9 developed four models for the prediction of width and depth dimensions of CO2 laser–formed microchannels in glass. Choudhury and Shirley 10 have done experimental investigation on cutting of polymeric materials. From the analysis, it has been observed that PMMA has less HAZ, followed by PC and polypropylene (PP). For surface roughness, PMMA has better cut edge surface quality than PP and PC. Biswas et al. 11 studied the Nd:YAG laser microdrilling of gamma titanium aluminide. Karazi and Brabazon 12 utilized response surface methodology (RSM) as the prediction tool for the laser micromachining process. Wee et al. 13 conducted laser ablation micromachining tests on silicon wafer, both in air and under flowing water stream, with the use of 355-nm X-AVIA lasers. Pallav and Ehmann 14 proposed a laser-based technique in a dielectric to create plasma near the workpiece surface whose explosive expansion results in material removal by mechanisms similar to those that occur in microelectric discharge machining (µ-EDM). Mathur et al. 15 fabricated the microfluidic channels on PMMA using hot embossing process. Xu et al. 16 used a hydrophobic porous membrane on top of the microchannel to remove the problem of gas bubbles from liquid-filled microchannels. However, no detailed description of effect of individual process parameters on microchannel characteristics in underwater condition is available in the literatures. In this present research work, microchanneling process by underwater Nd:YAG laser processing has been investigated with an aim to determine the effects of various process parameters on microchannel characteristics created on PMMA.
Methodology for experiment
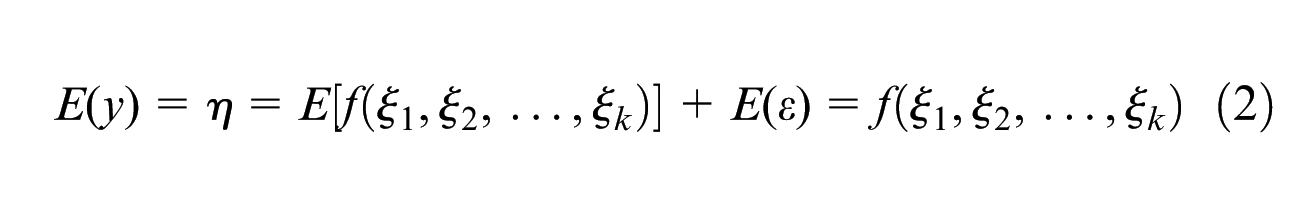
A series of experiments have been carried out according to central composite design based on RSM using MINITAB™ software. RSM is a set of mathematical and statistical techniques that are useful for modeling and predicting the response of interest affected by a number of input variables with the aim of optimizing this response. 17 RSM also specifies the relationships among one or more measured responses and the essential controllable input factors. When all independent variables (ξ1, ξ2, …, ξk) are measurable, controllable and continuous in the experiments, with negligible error, the response surface y can be expressed by

where the form of the true response function f is unknown and perhaps very complicated and ε is a term that represents other sources of variability not accounted for in f. Usually, ε includes effects such as measurement error of the response, background noise, the effect of other variables and so on. Usually, ε is treated as a statistical error, often assuming it to have a normal distribution with mean zero and variance σ2. Then, the expected response
Usually, a second-order polynomial equation (3) is used in RSM
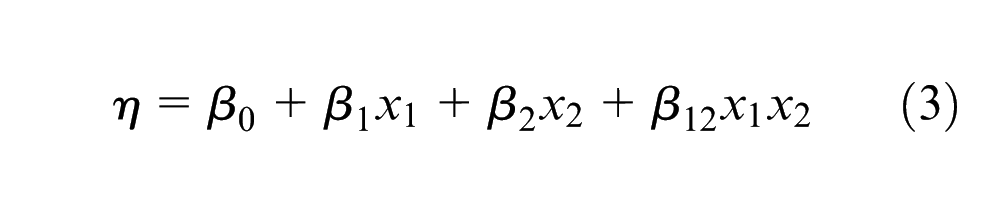
where parameters β1, β2, and so on are called the regression coefficients. 18
Experimental details
Nd:YAG laser system
A pulsed Nd:YAG laser has been used in this present research made by M/s Sahajanand Laser Technology, India (Figure 2). This computer numerical control (CNC) laser machining system consists of various subsystems like laser source and beam delivery unit, power supply unit, radio frequency (RF) Q-switch driver unit, cooling unit, compressed air supply unit and a CNC controller for X, Y and Z axis movement. The output from the Q-switched Nd:YAG laser is directed to the workpiece using a beam delivery system that first bends the laser beam at 90° and then focuses it on the work spot through the focusing lens. The main power supply unit controls the laser output by controlling the intensity of light emitted by a krypton arc lamp. The cooling unit consisting of a three-phase chiller unit and a pump cools the system by circulating the chilled water to avoid thermal damage of laser cavity, lamp, Nd:YAG rod and Q-switch. This nanosecond laser system has the one cycle time of 120 ns. The standoff distance has been kept constant in this experiment. The beam spot diameter was found to be approximately 5 µm. The output lens has an M2 value of 1.15.
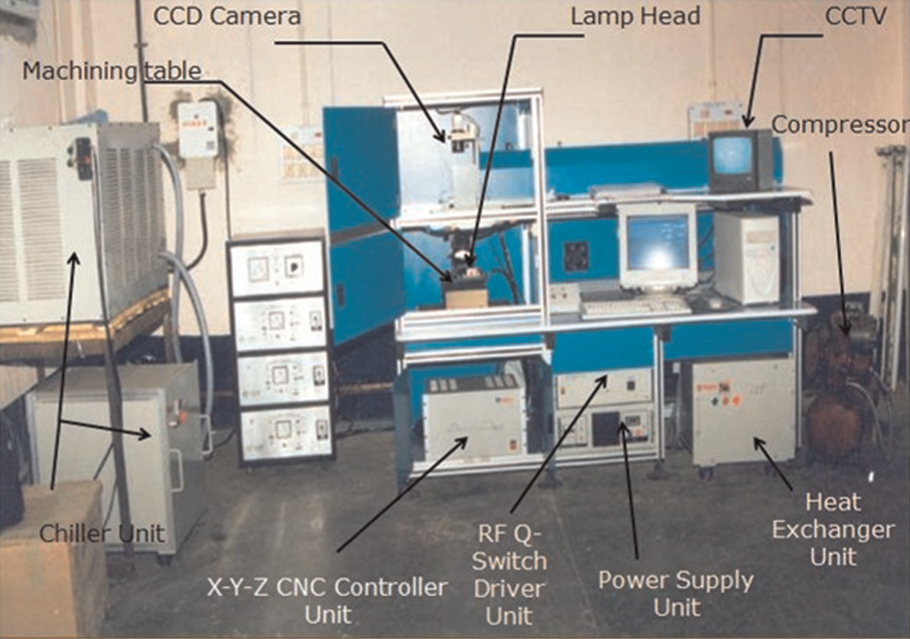
Photographic view of Nd:YAG laser system used in the present research.
Development of fixture
In this research, underwater machining has been performed on a PMMA workpiece using Nd:YAG laser machine. A fixture has been designed to accommodate various sizes of workpiece in underwater conditions. Figure 3 shows the photographic view of the developed fixture for the present research. The fixture is made of acrylic polymer and has been manufactured according to the space available in the setup. Mineral water (Bisleri) at room temperature (24 °C–25 °C) has been used as the water medium because of easy availability and its nonreactive nature to workpiece material even at higher temperatures. The chemical composition of mineral water is given as follows: 80–120 ppm total dissolved solids (TDS), 6.5–7.5 pH factor, 75 ppm calcium, 200 ppm chlorides, 30 ppm magnesium, 45 ppm nitrate and 200 ppm sulfates. For each experiment, fresh water has been used. The jammer on the fixture is used for jamming the workpiece on the fixture to prevent its movement due to water flow or pressure. The scale has been attached to measure the water level inside the fixture.
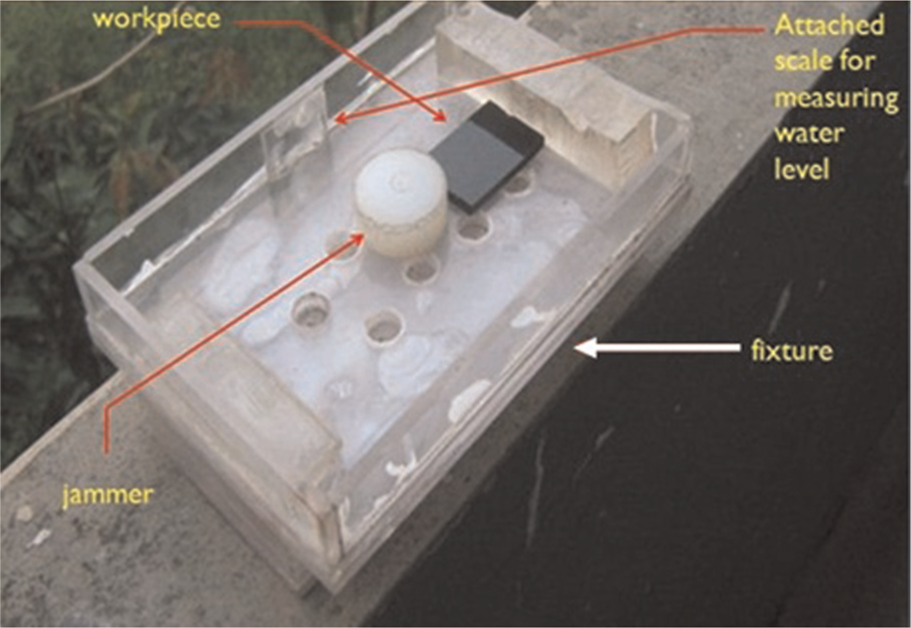
Photographic view of the developed fixture for the present research.
Microchanneling process parameters and responses
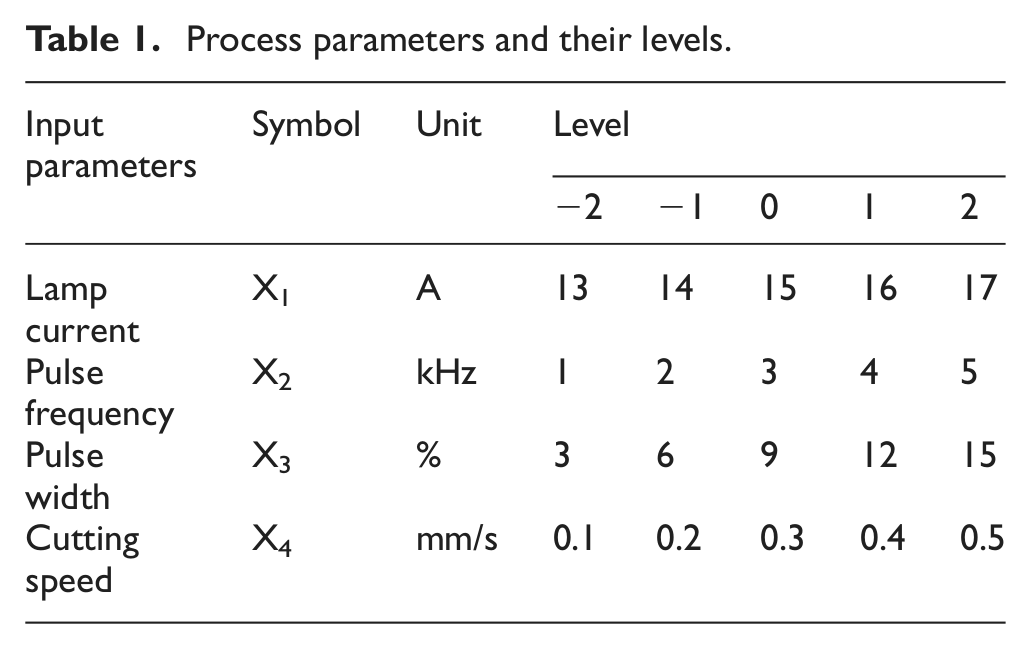
Though there are various devices that utilize microchannels of different dimensional sizes, most of them have widths and depths varying between 100 and 250 µm and 100 and 300 µm, respectively. A lot of pilot experiments have been carried out for getting the desired dimensions of microchannel width and depth. After surveying various literatures available and doing some pilot experiments, it has been found that the following four process parameters affect the laser microchanneling process significantly and have been taken as input factors for the present research: (a) lamp current, (b) pulse frequency, (c) pulse width and (d) cutting speed. Lamp current in amperage directly relates to total laser fluence or energy consumed by laser to emit desired pulses. However, total laser output energy also depends upon pulse width and pulse repetition frequency. Pulse frequency or pulse repetition frequency is the number of pulses emitted by laser per unit time. Pulse width denotes the percentage of “ON” time duration per cycle time. The one cycle time of this setup is 120 ns. Cutting speed represents the speed of movement of laser head with respect to the workpiece or vice versa. Five levels of each factor have been identified based on the pilot experiments in order to find the desired depth and width of microchannels. Table 1 shows the values of different input process parameters at different levels. A microchannel is generally specified by its aspect ratio, that is, its width and depth. But if a comparison has to be made among manufacturing processes utilized for creating the channel, the cleanliness of the process and product also have significant effect. So considering both aspects of process and product, the following characteristics have been decided to be measured for the evaluation: (a) microchannel width, (b) microchannel depth, (c) burr height and (d) burr width. All the above characteristics have been measured by using Olympus-STM-6, 3-dimensional optical measuring microscope. For reducing the errors during measurement, every response has been measured at three different locations across the channel, and their statistical average has been used for response surface analysis and modeling. Water level played an interesting role during this experiment. Increase in water level results in microchannels having lesser depth and large burrs around the microchannels. At the same time, decrease in water level resulted in high HAZ. It should be emphasized that most appropriate water level depends upon the size of the workpiece, laser power/energy and the kind of laser interaction with water. After conducting various pilot experiments with different water levels, best results have been found when keeping the water level just 1 mm above the workpiece for this experiment.
Process parameters and their levels.
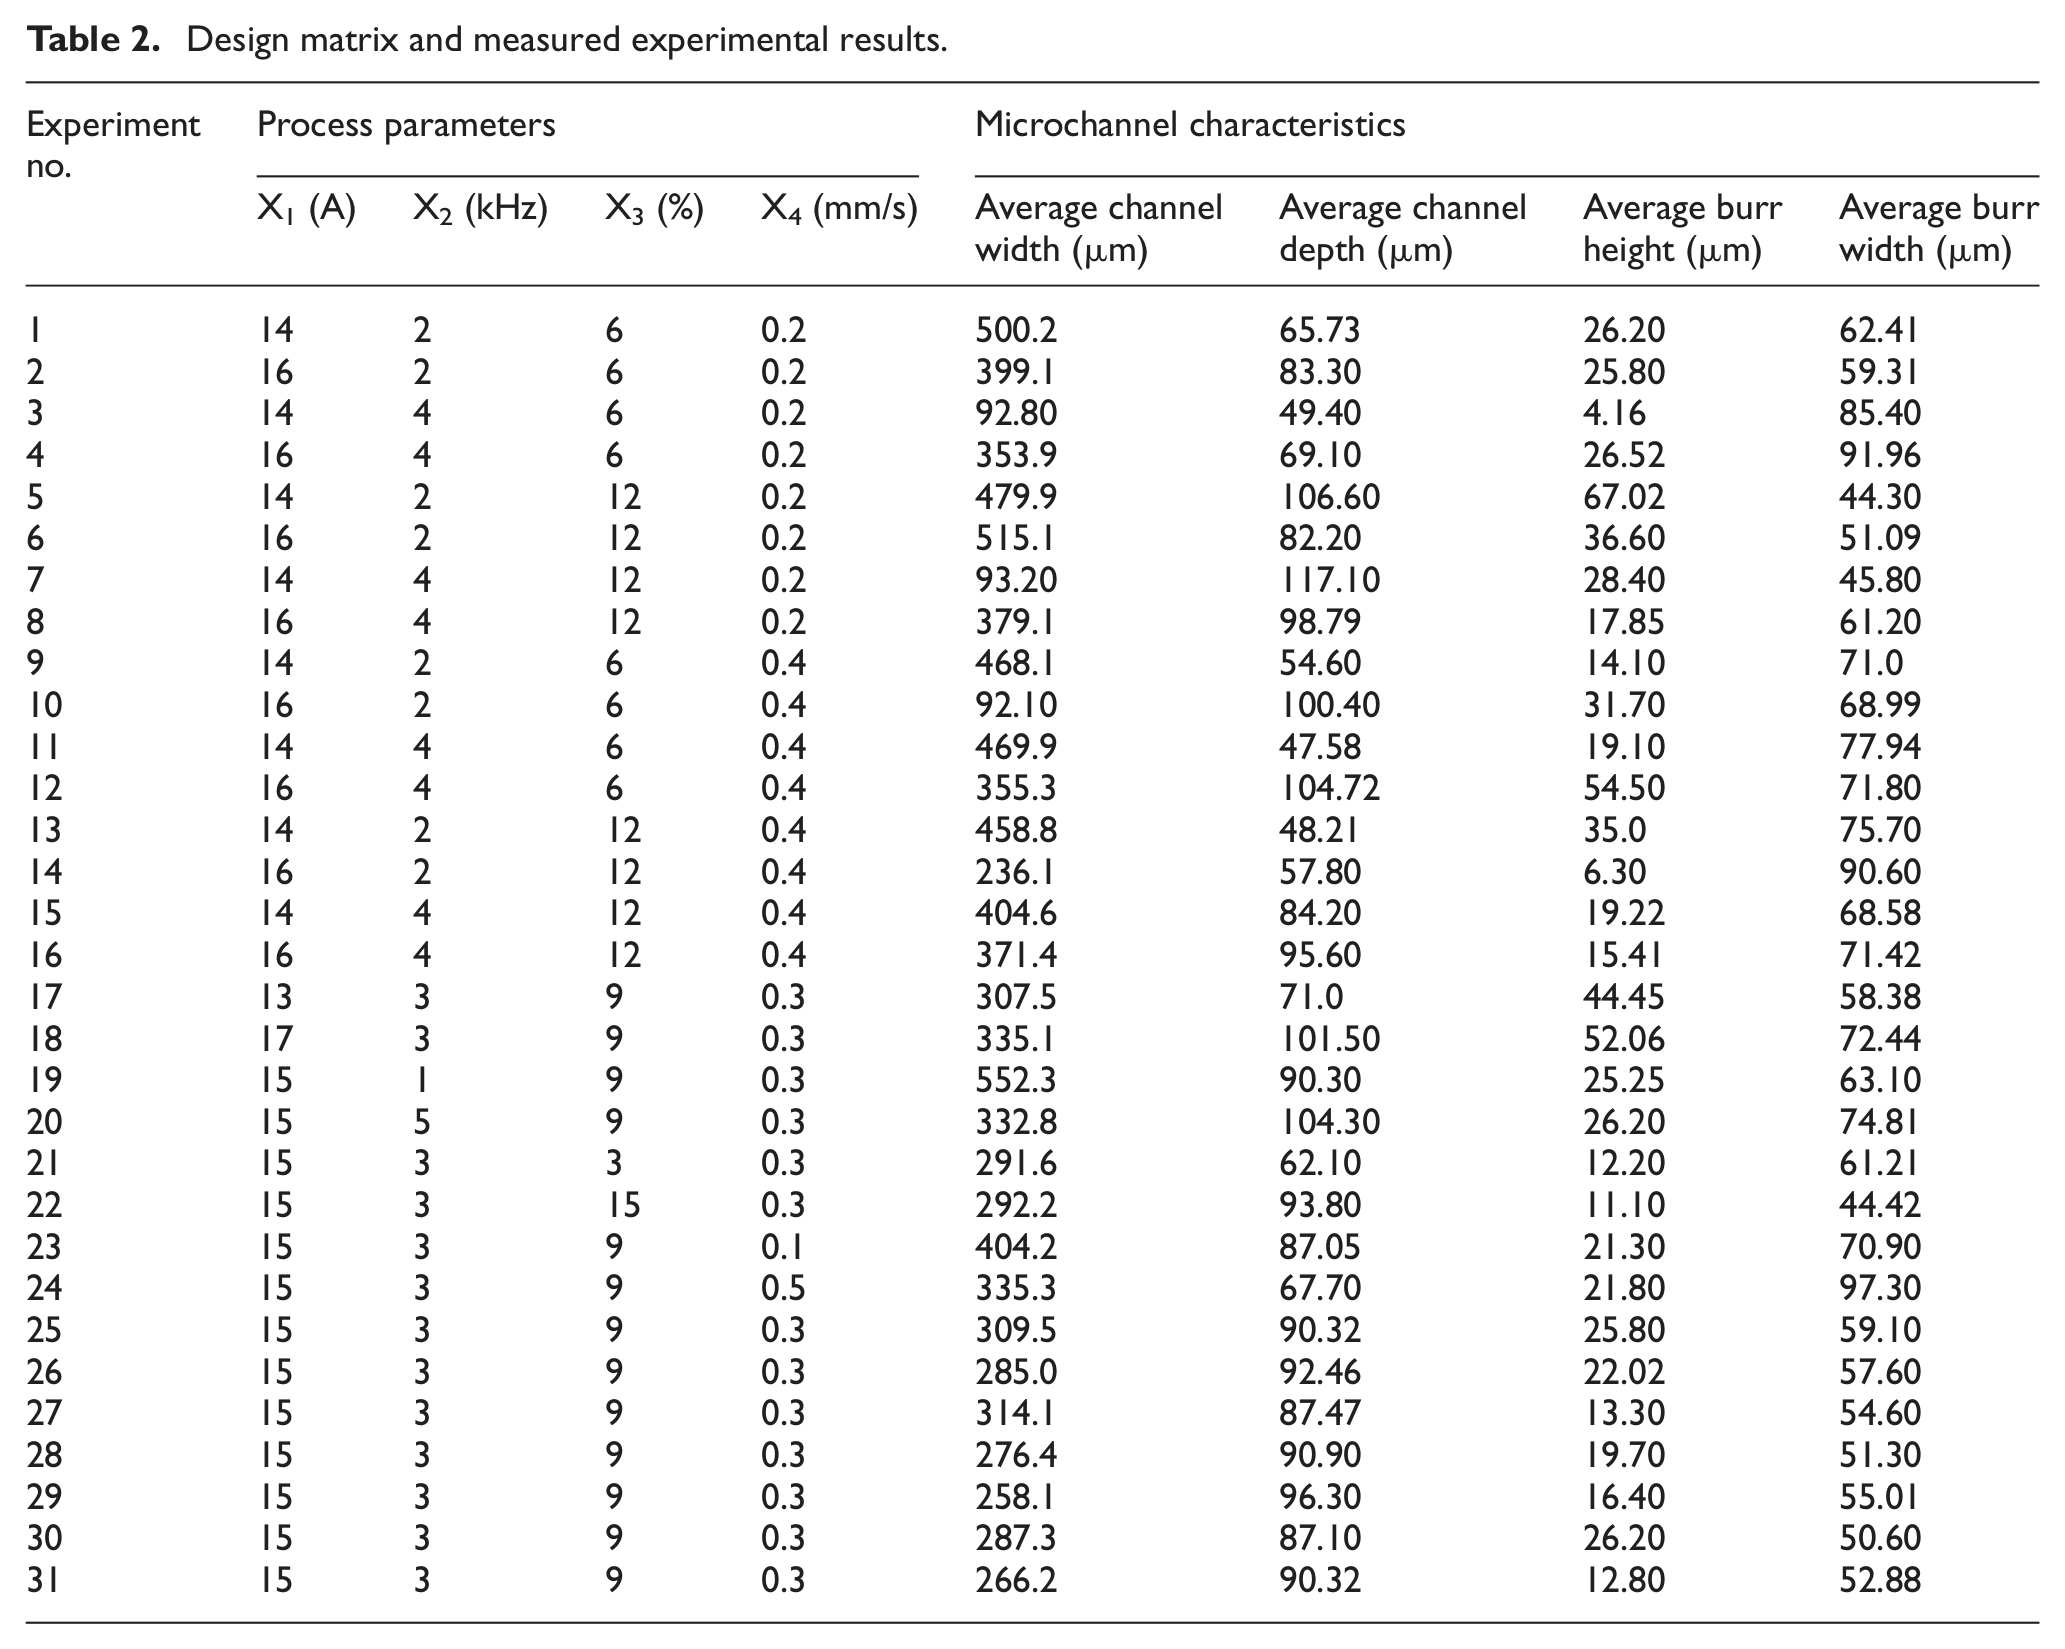
A total of 31 experiments have been performed as per the design format prepared using RSM for efficient and effective experimentation. Figure 4(a) and (b) shows the microscopic view of the microchannels resulting from experiments 9 and 13, respectively. The photographs have been taken using the Analysis™ software specially built for this purpose. Details of the experiment with their corresponding input and output values have been given in Table 2.
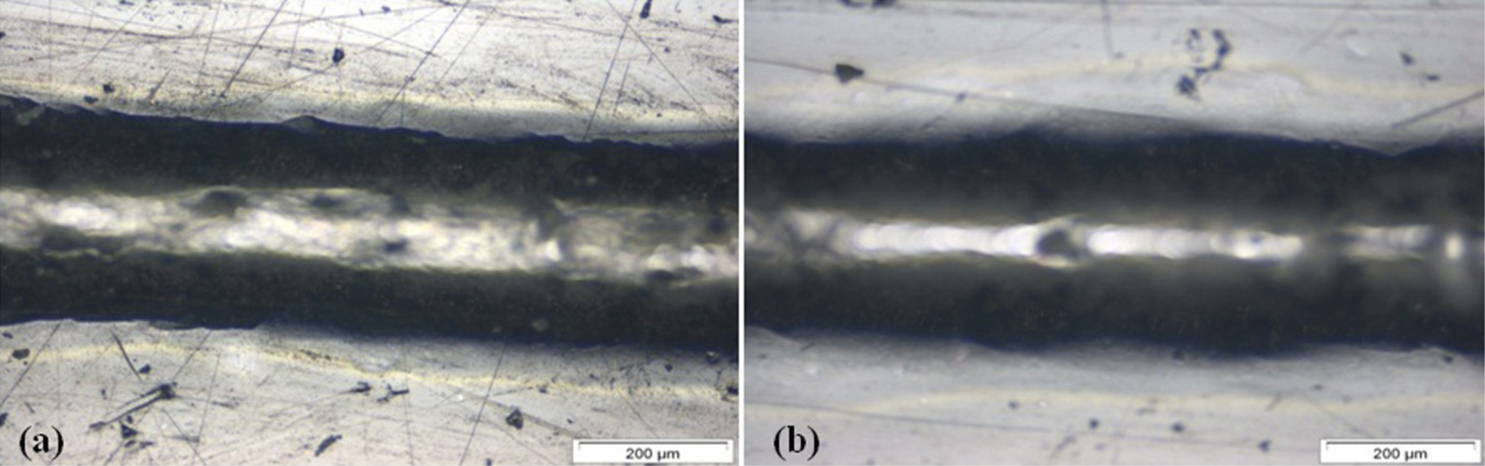
Microchannel resulting from experiments (a) 9 and (b) 13, respectively.
Design matrix and measured experimental results.
Material removal mechanism during underwater microchanneling process
The material removal process in underwater processing is significantly affected by presence of water. Focused laser beam causes the removal of the material at the uppermost surface. The water prevents the resolidification of the removed materials around the channel unlike the material removal process in open air. However, due to stagnant water, the bubbles are formed causing hindrance in free flow of water. The material has been resolidified at the points where bubbles had formed. However, it has been observed that the microchannel shape is not very smooth and perfect at the boundary. The internal shape of the channel followed the Gaussian profile of the laser beam. The upper surface layer is found to be irradiated losing its shine and smoothness. The removed part of the material gets trapped into the water. Hence, presence of water helps in minimizing the amount of redepository material. However, the basic method of removal of material remains the same, that is, melting and evaporation. The trapped material into the water causes the diffraction of laser rays and hence results in lower quality of channels at the end of the process.
Mathematical modeling for the responses based on RSM
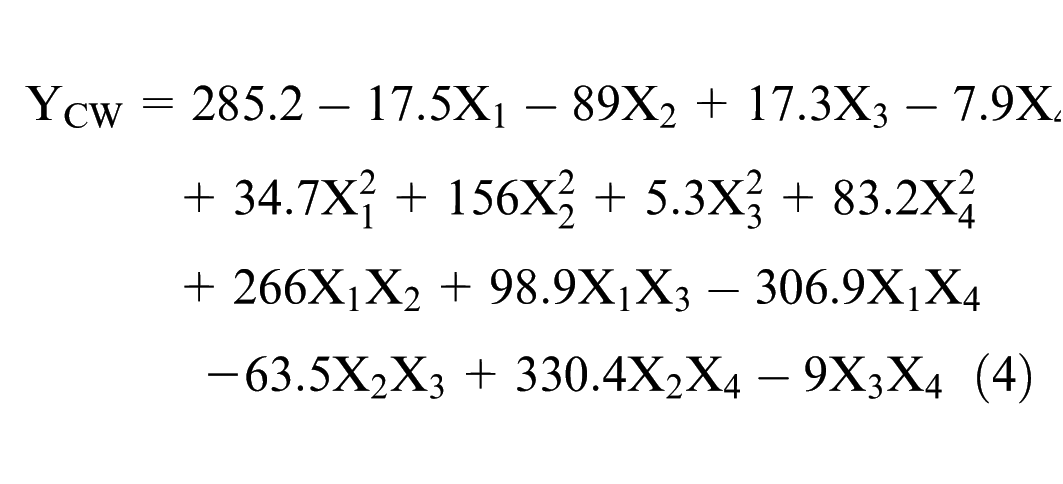
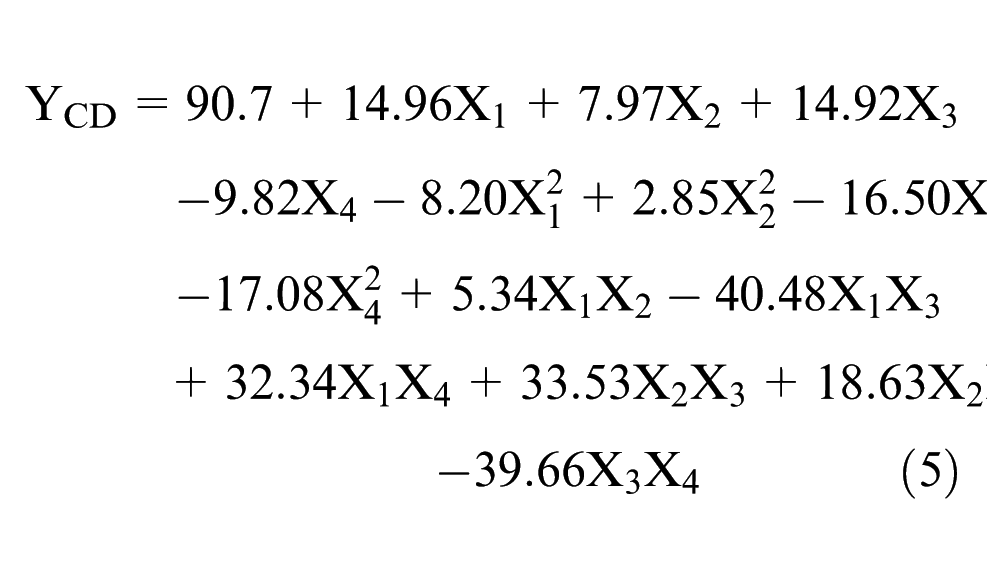
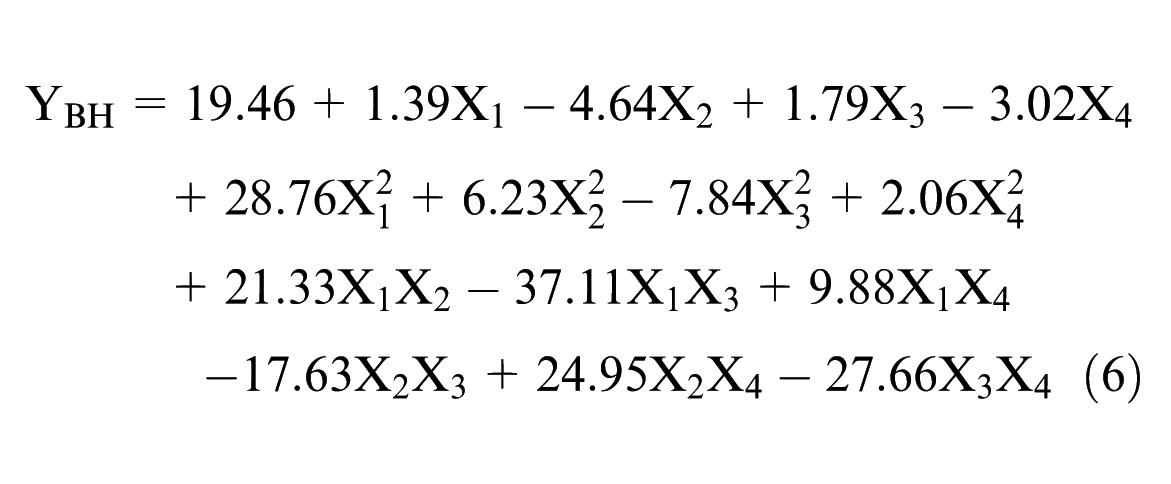
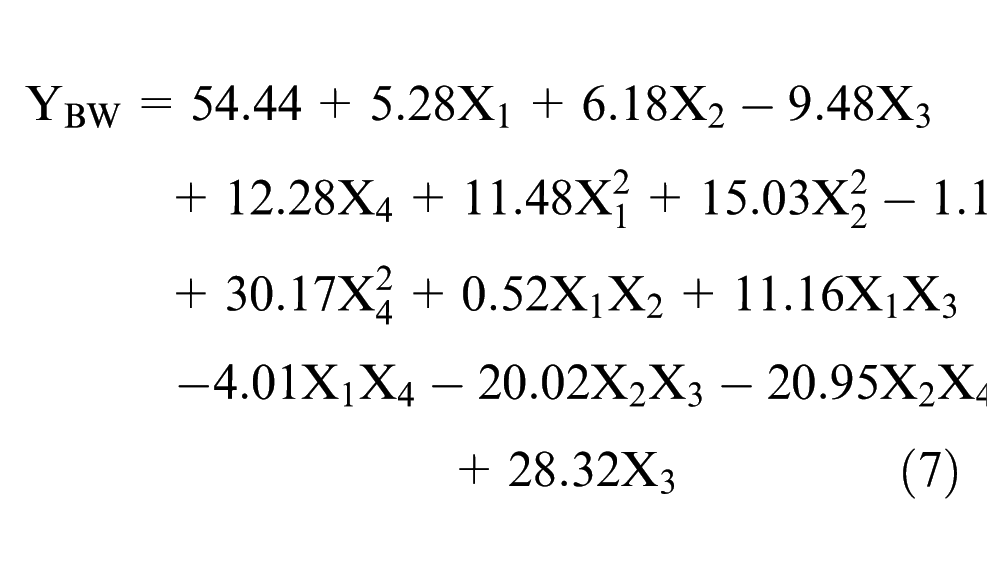
RSM has been used to develop the mathematical models using statistical package MINITAB. Second-order mathematical models have been developed using the different values of responses obtained as above. The mathematical correlation for microchannel width (YCW), microchannel depth (YCD), burr height (YBH) and burr width (YBW) are given by the following equations (4–7), respectively, where X1 denotes lamp current, X2 denotes pulse frequency, X3 denotes pulse width and X4 denotes cutting speed
Analysis of variance
In order to ascertain fitness of the developed empirical models for the response of microchannel width, microchannel depth, burr height and burr width, the analysis of variance (ANOVA) test is conducted. The purpose of ANOVA test is to investigate which design parameters have a significant effect on the microchannel characteristics.
The ANOVA table for microchannel width is given in Table 3. From the table, it is found that the values of regression and linear have high values. The large value of F indicates that most of the variation in the response can be explained by the regression model equation. The F-value of regression is 30.20, which is greater than the tabulated value F14,10(2.88), which indicates that the second-order polynomial equation is highly significant and adequate to represent the actual relationship between the response and the variables. The associated P-value is used to judge whether F statistics is large enough to indicate statistical significance. A P-value less than 0.05 indicates that the model is considered to be statistically significant. P-values for all the regression and linear are lower than 0.01. Therefore, the second-order regression model developed for the microchannel width is adequate at 95% confidence level.
Analysis of variance for microchannel width.
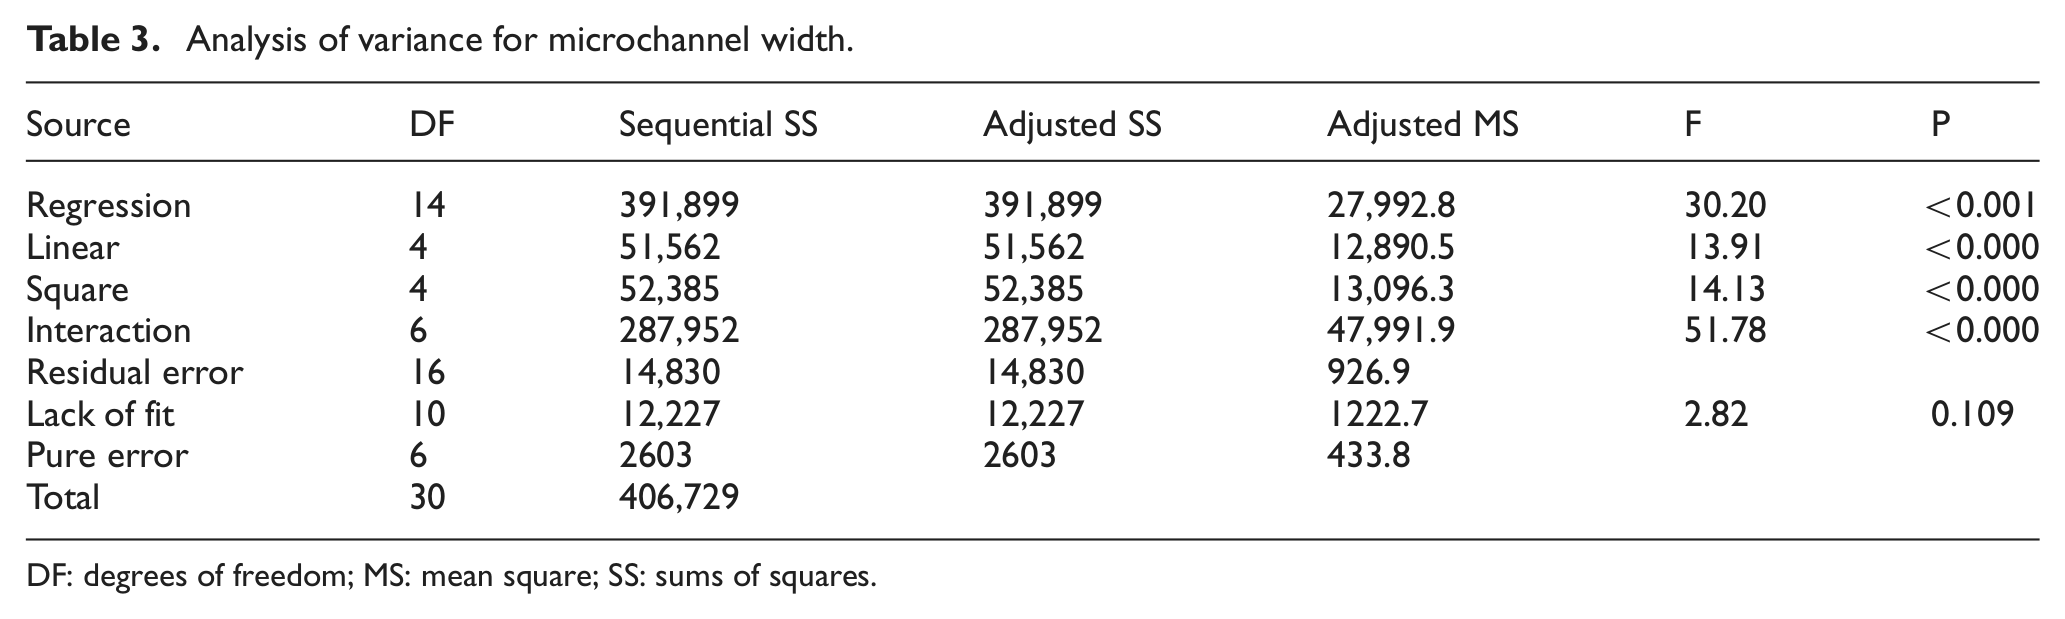
DF: degrees of freedom; MS: mean square; SS: sums of squares.
Table 4 shows the ANOVA test results for microchannel depth. It is noted that the value of regression and linear is significant and the value is greater than the tabulated value F14,10(2.88) and F4,10(3.48) as found in the standard chart at 95%. So the linear factors of the process parameters have more effect on the model. Moreover, the P-values for regression and linear are also less than 0.05, which further proves that the regression model equation is significant and shows the model at a confidence level of 95% for its adequacy.
Analysis of variance for microchannel depth.
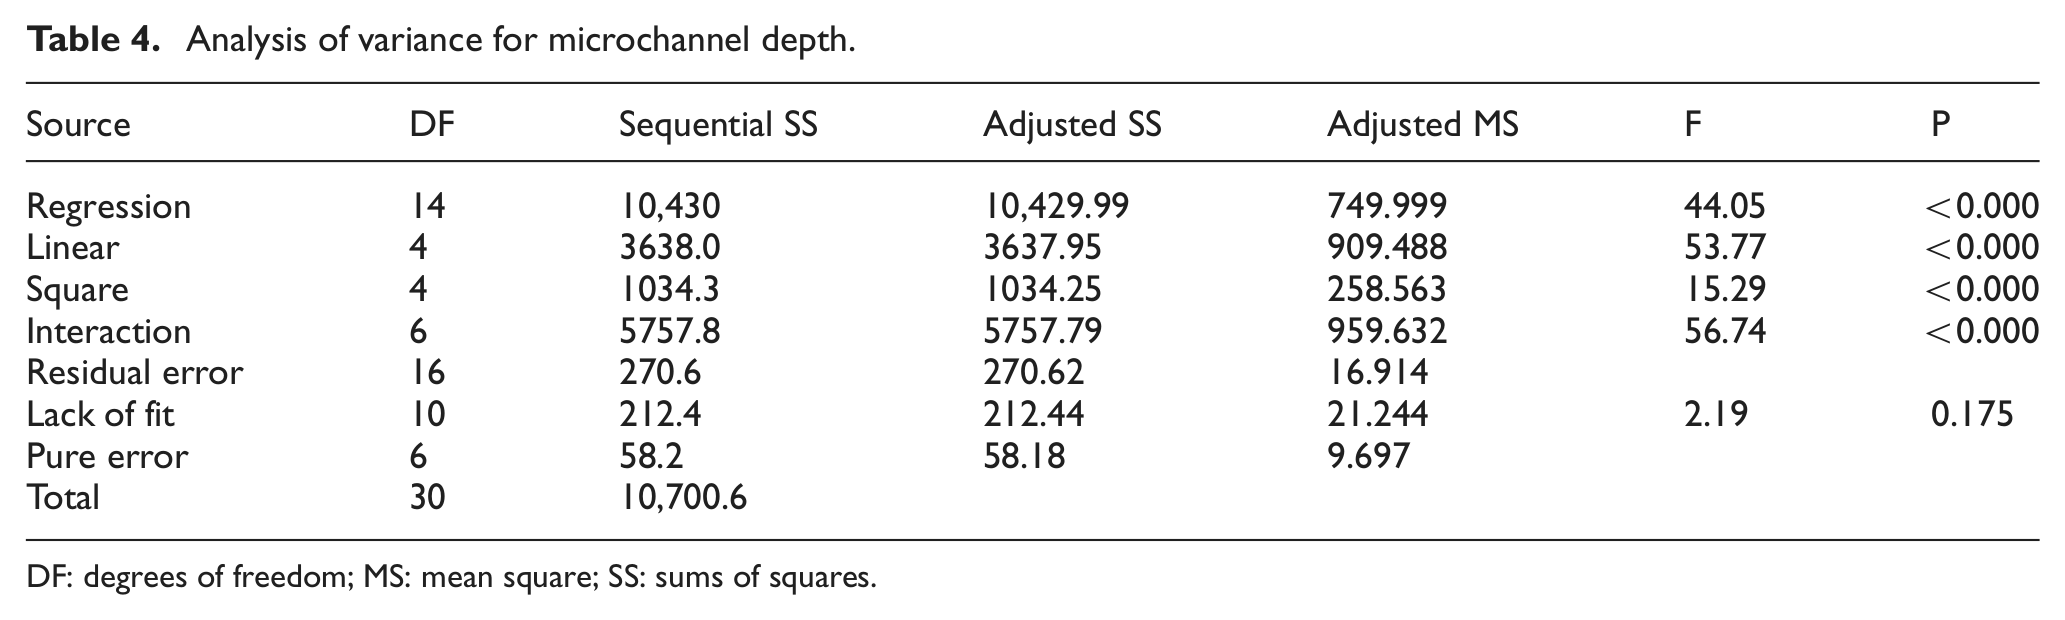
DF: degrees of freedom; MS: mean square; SS: sums of squares.
Table 5 shows the ANOVA test results for burr height. With regard to burr height, the calculated values are more than the tabulated values for interaction. So the interaction factors of the process parameters have more effects on the model. In addition, the P-values 0.000, 0.000 and 0.000 are all less than 0.05, which indicates that the terms are significant and are at 95% confidence level. In addition, the F-value for lack of fit is also less than the tabulated value 2.88, which proves that lack of fit is insignificant. Hence, the developed second-order regression model for burr height is adequate at a 95% confidence level.
Analysis of variance for burr height.
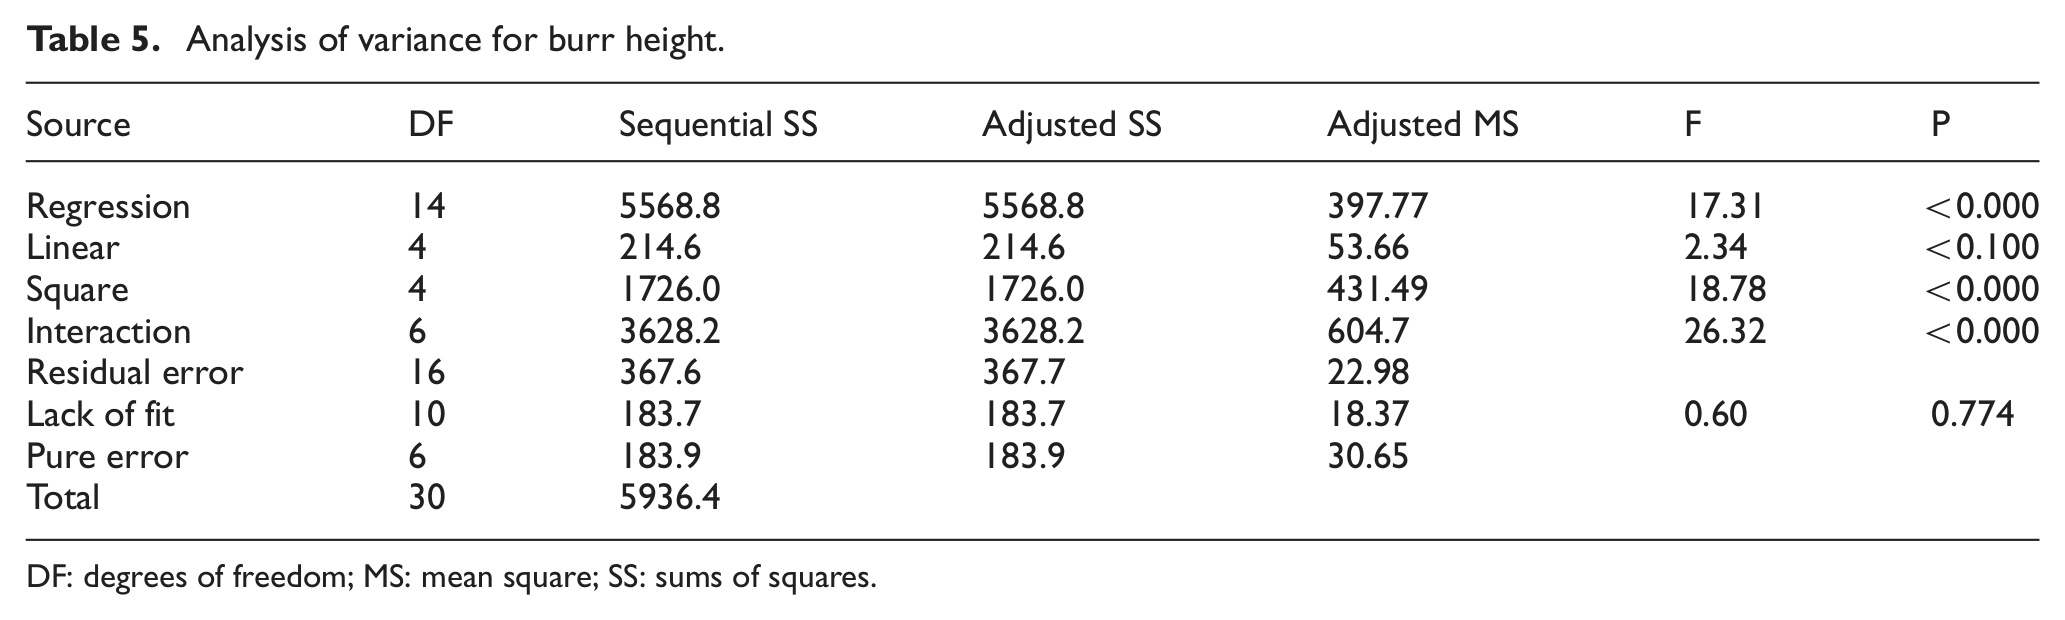
DF: degrees of freedom; MS: mean square; SS: sums of squares.
Table 6 gives the ANOVA table for burr width. From Table 6, it is found that the calculated lack of fit (1.10) is less than the tabulated value of F10,14(2.60), which clarifies that the effect of lack of fit is insignificant. This implies that all the data have been well fitted in the response curve. The regression factor on the parameters has more effect on the process parameter. Hence, the developed second-order regression model for burr width is adequate at 95% confidence level.
Analysis of variance for burr width.
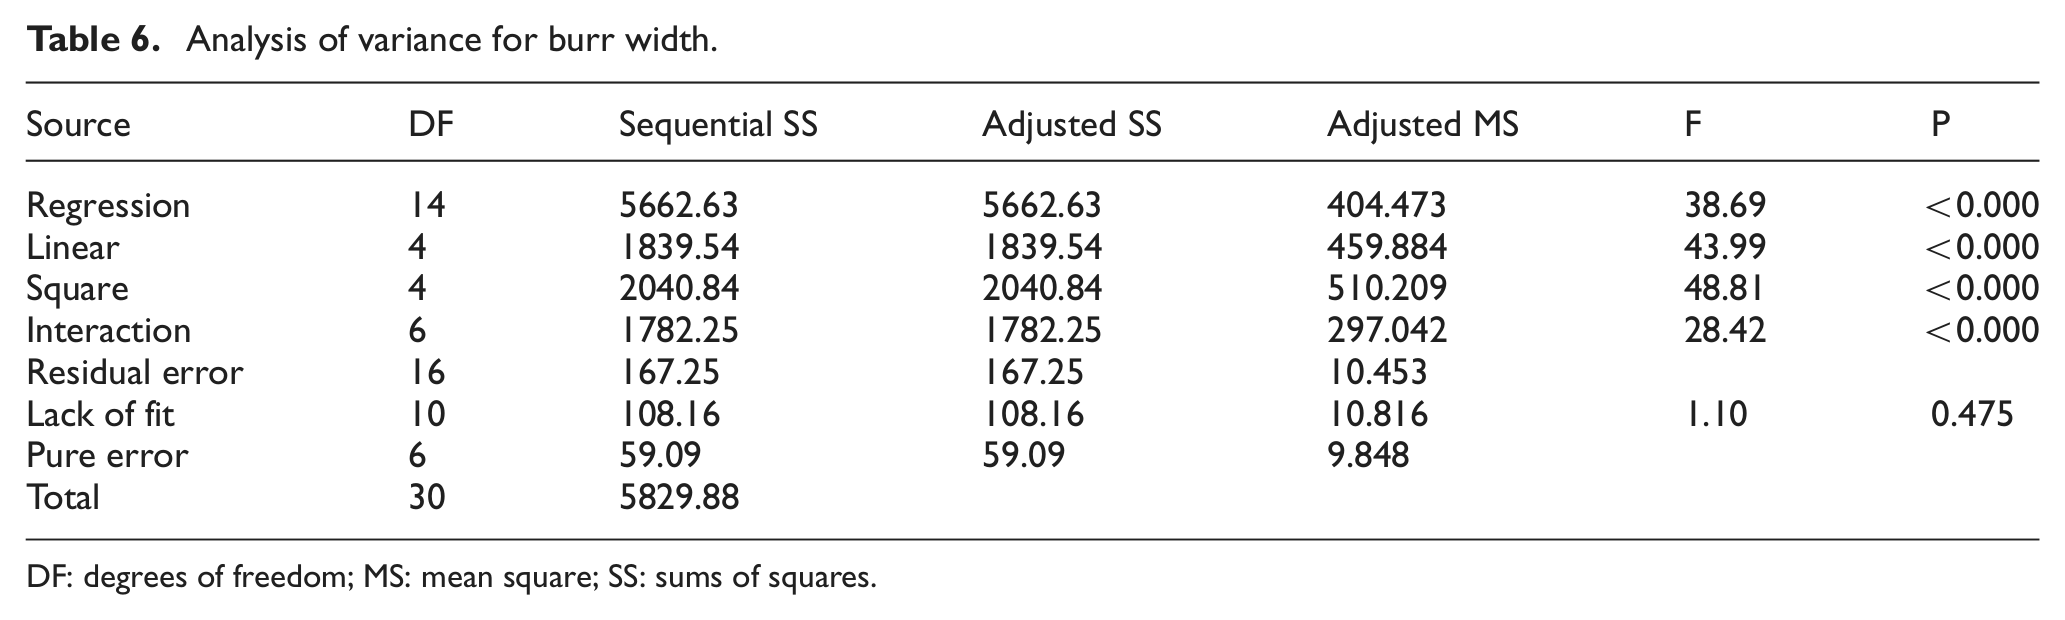
DF: degrees of freedom; MS: mean square; SS: sums of squares.
Parametric optimization
Single-objective optimization analysis
In order to find the optimum values of different responses, different microchannel characteristics have been optimized using response surface optimization process. to be minimized for getting higher aspect ratio, (b) Channel depth has to be maximized for having high aspect ratio channels, (c) Burr height has to be minimized, and (d) Burr width has to be minimized, the process has been optimized. From Figure 5(a), the optimal conditions for getting minimum channel width (10.0115 µm) are lamp current = 13.2566 A, pulse frequency = 3.3464 kHz, pulse width = 11.8306% and cutting speed = 0.1 mm/s. From Figure 5(b), the optimal conditions for getting maximum channel depth (156.5062 µm) are lamp current = 13 A, pulse frequency = 1 kHz, pulse width = 15% and cutting speed = 0.1 mm/s. From Figure 5(c), the optimal conditions for getting minimum burr height (4.7548 µm) are lamp current = 15.7633 A, pulse frequency = 5.0 kHz, pulse width = 3.0% and cutting speed = 0.1 mm/s. From Figure 5(d), the optimal conditions for getting minimum burr width (32.9144 µm) are lamp current = 13 A, pulse frequency = 1.0 kHz, pulse width = 15.0% and cutting speed = 0.1 mm/s.
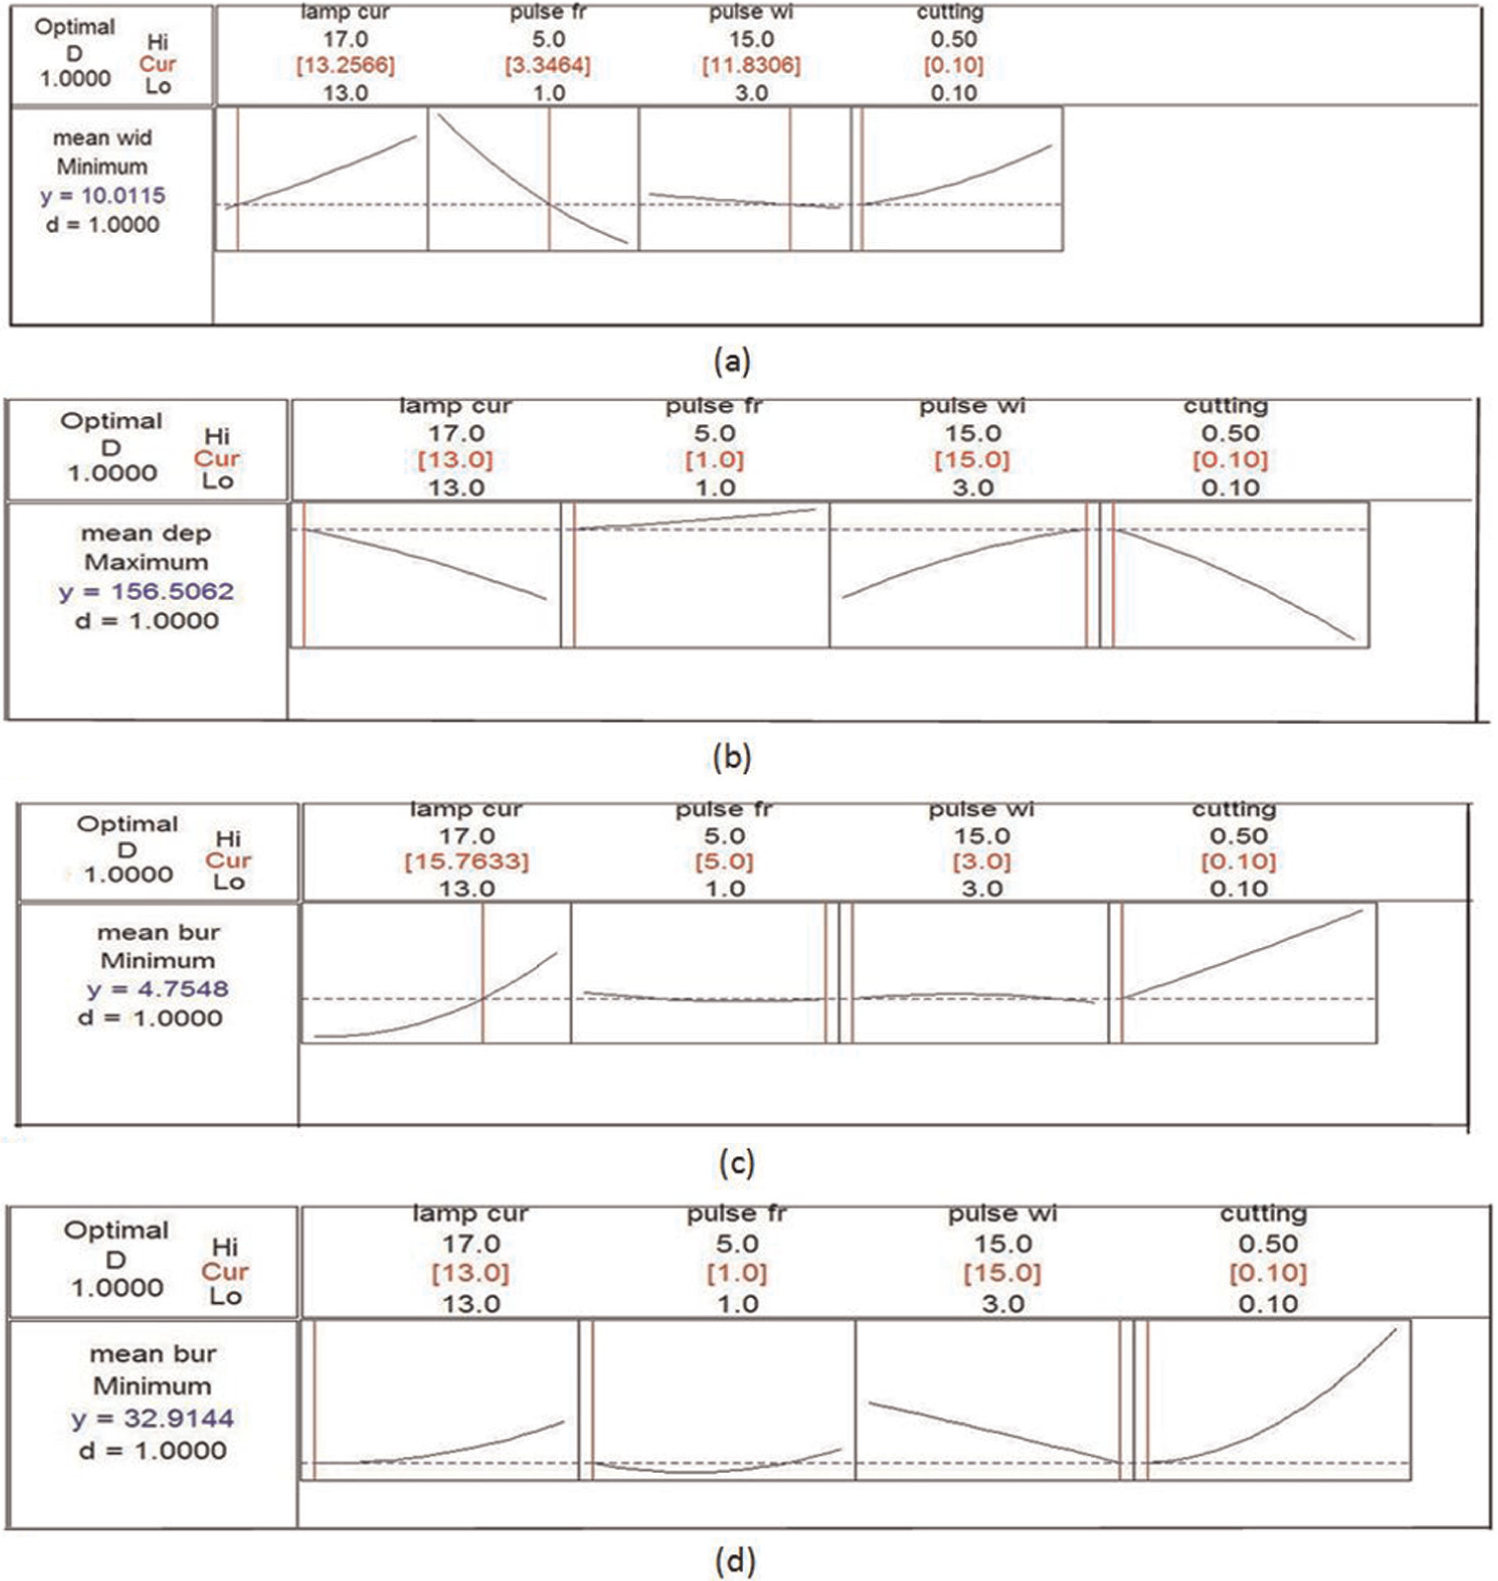
Single-objective optimization results for (a) microchannel width, (b) microchannel depth, (c) burr height and (d) burr width.
Multiobjective optimization analysis
Multiresponse optimization analysis for the underwater microchanneling operation has been carried out for optimizing all the responses altogether. In multiobjective optimization, all the goals are combined into single desirability function. Figure 6 shows the optimization results of multiobjective optimization. All the responses have been optimized for getting the most optimum results. In Figure 6, each column of the graph corresponds to a factor. Each row of the graph corresponds to a response variable. Each cell of the graph shows how one of the response variables changes as a function of one of the factors, while all other factors remain fixed. The numbers displayed at the top of the column shows the current factor-level settings and the high and low levels of factors. At the left of each row, goal for the response, predicted response, y, at current factor settings, and individual desirability score are given. From Figure 6, the values of the results of multiobjective optimization for various responses are lamp current = 14.2142 A, pulse frequency = 5 kHz, pulse width = 15% and cutting speed = 0.2175 mm/s, and the response values are channel width = 15.2601 µm, channel depth = 155.1885 µm, burr height = 11.7782 µm and burr width = 36.5329 µm.
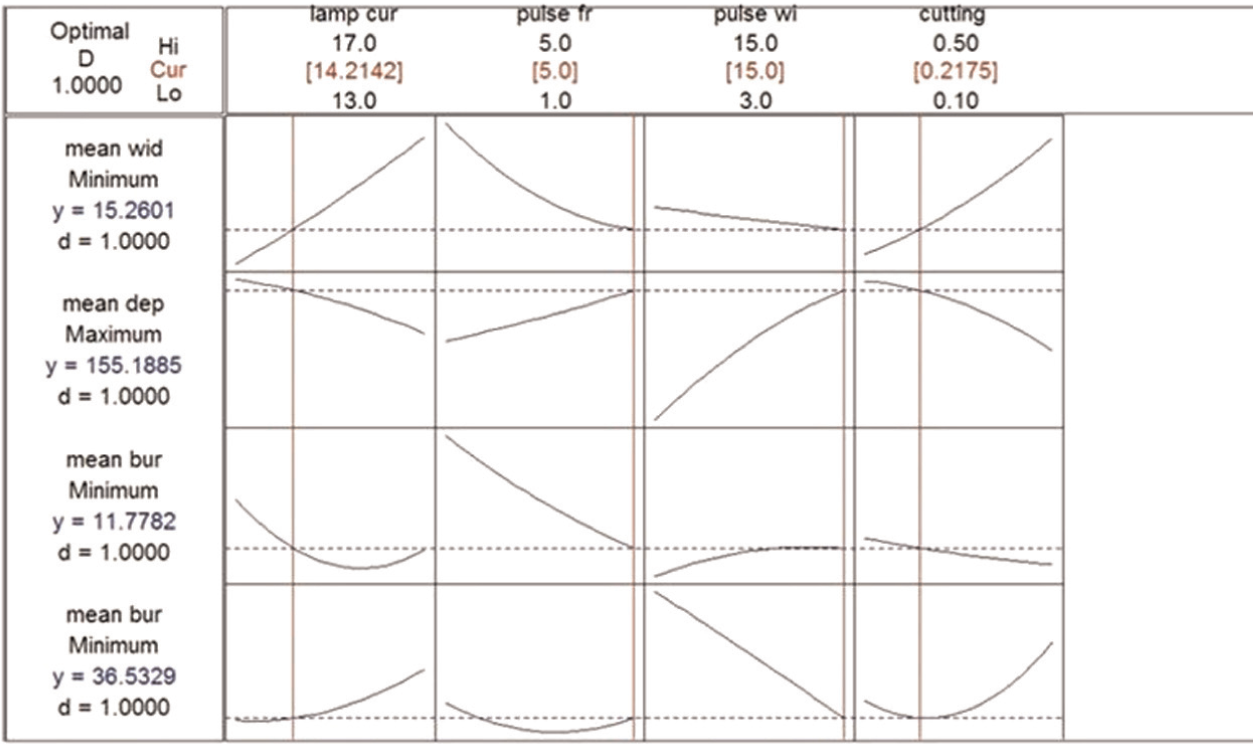
Result of multiobjective optimization of responses.
By superimposing or overlaying critical response contours on one contour plot, experimenters can visually search for the best compromise. Graphical optimization displays the area of feasible response values in the factor space. Regions that do not fit the optimization criteria are shaded. Figure 7 shows the results of graphical optimization using overlay contour graph. Overlay contour plot is an efficient way to represent the optimum values input factors for getting desired result. In Figure 7, the white zone expresses the region of optimality.
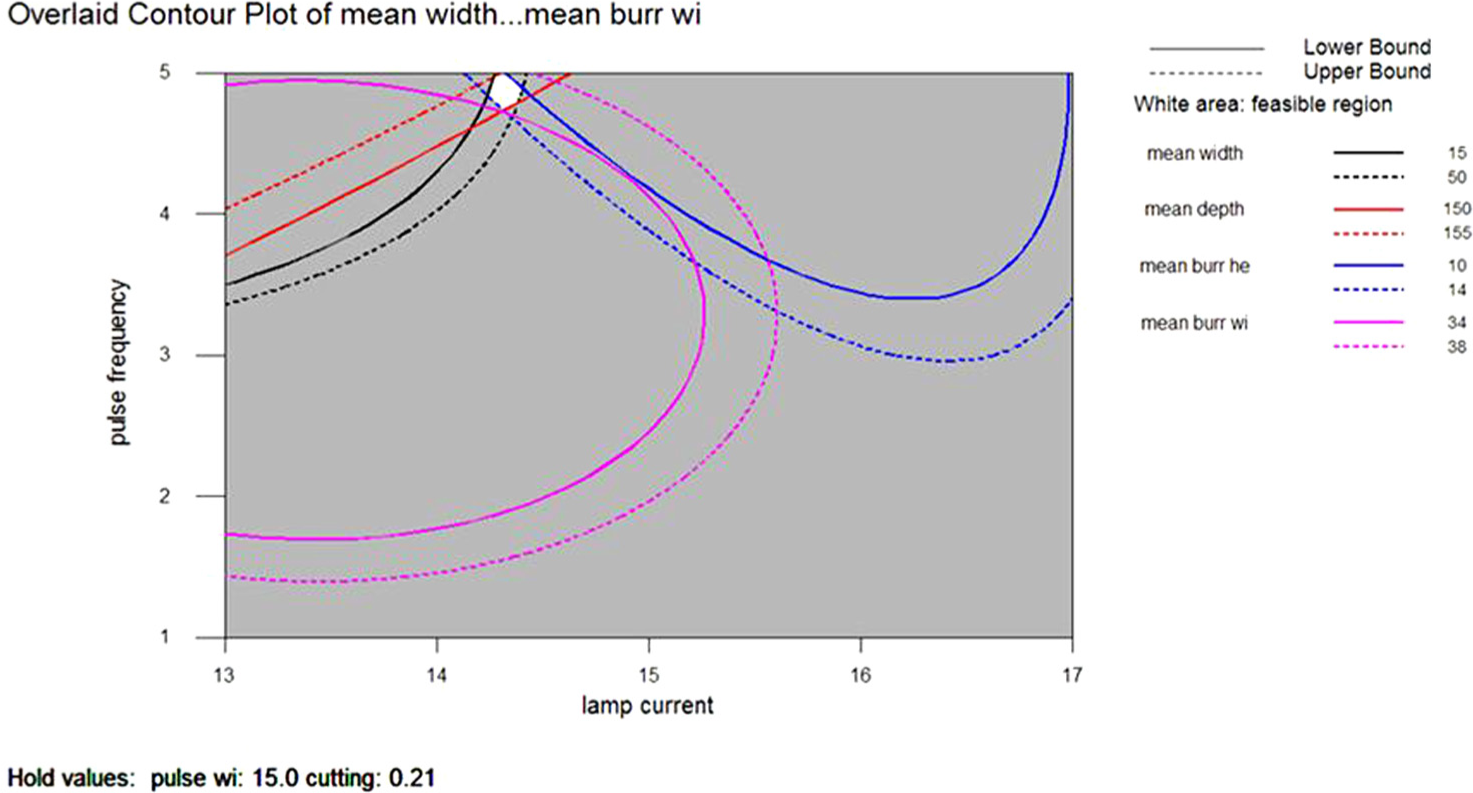
Overlay contour plot.
In Figure 7, the white zone corresponds to the lamp current values slightly greater than 14 and pulse frequency near to 5, while keeping the values of cutting speed and pulse width on hold values of 0.21 and 15, respectively. The overlay contour graph also justifies the optimal values of the input factors obtained from the numerical optimization.
Confirmation experiment
In order to validate the results at optimum condition, experiments have been conducted as per the optimum condition and observed that the experimental results are fairly close to the predicted results. The absolute prediction error (APE) in percentage has been calculated using the following formulae
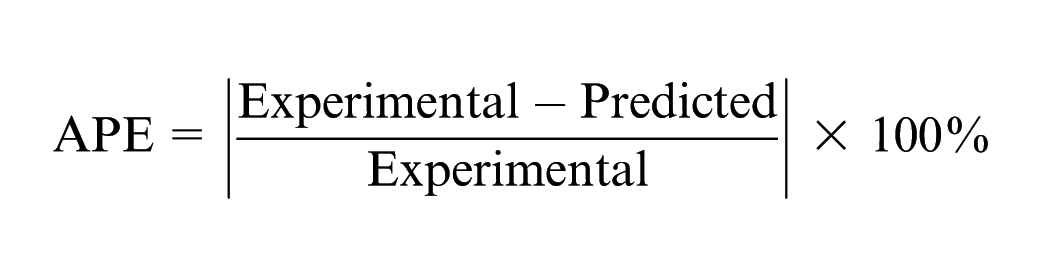
Table 7 shows the comparison of experimental results with predicted results and APE.
Validation of the optimized results.
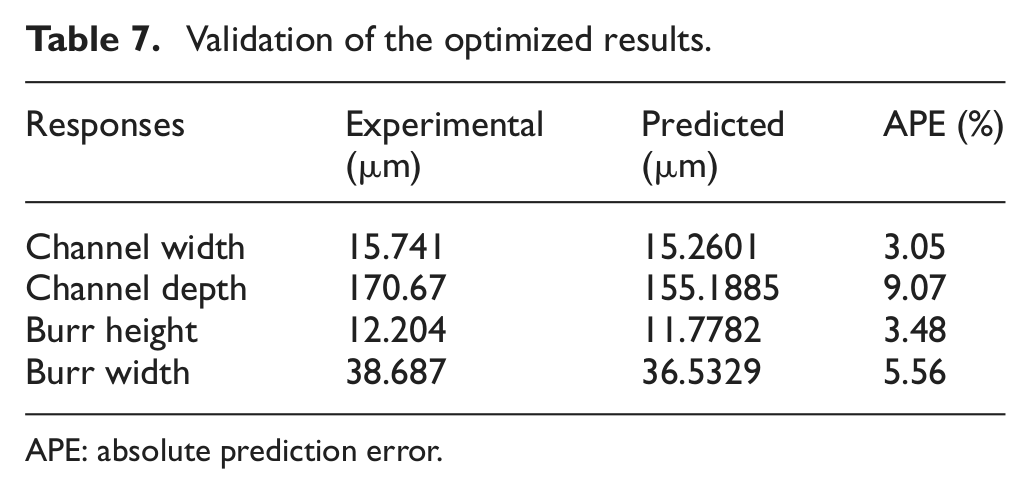
APE: absolute prediction error.
Results and discussion
The effect of various machining variables like lamp current, pulse frequency, pulse width and cutting speed on microchannel characteristics have been analyzed using response surface plots. The plots have been drawn using MINITAB software, and the combination of factors has been chosen depending upon the most influential interaction effects.
Effect of process parameters on microchannel width
Figure 8(a) shows the variation of microchannel width with change in lamp current and cutting speed. The width of the microchannel increases with increase in lamp current at lower cutting speed, but at higher cutting speed, the width reduces. This is due to the fact that increase in lamp current directly causes an increase in associated beam power, thus transferring more energy, but at higher cutting speeds, since the beam interaction time with the workpiece surface is less, only less amount of energy gets transferred, thus reducing the channel width. Figure 8(b) shows the variation of microchannel width with change in pulse frequency and cutting speed. The width of microchannel decreases with increase in pulse frequency at lower cutting speeds, while at higher cutting speeds, it increases with increase in pulse frequency. Since at lower cutting speeds, the water over the surface gets enough time to produce local cooling effect, thus reducing the width of the channel; however, at higher cutting speed, local cooling is not so much effective and thus increased pulse frequency causes larger width formation.
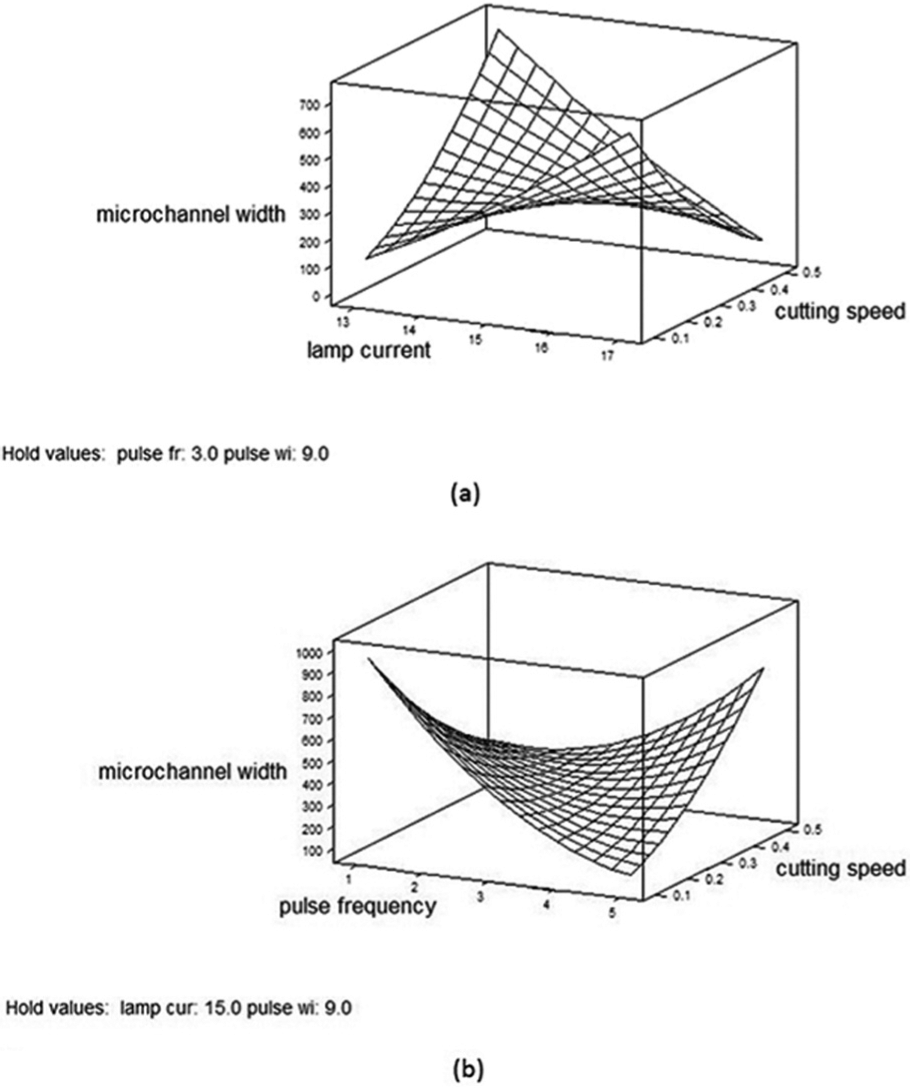
Variation of microchannel width with (a) change in lamp current and cutting speed and (b) change in pulse frequency and cutting speed.
Effect of process parameters on microchannel depth
Figure 9(a) shows the variation of microchannel depth with change in lamp current and pulse width. At lower pulse widths, the energy concentration and quality of beam are more than at higher pulse widths. So an increase in lamp current results in increase of channel depth at lower pulse widths. While at higher pulse widths since the energy concentration of the beam is low, the increase in lamp current results in decrement of channel depth. Figure 9(b) shows the variation of microchannel depth with change in pulse width and cutting speed. At lower cutting speeds, since the interaction time is more, the depth of microchannel increases with increase in pulse width, while at higher cutting speeds, due to lesser interaction time, the depth decreases.
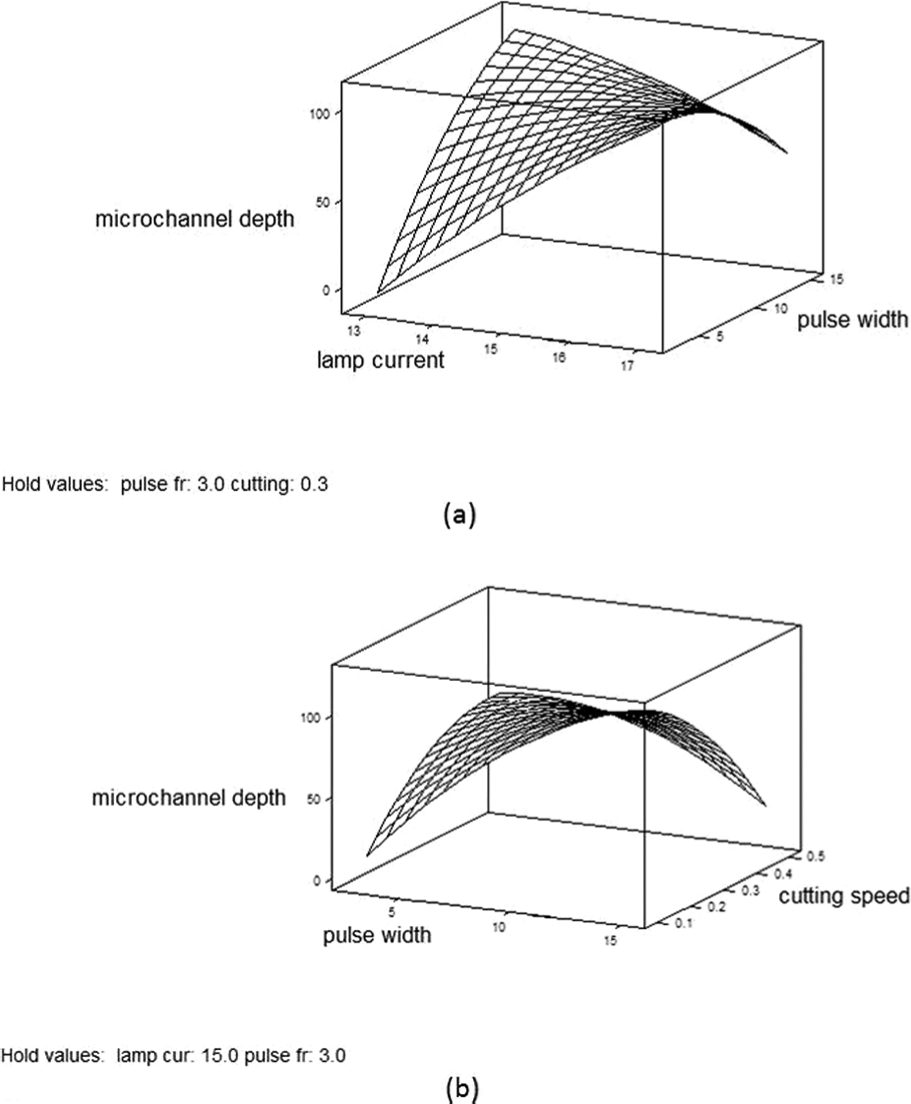
Variation of microchannel depth with (a) change in lamp current and pulse width and (b) change in pulse width and cutting speed.
Effect of process parameters on burr height
Burr formation during a heat-based machining process is a natural phenomenon. Burrs cause the formation of wavy and rough surface around the microchannel. The sole purpose of underwater cutting is to reduce such unwanted effects of micromachining process. Figure 10(a) shows the variation of burr height with change in lamp current and pulse width. At lower pulse widths, burr height increases with increase in lamp current, but at higher pulse widths, burr height decreases with increase in lamp current. The increase in burr height with lamp current at lower values of pulse width can be attributed to the higher quality of beams at lower pulse widths. However, at higher pulse width, the beam quality and energy concentration of beam decrease. Hence, the lesser amount of energy could only get transfer to the surface. Figure 10(b) shows the variation of burr height with change in pulse width and cutting speed. At lower cutting speeds, the height of burr increases with increase in pulse width, but at higher cutting speeds, the burr height decreases with increase in pulse widths. Smaller cutting speeds allow the interaction of beam with the workpiece surface for greater time, thus helping in the formation of monomer layers floating in water. This trapped monomer layer causes dispersion of the heat around the channel in a nonuniform manner, thus helping in formation of burrs around the channel. At higher cutting speeds, because of ineffective role of monomers, the heat remains concentrated, thus resulting in reduction in burr formation.
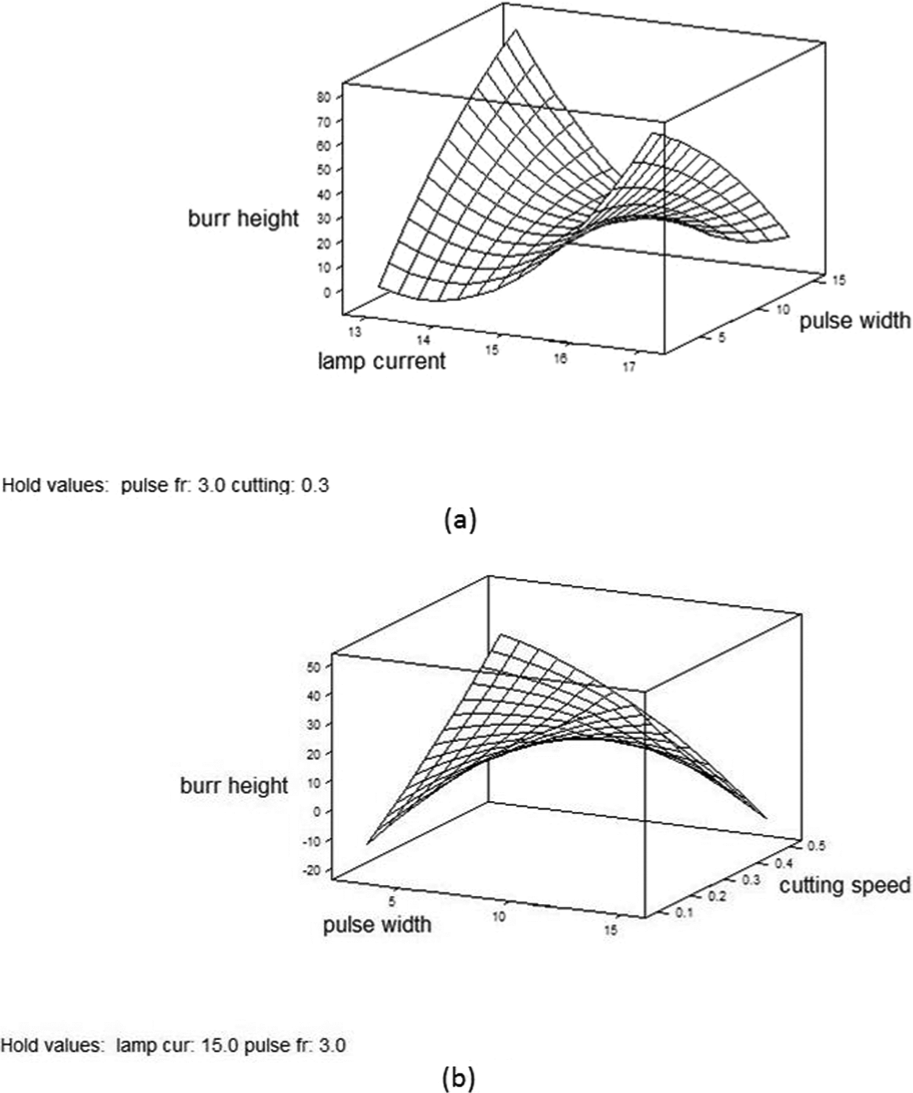
Variation of burr height with (a) change in lamp current and pulse width and (b) change in pulse width and cutting speed.
Effect of process parameters on burr width
Burr width is also an important parameter that actually determines the cleanliness of the whole process. A shorter burr width indicates that process is better than other processes and also gives reliability in constructing another channel in close proximity to the channel created. Figure 11(a) shows the variation of burr width with change in pulse frequency and cutting speed. At lower cutting speeds due to effective role of monomer layers, the burr width increases with increase in pulse frequency, but at higher cutting speeds, it decreases with increase in pulse frequency. Figure 11(b) shows the variation of burr width with change in pulse width and cutting speed. At lower cutting speeds, the burr width decreases with increase in pulse width, but at higher cutting speeds, it increases with increase in pulse width. This can be explained as at lower cutting speeds, the local cooling takes place much effectively, and as pulse width increases, the beams contain lesser energy, thus width of burrs decreases, but at higher cutting speeds, the local cooling does not takes place much effectively, hence burr width increases.
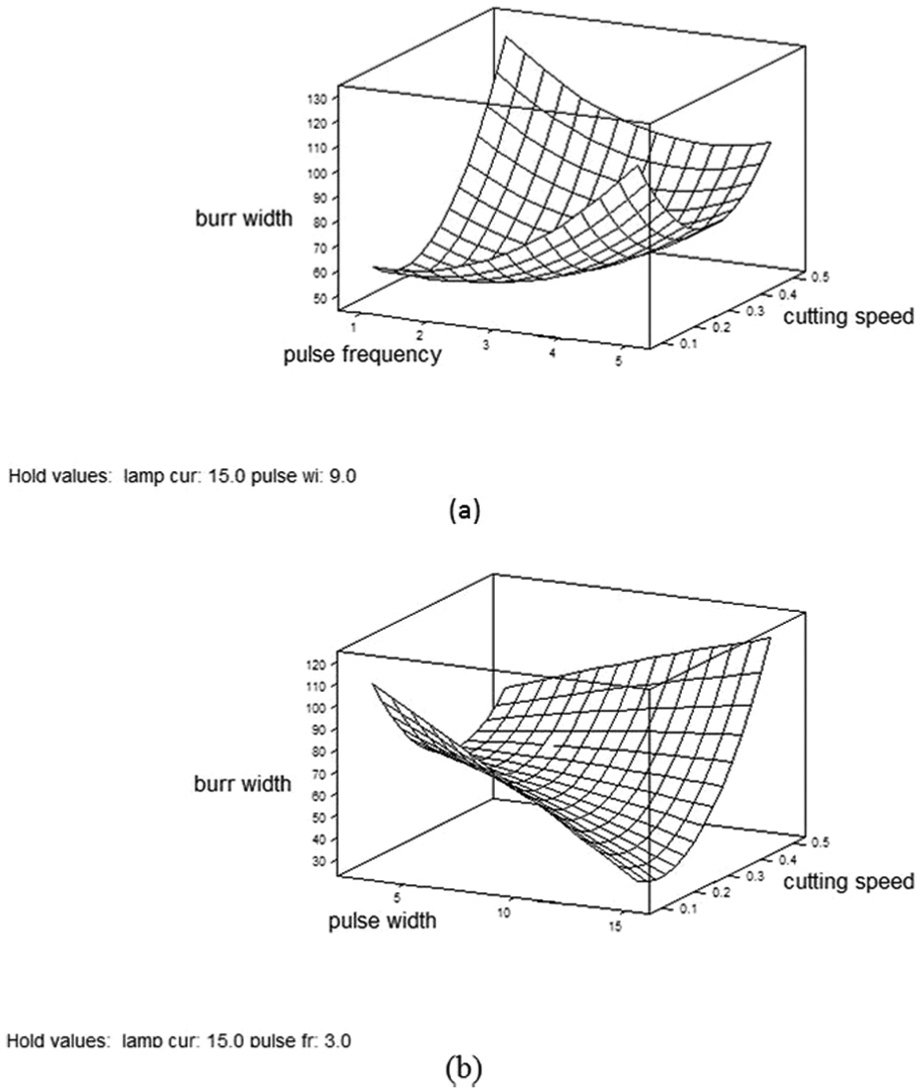
Variation of burr width with (a) change in pulse frequency and cutting speed and (b) change in pulse width and cutting speed.
Conclusion
In this experiment, in-depth study of underwater laser micromachining operation has been carried out, and it is found very effective for microchannel fabrication. On the basis of this work, the following points can be pointed out:
Characteristics of burr formation, thermally affected zone and microchannel dimensions depend upon laser processing parameters involved.
Water acts as a medium to provide cooling effect as well as minimizing the resolidification of melted material around the microchannel.
The uppermost surface is smoother in case of open air processing than in underwater processing.
Pulse frequency and lamp current have been found to be the most important factor influencing the width of the microchannel.
Lamp current and pulse width have been found to be predominantly influencing factors for the microchannel depth.
Pulse frequency and pulse width are the dominating factors influencing the burr height. Cutting speed and pulse width are the most influencing factors for the burr width.
Desired dimension of the microchannel can also be achieved by the help of developed mathematical model, which can be used directly for the industrial application.
Multipass processing can be performed to obtain microchannels of high aspect ratios.
Measuring temperature may prove helpful in determining the HAZ, which is the function of laser power and beam diameter and can be taken as a future work.
Footnotes
Funding
This research received no specific grant from any funding agency in the public, commercial or not-for-profit sectors.