
Abstract
Tool–chip contact length can be a critical parameter in machining as it provides the path for heat flow from the secondary deformation zone into the tool. This is particularly critical in dry or high-speed machining, where elevated temperatures can activate wear mechanisms and hence reduce tool life. A number of analytical, dimensional analyses, empirical and statistical models have been used to predict contact length. However, more research is required to significantly raise the model accuracy in quantitative prediction and to elucidate the mechanisms that control contact length. In this study, cutting tests were performed at cutting speeds ranging from conventional to high cutting speed, and tool–chip contact length, chip thickness, sticking and sliding contact phenomena and cutting forces were characterised. Twenty-two contact length models reported in the literature were evaluated and benchmarked to experimental data. While dimensional analysis–based models have an improved quantitative predictive capability, they do not provide comprehensive insight into contact phenomenon. To this end, this work builds upon Tay et al.’s contact length model that has been benchmarked as promising in the literature. Parameters that influence the contact area, in particular, tool–chip sticking phenomenon, were characterised. Suggestions for improving contact length modelling are proposed.
Introduction
Tool–chip contact phenomenon
Mechanical machining processes shape material by the removal of chips. As the chip is produced in the shear zone, it moves along the tool rake face until it curls off and then breaks away. The contact length is the distance over which a continuous chip flows over the tool rake face while maintaining contact. Thus, the contact length starts from the cutting edge and extends over a certain distance. The temperature of the chip is elevated by heat generation in the primary deformation zone and further influenced by the heat produced in overcoming friction in the secondary deformation zone. This heat is partitioned away into the chip and the cutting tool. If the contact length and hence the contact area are controlled, heat dissipation into the tool and friction force between the tool rake face and the chip can be reduced. Hence, there is value in controlling the contact length. Normally, in machining at conventional cutting speed, a part of the tool–chip contact area is in seizure (sticking), while the other part undergoes interfacial sliding. Under seizure, the atoms of the two surfaces are strongly atomically bonded, whereas interfacial sliding is a relative movement of the tool–chip outer layer over the tool rake face. These interfacial conditions depend on the tool, work material and the cutting conditions.
This article reviews the literature on contact length modelling and benchmarks the accuracy of these models based on orthogonal cutting tests for a range of cutting speeds. It further suggests areas of improvements based on machining mechanics and contact phenomenon science.
Prediction of contact length
Different models have been developed to predict tool–chip contact length in machining. Table 1 provide a summary of such models for the prediction of contact length. It shows models developed in last century as well as the models proposed in this century. Early studies on contact length models were made in the 1950s when Lee and Shaffer 1 proposed a model that was based on the slip line theory. This model, based on sticking phenomenon, predicts contact length as a function of shear angle, rake angle and undeformed chip thickness. From this early work, it was established that the thicker the undeformed chip thickness, the larger is the contact length. This is reasonable as a higher force is required to curl the chip. Additionally, the smaller the positive rake angle, the larger the contact length since in this case, the rake angle acts more like an obstruction.
Contact length prediction models.
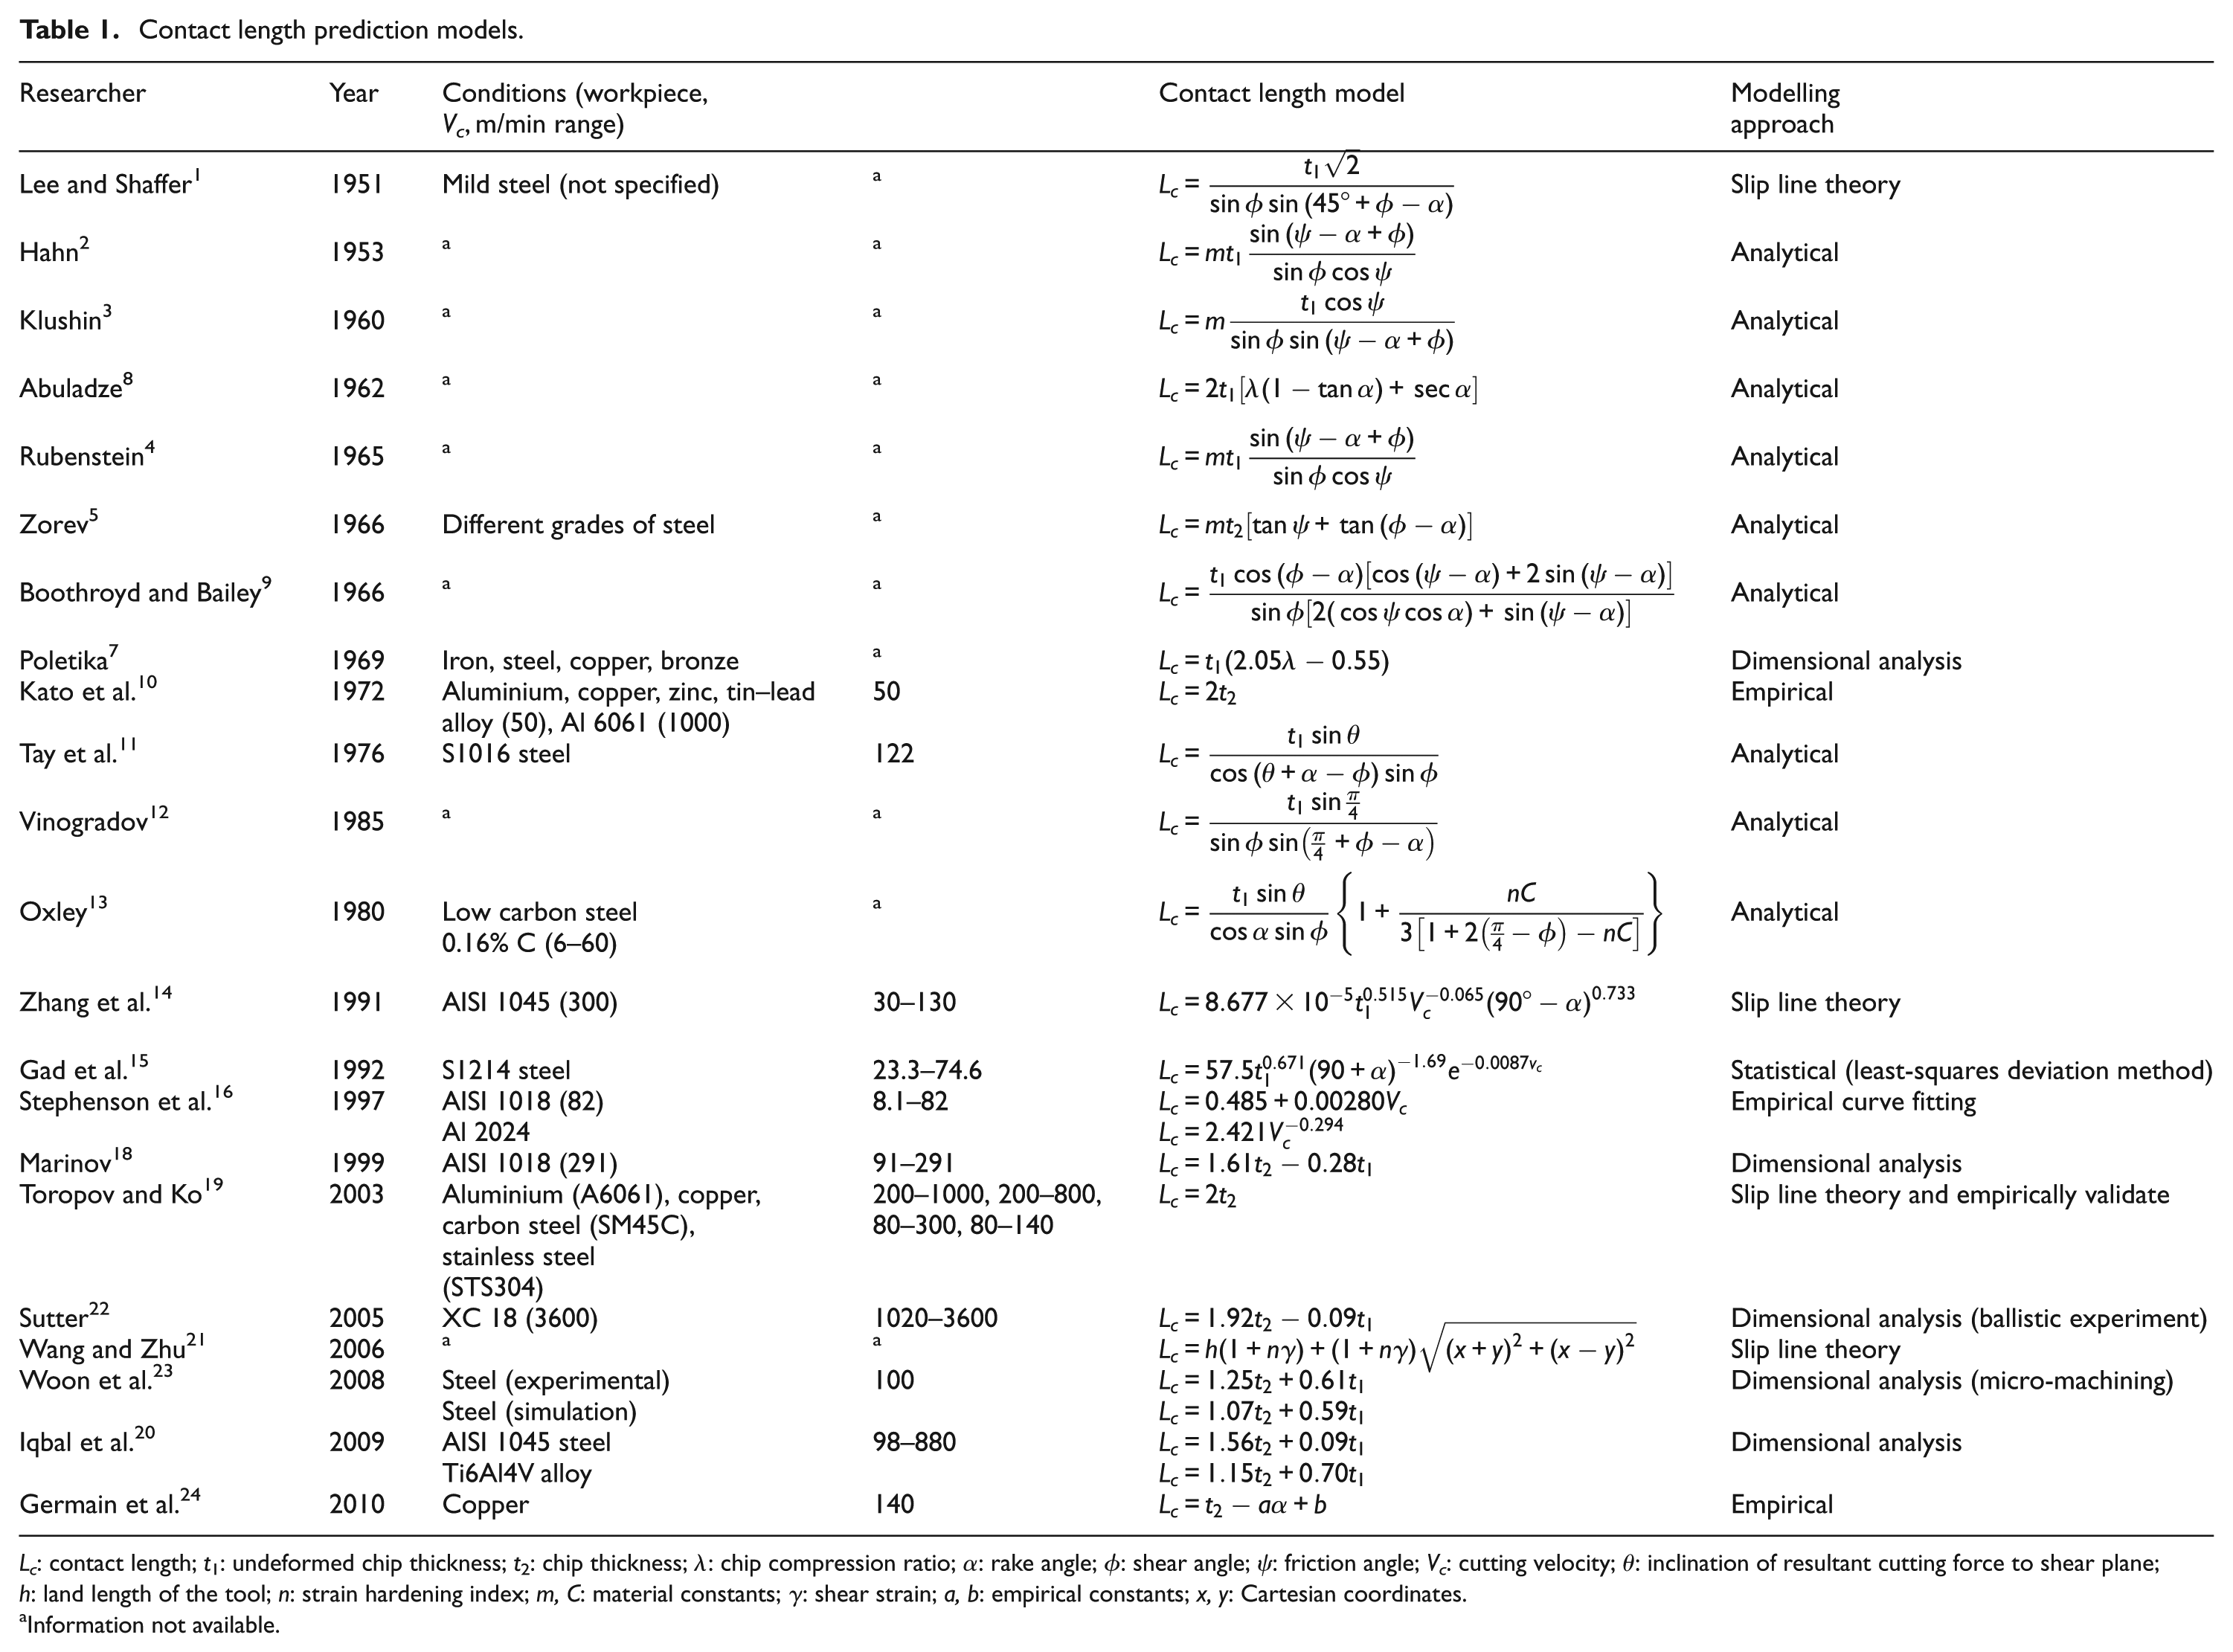
Lc: contact length; t1: undeformed chip thickness; t2: chip thickness; λ: chip compression ratio; α: rake angle; φ: shear angle; ψ: friction angle; Vc: cutting velocity; θ: inclination of resultant cutting force to shear plane; h: land length of the tool; n: strain hardening index; m, C: material constants; γ: shear strain; a, b: empirical constants; x, y: Cartesian coordinates.
Information not available.
In the same era, Hahn 2 developed a model based on the assumption that uniform normal stress distribution acts on the shear plane. Klushin, 3 Rubenstein 4 and Zorev, 5 like Hahn, 2 modelled the contact length by ensuring either chip or force equilibrium considerations. It can be noted that these models contain the unknown parameter ‘m’, related to the stress distribution on the secondary shear zone. Friedman and Lenz 6 viewed the parameter ‘m’ simply as an ignorance factor. It was shown through fitting an appropriate expression to the experimentally measured data to take up the values between −5 and 22.
Other models, based on empirical and analytical studies, were proposed by Poletika 7 and Abuladze, 8 respectively. It can be seen clearly from equations developed by these researchers that tool–chip contact length can be predicted from chip thickness ratio (λ) and undeformed chip thickness (t1). From Boothroyd and Bailey, 9 from information on rake angle, friction angle, undeformed chip thickness and shear angle, the value of contact length can be estimated.
With regard to measurement of a contact length, in most of the early work (i.e. before 1970s), the tool–chip contact length was measured by the microscopic examination of the wear traces left by the chip on the tool rake face1–4,7 or traces of contact zone on the underside of a chip obtained by a quick stop experiment. 9 In one case, 5 the cutting edge and rake face were coated with copper before machining and then wear marks were observed on the tool rake face. However, this technique was suitable for low cutting speed as at higher cutting speed, the coating was oxidised not only in the contact zone but also beyond it. Abuladze 8 measured tool–chip contact length by utilising a technique where traces of workpiece material on the contact surface were identified. This can be done due to the compositional differences between work and tool material. This approach is a precursor to the energy dispersive X-ray analysis (EDXA) method used in this article.
Limited research was done during the 1970s and 1980s on the tool–chip contact length prediction. In 1972, Kato et al. 10 developed an empirical contact length model from cutting tests on ferrous and non-ferrous metals using tools of 20°, 10° and 0° rake angle and a cutting speed of 50 m/min. Stress distribution was plotted against non-dimensional distance (distance/depth of cut) on tool rake face, and from the nature of stress distribution, contact length was suggested. From Kato et al.’s model, a rule of thumb that the contact length can be estimated to be double the undeformed chip thickness was developed. Though crude, this is still a useful and quick indicator of contact length.
Tay et al. 11 used the analytical approach to predict the sticking region of the total contact length for orthogonal machining. The analysis of the deformation zone along the tool–chip interface was obtained using printed grids with quick stop chip sections. In 1985, Vinogradov 12 proposed a contact length model that was very much similar to the equation proposed by Lee and Shaffer. 1 Then in 1980, Oxley 13 assumed that normal stresses are uniformly distributed along the tool rake face and that the resultant cutting force intercepts at half a distance of the contact length. He further assumed that the flow is retarded at the interface with frictional conditions defined by the angle of friction.
After 1990, investigation of contact length models took a new turn as researchers introduced cutting velocity into the contact length estimation models. This is anticipated as it coincides with the era of developments in high-speed machining (HSM). Zhang et al. 14 used microphotographs taken from a device consisting of a camera and strong light source, which closely captured the deformation situation in the cutting. Experiments were performed at the cutting speed range of 30–130 m/min, which is the low end of the conventional cutting speed for machining steels.
Gad et al. 15 also estimated contact length as a function of cutting speed using statistical curve fitting techniques to experimental data. For measuring a contact length, a technique of dyeing the rake face of the cutting tool with a solution of hydrofluoric acid, hydrogen peroxide and ammonium persulfate was used. This solution turns the surface of the tool black, which can be assumed to be only removed from the area where chip had rubbed. The sharp contact between rubbing and non-rubbed region on tool rake face was measured from photographs using a microscope. This model was derived using high-speed steel (HSS) tool material and was tested only up to a cutting speed of 75 m/min. Stephenson et al., 16 based on cutting tests on AISI 1018 steel and Al 2024 using uncoated tungsten carbide tool, developed a model for contact length as a function of cutting speed as the only variable. The tool–chip contact length was measured using wear scar method on worn tool. The cutting speed tested for the experiment was up to 82 m/min, which again is at the lower end of the conventional cutting speed range. The equation for steel, proposed by Stephenson et al., 16 predicts that contact length increases as the cutting speed is increased. This is valid in the HSM regime but does not agree with the well-reported decrease in contact length in conventional machining due to a shrinking of the sliding zone as the cutting speeds are increased. 17
By the end of the millennium, Marinov 18 used dimensional analysis to derive an equation for the tool–chip contact length. The total contact length was measured from traces of chips on tool rake faces. To enable this assessment, the tool rake face was carefully polished and cleaned before each test. Over the last decade in this century, much of the work done on contact length modelling has followed the dimensional analysis approach. However, Toropov and Ko 19 used the slip line theory and a split tool method and predicted the contact length to be twice the undeformed chip thickness. Verification of this model was experimentally performed for different workpiece materials. Contact length was measured using a tool microscope after every cutting test. It can be noted that the equation proposed by Abuladze 8 is identical to Toropov and Ko 19 and Kato et al. 10 for a zero rake angle cutting tool. 20 Thus, three models appear to propose that doubling the undeformed chip thickness is a good estimate for tool–chip contact length. Another approach from Wang and Zhu 21 based on slip line theory included shear strain as a factor in contact length modelling. This model was verified and compared to different tool–chip contact models. The measuring technique for contact length was not specified.
Sutter, 22 Woon et al. 23 and Iqbal et al. 20 followed on and used dimensional analysis methodology to empirically derive the equation for the contact length. Sutter 22 measured tool–chip contact length on the photographic recordings, obtained during the process in real time, whereas Iqbal et al. 20 and Woon et al. 23 measured contact length on worn inserts using optical microscopy. In this approach, a dimensionless ratio formed from cutting variables and contact length were plotted against each other and used to develop a best-fit equation for contact length. It is noted that the model proposed by Woon et al. 23 was for micro-machining, while Sutter 22 and Iqbal et al. 20 derived models for macro-machining. However, dimensional analysis does not explicitly model some of the important parameters that affect the contact phenomenon. This can be a limitation to the usefulness of the model in providing an inferred understanding of the effect of contact phenomenon. In recent years, Germain et al. 24 suggested a contact length model considering the scale effects encountered in super-finishing operations for the orthogonal cutting. Measurement of tool–chip contact length was made on images recorded by high-resolution complementary metal-oxide semiconductor (CMOS) camera.
Research motivation
From the above review, it is evident that a variety of approaches have been used to predict the tool–chip contact length in machining. These models predict contact length as a function of variables such as shear, friction and rake angles, undeformed chip thickness, actual chip thickness, chip compression ratio and in a few cases cutting speed with one case assuming the significance of shear strain. In fact, only three models14–16 reviewed here assumed a physical relationship between cutting speed and contact length. It is also noted that most models were developed based on cutting tests conducted at the lower end of the conventional machining cutting speed range.
There is no general agreement on an appropriate model that can be followed in conventional range as well as HSM regimes. In fact, 22 models have been reviewed here. In the literature, it was noted that most of the existing models quantitatively underestimate or overestimate contact length for conventional and high-speed regimes.17,20 Only Stephenson’s model for steel quantitatively predicts the increase in contact length that is experienced at higher cutting speed in HSM but fails to model the reduction in contact length that is experienced for increased cutting speed in conventional machining of steels. Thus, there is a need to benchmark these models and to understand the factors that drive contact length to increase at higher cutting speed in HSM. This information is fundamental for developing improved mathematical models for contact length prediction.
Experimental details
A series of cutting experiments were performed to study the effect of cutting speed on the tool–chip contact phenomenon and to enable a benchmarking of the existing contact length models. AISI/SAE 4140 (Rockwell Hardness 23.9) high tensile alloy steel was used as a workpiece material for the experiments. Steels are widely studied in finite element modelling and contact length modelling and are a good choice for benchmarking contact length models. For orthogonal cutting tests, the workpiece material was machined to a tube of thickness 2.5 mm and had an outer diameter of 200 mm. The large workpiece diameter was used in cutting experiments to generate high cutting velocities. All experiments were performed under dry cutting conditions and were repeated three times. The orthogonal experiment set-up is shown in Figure 1. The cutting forces in the velocity and feed direction, Fv and Ff, respectively, were measured with a piezoelectric Kistler dynamometer type 9263.
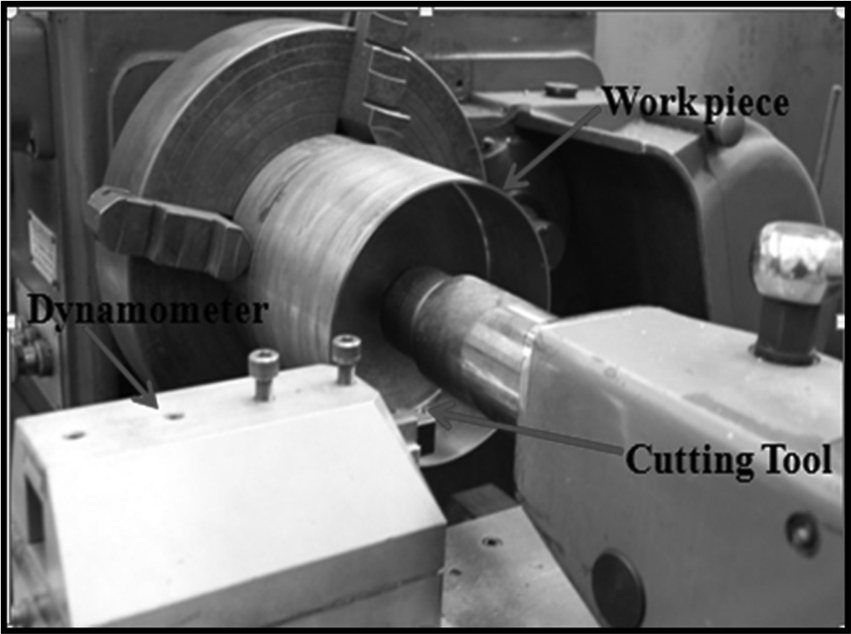
Set-up for orthogonal cutting tests.
Commercial uncoated cemented carbide inserts, Sandvik TCMW 16T308 5015, were used in these experiments. The rake face geometry of the cutting inserts was chosen so as not to restrict the contact length. These inserts were mounted on Sandvik STGCR 2020k-16 tool holder. The tooling system had a zero rake angle and a 7° clearance angle. The cutting tests were performed at seven different cutting speeds of 198, 314, 394, 565, 628, 785 and 879 m/min. The range of cutting speeds was selected so as to include speeds from conventional to HSM regime. The specific values were set by the selectable speeds on the Denford lathe machine and the workpiece diameter. The machine tool was selected for its rigidity and easy access for mounting the dynamometer. The cutting length for each experiment was kept constant at 5 mm to reduce the effect of tool wear. The feed rate and depth of cut were also kept constant at 0.16 mm/rev and 2.5 mm, respectively.
The chips produced during the cutting tests were collected, and the length and weight of the chips were measured. This was used to calculate the chip thickness based on the material density and geometry of the chip. The contact length and area were measured on the used inserts by inspecting the contact tracks from scanning electron microscopy (SEM) images.
Results and discussions
The criterion used for evaluation in this article is rake face contact length. This is based on orthogonal cutting tests for tool steel. Orthogonal modelling is a widely accepted method for developing machining process science and comparing machining data. The other parameters reported in the graphs are key process variables that would influence contact length. These provide data that are needed to evaluate contact length using the models in Table 1.
Tool–chip contact length
Contact length was measured by sizing wear tracks on the cutting tool rake face. The contact area is irregular, and in this study, contact length was measured on 10 contact tracks perpendicular to the cutting edge. These 10 tracks covered the width of the contact area, and the lines run from the cutting edge to the end of the contact area. As mentioned before, all the experiments were run three times. Figure 2(a) shows an optical microscope image of the contact length, while Figure 2(b) shows the variation of contact with cutting velocity. The contact length obtained from the rake face tracks was also further checked by the EDXA on the rake face where the transfer of iron from the chip was quantified. The area beyond the tool–chip contact area would have negligible iron concentration except that coming from the insert manufacturing processes (some carbide inserts have traces of Fe). From this graph, it is clear that the contact length decreases with an increase in cutting speed within the conventional cutting speed range. This decreased trend has been reported previously in the literature.15,17,25 According to Schulz and Moriwaki, 26 the onset for HSM for steel should be about 600 m/min cutting velocity. In agreement with Abukhshim et al., 17 an increase in the contact length is observed in machining at higher cutting speeds in the HSM regime. To represent the general trend followed by tool–chip contact length for any combination of data, a best-fit line with R2 of 0.93 is included in Figure 2(b).

(a) Micrograph of a worn insert showing a portion of the contact area and length at 628 m/min cutting velocity and (b) variation of tool–chip contact length with cutting velocity.
Cutting forces
Figure 3 shows the variation of the cutting forces with the cutting speed. Generally, it is noted that both the cutting force and the feed force decrease as the cutting speed is increased. This result is in agreement with results reported in the literature and has been attributed to the reduction in the flow stress of the work material at elevated temperatures. 20 Furthermore, it is also observed that as the cutting speed is increased from 565 m/min, both the cutting force and the feed force slightly increase. This increase in the forces could be influenced by an increase in contact length at higher cutting speed.
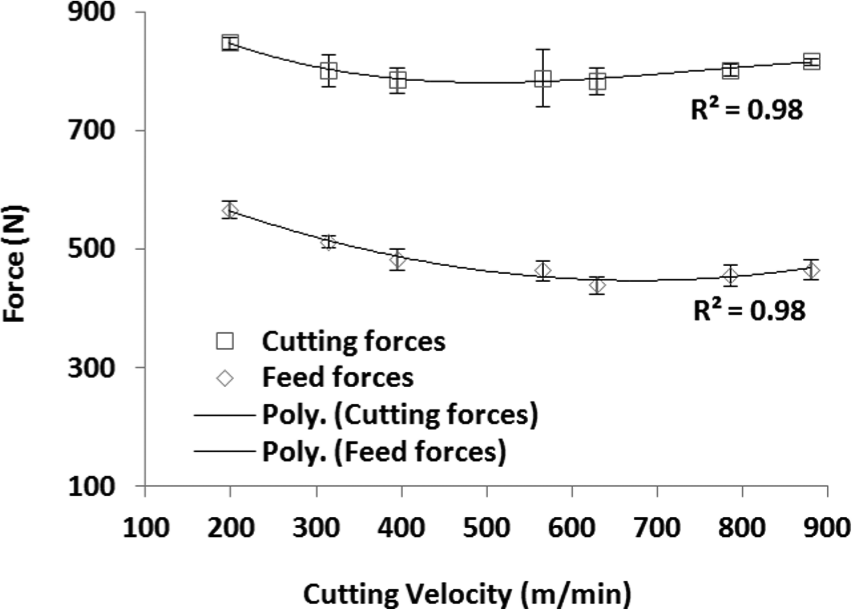
Variation of cutting forces with the cutting velocity.
Shear angle, friction angle and inclination of resultant force angle
Experimentally, shear angles can be determined by quick stop cutting processes, and an image of the shear zone obtained with the help of microscopy photographs. Quick stop experiments are normally ideal at very low cutting speeds. They hence do not elucidate the mechanics in HSM. Alternatively, as is the case in this article, shear angles can be determined from the geometry of chip formation process following equation (1). This equation can be developed from the velocity diagram or the process mechanics in orthogonal machining
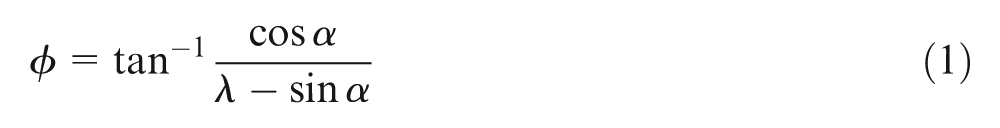
where ϕ is the shear angle and λ is the chip compression ratio. The rake angle α is determined from the cutting inserts and the tool holder.
Experimental and theoretical work on metal cutting assumes that the friction conditions at the tool rake face are represented by the friction angle ψ. This can be evaluated from the normal (FN) and frictional forces (Ffr) by equation (2)
The forces Ffr and FN are related to the cutting force (Fv) and the feed force (Ff) components through equations (3) and (4). These equations can be derived by resolving the cutting and feed forces in the direction along and normal to the rake face


where α retains its usual meaning.
The inclination angle of the resultant force to the shear plane, from equation (5), depends on the shear angle, friction angle and the rake angle

Figure 4 shows the variation of the angle parameters with cutting speed. With increasing cutting speed, friction angle and the angle of inclination of resultant force to the shear plane show a decreasing trend. Generally, the shear angle shows an increasing trend for all cutting speeds.
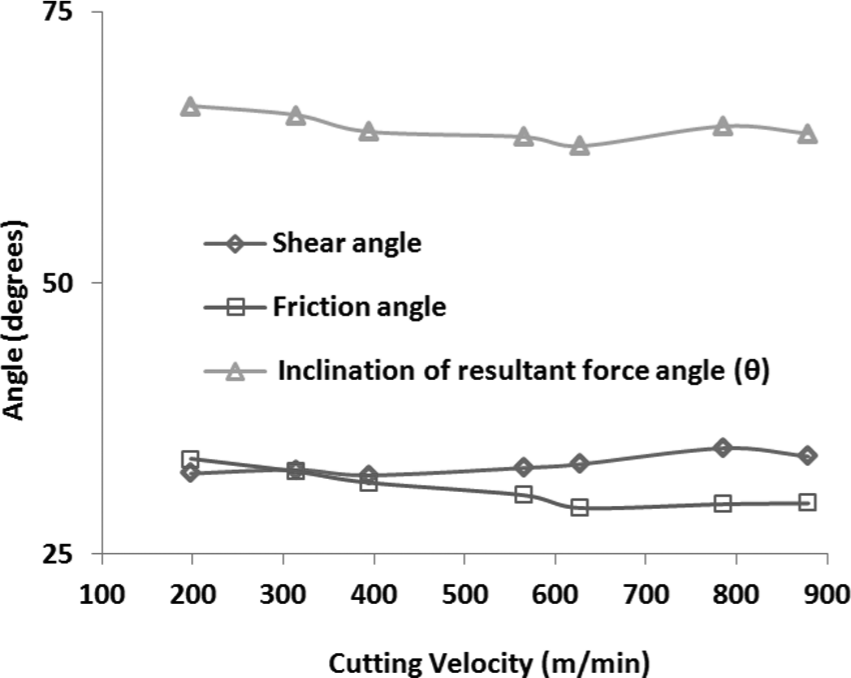
Variation in the angle parameters with the cutting velocity.
Chip compression ratio and friction coefficient
Figure 5 shows the chip compression ratio and the friction coefficient. These decrease with increase in cutting speed. An increase in the cutting speed leads to an increase in the chip temperature and a reduction in chip thickness. At the higher cutting speed of 879 m/min, again the compression ratio is increased. The increase in tool–chip contact length appears when there is a cutting enlargement and some edge chipping as shown in Figure 6.
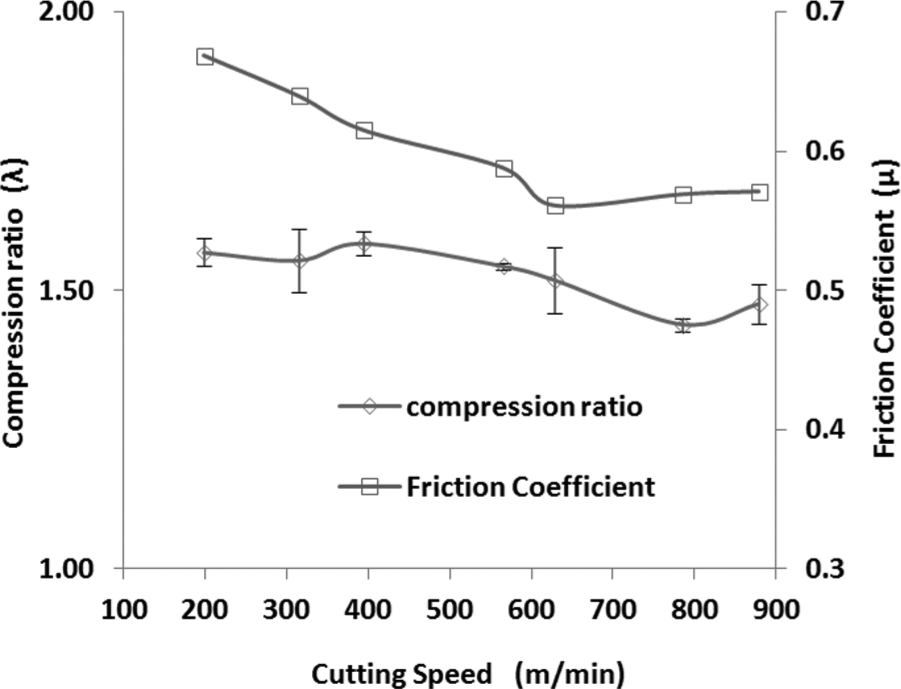
Variation of chip compression ratio and friction coefficient with the cutting velocity.
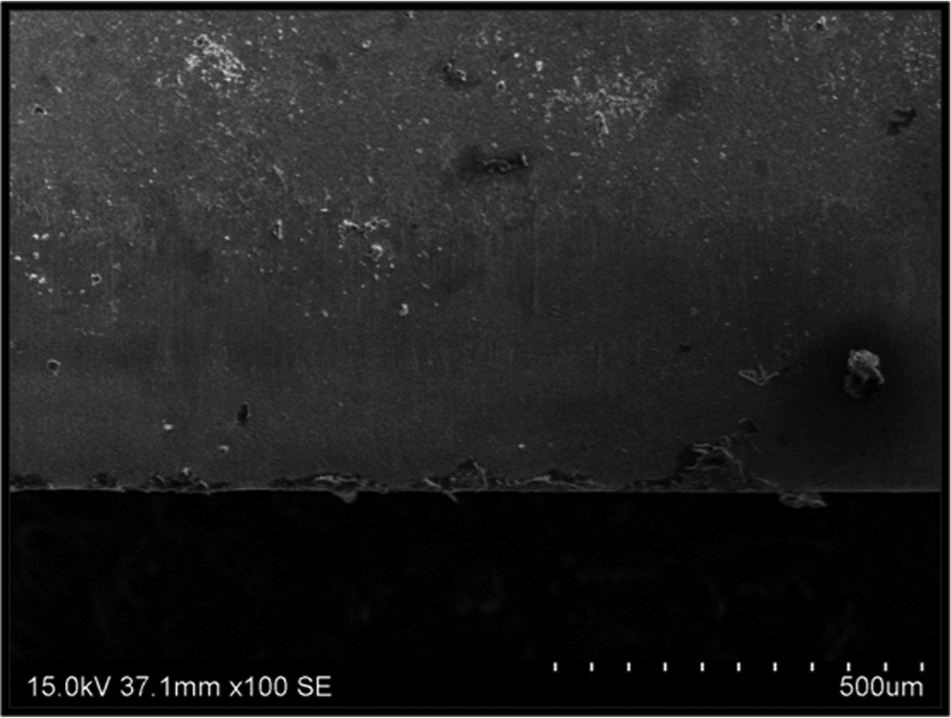
Edge chipping at the cutting speed of 879 m/min.
Tool wear
In this study, used inserts were examined to calculate the flank wear. This was done using an optical microscope and image processing software. Flank wear land was measured on 10 different locations on the clearance face of inserts for all three trials, and average values are plotted in Figure 7. It can be seen from Figure 7 that for a constant linear length of cut of 5 mm for all the selected cutting velocities, the values of flank wear were very low with a range from 0.023 to 0.080 mm. This flank wear is not expected to significantly influence the effective rake angle and hence contact length. The increase in flank wear for higher cutting velocities is expected due to higher thermal loads.
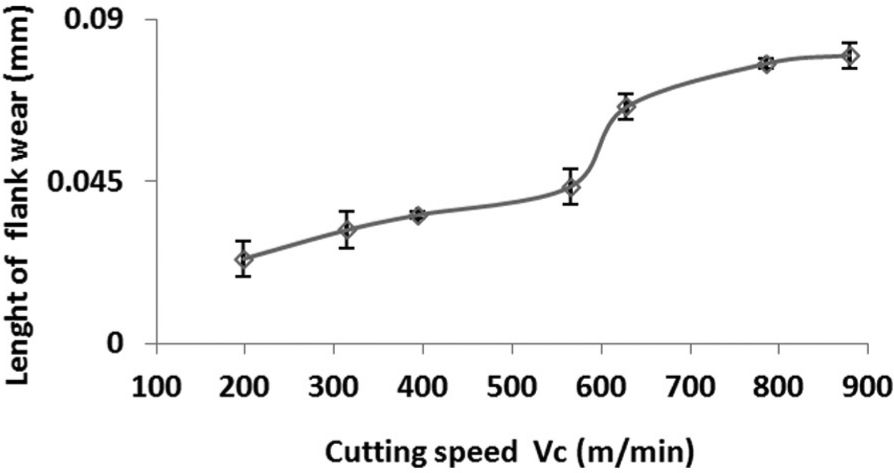
Variation of average flank wear land with cutting speed.
Other than rake angle, the cutting forces can be another factor that can be used to infer contact length growth. Figure 8 shows the time-domain increase in cutting forces for three selected cutting velocities. It is clear from the time-domain force trend that the period for tool’s cutting-edge full engagement is very rapid. After this transient period, the forces stabilise or fairly increase at a steady and slow rate. The contact area is expected to increase in the engagement period and then remain fairly consistent as inferred by the cutting and feed forces. At the higher cutting velocity of 879 m/min, as shown in Figure 8(c), the forces rise to a steady state in 0.1 s, which is less than 6% of the total cutting time. So the transient period of the process is neither prolonged nor significant in this study given the additional fact that the total machining linear length is limited to 5 mm and less than 80 µm of flank wear is experienced. Additionally, crater wear was not noticeable.
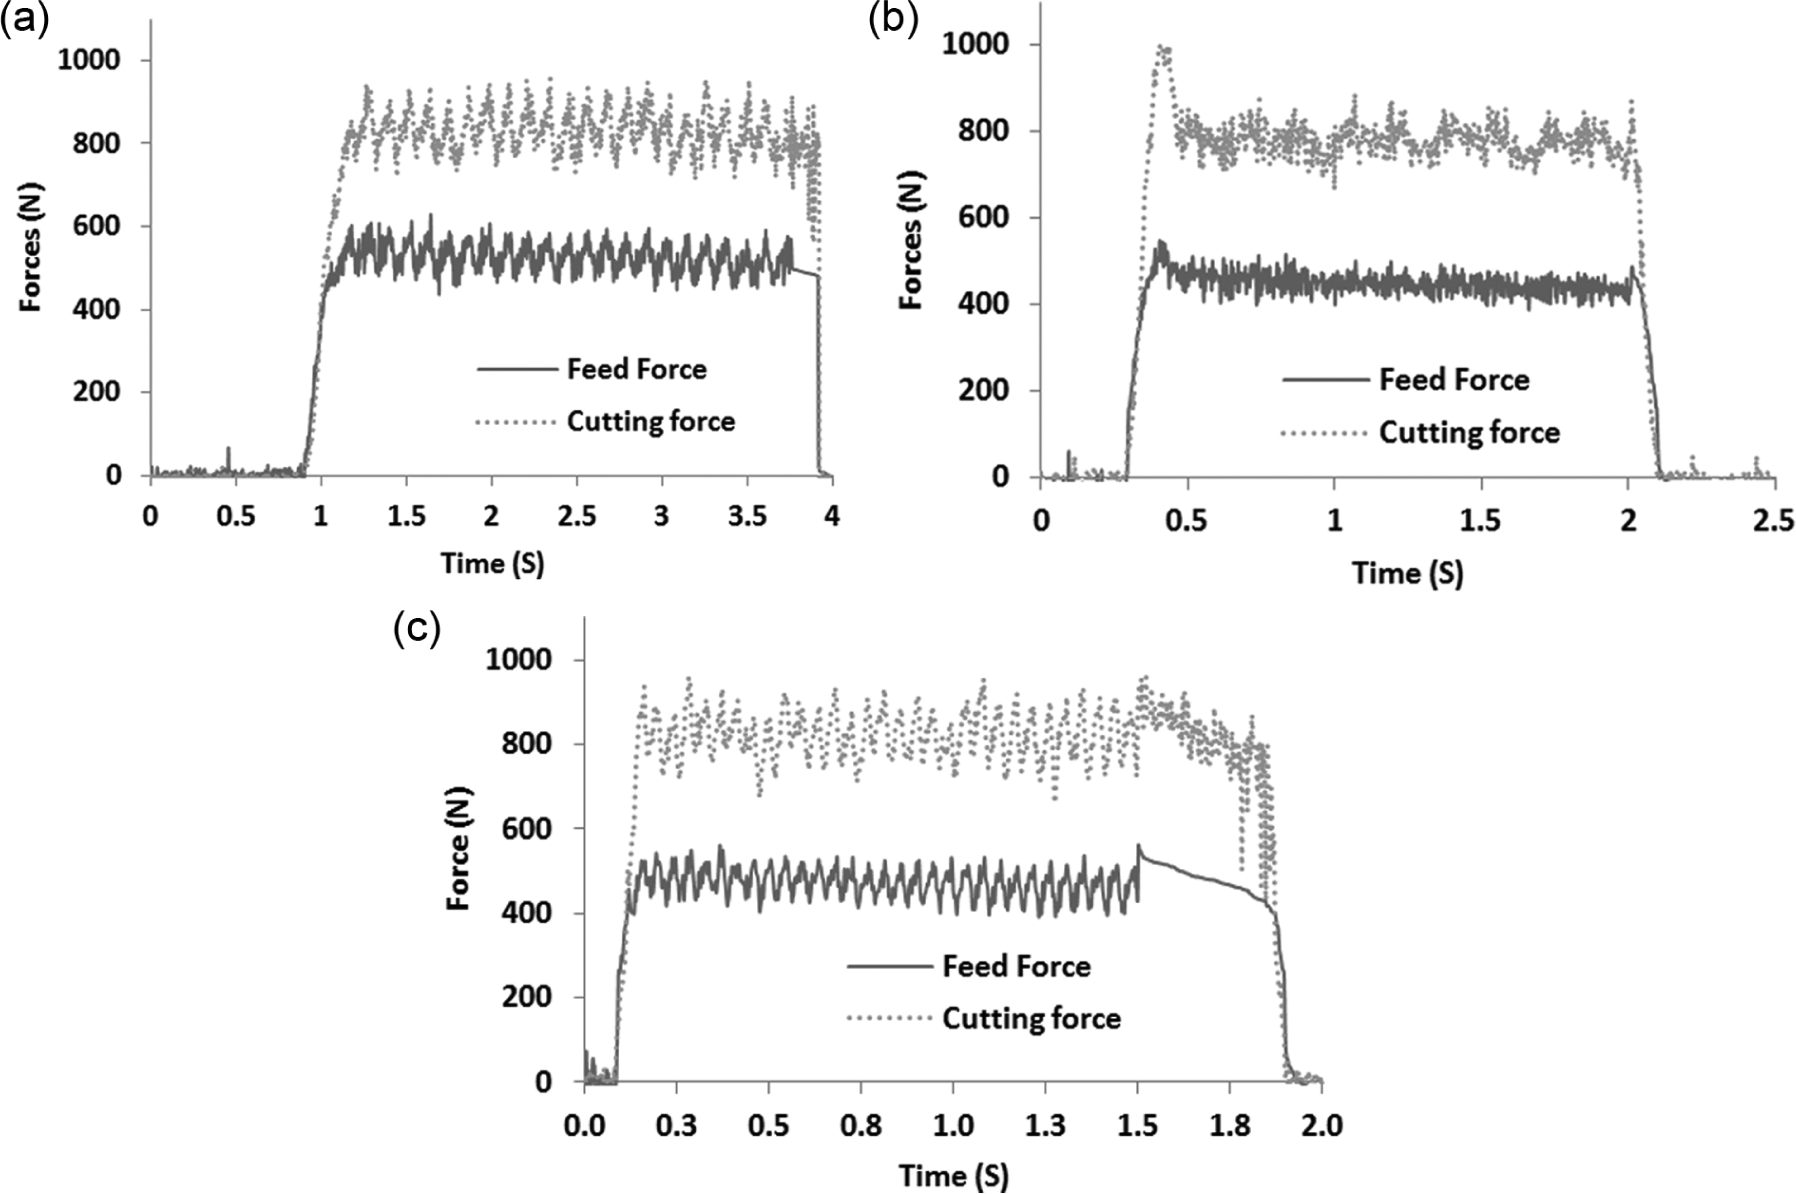
(a) Time-domain force evolution for a cutting velocity of 314 m/min, (b) 626 m/min and (c) 879 m/min.
Benchmarking of existing contact length models
Figure 9 shows the comparison of contact length models listed in Table 1 with the experimental data. Abuladze 8 overestimated the measured contact length with a large margin; therefore, it was not shown in Figure 9. The models by Hahn, 2 Klushin, 3 Rubenstein 4 and Zorev 5 are not included in Figure 9 as they required additional data for unknown parameters such as m. Similarly, the models by Oxley, 13 Wang and Zhu 21 and Germain et al. 24 were excluded due to unknown experimental parameters like m, n, a and b. There are no universal constants that can be used for all combinations of workpiece materials and tooling. These unknown parameters are associated with stress distributions. Stress distribution on the rake face was not evaluated in this study. A split tool dynamometer is required for this, which is not ideal for high-speed cutting tests. However, in the interest of exploring their accuracy, these models were plotted in Figure 10 using values of constants specified in their research study. Hahn’s 2 model has similar predictive capability to Tay et al’s 11 model. Rubenstein 4 and Hahn 2 proposed similar models with only a difference in the range of ‘m’ value. This is further evidence that the unknown constants were just a way to match the model to the experimental findings, as suggested by several other researchers.6,15,27 Klushin’s 3 model was plotted for the two extreme values of the m range specified in his research. Predicted contact lengths by Klushin’s 3 model either underestimate or overestimate the empirical results with reasonably large deviation. However, an average value of m if used would give a very good predictive capability. Establishing a scientific basis for the value and magnitude of these matching coefficients would help elucidate the range of parameters that influence contact length. Wang and Zhu’s 21 model was not included in Figure 10 as information regarding unknown parameters was inadequately specified in their research study.
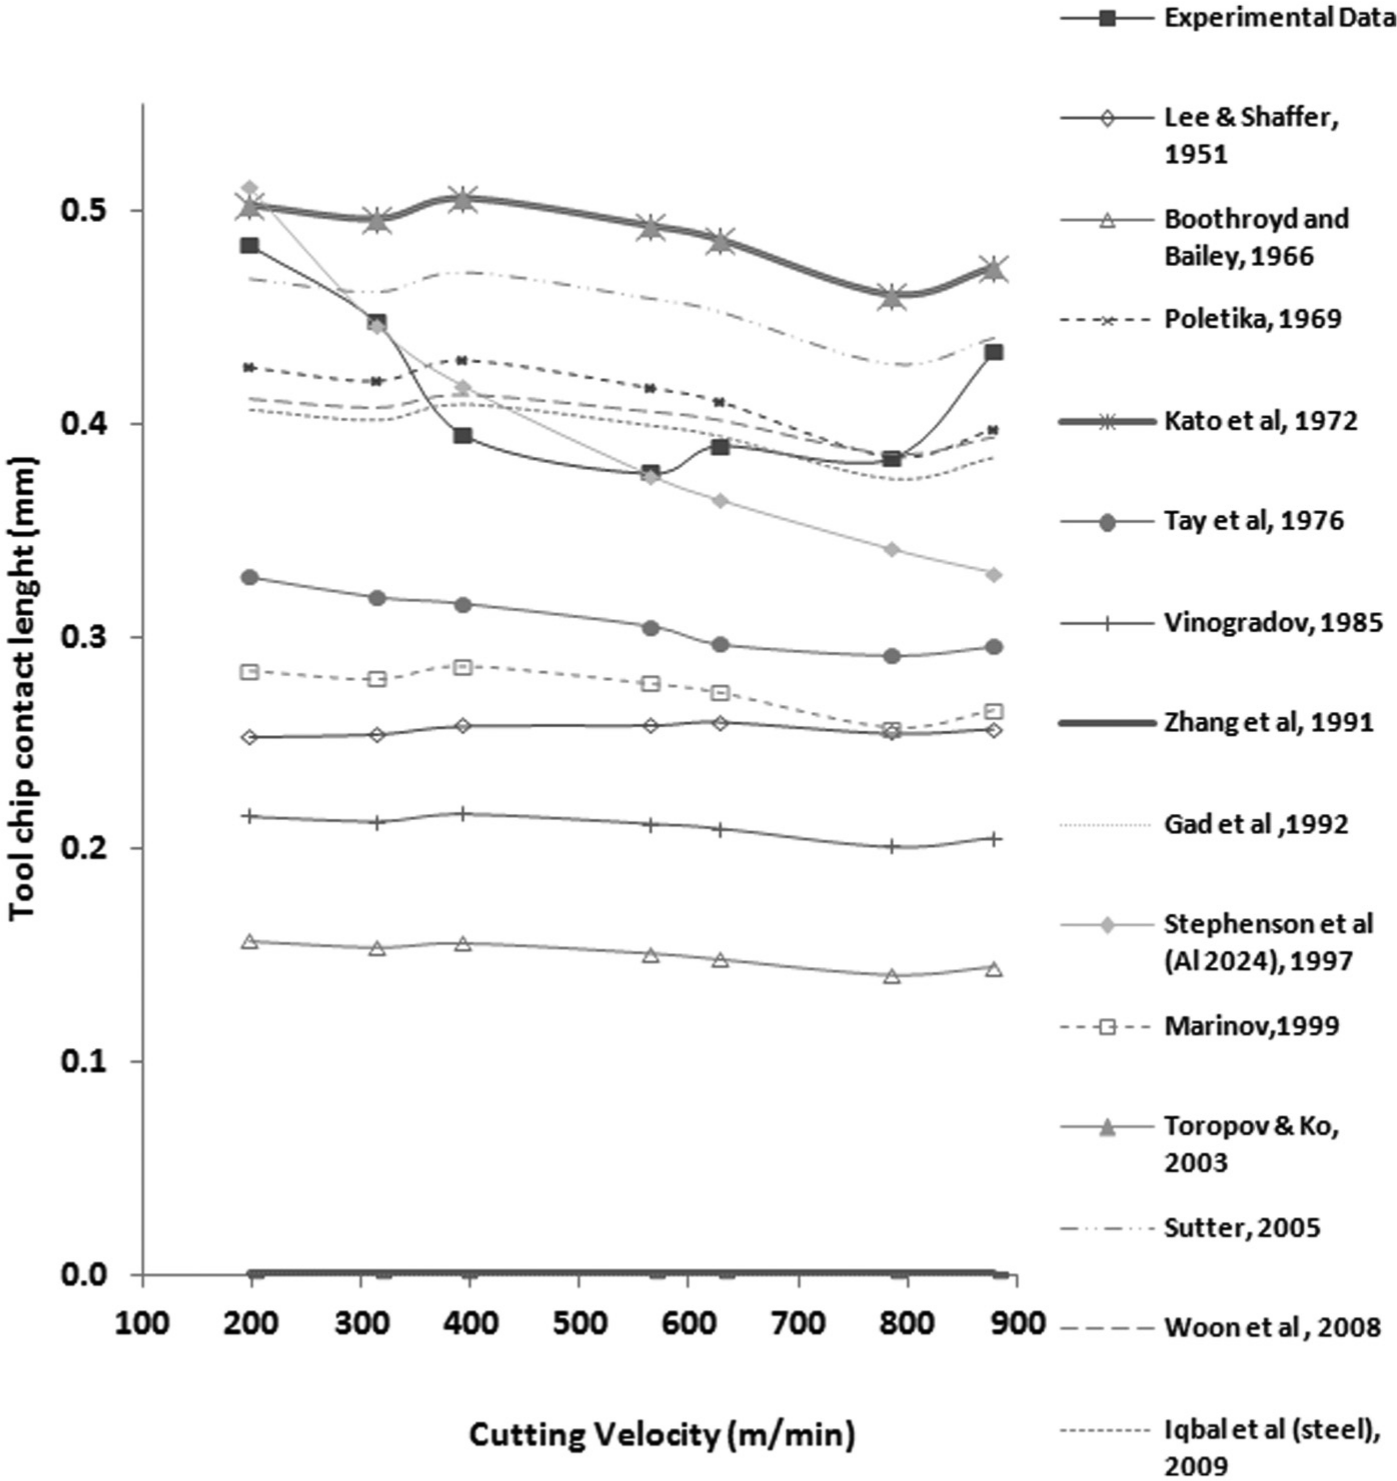
Benchmarking of contact length models.
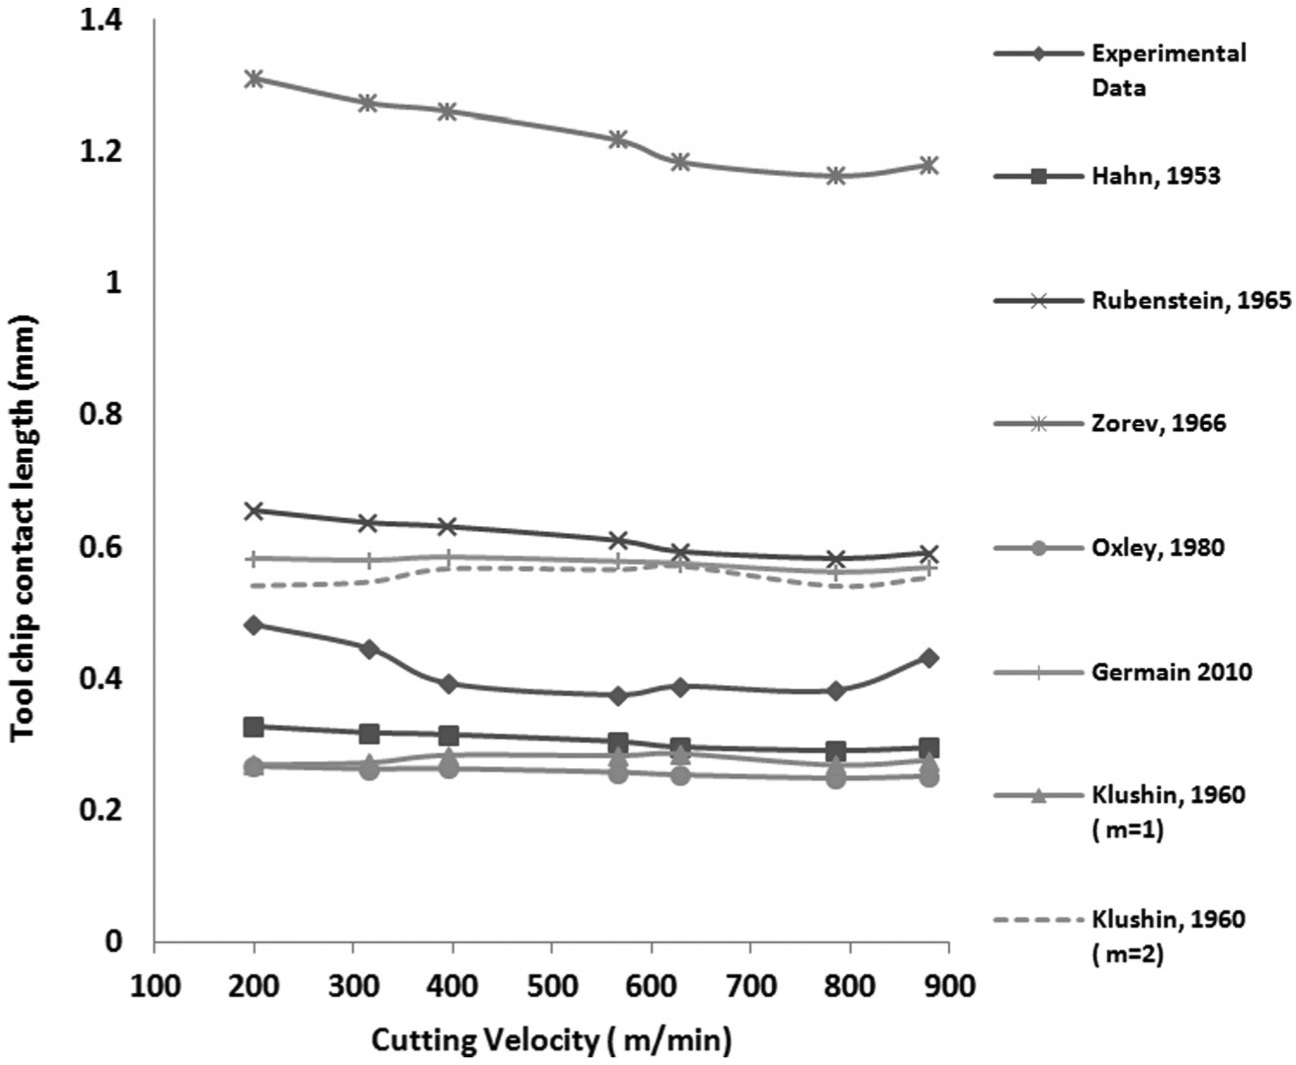
Comparison with experimental contact length data for models that have matching coefficients.
The predictive capability of all models was quantified as a degree of accuracy by subtracting the average predicted contact length from the average measured contact length and dividing this difference by the measured contact length. This was then expressed as a percentage, and the data is shown in Table 2. Models based on dimensional analysis methodology achieve the highest degree of accuracy in terms of showing lower deviation percentage from measured contact length. These models proposed by Iqbal et al., 20 Woon et al. 23 and Poletika 7 fit very close to the empirical data, except at the cutting speeds of 198 and 879 m/min, where an underestimation of contact length is predicted by these models. The exception is Marinov’s 18 dimensional analysis model, which underestimates the measured contact length. The contact length model by Woon et al. 23 comes out to be close to the measured data despite being derived for micro-machining. Sutter’s 22 model fits well at the extreme ends of the speed range but fails to capture the decrease in the contact length at intermediate speeds.
Percentage deviation of model predicted contact length from measured contact length.
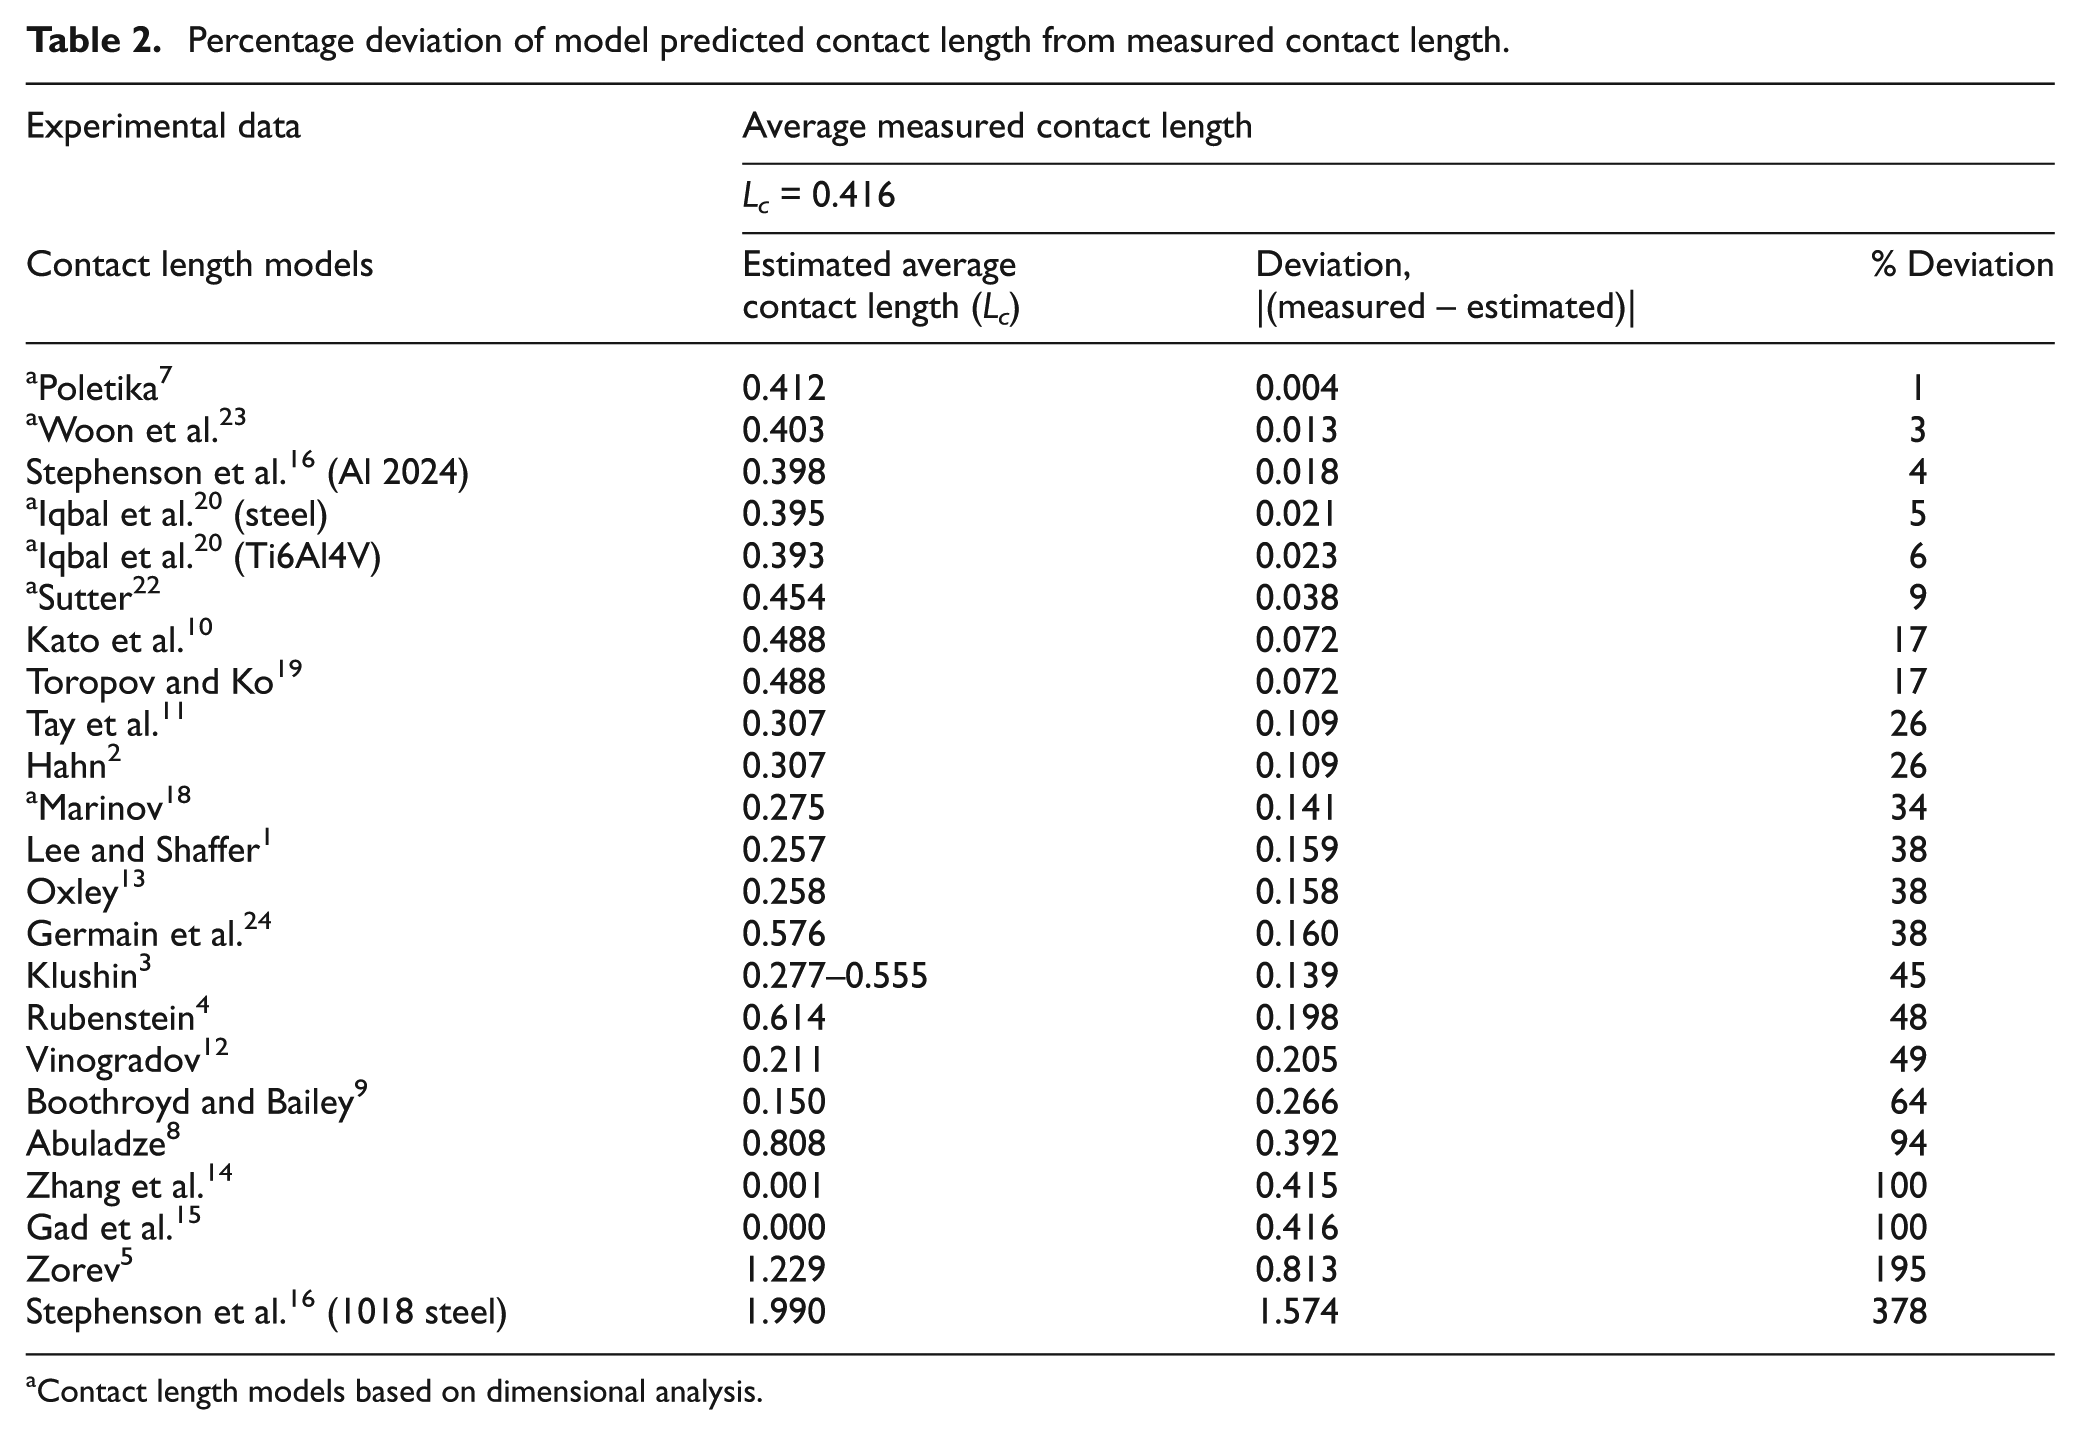
Contact length models based on dimensional analysis.
On the other hand, analytical studies by Lee and Shaffer, 1 Boothroyd and Bailey, 9 Vinogradov 12 and Tay et al. 11 provide a conservative estimation of contact length. They neglect the cutting speed dependency of contact length, whereas the models by Toropov and Ko, 19 Kato et al. 10 and Abuladze 8 overestimate the measured tool–chip contact length.
Like Sutter’s, 22 Toropov and Ko’s 19 and Kato et al.’s 10 models were much closer to the end points and deviate from the intermediate data points. Like other dimensional analysis–based models, they are also a function of actual chip thickness. However, it can be argued that they fail to capture the decrease in contact length for increased cutting speeds in conventional machining. Additionally, it is clearly seen from Figure 9 that curves for Toropov and Ko 19 and Kato et al. 10 overlap with each other. This is because they reduce to the same model.
Models incorporating cutting velocity showed extremely large deviation from the measured contact length. Stephenson et al.’s 16 model for steel can be considered ambiguous as it gives a contact length of 0.485 mm for a zero cutting velocity, whereas Stephenson et al.’s 16 model derived using aluminium as work material shows lower deviation from experimental results but fails to capture an increase in contact length at high cutting speed. Furthermore, this model only depends on the cutting velocity. Gad et al.’s 15 and Zhang et al.’s 14 model show negligibly small contact length.
Suggestions for improving modelling approach
It is proposed in the literature that the tool–chip contact length is dependent on chip morphology and cutting conditions. 17 Reviewed models in this study quantitatively model the effect of angle parameters or chip morphology or both. Few models take into account the effect of cutting speed, but these are unable to predict contact length adequately as they exclude other parameters. Though models by Hahn, 2 Klushin, 3 Rubenstein 4 and Oxley 13 account for almost all important parameters, they contain parameters ‘m’, ‘n’ or ‘C’. There is need for research and understanding to define the physical significance or rationale for these empirical constants that are used to match models to experimental data. It is noted that Tay et al.’s 11 contact length model accounts for a number of important angle parameters and the chip thickness. While it underestimated contact length, it is very close to measured contact length when compared to other non-dimensional analysis–based models. It can therefore be considered as a building block for improving contact length modelling. For these reasons, Tay et al.’s 11 equation was selected for further analysis and is represented here as equation (6) to aid the discussion.
Tay et al. 11 assumed that sticking contact extends over the entire contact length. The point at which the sticking contact ends was located, such that the line from the end of shear plane to this point is parallel to the resultant force vector (Figure 11). On this basis, equation (6) was developed
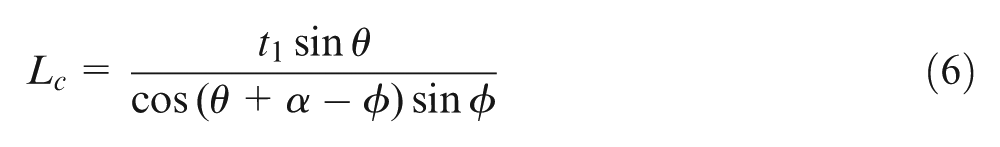
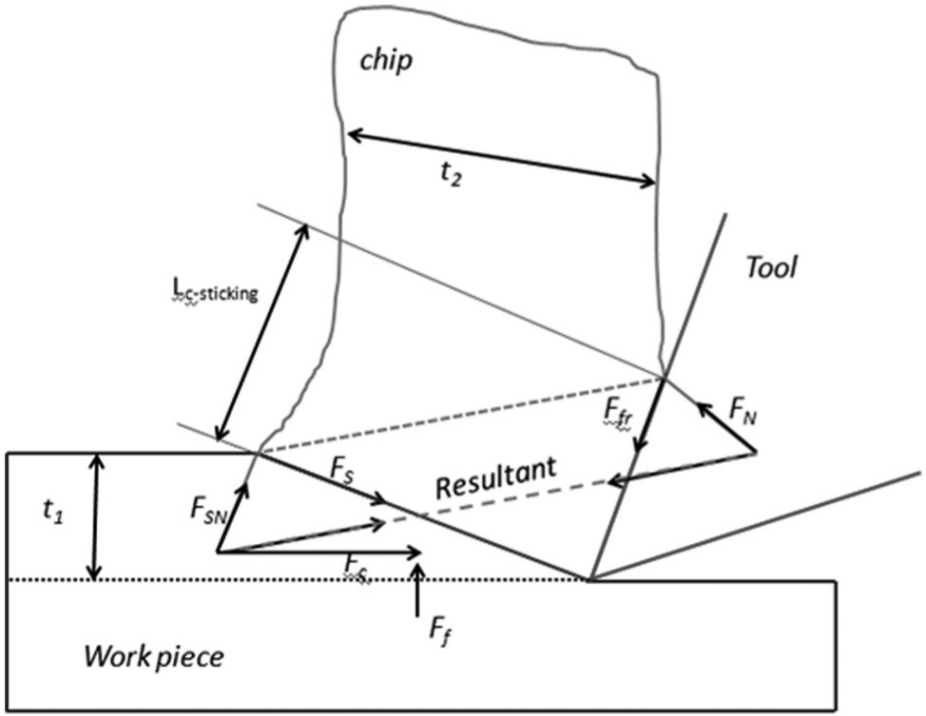
Adapted from Tay et al.’s 11 scheme for tool–chip contact length modelling.
It can be seen clearly from equation (6) that tool–chip contact length proposed by Tay et al. 11 depends on the shear angle, friction angle and resultant force inclination angle and undeformed chip thickness.
Figure 12 shows that the contact length estimated by Tay et al.’s 11 equation based on uncut chip thickness underestimates the contact length not only in HSM regimes but also in conventional range. It is accepted that at any instant, there are normally two types of frictional behaviour at the tool–chip interface: sticking and sliding frictions. Yet, Tay et al.’s 11 model was developed on the assumption that the contact length was predominantly sticking. This is unlikely to be the case in conventional machining or machining with cutting fluids. Figure 12 shows that if Tay et al.’s 11 model is implemented using the actual chip thickness instead of the undeformed chip thickness, then the model quantitatively predicts to a better accuracy the contact length at the extreme values of the cutting speed range used. However, it overestimates the contact length in the intermediate speeds. In this region of concern, it is well known that the sliding contact length reduces with increase in cutting speed in the conventional machining region and sticking contact dominates the contact phenomenon in the high-speed regime. The outlook for contact length modelling and the scientific challenge is to translate these trends into a quantifiable impact on contact length. This can then enable an improved model that takes into account more process parameters.
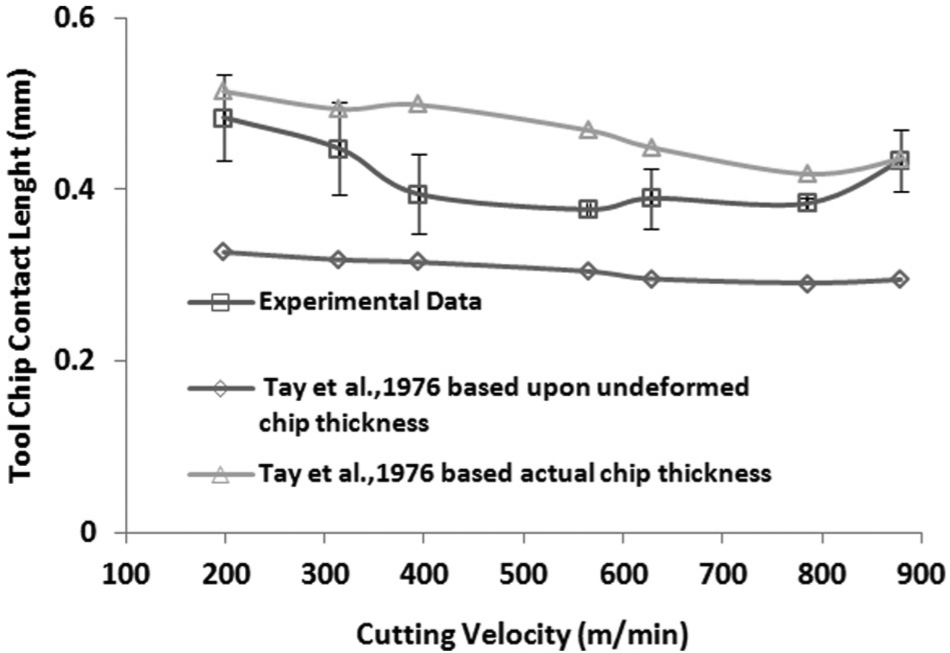
Tay et al.’s contact length model based on undeformed and actual chip thicknesses.
In machining studies, EDXA has been used to show the amount of Fe transfer from the chip to the tool rake face in machining steels. This can be used to infer the existence of sticking contact on the secondary deformation zone. Figure 13 shows the amount of iron transfer from the workpiece to the rake face of the tool at the cutting velocity of 198 m/min. For the shown cutting velocity, a small percentage of iron was detected, supporting dominant sliding at low speed. To save space, the percentage area of the rake face with dominant Fe concentration and hence inferred sticking is given in Figure 14 for the cutting speeds tested. It is clear that the extent of sticking contact is cutting speed dependent and dominant at high cutting speeds. This is another factor that influences contact length. The quantification of its impact is an open area for research.
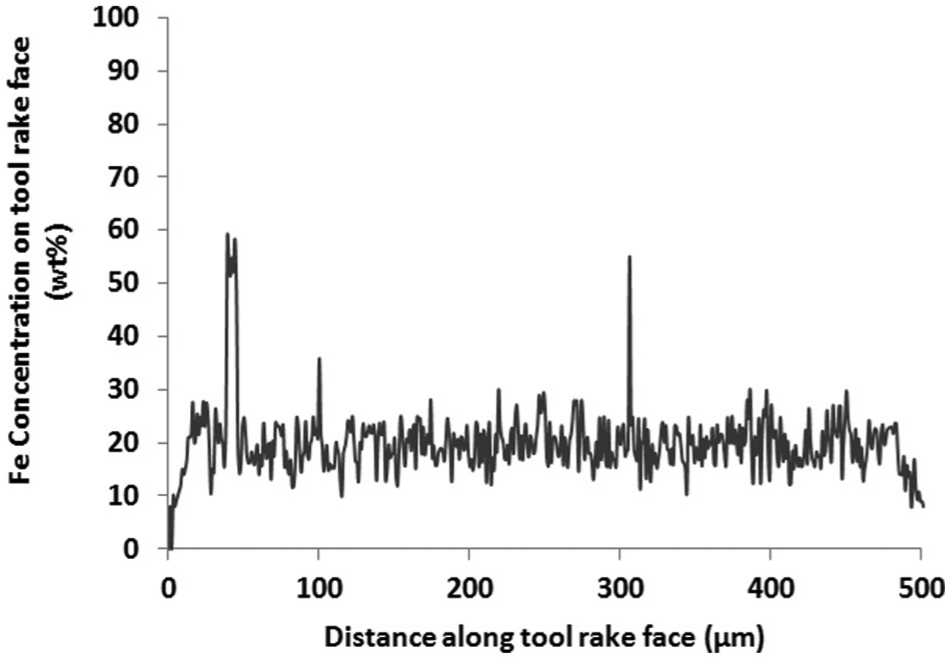
SEM EDXA iron density map along the tool rake face.
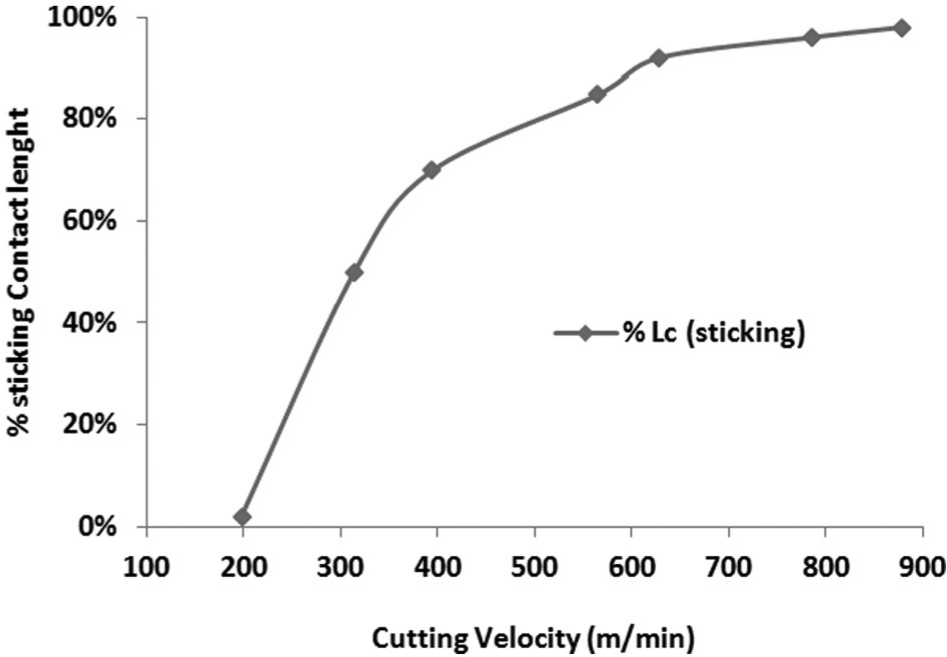
The change in percentage of contact area that is in sticking contact.
Conclusions
The contact length provides a path of heat transfer from the chip to the tool, and the thermal load can induce wear mechanisms or thermal expansion. There is thus a need to reduce the size of the tool–chip contact length. For inserts without special rake face design, the unconstrained tool–chip contact length has to be controlled by the choice of machining variables or conditions that influence contact phenomenon such as tool coatings and lubricants.
In conventional machining of steels, it is well established that contact length reduces with increase in cutting speed. In HSM, sticking contact dominates the contact phenomenon and contact length increases with cutting speed.
While at least 22 models have been developed to estimate contact length, the models developed from dimensional analysis appear to be superior in terms of their ability for a high degree of quantitative prediction (to within 10% of measured contact length). Unfortunately, dimensional analysis–based models are empirical and may miss elucidating the influence of other significant process parameters. The dimensional analysis models only model the effect of chip compression ratio and chip thickness.
The balance between sliding and sticking contact areas is influenced by cutting velocity. Thus, addressing this phenomenon can help to develop models that are valid for a wide range of cutting speeds. Analytical models, such as Tay et al.’s model, that take into account other factors such as shear angle, rake angle and so on can further be improved if the effect of sticking and sliding on contact length can be explicitly modelled. This requires further scientific analysis to establish the mathematical basis. EDXA can be useful in throwing light on the extent of material transfer from the chip to the tool and hence defining sticking contact.
Footnotes
Appendix 1
Funding
This research received no specific grant from any funding agency in the public, commercial or not-for-profit sectors. However, the authors acknowledge the contribution of NED University, Pakistan towards the support for PHD.