
Abstract
This contribution deals with a computational investigation highlighting the effects of cutting speed and depth of cut on chip morphology and surface finish for down-cut milling case. The global aim concerns the comprehension of multiphysical phenomena accompanying chip formation in rough, semifinish, and finish cutting operations, exploiting a three-dimensional finite element model. Numerical work has been performed in two phases. In the first phase, a three-dimensional model for rough cut operation has been validated with the experimental results, including chip morphology and cutting force evolution for an aerospace grade aluminum alloy A2024-T351. In the second phase, the model has been extended to semifinish and finish three-dimensional cutting operations. The numerical findings show that as depth of cut decreases (toward finish cutting), spatial displacement of workpiece nodes along the depth of cut increases. This represents an increase/extension in the percentage of volume undergoing shear deformation, resulting in higher dissipation of inelastic energy, hence contributing to size effect in finish cutting operation. The results also depict that material strain rate hardening enhances the material strength at higher cutting speeds. These material strengthening phenomena help to generate a smooth continuous chip morphology and better surface texture in high-speed finishing operations. The study highlights the significance of three-dimensional numerical modeling to better understand the chip formation process in semifinish and finish machining operations, regardless of the immense effort in computational time.
Keywords
Introduction
Finite element (FE) modeling of machining processes is an effective scientific method to get insight knowledge of multiphysical phenomena, especially in the vicinity of tool workpiece interaction. These models help to ameliorate the production efficiency, on one hand, by efficient selection of cutting tools in terms of their material, coating, geometry, and so on and, on the other hand, by generation of database of optimal cutting parameters. The FE models even help to select machine tools in aspect of their stiffness and damping characteristics, to avoid the cutting vibrations and to smooth the cutting operation, as recently discussed by Asad et al. 1 in their proposed hybrid dynamic cutting model. Their numerical model highlights the importance of cutting tool stiffness and damping characteristics on chip formation process.
Fore-sighting the potential of FE methods in comprehending the cutting phenomena, efforts had been started since 1970s to model the machining process by FE methods. Tay et al. 2 were among the pioneers, who developed an initial two-dimensional (2D) FE-based orthogonal turning model. They investigated the temperature fields in the chip and cutting tool.
Since then valuable researches have been made to unveil this complex phenomena. An exhaustive literature covering various aspects of machining phenomena is now available.3,4 However, owing to several complexities, simplifications are made, and 2D FE models based on plane strain assumption have been reported in the literature most of the time.5,6
This assumption works well in machining,
The 3D models are also essential to deeply explore some aspects of cutting phenomena that cannot be realized with 2D models, as outlined by numerous researchers in last decade. For example, Ceretti et al. 7 have presented a 3D oblique machining model and studied the presence of lateral cutting forces, which otherwise are not possible to predict with 2D models. Their model shows a good correlation with experimental results. While Attanasio et al. 8 have recently presented a 3D tool wear model. They have numerically predicted the insert wear (flank and crater), when cutting is performed with the nose of the insert at various entering angles.
The present contribution develops a distinct 3D numerical approach based on FE method to improve the comprehension of physical phenomena accompanying the machining of an aerospace grade aluminum alloy A2024-T351. In this exclusive study, capabilities of FE code Abaqus®/Explicit (version 6.9.1) have been exploited to study the effects of depth of cut and cutting speed on surface texture and chip morphology for rough, semifinish, and finish cutting cases of peripheral down-cut milling operation.
Numerical simulation work has been realized in two phases. Initially, a 3D model for
3D FE model for down-cutting milling
Geometrical model, meshing, interaction, and hypothesis
In the present section, conceived geometry, boundary conditions, meshing, interactions, and hypothesis to build a FE-based 3D down-cut peripheral milling case are discussed. During the machining operation, cutting tool and workpiece come in contact. The numerically difficult-to-build contact and interaction definitions need special intention in developing an FE-based cutting model. To overcome contact complexities, the workpiece was modeled in three parts: chip, cutter path, and machined part (Figure 1). Abaqus built-in “tie-constraint” algorithm was used to assemble these parts. Once assembled, these parts behaved as a single entity “workpiece.” The workpiece was meshed with thermally coupled continuum brick elements C3D8RT, to run the coupled temperature–displacement calculations.
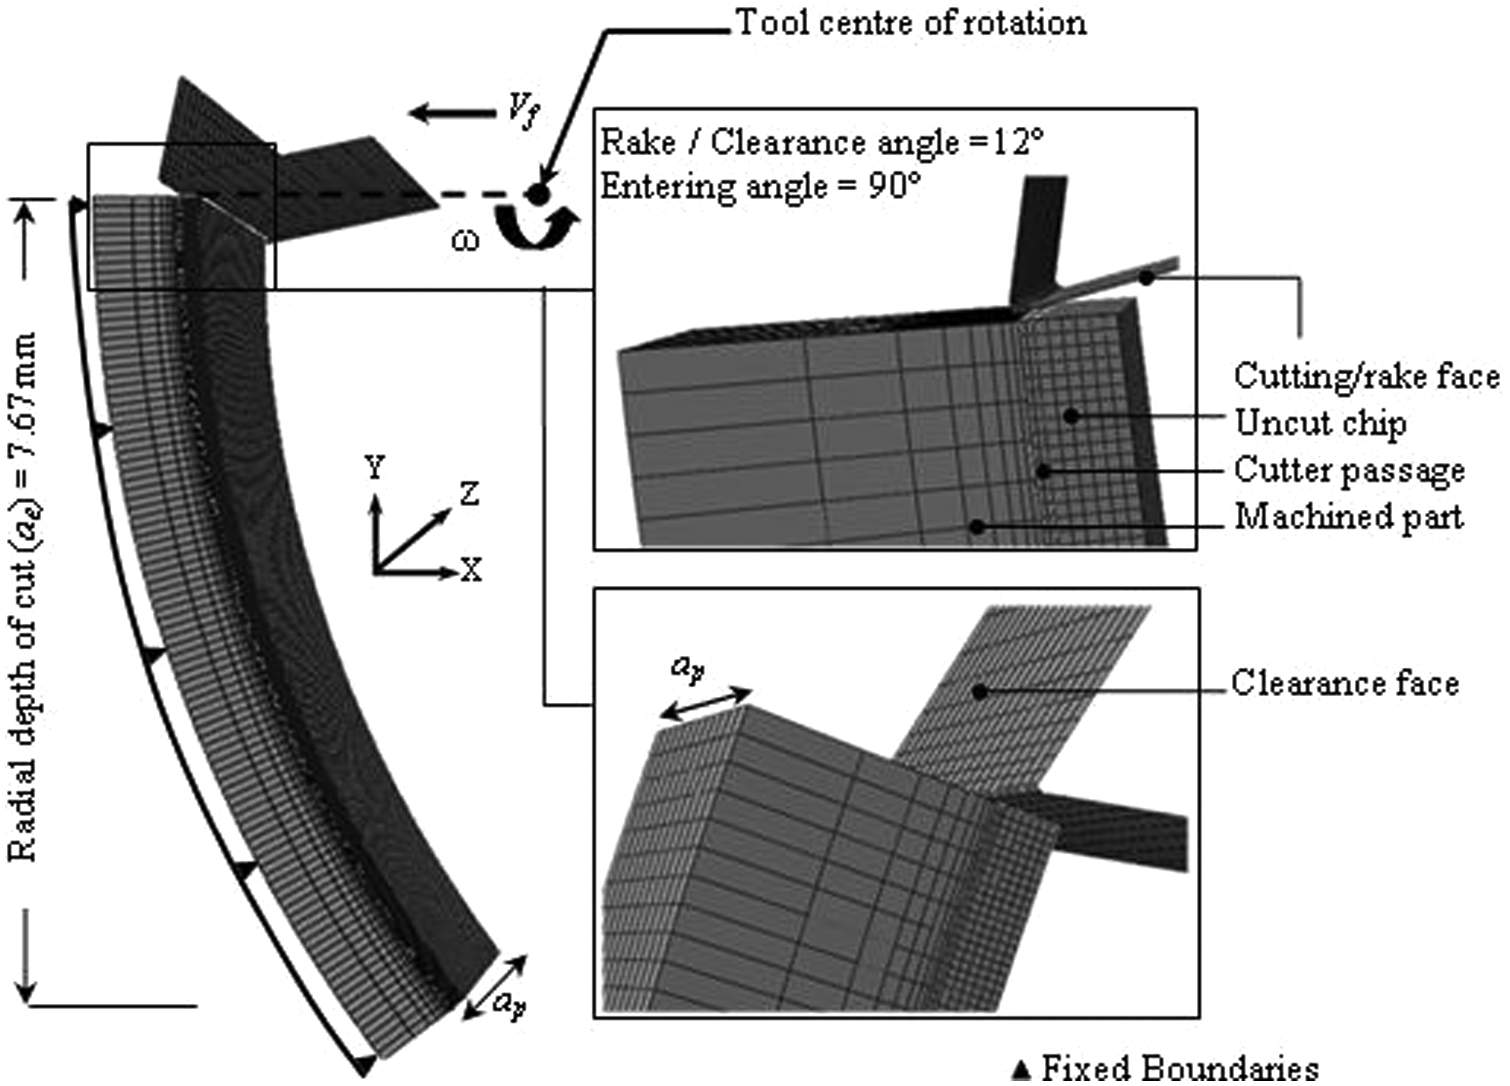
3D down-cut milling model.
The literature study shows that whatever is the type of elements, mesh density plays a vital role to get physical results from FE-based analyses. Unfortunately, in the literature, dealing with FE-based cutting models, there is no defined criterion for an optimized mesh density. Mostly, very fine mesh (2–20 µm) for complex plasticity problems is used. However, time penalty is quiet high for very fine meshes. Recently, Asad 10 in his doctoral study has performed a mesh sensitivity test for six different mesh densities for a 2D orthogonal cutting model and found an optimal mesh density for 27 µm × 27 µm for the studied material. In the present study, a mesh density of 28 µm × 28 µm × 40 µm decreasing to 21 µm × 28 µm × 40 µm has been conceived in the variable section of chip for down-cut milling model. The cutting tool was assumed as a rigid body and was meshed with bilinear rigid quadrilateral elements R3D4.
Schematic representation of the conceived model, for an entering angle of 90° and an edge inclination angle of 0°, is shown in Figure 1. During the simulation, tool cutting edge was simultaneously orthogonal to the cutting and the feed velocities. This represents a 3D orthogonal cutting case.
Furthermore, it can be seen in the Figure 1 that the workpiece is constrained with fixed boundary conditions. During the simulation, milling tool moves in direction of the x-axis with Vf and rotates with ω simultaneously. Milling tool with two cutters and a diameter of 25 mm has been used in the present study. Simultaneous motion of the milling tool results in a trochoidal path generating a variable thickness of the chip. To avoid the big efforts involved at lower uncut chip thickness (UCT) values (with very fine mesh density), the present model represents a 3D milling model for ae = 7.67 mm. This represents an UCT up to 160 µm. The trochoidal path equations were used to model milling cutter path zone (cutter passage/chip separation zone) and chip section geometry.
To define the frictional interaction between the workpiece and cutting tool, well-known Zorev’s 11 stick-slip friction model has been employed. In the present study, an average friction coefficient µ = 0.17, as registered by Ni et al., 12 for diamond-like carbon coatings on aluminum alloys has been employed. They have performed pin-on-disk tests using a high temperature tribometer.
Constitutive material model and chip separation
In the present contribution, constitutive equations dealing with the material behavior and chip separation are similar to those developed and used by the authors of a recent research study. 13 Nevertheless, some key details are outlined in the following.
In the numerical model, chip generation and its detachment from rest of workpiece have been conceived in two stages. The first stage deals with the damage initiation, while the second stage deals with damage evolution.
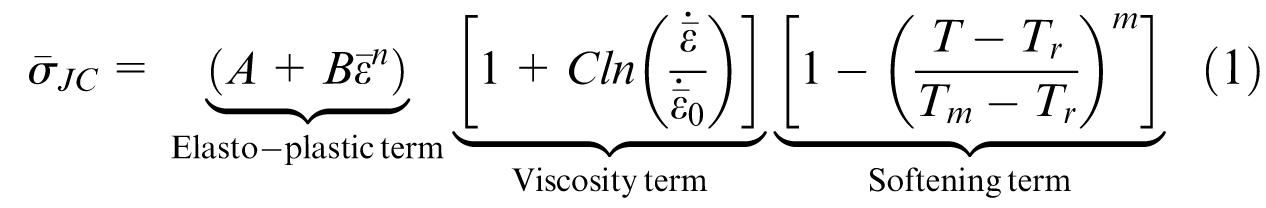
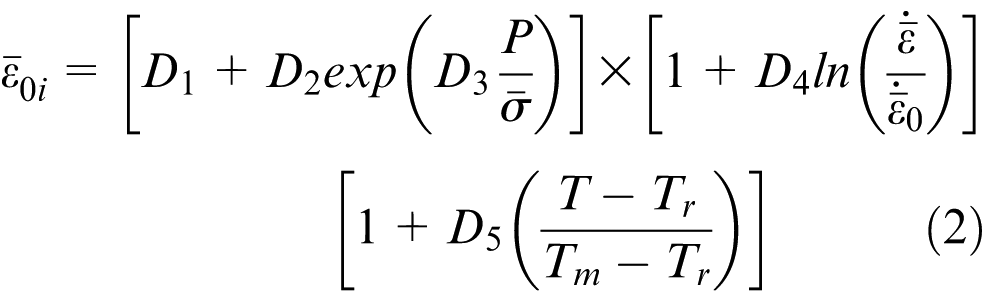
Jhonson and Cook (JC) equivalent stress (equation (1)) and shear failure models (equation (2)) are employed in the model. The latter is used as a damage initiation criterion
When scalar damage parameter

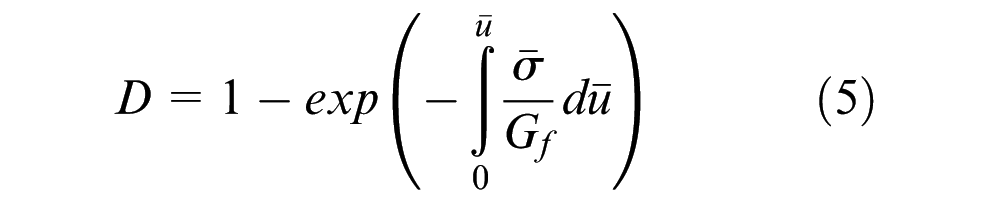
although damage evolution could be defined in the form of a scalar stiffness degradation parameter D. The latter evolves linearly (equation (4)), is used for cutter passage or exponentially (equation (5)) used for chip

Equivalent plastic displacement at failure

An element can be deleted from the mesh if scalar stiffness degradation parameter D = 1. This is how the chip separation is realized in the present model. Entities of material models and properties of the material used in the simulations are presented in Tables 1 and 2, respectively.
Johnson–Cook model parameters for A2024-T351 1 .
Workpiece material properties 1 .
Results and discussion
In the present section, numerical results concerning 3D down-cut milling process of aluminum alloy A2024-T351 with the conceived 3D FE model are discussed. Simulation results are presented in two steps. Initially, the results with 3D model for
3D down-cut milling model for rough machining
Figure 2 represents the chip morphology evolution during 3D down-cut milling simulation, for cutting parameters: ap = 4 mm, f = 0.2 mm/tooth, and VC = 800 m/min. It can be seen that slightly segmented chip morphology (Figure 2(a)) is fairly comparable with the experimental one (Figure 2(b)). Big efforts are involved as UCT decreases in down-cut milling case (with very fine mesh density), as already mentioned in the geometrical model, meshing, and hypothesis sections. Therefore, simulations were performed up to a radial depth of cut ae = 7.67 mm, corresponding to a UCT = 160 µm. Break line on the experimental chip figures out a chip thickness variation from 200 µm up to 160 µm. Evolution of the cutting force for 3D down-cut milling case is depicted in Figure 3. Numerically registered cutting force is globally comparable with the experimental one, under investigated cutting conditions of tool geometry and cutting parameters. 14
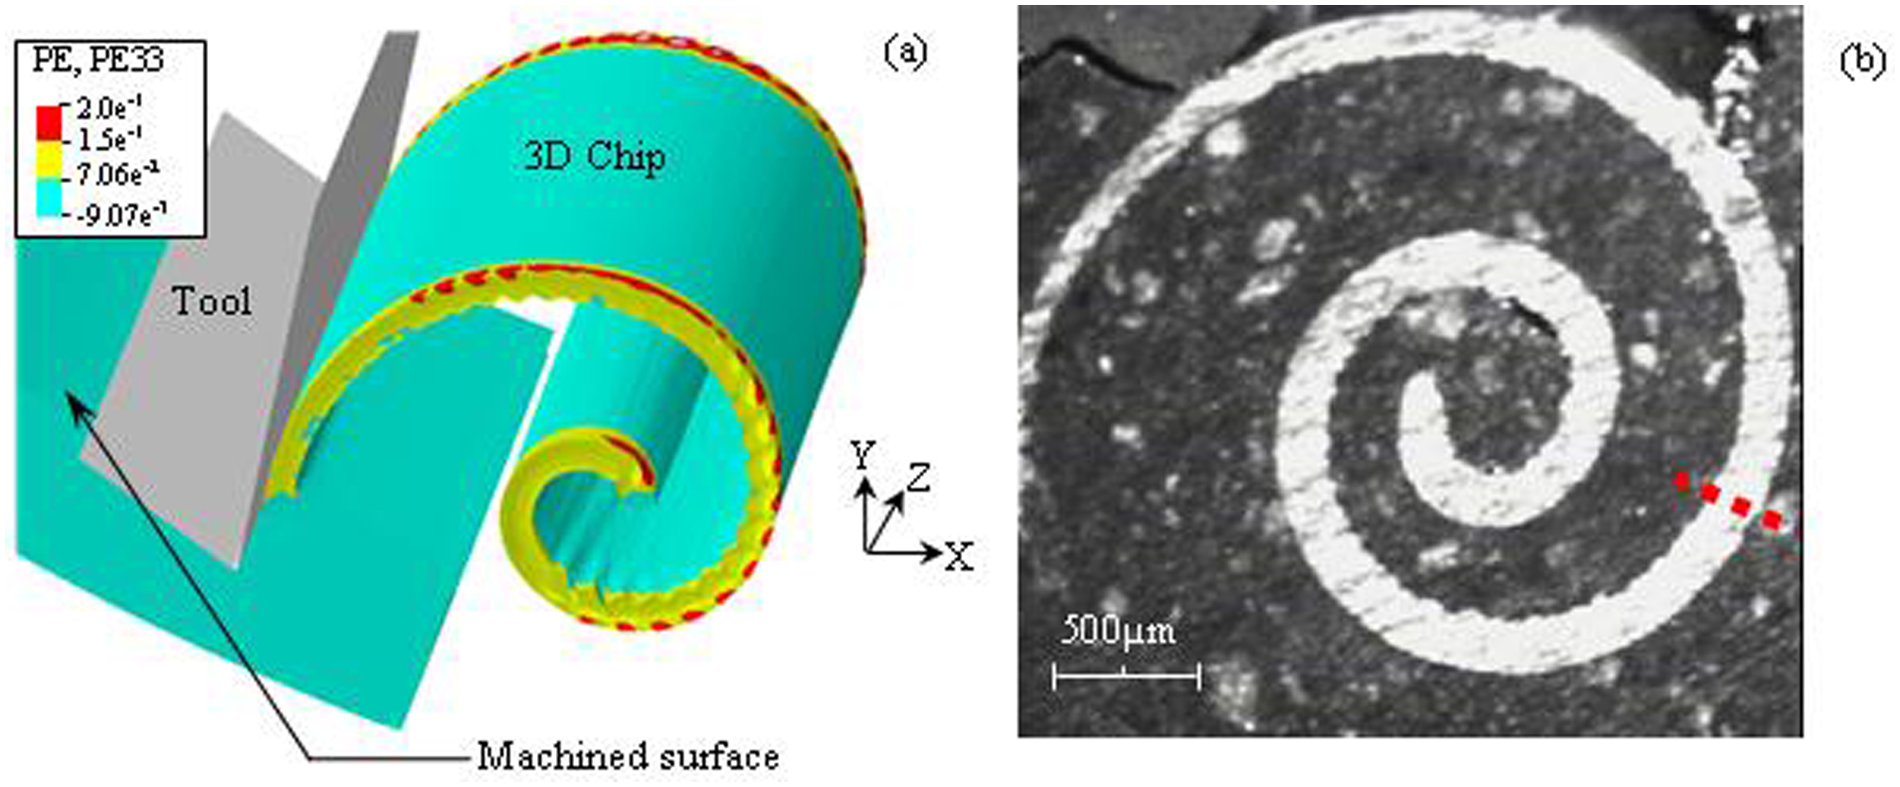
Chip morphology for cutting parameters: ap = 4 mm, f = 0.2 mm/tooth, and VC = 800 m/min: (a) isometric view of simulated chip and (b) experimental chip.
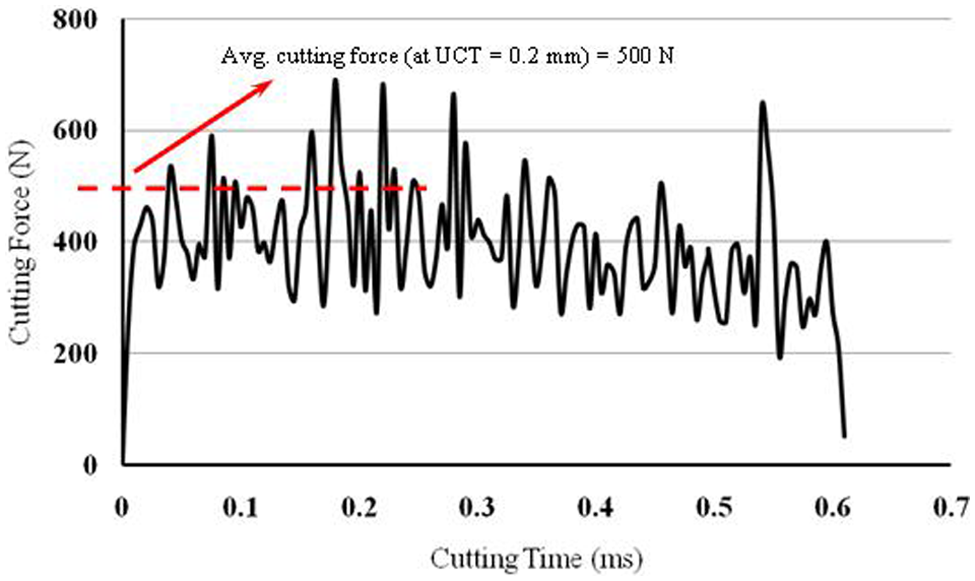
Numerically obtained cutting force for cutting parameters: ap = 4 mm, f = 0.2 mm/tooth, and VC = 800 m/min.
3D down-cut milling model for semifinish and finish machining
Numerical results with the 3D model, developed for rough machining, were found in reasonable correlation with the experimental ones. The model was then extended to semifinish and finish machining cases. The global aim is to comprehend the multiphysical phenomena occurring in the vicinity of a tool–chip interface during semifinish and finish machining operations, which help to generate good surface finish (as compared to rough machining) in industrial high-speed machining. Therefore, in the following, the effects of variation ap during high-speed machining (VC = 800 and 1200 m/min) on chip morphology and surface texture are discussed.
Figure 4 represents the numerical simulation result on spatial displacement of nodes U3 along z-axis (i.e. along depth of cut ap), for cutting parameters: ap = 0.2 mm, f = 0.2 mm/tooth, and VC = 1200 m/min. An average displacement of U3 = 0.0862 mm can be figured out. The percentage displacement of nodes along z-axis (%U3) is 43.1.
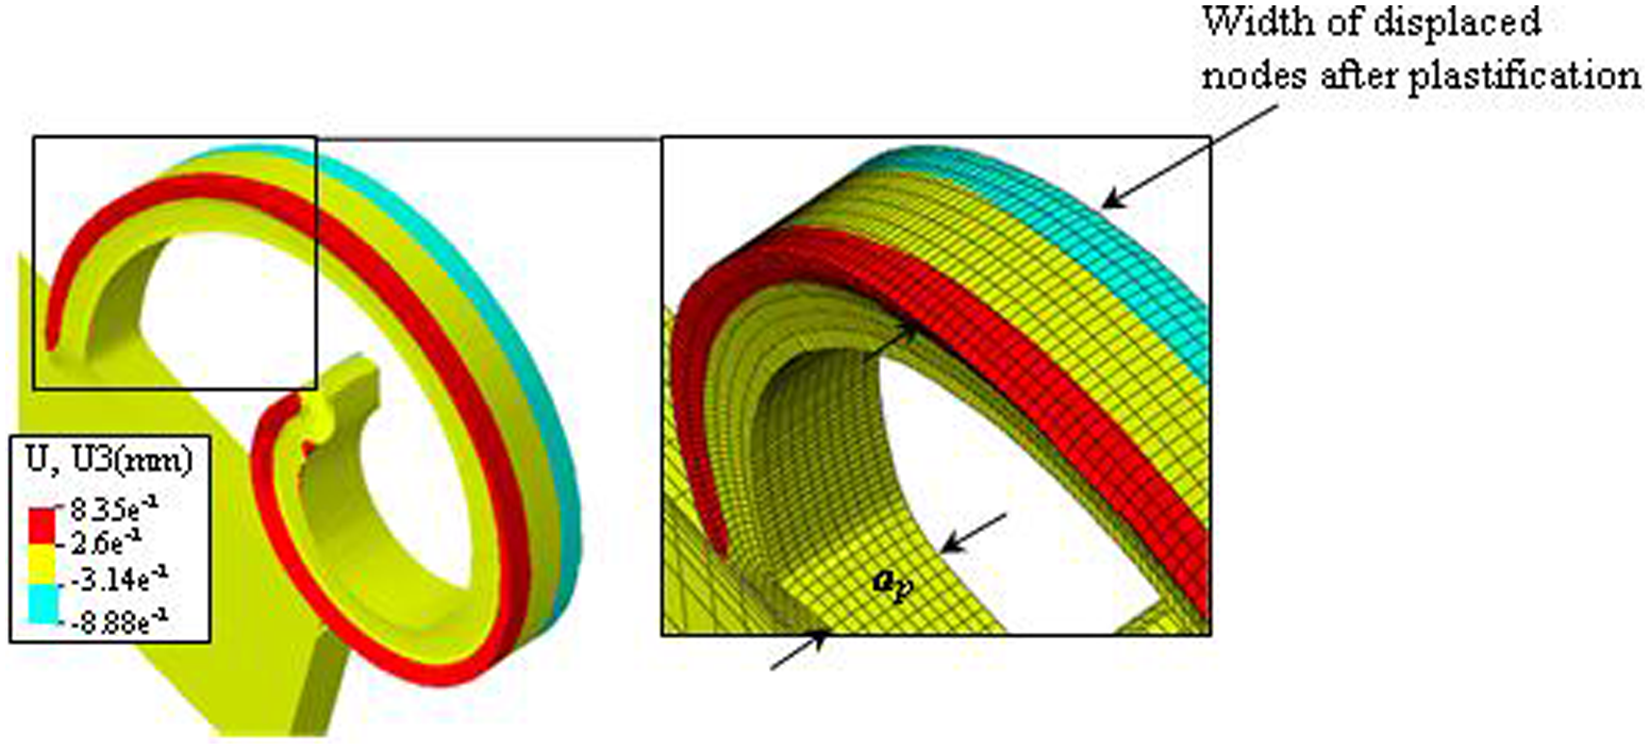
Spatial displacement of nodes U3 (mm), for cutting parameters: ap = 0.2 mm, f = 0.2 mm/tooth, and VC = 1200 m/min.
Table 3 represents U3 and %U3 when simulations were performed for other cutting parameters. It can be easily remarked that as ap decreases, %U3 also increases. This consequently results in higher plastic strains along the z-axis. The numerically registered values of plastic strain component along the z-axis (PE33) for various cutting parameters are shown in Table 3.
Numerical simulation results for f = 0.2 mm/tooth.
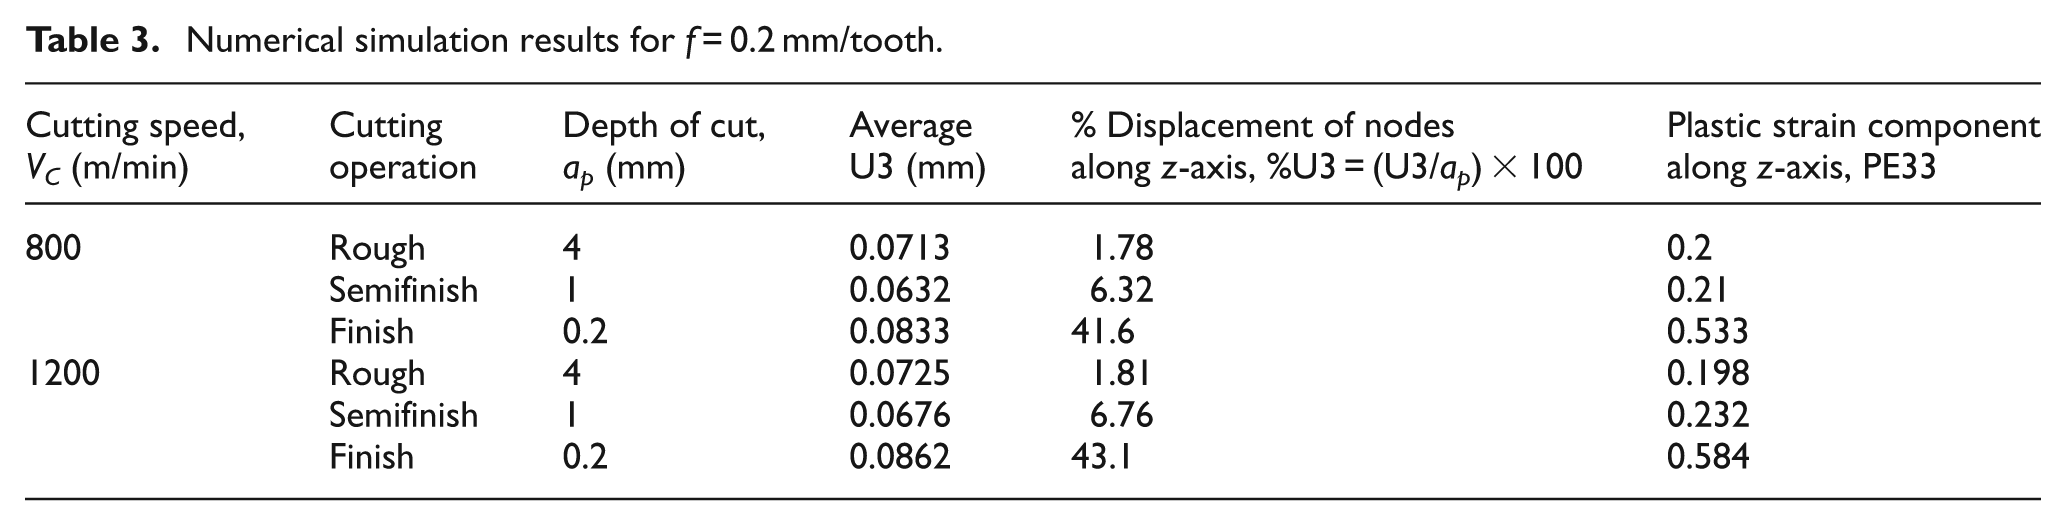
Increasing the values of %U3 and PE33, as ap decreases, suggests that an extended and larger percentage of volume plastifies at lower ap values. This results in an increase in material strength because of the high requirement of inelastic dissipation of energy, hence contributing to size effect in finish cutting operation. This result is in consistence with recent research study of Liu and Melkote 15 in their study on material strengthening mechanisms and their contribution to size effect in microcutting. They have demonstrated in their 2D orthogonal machining numerical work that cutting performed with an edged radius tool requires higher energy dissipation, as it widens the plastification region in comparison to a sharp tool.
Frictional dissipation of energy increases as cutting speed increases from 800 to 1200 m/min. This results in increasing the temperature leading to thermal softening. However, at these high cutting speeds, strain rate hardening seems more dominant than the thermal softening phenomena, as can be deduced by the more regular and continuous chip morphology obtained at higher cutting speed (Figure 5) in comparison with the one obtained at lower cutting speed (Figure 2). An increase in both %U3 and PE33 values can also marked (Table 3) at higher cutting speed.
Chip morphology for cutting parameters: ap = 4 mm, f = 0.2 mm/tooth, and VC = 1200 m/min.
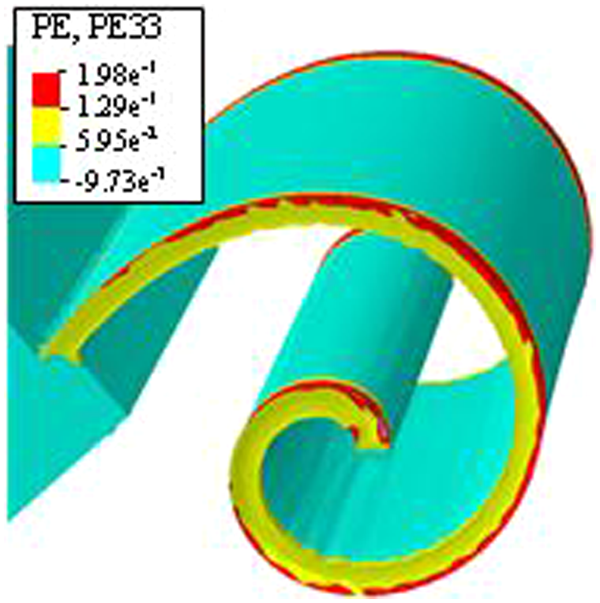
An insight observation of Figures 2, 4, and 5 and Table 3 suggests that as ap decreases and VC increases, material strengthens by higher inelastic dissipation of energy and strain rate hardening phenomena. This generates a smooth continuous chip morphology (Figure 4) if compared with one produced with higher ap and lower VC values (Figure 2). This in turn results in fine quality-machined surface topology in high-speed finishing operations, as shown in Figure 6. This result is in good relation with the findings of Mabouki et al. 13 They have shown in their numerical and experimental study on orthogonal machining that chip morphology dictates the quality of the machined surface.
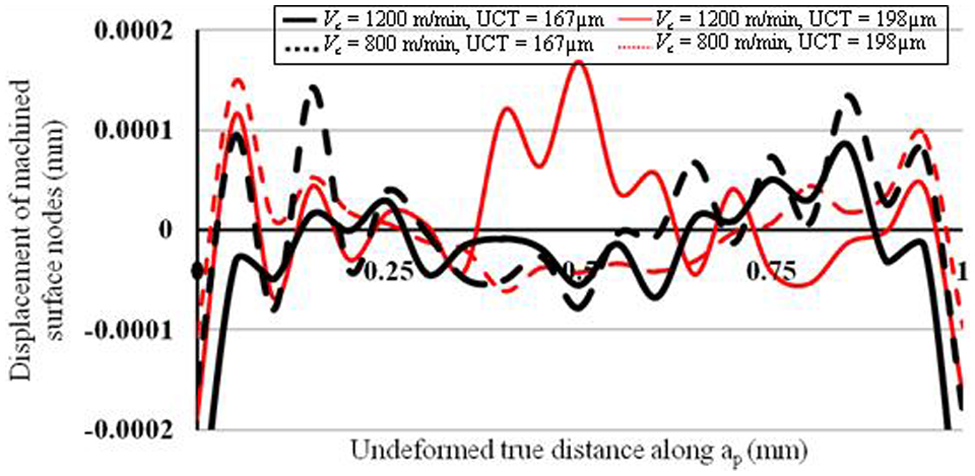
Surface topology of machined surface along z-axis, for ap = 0.2 mm.
Figures 6–8 represent the displacement of machined surface nodes along the z-axis for ap = 0.2, 1, and 4 mm, respectively, at two UCT and cutting speed values. Generally, it can be seen that a decrease in ap results in smoother machined surface texture. Conversely, numerical simulation results with high ap depicts comparatively rough undulated surface texture.
Surface topology of machined surface along z-axis, for ap = 1 mm.
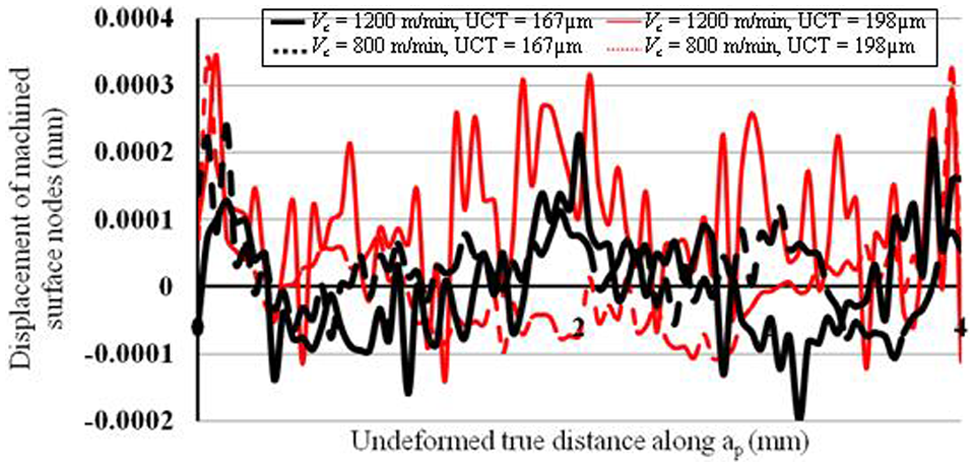
Surface topology of machined surface along z-axis, for ap = 4 mm.
It can also be observed in Figures 6 to 8 that as UCT decreases, down-cut milling process surface quality improves. This can be attributed to the evolution of the chip morphology during milling operation. For example, in Figure 2, initially, a slightly segmented chip and onward at lower UCT, a continuous (nonsegmented) chip morphology is obtained. In this context, Nakayama and Tamura 16 consider that as UCT reduces, shear angle also decreases. This results in higher plastic energy dissipations in the workpiece subsurface, thus strengthens the material. While Liu and Melkote 17 believe that a decrease in secondary shear zone temperature enhances the material strength as UCT decreases. The presence of high-strain gradients at lower UCT also strengthens the material as shown by Asad et al. 9 in their research study on material strengthening factors during macroscale to microscale milling. This shows that multiple phenomena strengthen the material as UCT decreases, leading to continuous chip and smoother surface texture.
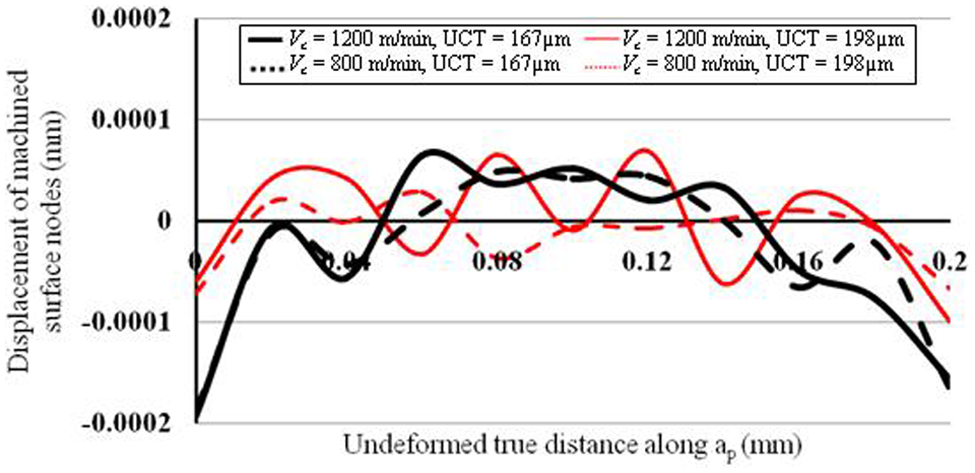
At high cutting speeds, improved machined surfaces are obtained. For example, Figure 9 represents the displacement of machined surface nodes for ap = 1 mm at UCT = 167 µm for the studied cutting speeds. It can be clearly figured out that a smoother surface topology with less nodal amplitudes corresponds to the higher cutting speed of 1200 m/min. This can be attributed to the smoother (nonsegmented) chips obtained at higher cutting speeds.
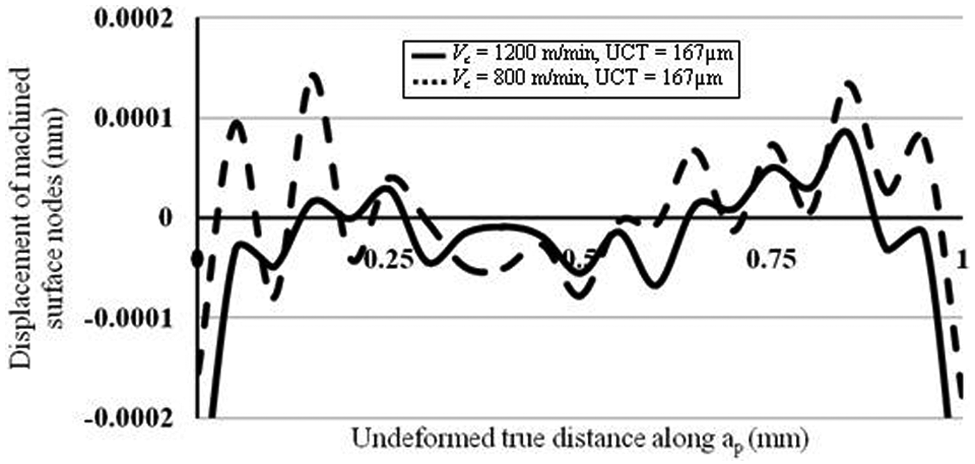
Surface topology of machined surface for two cutting speeds along z-axis, for ap = 1 mm.
For better comprehension of the scheme of entire methodology for modeling and validation adopted in present study, a flow chart has been shown in Figure 10.
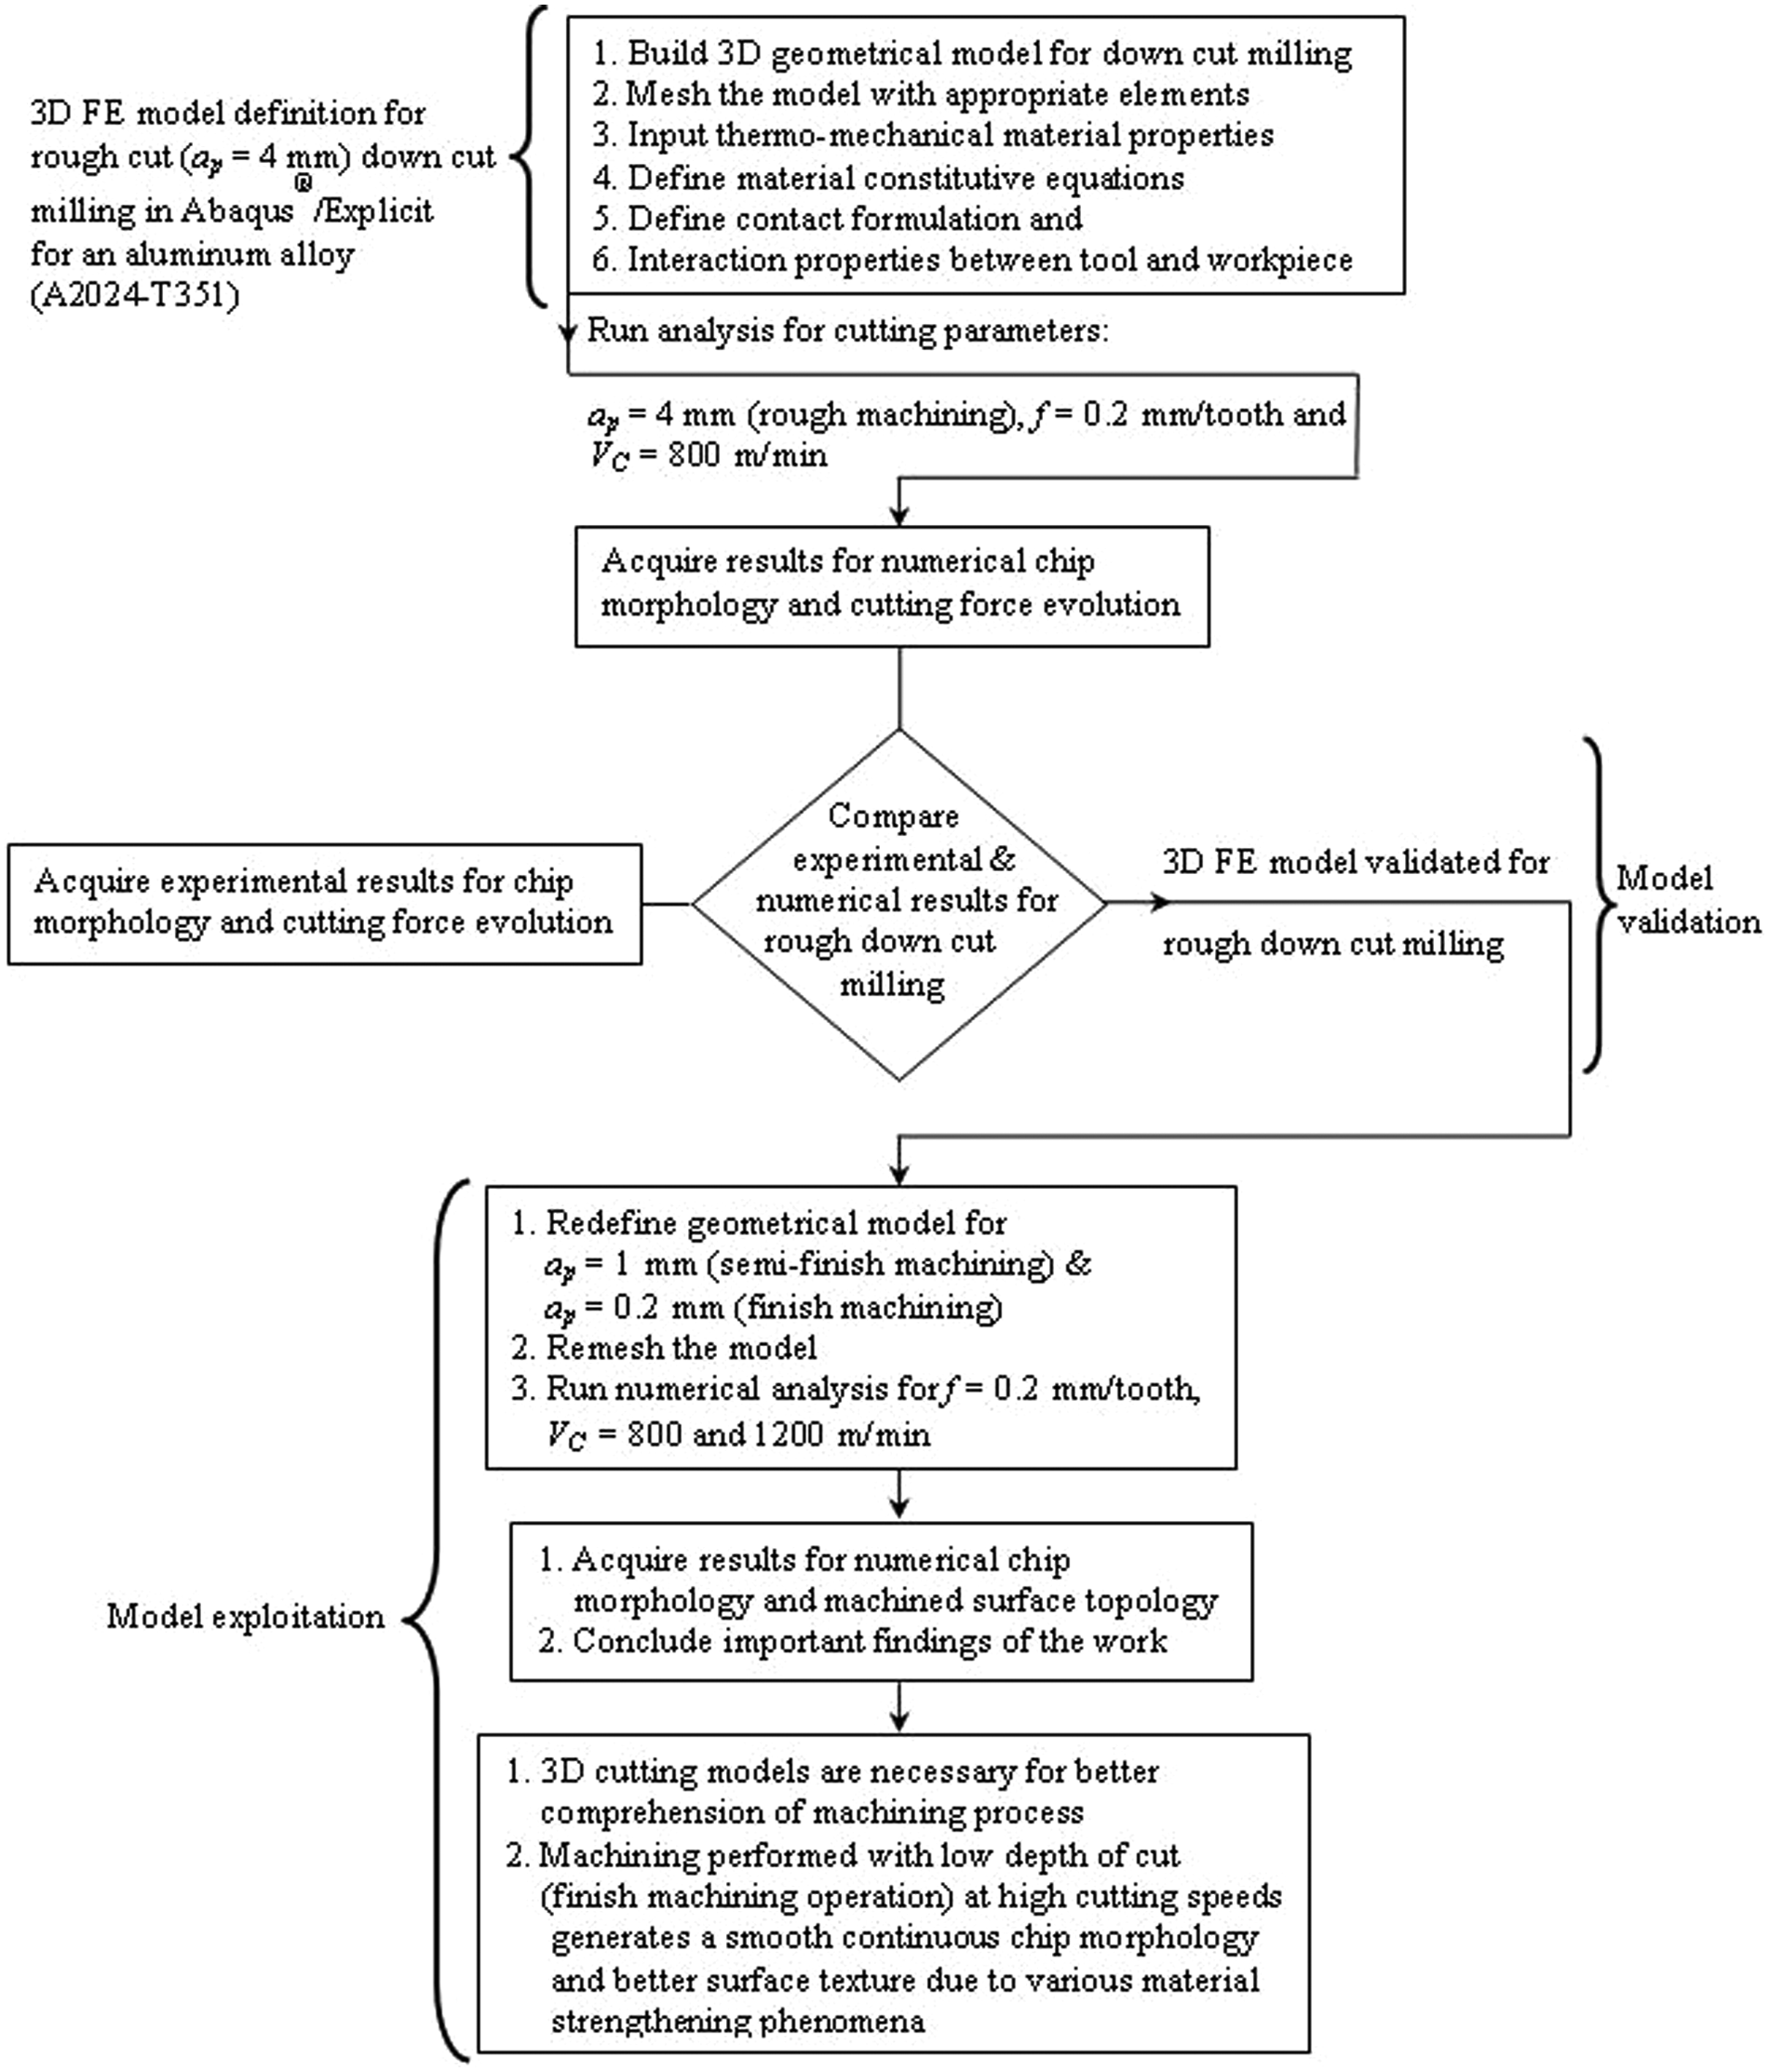
Flow chart on the adopted methodology.
Finally, it can be stated that 3D cutting models are necessary for better comprehension of machining process, for instance, for semifinish and finish cutting operations, and so on.
Conclusion
A 3D FE-based numerical model for down-cut milling process to investigate the influence of cutting speed and depth of cut on chip morphology and surface finish has been developed. The prime objective is to bring the comprehension of physical phenomena accompanying chip formation, which help to generate a smooth continuous (nonsegmented) chip morphology and better surface texture in semifinish and finish cutting operations in high cutting speed regime.
Numerical simulation results show that the spatial displacement of nodes along the z-axis (along depth of cut) increases as depth of cut decreases (toward finish cutting). This eventually represents an extended and widened percentage of volume undergoing plastic deformation, resulting in higher dissipation of inelastic energy, hence contributing to size effect in finish cutting operation. The results also depict that material strain rate hardening characteristics increase the material strength at higher cutting speeds for the studied material. These strengthening phenomena help to generate a continuous chip and improved surface topology in high-speed finishing operations.
Finally, the present study highlights only few of the many multiphysical phenomena leading to high-quality machined surface, during high-speed semifinish and finish machining operations. However, this contribution will allow an improvement in the existing cutting models and will help to optimize the cutting conditions. In the future, effects of strain gradient hardening, tool geometries, and machining conditions on 3D machined surface topology shall be focused.
Footnotes
Appendix 1
Funding
The financial assistance was provided by Higher Education Commission (HEC) of Pakistan to carry out this study in collaboration with Government of France through an Overseas Research Scholarship Program.