
Abstract
This article describes the effect of friction stir welding parameters on the mechanical properties and overall macrostructure features of AA2219-T87 welds. The aim is to develop a suitable combination of process parameters for producing sound friction stir welding joints of AA2219 for aerospace applications such as fabrication of space launch vehicle’s propellant tank. Design of experiments approach was used to determine the influential control factors for the optimization of friction stir welding responses. The observed responses, such as the ultimate tensile strength and percentage of elongation of welds, were compared with the specified requirements for the said application. Weld cross-sectional area and the grain size in various zones of the weld were also recorded. A full-factorial experimental design was conducted to obtain the weld responses. Analysis of variance, interaction effects and desirability function–based techniques were used to determine the significant welding parameters and to set the optimal level for each control factor. Regression equations were developed to predict output characteristics of welds. The experimental and the predicted values were in a good agreement. Response surface modeling was carried out to identify the combination of process parameters to optimize the responses. The modeling methodology adopted and the optimization technique used in the present investigation are observed to be adequate for producing sound AA2219-T87 welds to meet the specification requirements of the intended aerospace application.
Introduction
Friction stir welding (FSW) is a solid-state joining technique1,2 and was patented by The Welding Institute (TWI). It is a solid-state, autogenous joining process involving a nonconsumable rotating tool with a shoulder and protruding pin probe. 3 The rotating pin probe of FSW tool is used as a stirrer for the joint material. Low distortion, high quality, low residual stress, fewer weld defects and low production cost are the major advantages of this welding method. AA2219 alloy is one of the widely used materials for the construction of liquid propellant tanks for space launch vehicles. It has a unique combination of properties such as good weldability, high strength-to-weight ratio and superior cryogenic properties. 4 Although in terms of weldability AA2219 material has got an edge over the 6000 and 7000 series aluminum alloys, it suffers from poor as-welded joint strength. The joint strength of AA2219 fusion weld is only about 40% of its base material strength in the T87 condition. 5 This is observed in both autogenous welds and those welded with matching AA2319 filler wire, which contains slightly higher contents of Ti and Zr. 6 The loss of strength is due to the melting and quick resolidification, which renders all the strengthening precipitates to dissolve, and the weld material is as good as the cast material with solute segregation and columnar grains. The propellant tanks that are intended to be welded by FSW process and the welding equipment used for the same are shown in Figure 1.
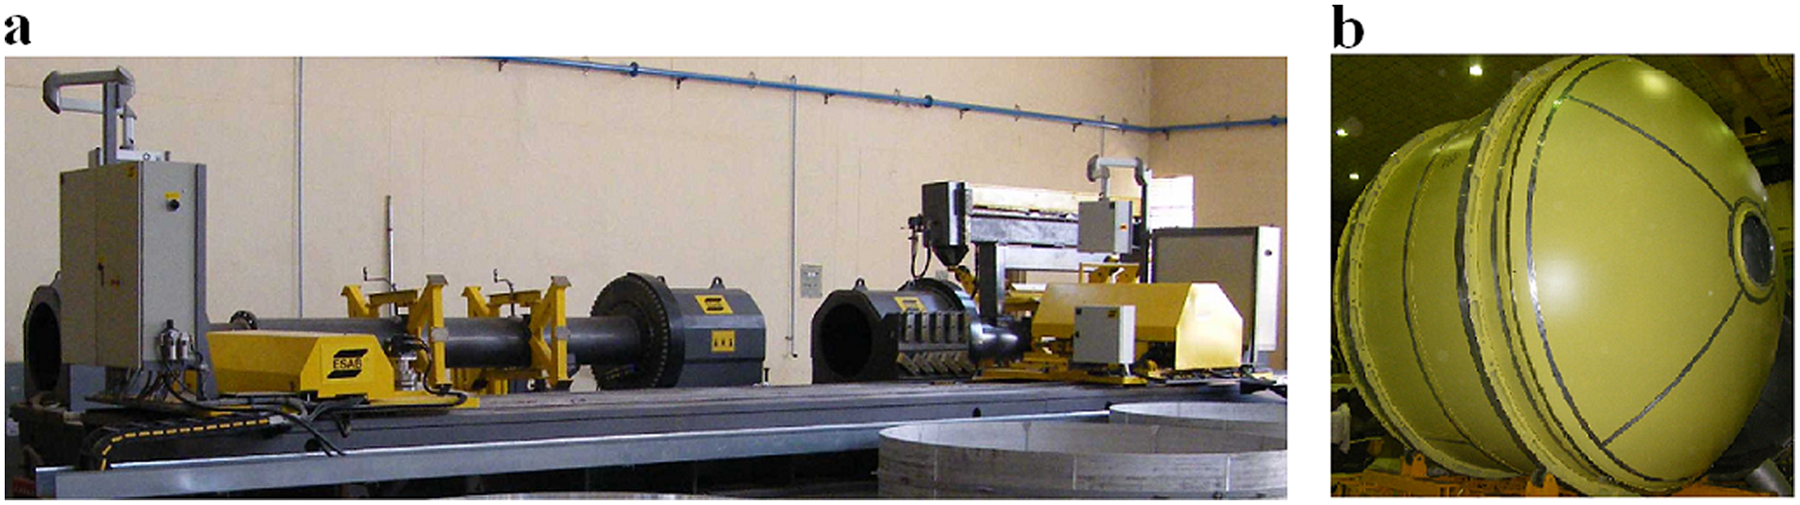
(a) FSW machine and (b) space launch vehicle propellant tank made of AA2219 alloy.
The material flow behavior in FSW is influenced by the FSW tool profiles, tool dimensions and process parameters.7,8 The present study involves the optimization of process parameters for FSW of AA2219 T-87 square-butt welds for aerospace application (satellite launch vehicles) using a statistical modeling approach such as response surface regression analysis. Such techniques are able to quantify the effect of individual parameters on the weld joints.9,10 An investigation on the influence of FSW process parameters on the mechanical properties of AA2198 T-3 welds was conducted by Bitondo et al. 11 A statistical analysis to study the effect of FSW process parameters such as spindle rotational speed, traverse speed and stirrer geometry on mechanical properties of AA1050/AA5083 joints was conducted by Sarsılmaz et al. 12 Lockwood et al. 13 examined the global and local mechanical responses of the friction stir welded AA2024 joints using experimental and numerical approaches. A study on the various modeling techniques that can be applied to FSW and other welding processes was reported by Benyounis et al. 14 Lakshminarayanan and Balasubramanian 15 optimized the FSW parameters of RDE-40 aluminum alloy using the Taguchi technique. In this study, the Taguchi approach was applied to determine the most influential factors that yielded better tensile strength of friction stir welded RDE-40 aluminum alloy joints. The results indicated that rotational speed, welding speed and axial force are the significant parameters in deciding the tensile strength of the welded joint. 15 Blignault et al. optimized the procedures for FSW of 5083-H321 aluminum alloy by selecting appropriate weld process parameters and tool modifications. This study demonstrated the use of “Force Footprint” diagram in providing a graphical user interface for process optimization of FSW. The model developed in this study allows the weld tensile strength to be predicted for all combinations of tool geometry and process parameters. 16 Rajakumar et al. 17 optimized FSW process to attain maximum tensile strength of AA7075-T6 aluminum alloy by using the central composite face-centered (CCF) design of experiment (DOE). In their study, an attempt was made to establish an empirical relationship between the FSW process parameters, tool dimension, hardness and the tensile strength of the joint. Statistical tools such as DOE, analysis of variance (ANOVA) and regression analysis were used to develop the relationships. 17
From the literature review, the suitability of DOE and statistical techniques for modeling and optimizing the FSW process is well noted. However, most of the literatures are related to laboratory test results of FSW, and very rarely a work related to real industrial application of FSW is observed. Moreover, works related to modeling and optimization of FSW process for the production of sound AA2219 T-87 welded joints are rarely found in the literature. There is, therefore, a need to experimentally study and optimize the FSW of AA2219 material in T-87 condition. The present investigation is a step in this regard to experimentally model and optimize FSW process in an industrial environment for producing sound AA2219 joints for aerospace application. Full-factorial DOEs were conducted to ascertain all possible combinations of the control factors. Multiresponse optimization of the responses was conducted based on full-factorial DOEs by emphasizing about the repeatability of the results in the industrial environment.
Experimental details
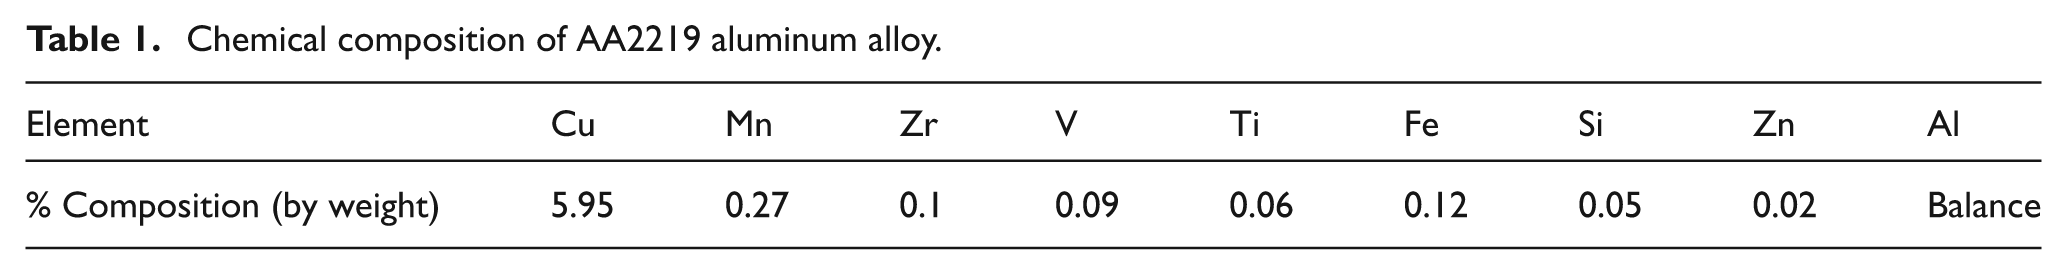
The material under investigation is a 7.0-mm-thick rolled sheet of AA2219 in T-87 temper condition (solutionized, cold-worked and artificially aged). This material has generated great interest in the aerospace industry because of its weldability and strength. This alloy is characterized by the presence of copper as the main alloying element. Chemical composition obtained from a chemical analysis tester and the measured mechanical properties of the alloy in the T-87 temper condition are shown in Tables 1 and 2, respectively.
Chemical composition of AA2219 aluminum alloy.
Mechanical properties of AA2219 in T-87 condition.
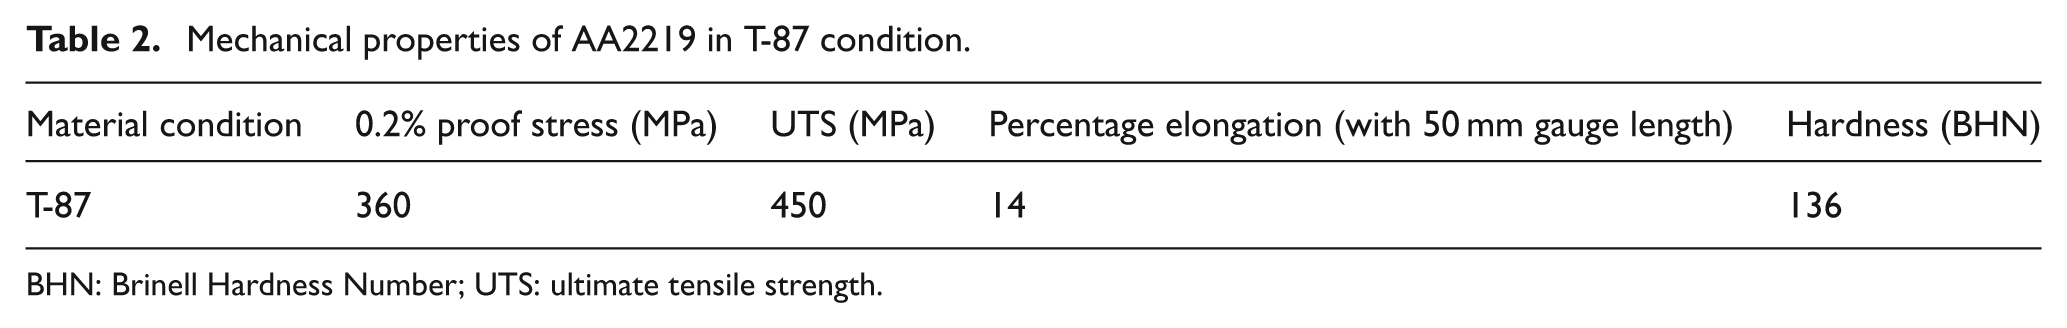
BHN: Brinell Hardness Number; UTS: ultimate tensile strength.
A special commercial friction stir welder for welding of aerospace component was used for the experiments. 18 Rolled plates of 7-mm-thick AA2219 in T-87 temper condition were machined to the required size, that is, 155 mm × 880 mm, on a conventional milling machine. Two plates of the above-mentioned size were placed on the longitudinal test stand fixture of friction stir welder 18 as shown in Figure 1. The weld joint configuration was square-butt. The test coupons were clamped rigidly to avoid separation from the joint line during welding as depicted in Figure 2. The rotating FSW tool was then fed against the joint line with required axial pressure and traversed along it. No chemical treatments were carried out prior to welding.
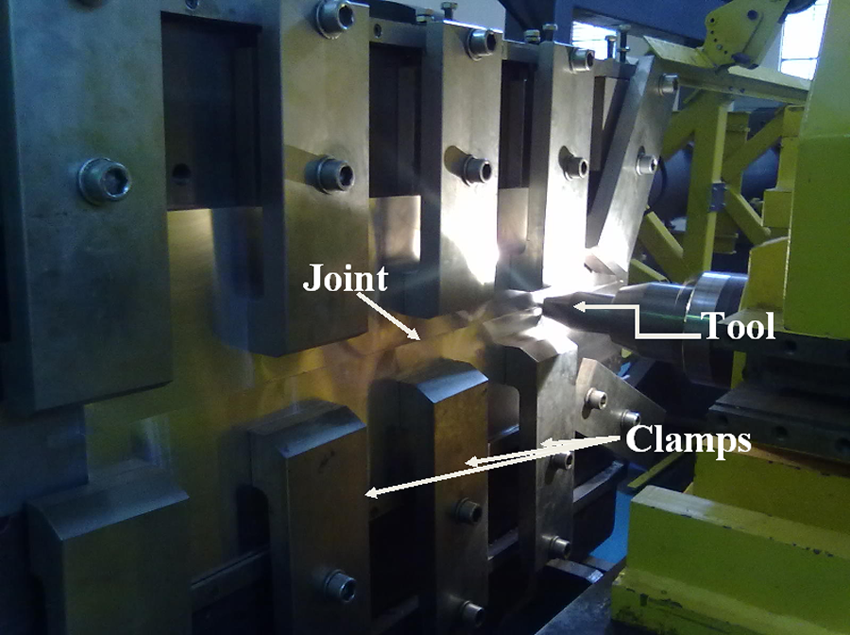
L-seam test stand fixture with plates positioned.
The tool used for welding was made of oil-hardenable tool steel. The tool has a tapered pin with threaded features and flutes cut on it. The shoulder of the tool consists of scrolls for developing an inwardly directed traction force under the FSW tool shoulder. The details of tool used for the trial are given below, and the photograph is shown in Figure 3.
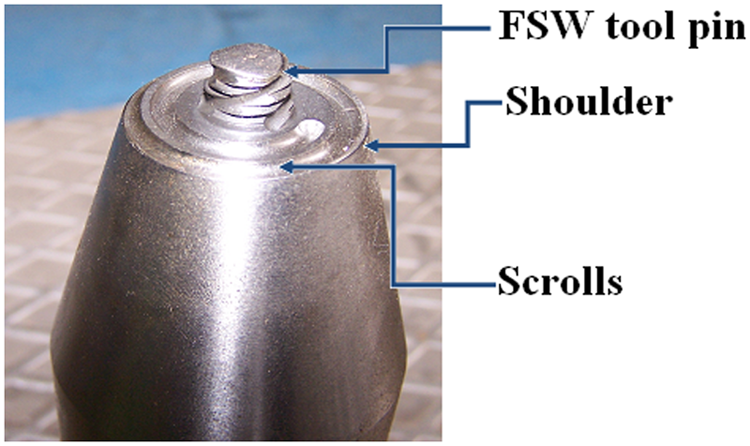
Photograph of FSW tool.
Tool shoulder diameter: 27 mm
Tool pin diameter: 9 mm at the pin tip and 11 mm at the shoulder
Tool pin length: 6.8 mm.
The factors considered for the modeling are the tool rotational speed, axial force and the welding speed. The other constant factors in the experiment are the tilt angle (1.5°), rotational direction (clockwise), plunge speed (0.2 mm/s), dwell time (2 s) and pin length (6.8 mm). A full-factorial experimental design (three parameters with three levels for each parameter) was conducted to obtain the responses. The observed responses are the ultimate tensile strength (UTS), percentage elongation and the grain size in the various zones. The basic experimental requirement followed such that the weld is free from major weld defects, such as lack of penetration, lack of fusion, weak diffusion bond and so on. Furthermore, the area of cross section of the welds was also measured for the various welding parameters considered in the experimental design. The ultimate goal is to obtain defect-free sound welds with adequate UTS.
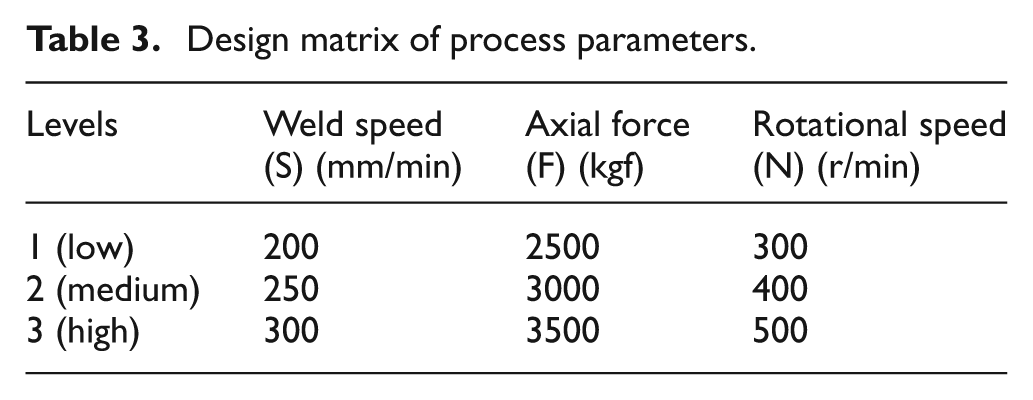
Prior to the finalization of the design matrix, the preliminary trials were conducted in order to determine the workable range for each control factor. For example, the first trial was done with the following parameters: axial force = 2700 kgf, rotational speed = 400 r/min and welding speed = 250 mm/min. Subsequently, tool rotation and welding speed were kept constant, and the axial force was varied to establish the process window. At 3500 kgf axial force, it was observed that the pin was touching the steel back-up plate, and hence, the levels for axial force were fixed as 2500, 3000 and 3500 kgf to represent low, medium and high levels, respectively. Similarly, the tool rotation was varied from 300 to 500 r/min. Beyond 500 r/min, that is, at 550 r/min, as well as at 600 r/min, groove-type defect was observed as shown in Figure 4. The preliminary trials were subjected to visual examination; nondestructive examination, such as dye-penetrant inspection and radiography; destructive tests, such as tensile tests; bend tests and micro-/macroexaminations in order to determine the soundness of the weld. The tensile tests were conducted on a universal testing machine model MTS810 by MTS. The experimental design matrix for full-factorial experimental design was finalized based on the trial runs, as presented in Table 3.
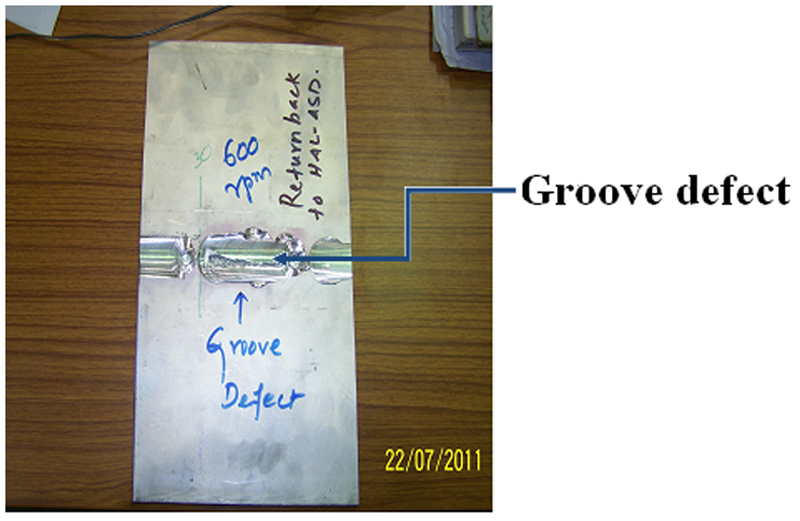
Groove defects observed at rotational speed of 600 r/min.
Design matrix of process parameters.
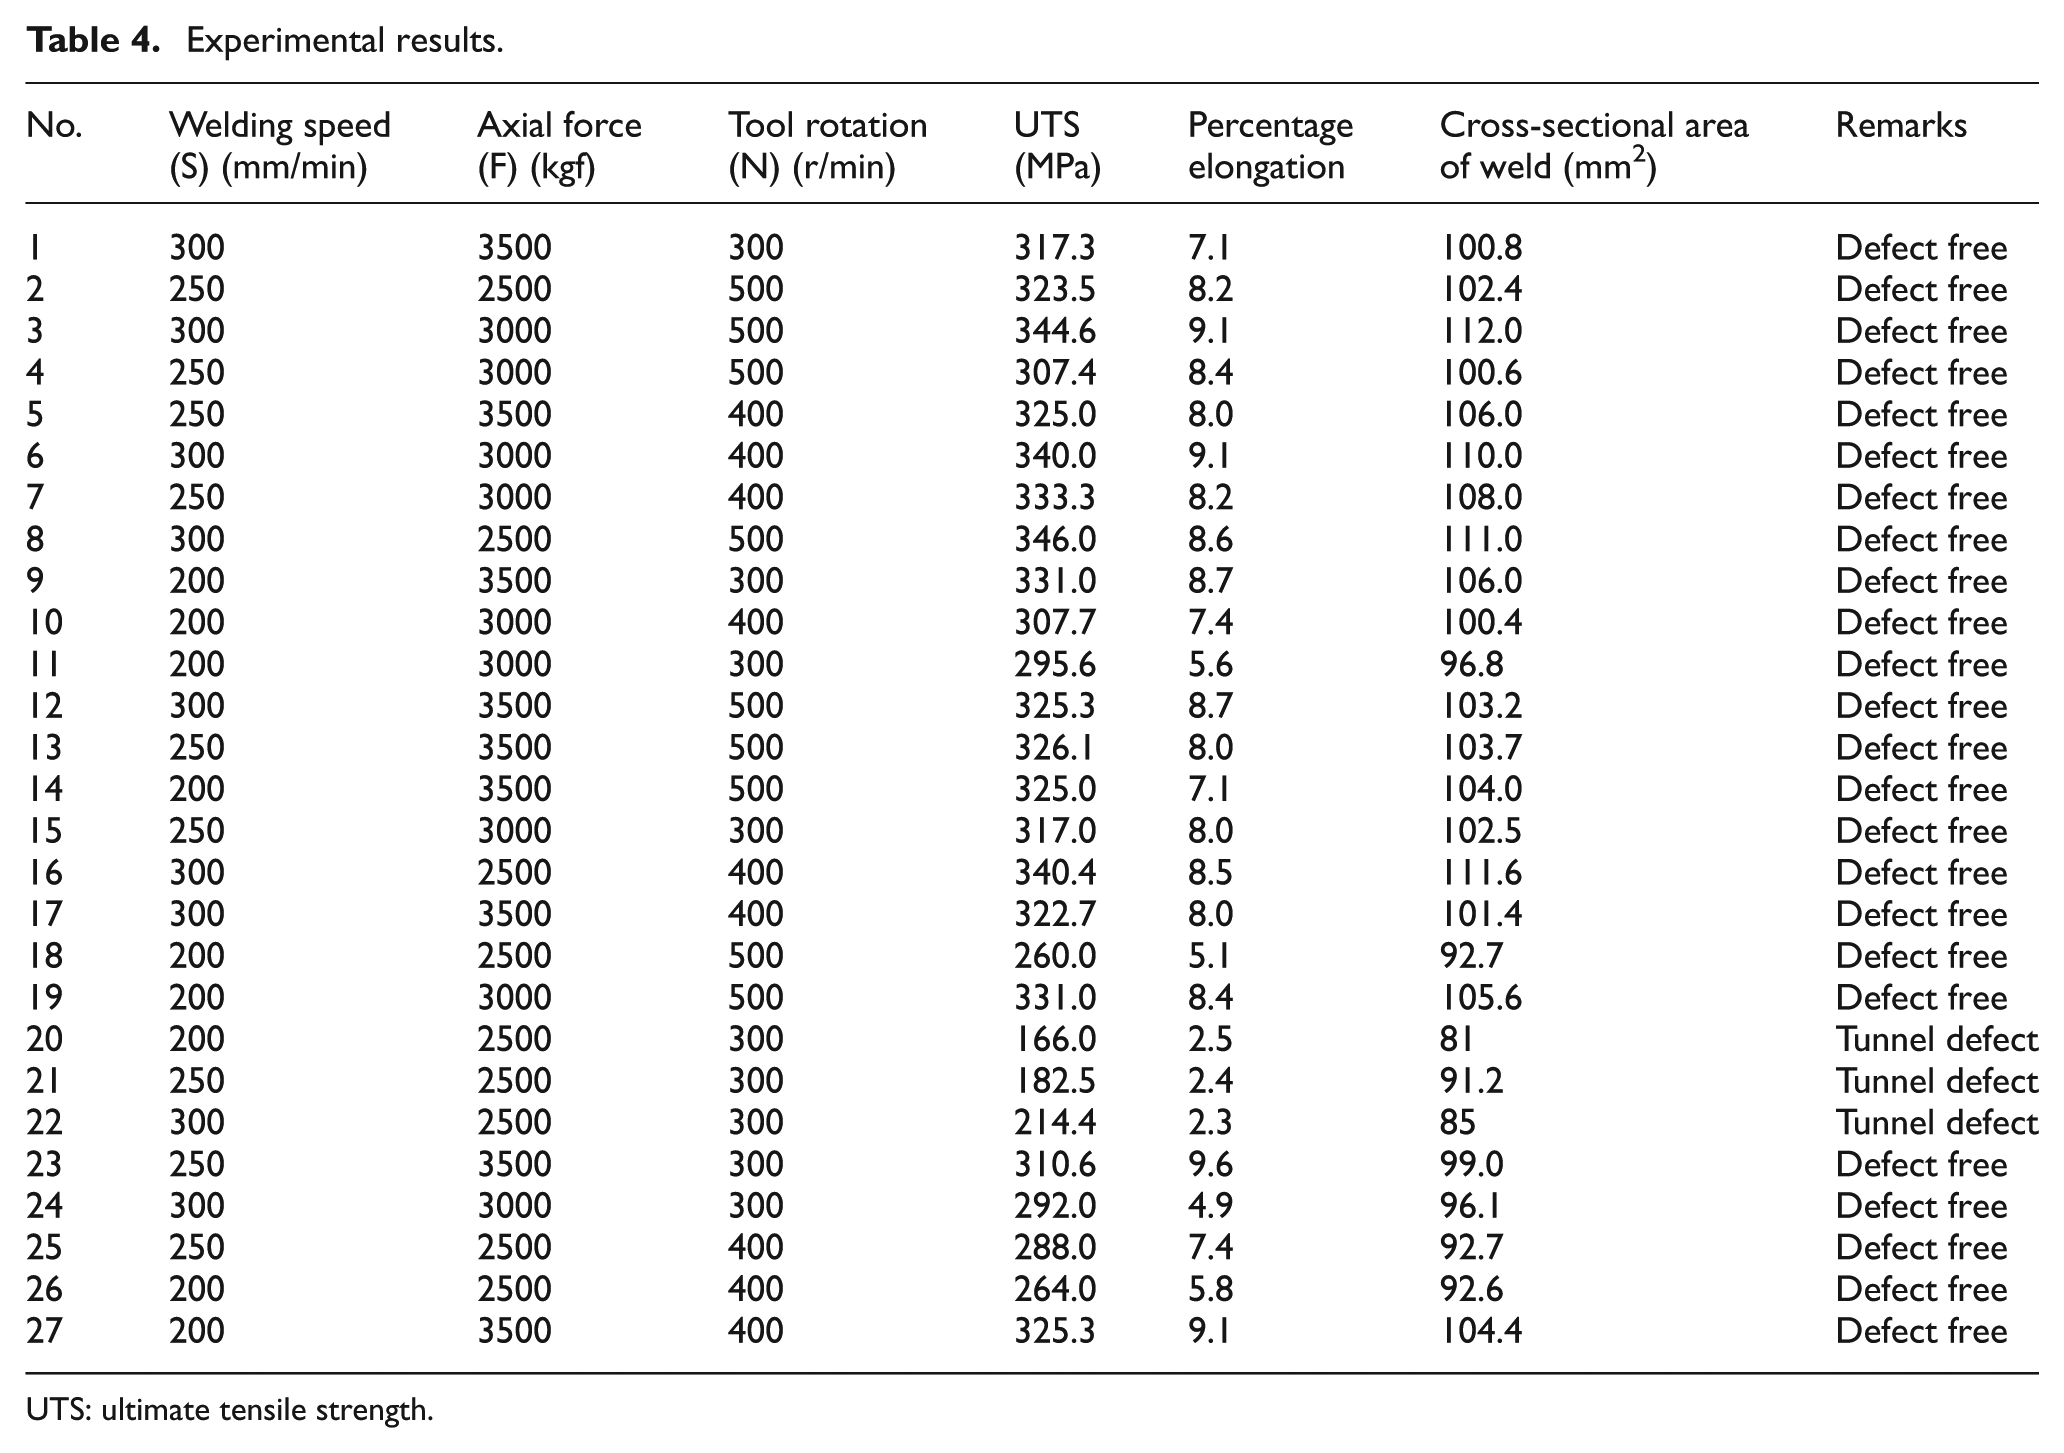
The 27 experiments with different welding parameters (Table 3) were subjected to nondestructive examination and destructive testing to determine the quality of the weld. The response measurements included the UTS, percentage elongation and cross-sectional area of the weld. The requirements of UTS and the percentage elongation for this specific aerospace application are 300 MPa and 5% elongation in the as-welded condition. The results obtained for each of the experiment are tabulated and presented in Table 4. The tensile tests were conducted on a computerized universal testing machine. The broken tensile test samples are shown in Figure 5. It can be observed from Table 4 that the area of cross section of the weld has a direct relationship with the tensile strength of the weld.
Experimental results.
UTS: ultimate tensile strength.
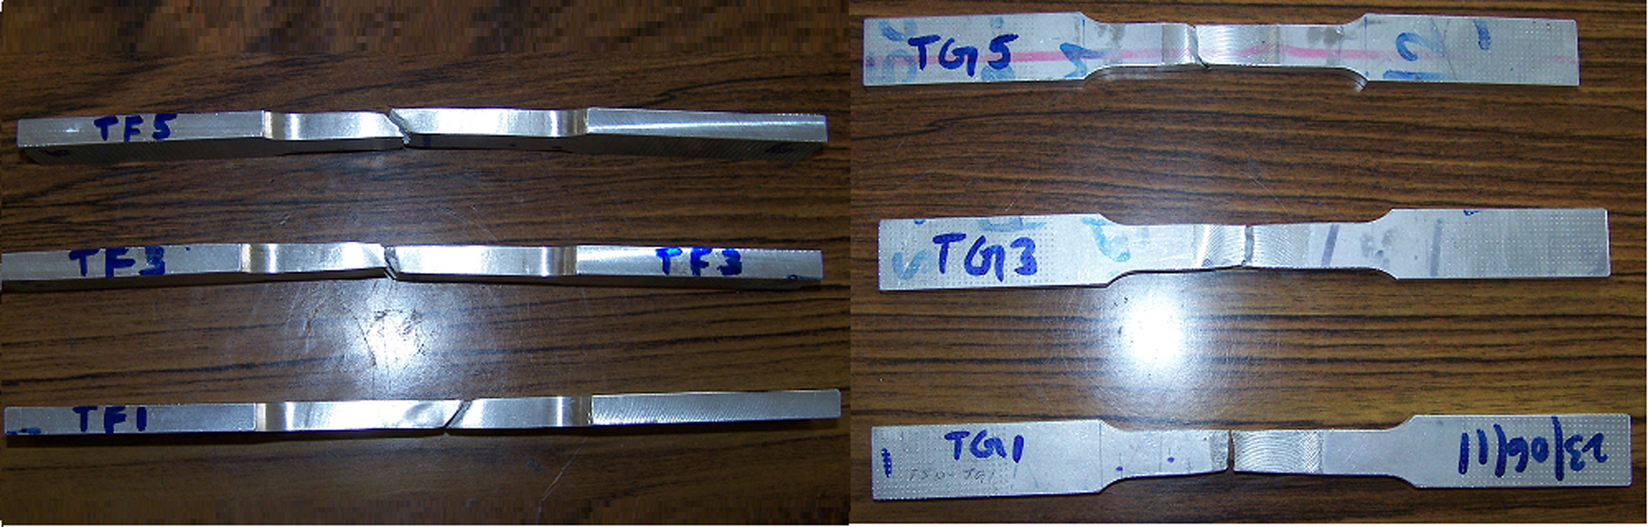
Some broken tensile test samples.
Metallographic and macrostructure studies
Macro- and microstructural analyses have been carried out using an optical microscope by Nikon. The weld specimens for metallographic examination are sectioned to required sizes from the joint comprising the friction stir processing zone (FSPZ), thermomechanically affected zone (TMAZ), heat affected zone (HAZ) and the base metal regions. The specimens were etched with Keller’s reagent to reveal the micro- and macrostructures. It can be seen from Figure 6 that the weld cross section is almost symmetrical. Photomicrographs of stir zone, weld–TMAZ interface, HAZ and parent metal at different magnification are presented in Figure 7.
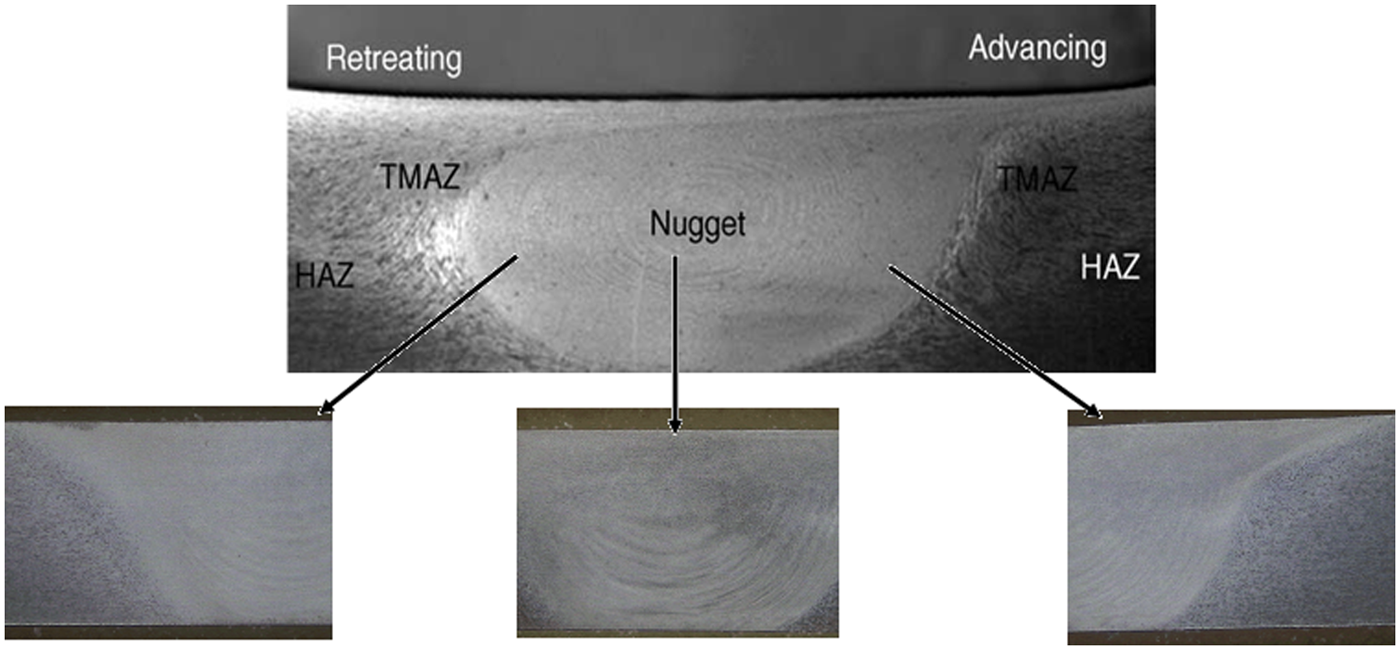
Photograph of FSPZ captured using stereo binocular microscope (3×).
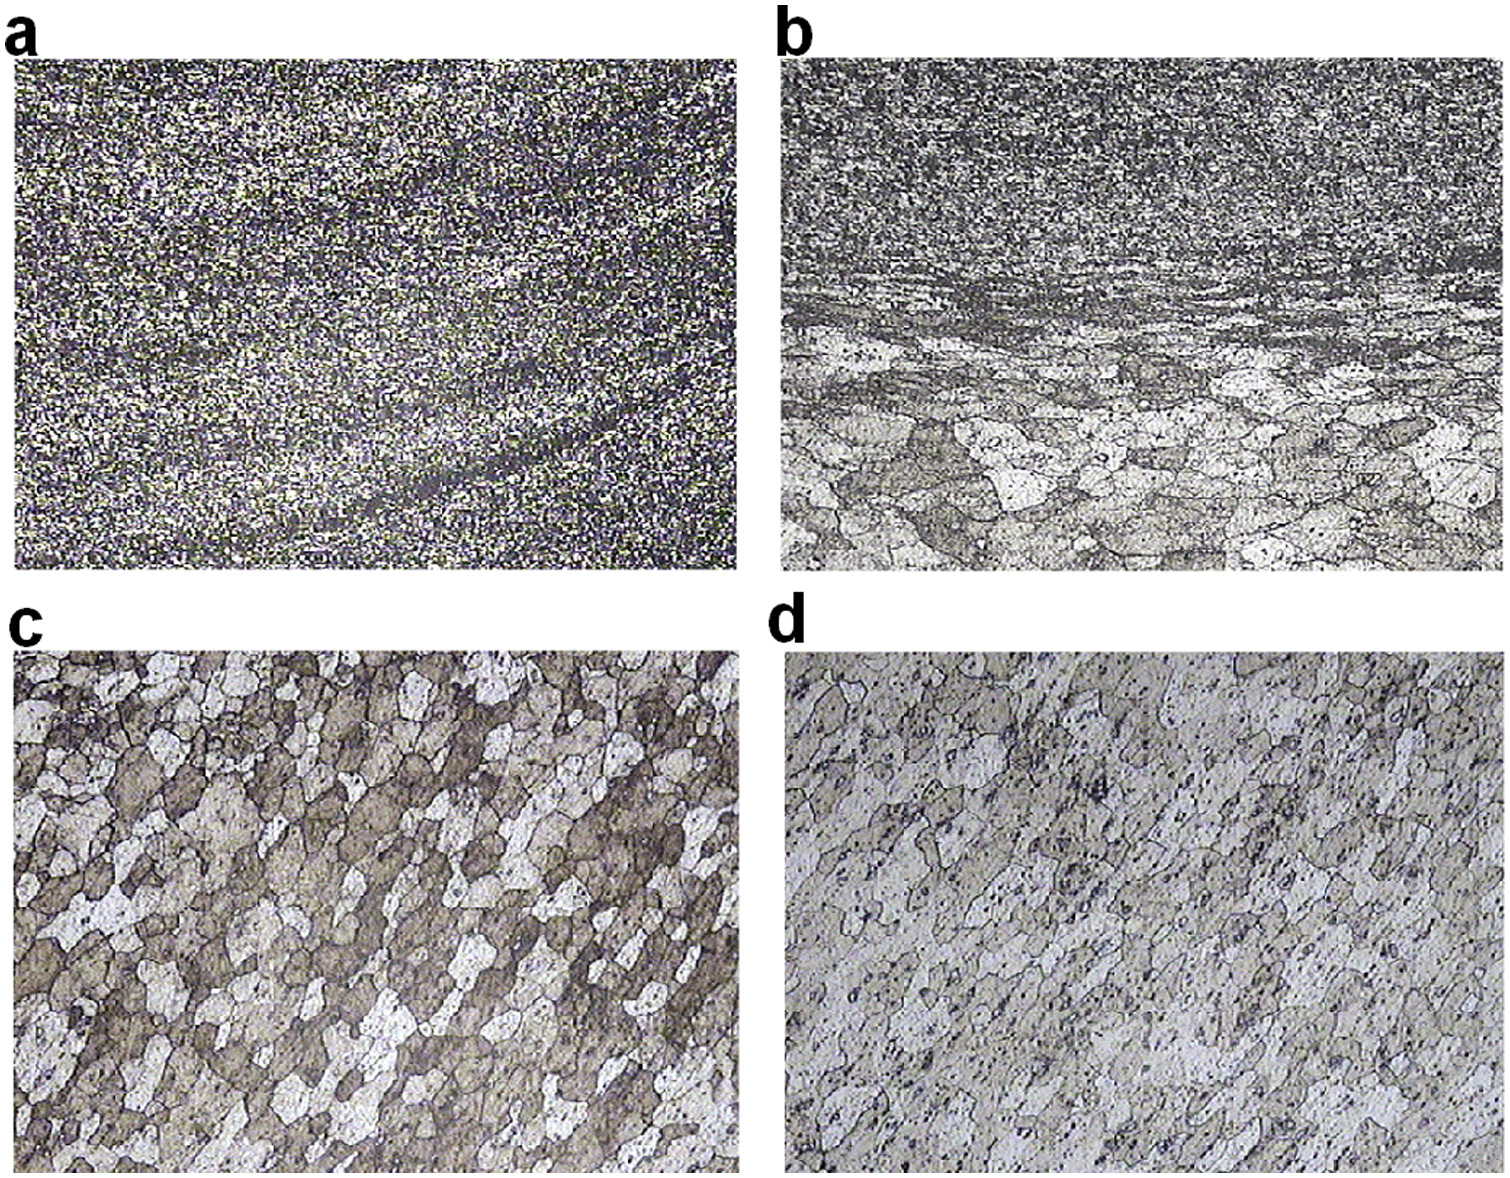
Photomicrographs of (a) nugget/stir zone (150×), (b) Weld-TMAZ interface (100×), (c) HAZ (200×) and (d) parent metal (200×).
The metallographic sections (Figure 7(a)) show a classic weld nugget region and the stirring marks, commonly denoted as “onion rings,” which are typically found in this region of the weld. The grains in this zone are of fine equiaxed type. The grain size in the stir zone is of the order of ASTM No 9, whereas that in the HAZ is of the order of ASTM No 5-6. The TMAZ of the friction stir weld had elongated grain structure due to severe mechanical working in that zone. The grain size in the parent metal is of the order of ASTM No 6-7.
Some macrostructure observations of AA2219-T-87 welds (Table 4) are presented in detail in Table 5, indicating the type of weld cross section, macrodefects and weld strengths. It is observed from Table 5 that with lower axial force of 2500 kgf and with weld speed of 200–250 mm/min with tool rotational speed of 300 r/min, tunnel defects were observed. The tunnel defects were not observed for higher rotational speed of the tools. This finding is critical in setting the parameters for FSW of AA2219-T87 alloy to avoid the weld defects.
Some macrostructure observations of AA2219-T87 welds (Table 4).
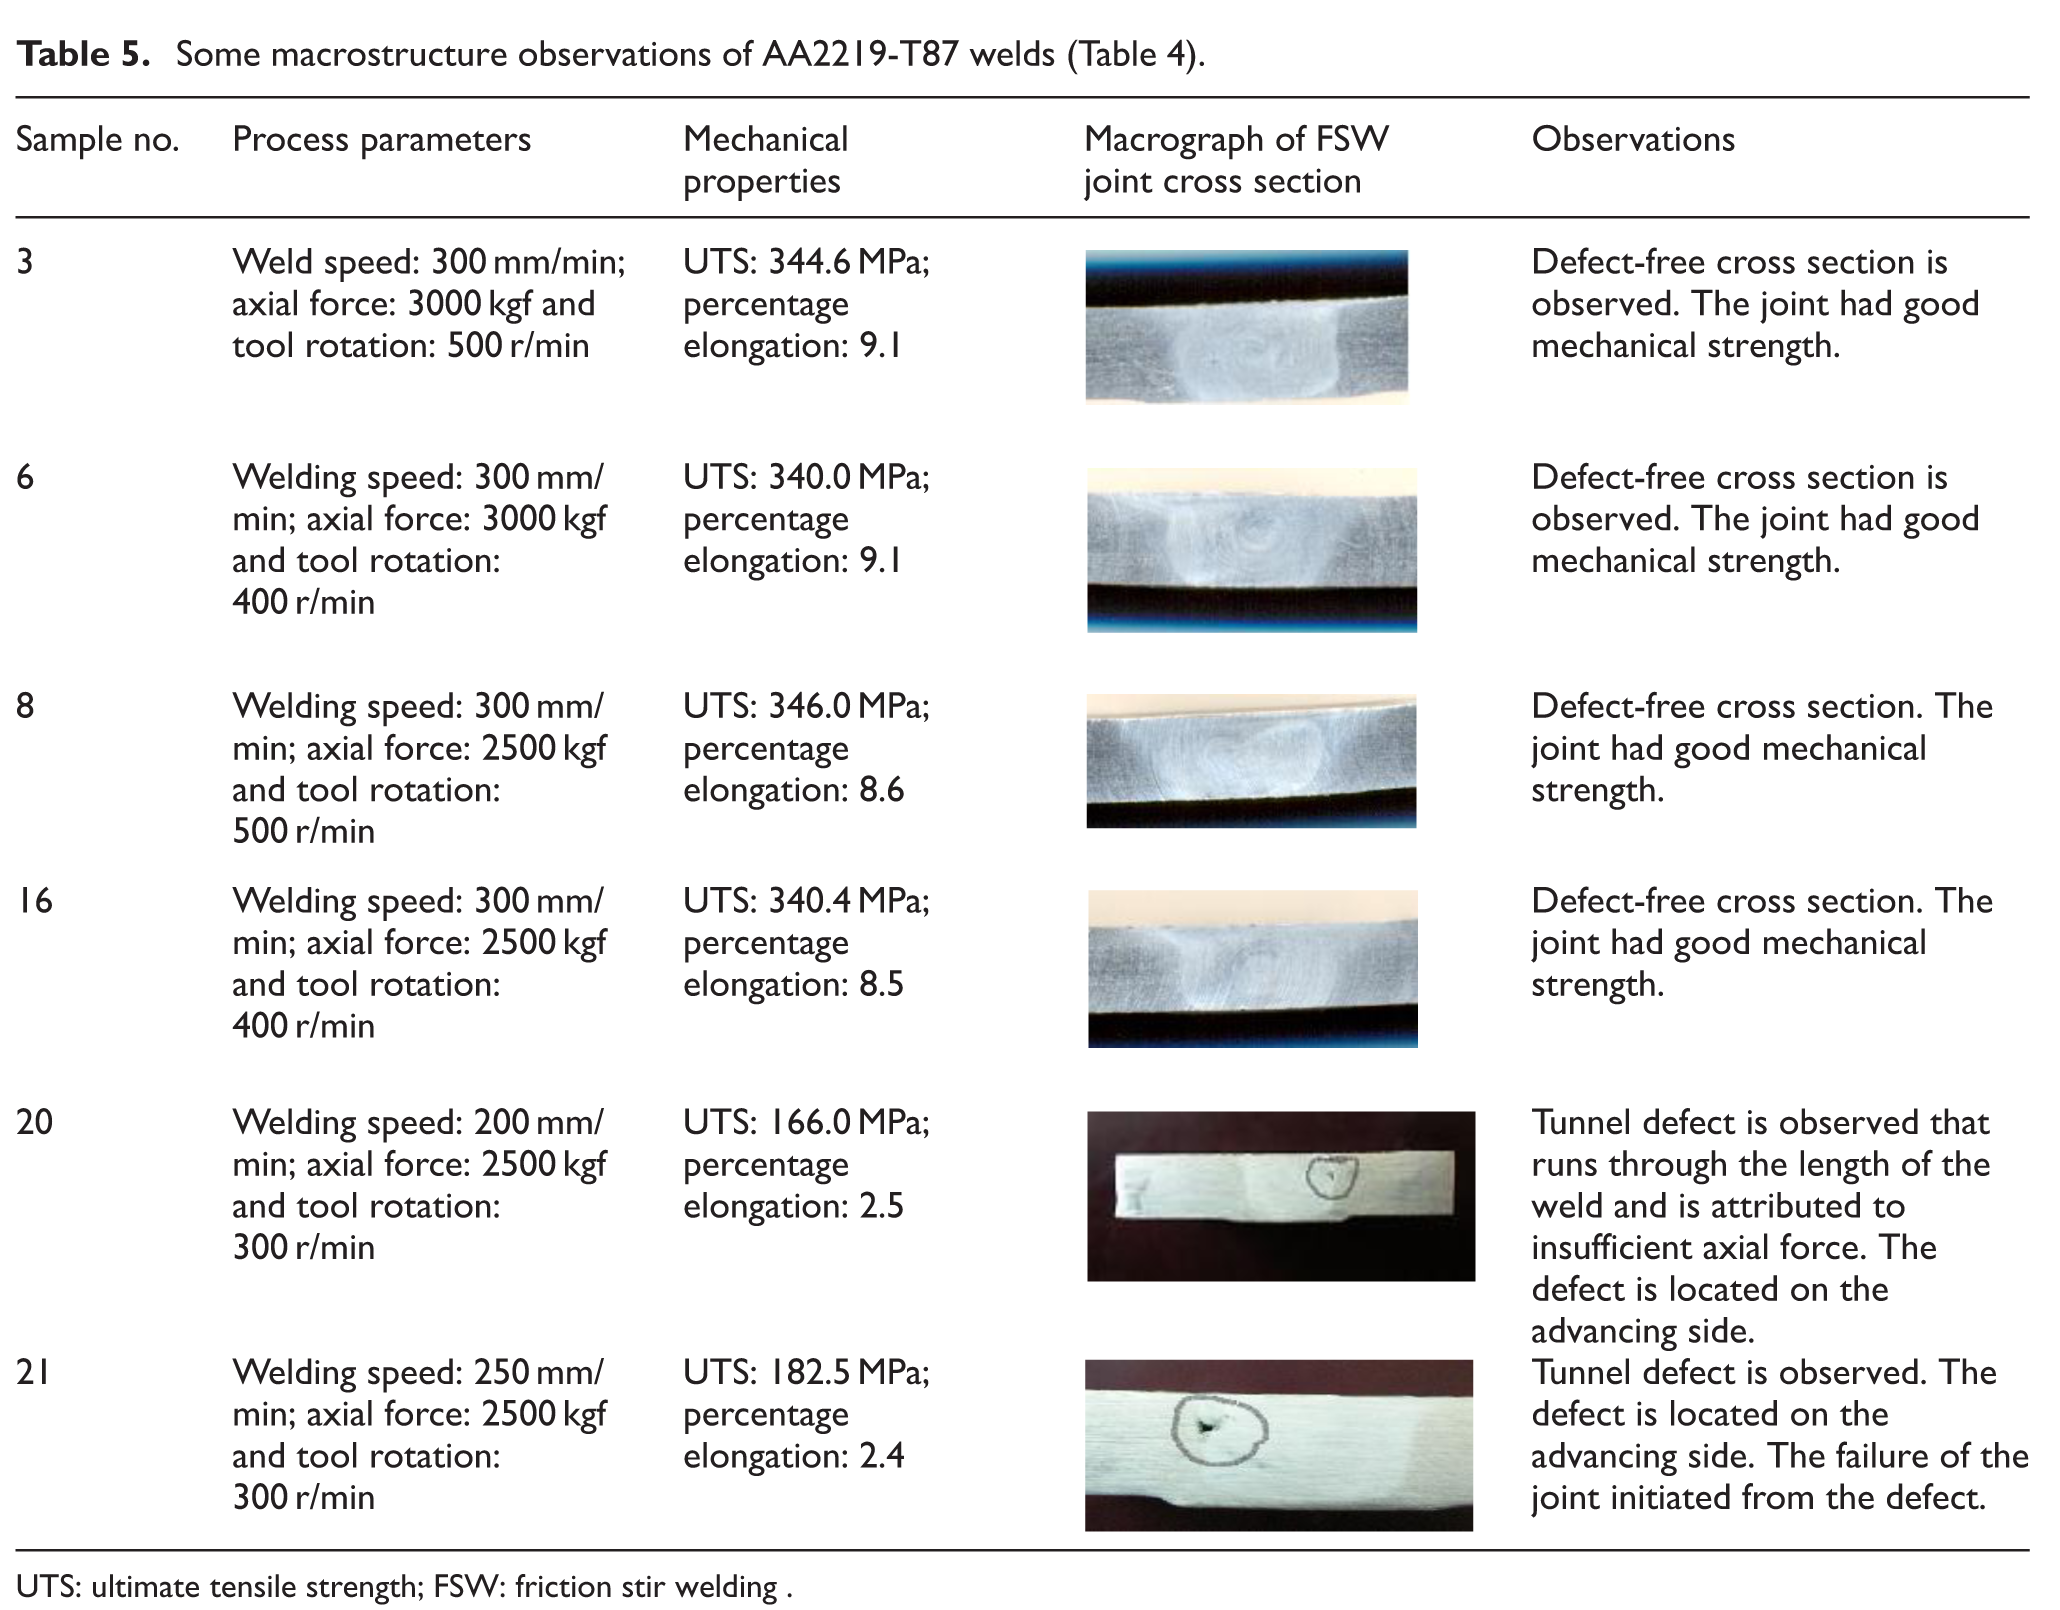
UTS: ultimate tensile strength; FSW: friction stir welding .
Surface response modeling and optimization
The aim of this study is to find out the welding parameter combinations that influence responses such as the UTS and percentage elongation. This was accomplished by means of ANOVA. Regression analysis was used to establish the correlation between the factors and responses. The appropriate degree of regression equation is found out, which can be considered as a useful assessment of the predictive equation. Finally, the optimal levels of the control factors (welding parameters) were obtained.
Effect of the factors on the UTS and percentage elongation
Figure 8(a) and (b) depicts the plots of the main effects for the UTS and percentage elongation of the welds. Based on these plots, the effect of each factor on the desired response can be assessed. From Figure 8(a), it can be clearly seen that the axial force (F) and tool rotational speed (N) have relatively significant effect on the UTS of the welds than the welding speed (V). The UTS of the welds increases steeply with the increase in the axial force and tool rotational speed up to a certain value beyond which the increase is more gradual. This is due to the fact that an optimum value of both axial force and tool rotation is needed to produce a good weld consolidation between the plates. The heat input and temperature distribution during the FSW are due to the frictional heat generation between the rotating tool shoulder and surface of the plate to be welded and the viscous heat that is generated due to the stirring action of the tool probe. Hence, the heat generation during FSW depends on the coefficient of friction and shear deformation of the joint material. The heat transfer phenomenon in FSW was explained by means of a rotating plug model by Raghulapadu et al. 19 In the rotating plug model, a shear surface around the FSW tool similar to that of the shear plane in the metal cutting operation is described. This shear surface around the FSW tool is represented with a sharp boundary between the recrystallized and the merely distorted areas. In other words, the shear surface around the FSW tool represents velocity discontinuity with a very narrow zone of high shear strain rate separating the metal rotating with the pin from the metal remaining in the weldment. The shear surface moves with the FSW tool. As the tool traverses and meets new metal, the new metal rotates with the tool and gets deposited behind the tool. 19 Apart from the properties of tool and plate material, the axial force influences the coefficient of friction. Thus, the axial force plays a significant role in the FSW process. On the other hand, there is a gradual increase in the UTS with the increase in the welding speed. A high welding speed means that the tool pin stirs the joint for a lesser time and hence at a lower temperature at the joint. This lower temperature and plastic deformation had led to the increase in UTS. From Figure 8(b), it can be seen that the percentage elongation increases with the increase in the axial force (F), where as the percentage elongation of the welds increases with the increase in tool rotational speed, the welds speed up to an optimum value. Also, from this plot, it can be observed that the tool rotational speed has a greater effect on percentage elongation than on the welding speed and the axial force.
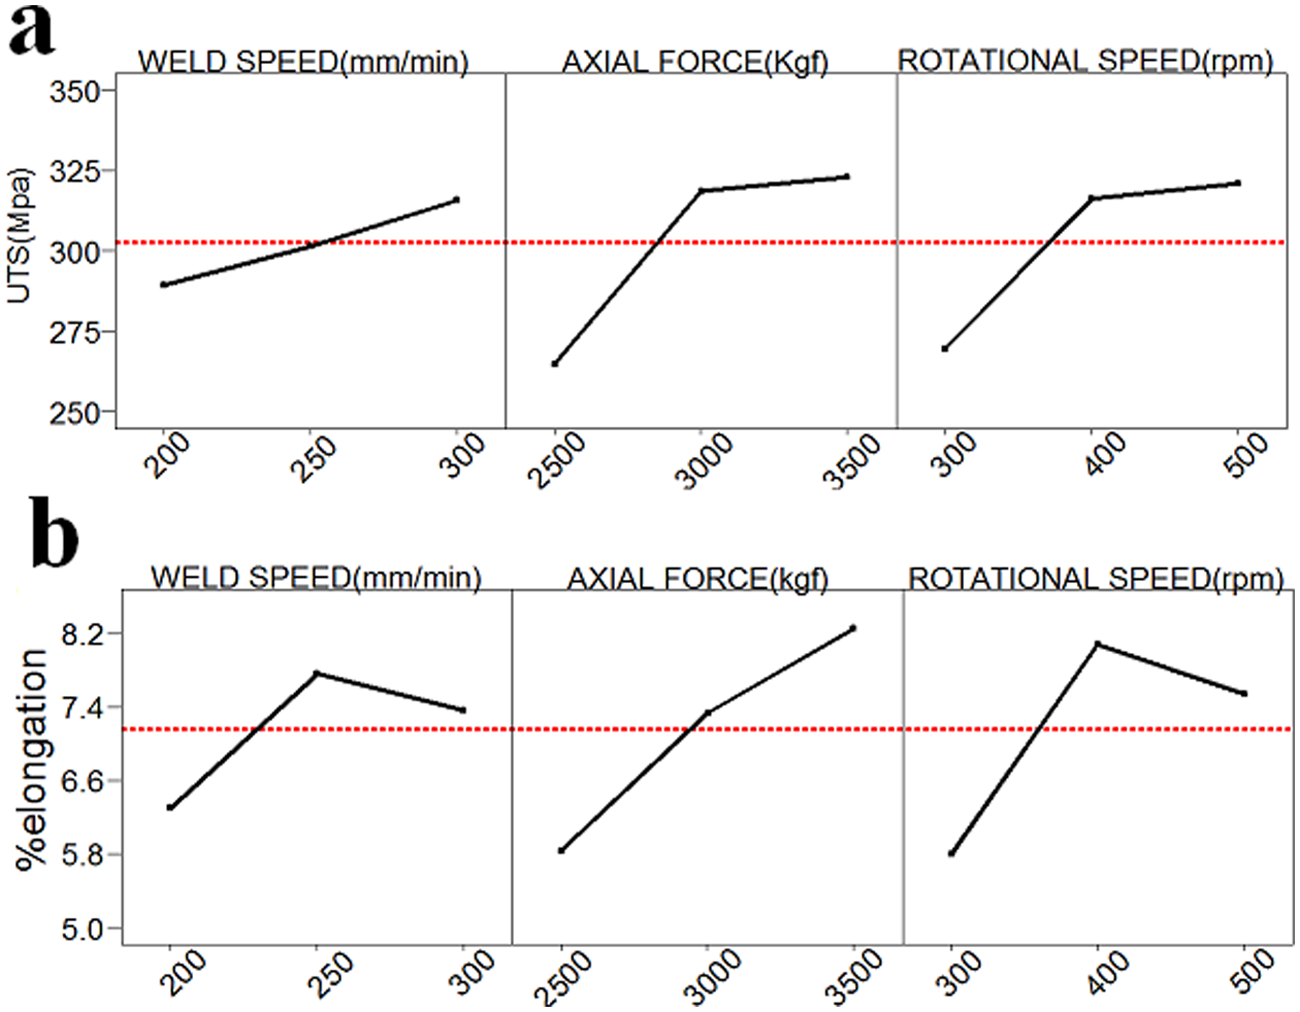
Main effects plot data means for (a) UTS and (b) percentage elongation.
Figure 9(a) and (b) depicts the interaction effects of the input process parameters on the UTS and percentage elongation. From Figure 9(a), it can be inferred that at lower values of weld speed, the axial force has more pronounced effect on the UTS, whereas at higher values of design range, that is, toward 300 mm/min, tool rotational speed has a pronounced effect on UTS. Also at lower values of axial force, the tool rotational speed has a pronounced influence on UTS and vice versa. Thus, from the interaction plots, it can be inferred that the tool rotational speed and axial force have greater effect on UTS. A similar effect can be inferred from Figure 9(b).
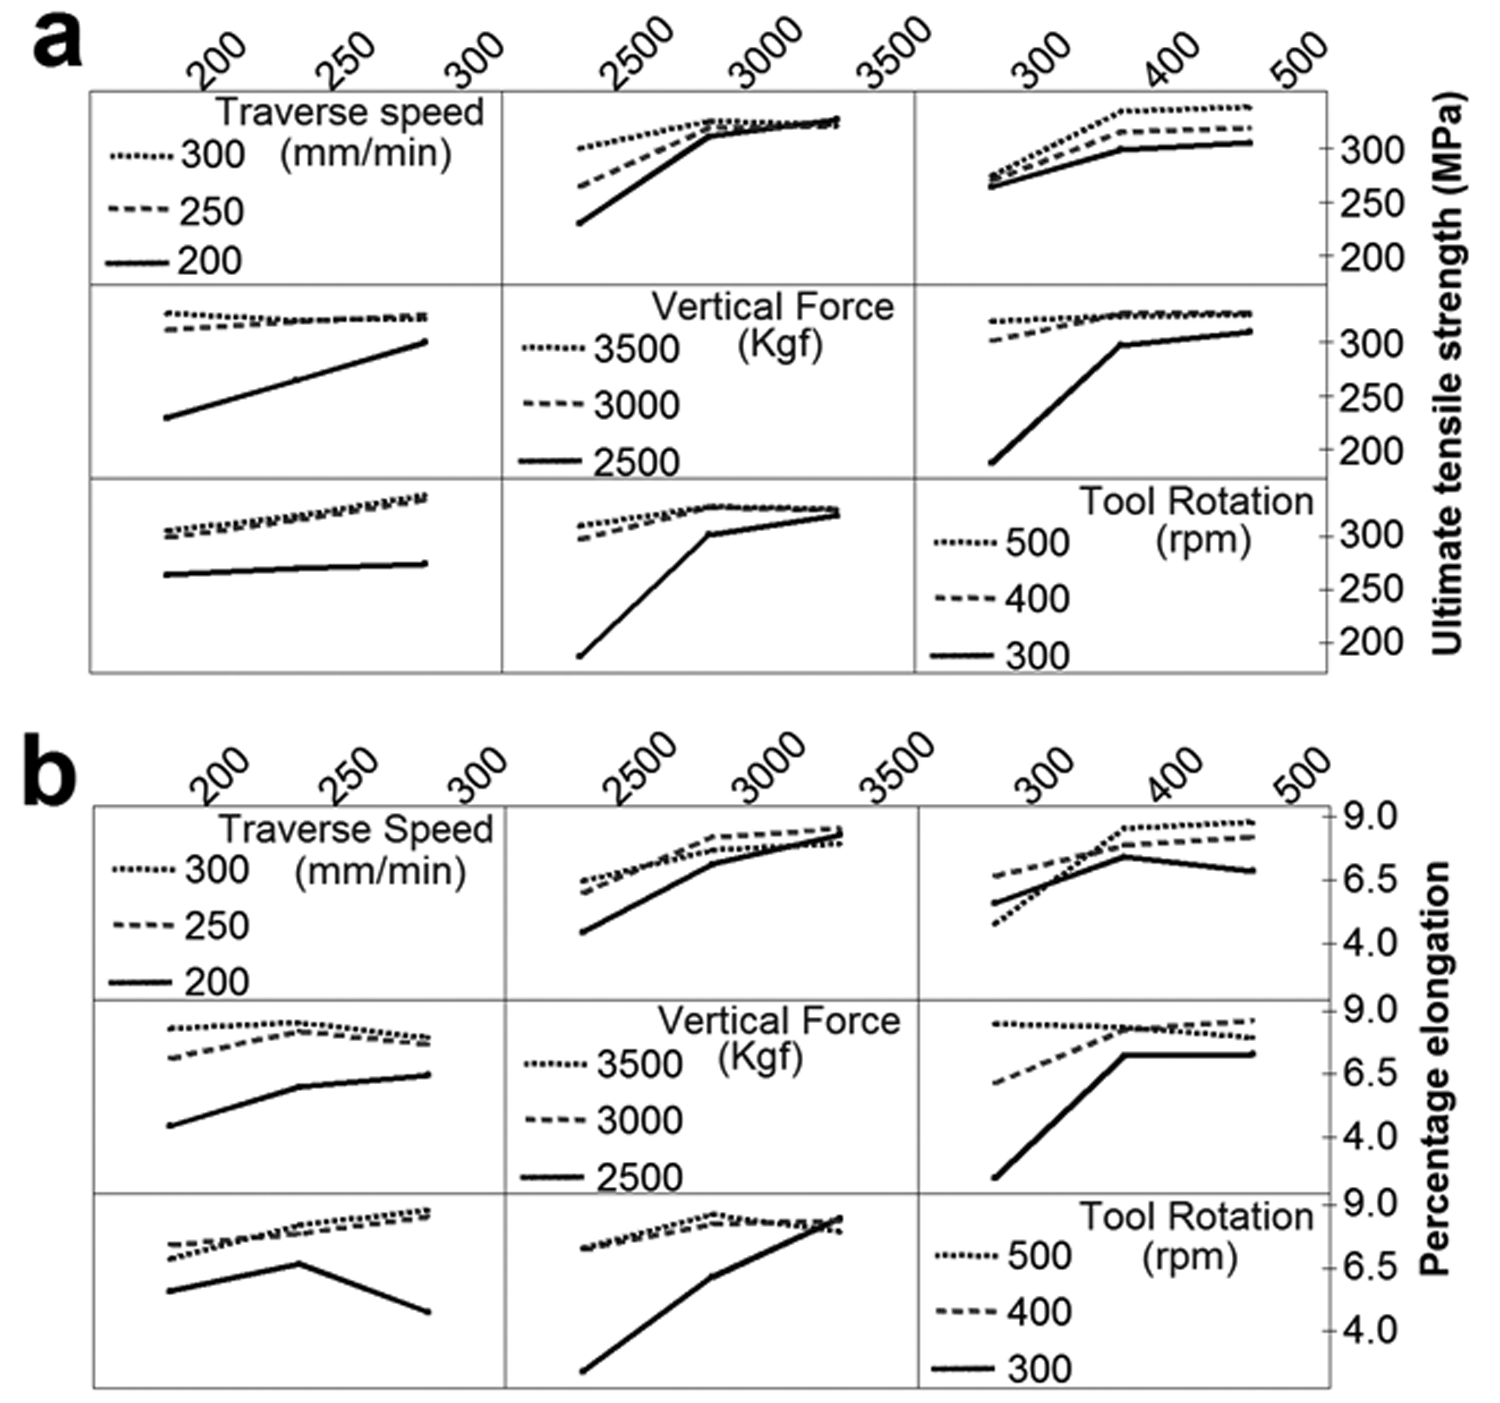
Interaction plot data means for (a) ultimate tensile strength and (b) percentage elongation.
Regression analysis
Regression analysis is performed to find out the relationship between the welding parameters and responses such as the UTS and percentage elongation. The R2 values indicate that the predictors explain 89% and 83.5% of the variance in the UTS and percentage elongation, respectively. Table 6 shows the ANOVA 20 data using the fitted model with linear, square and interaction terms and coefficient of factors and factor effects in regression model for UTS and percentage elongation.
ANOVA and estimated regression coefficient for responses 20 .
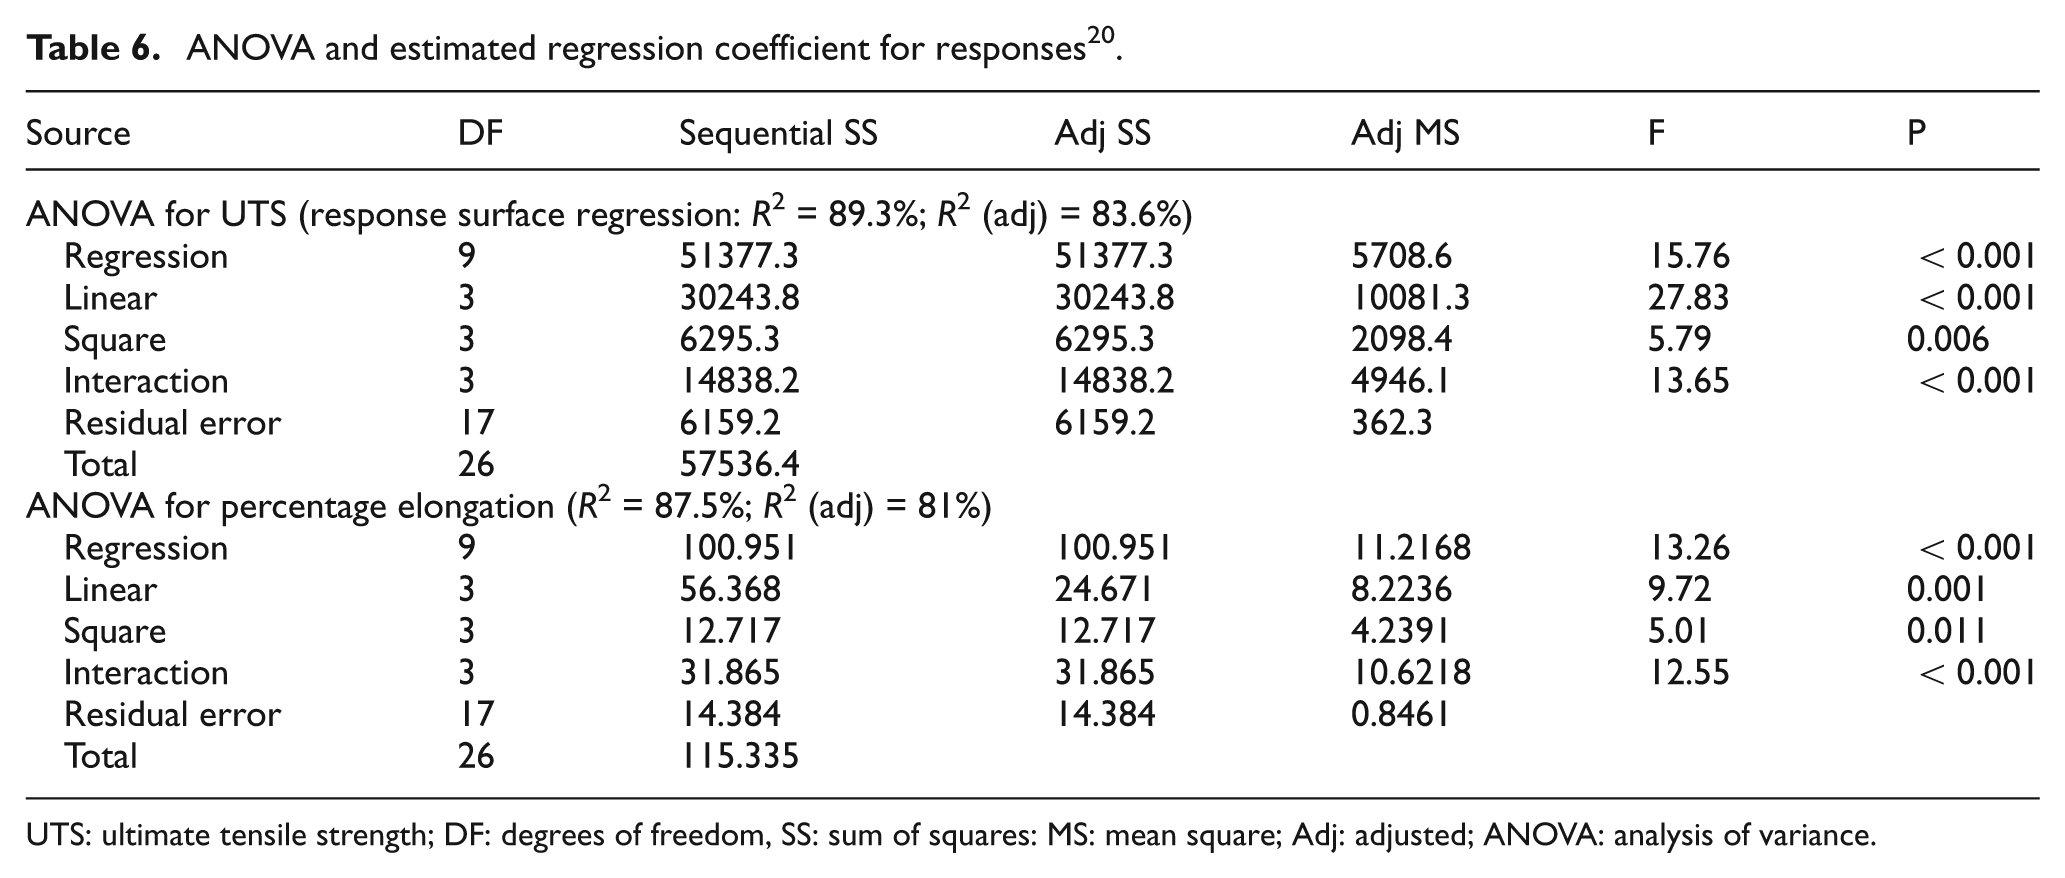
UTS: ultimate tensile strength; DF: degrees of freedom, SS: sum of squares: MS: mean square; Adj: adjusted; ANOVA: analysis of variance.
Least square method is used in the regression analysis to find the coefficients of the equation. Thus, the regression equation for UTS (MPa) using data in uncoded units, which satisfies all the 27 experimental cases, is given by
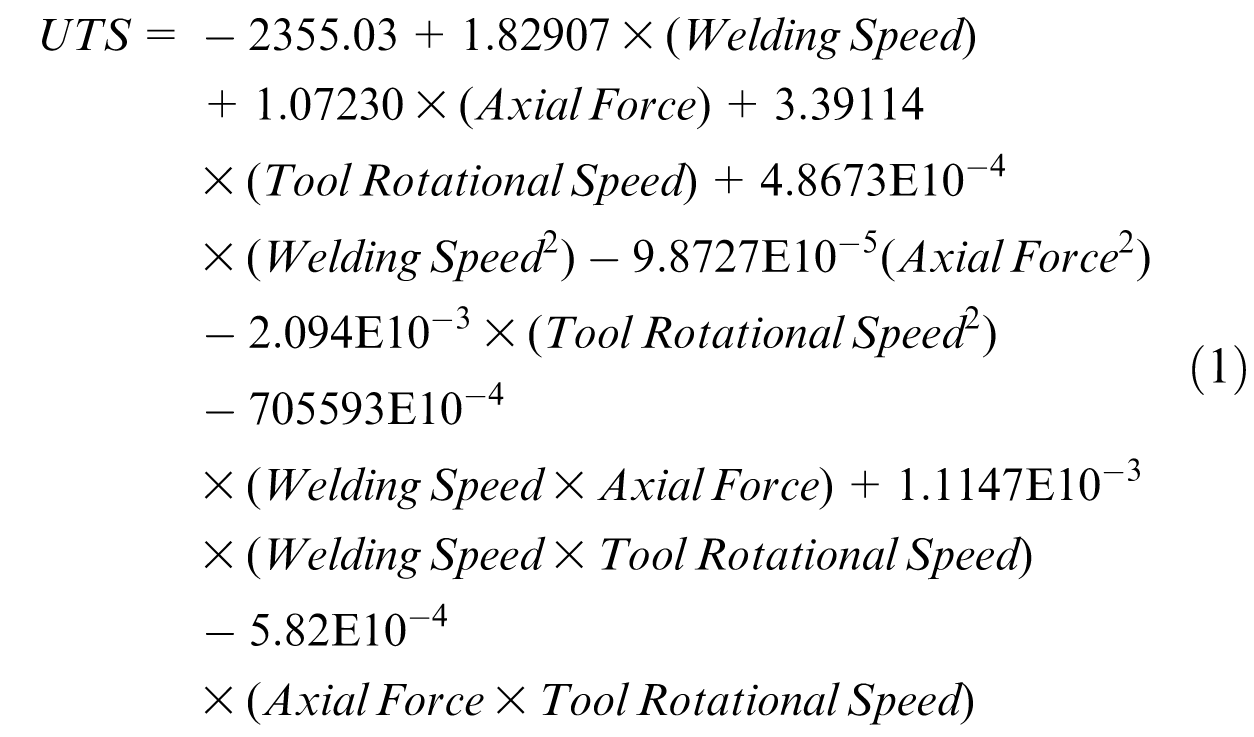
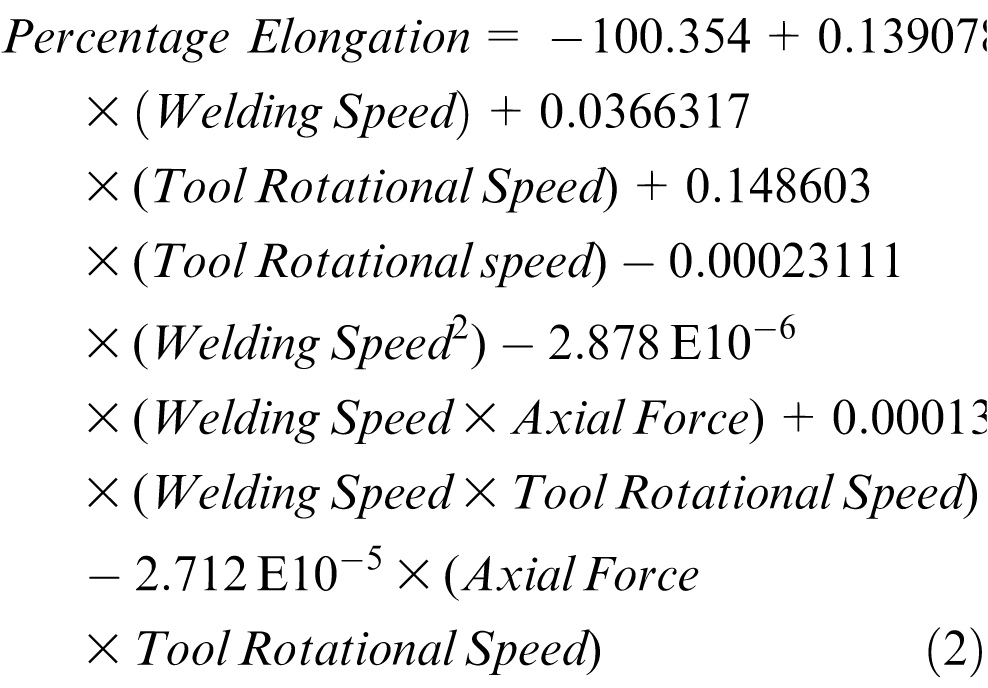
Similarly, the regression equation for percentage elongation of the welds using data in uncoded units is given by
Validation of the regression model
In order to establish the adequacy of the mathematical model, some test cases of welding parameters were selected at random other than the values at the levels 1, 2 and 3 as indicated in Tables 3 and 4. The actual values of the responses obtained from the test case experiments and that predicted by the regression model are shown in Table 7. Table 7 indicates the predicted welding parameter performance compared with the actual welding performance, and a reasonable agreement was obtained. It is observed that in case of UTS, the variation between the predicted and the actual values is within ±10%, whereas in case of percentage elongation, it is within ±20%. The above mathematical models for UTS and percentage elongation are of great importance in the proper selection of welding parameters for butt welding of AA2219 aluminum alloy.
Comparison of regression model results with experimental ones for test cases.
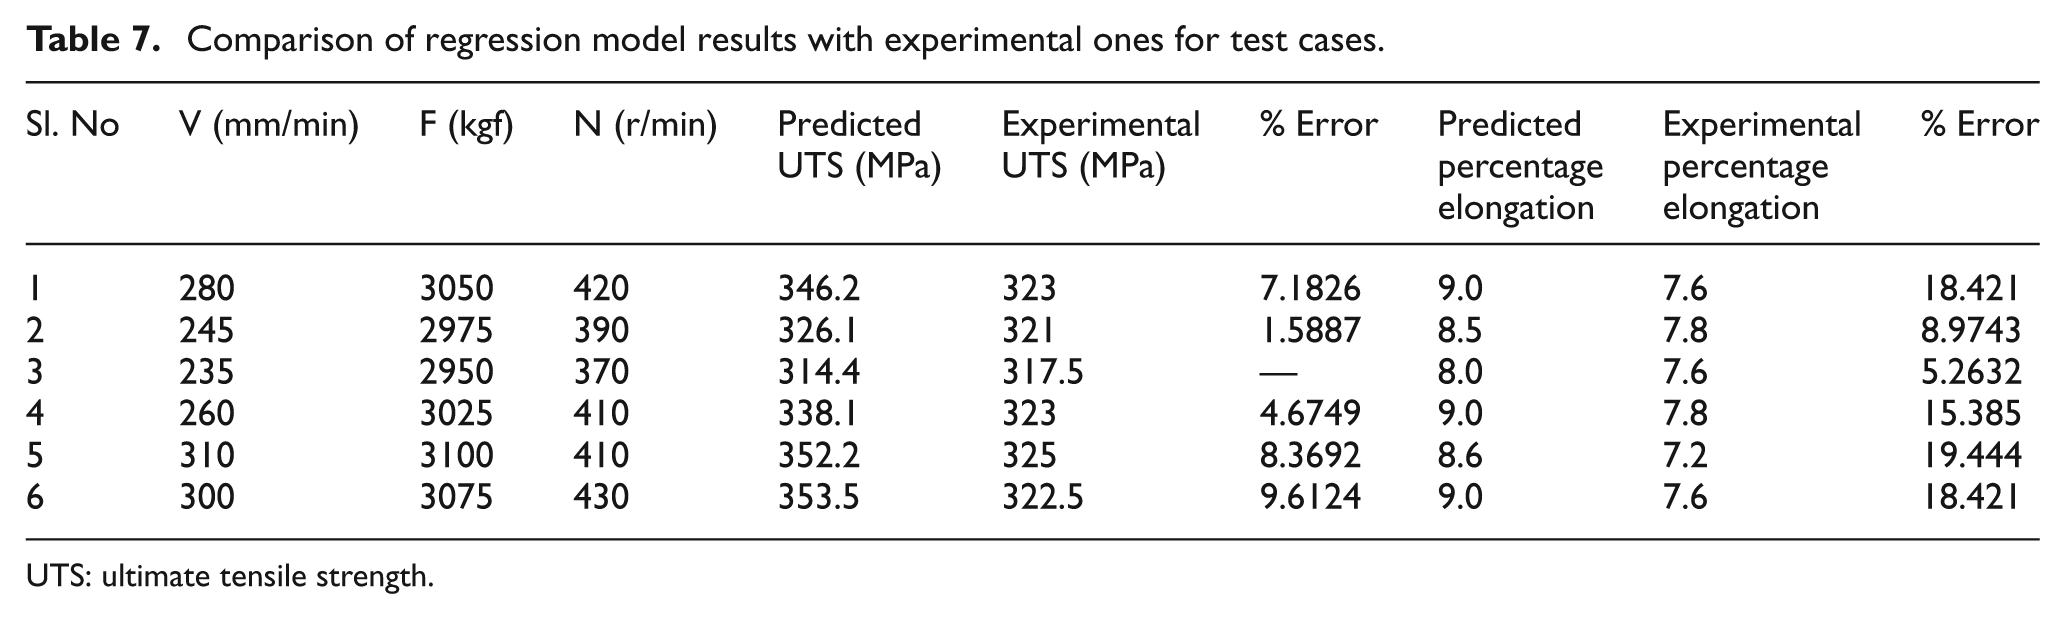
UTS: ultimate tensile strength.
Figures 10 and 11 indicate the three-dimensional response surface plots developed by taking two process parameters in the x- and the y-axes and response in the z-axis. In Figure 10, the response is the UTS, and in Figure 11, it is percentage elongation. The response surface plots clearly reveal an optimum response point. Response surface methodology is used to find the optimal set of process parameters that produce minimum or maximum value of a response. The convex nature of the surface clearly reveals that an optimum combination of process parameters exists for the UTS and percentage elongation.
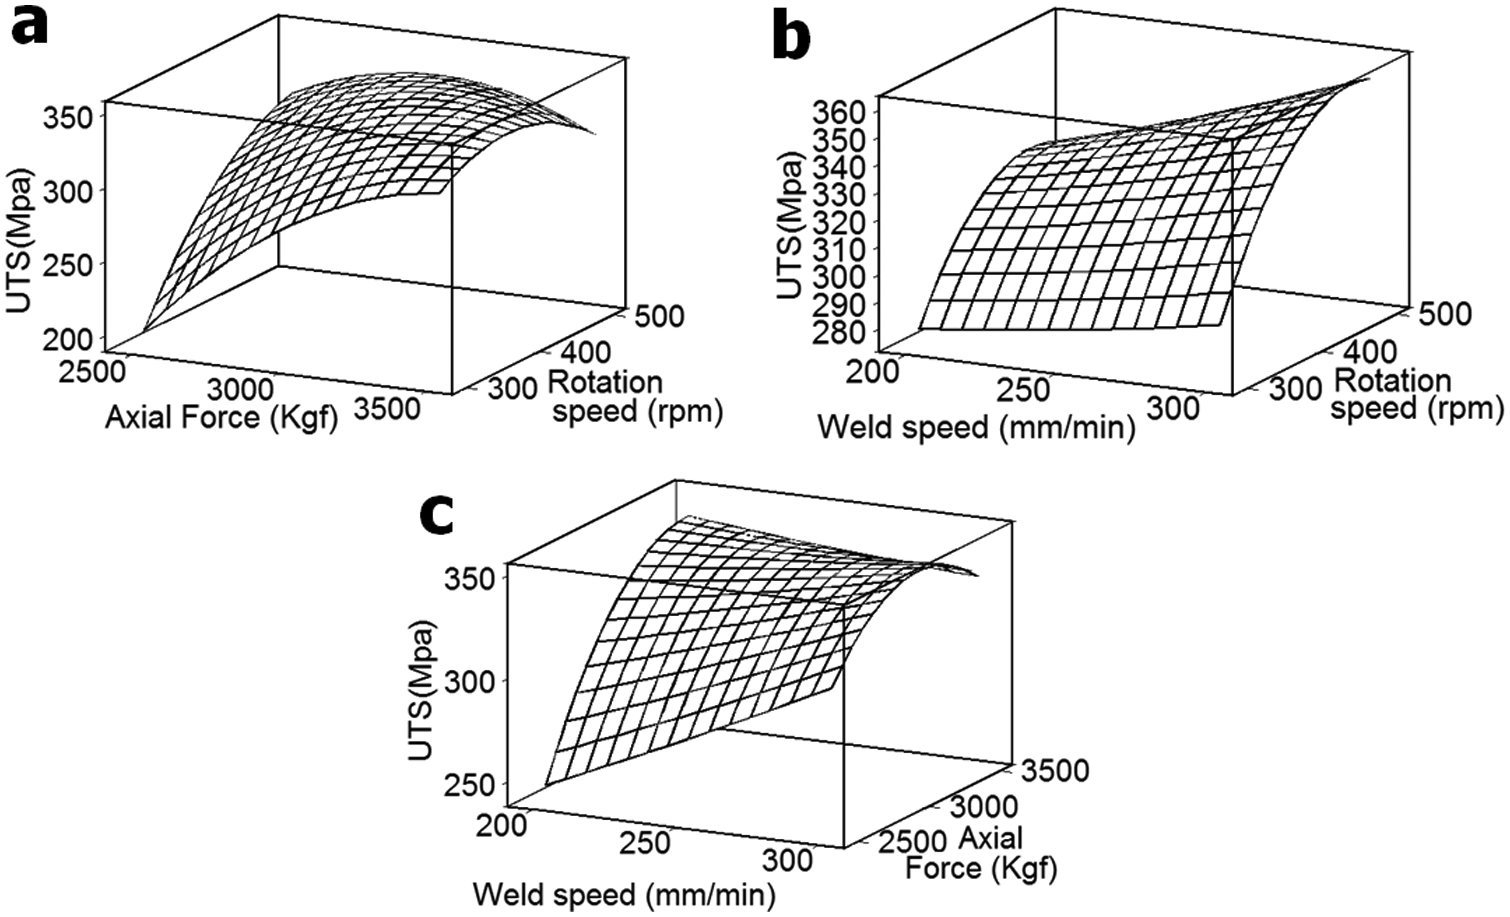
Surface plots for UTS with respect to (a) axial force and rotational speed, (b) welding speed and rotational speed and (c) welding speed and axial force.
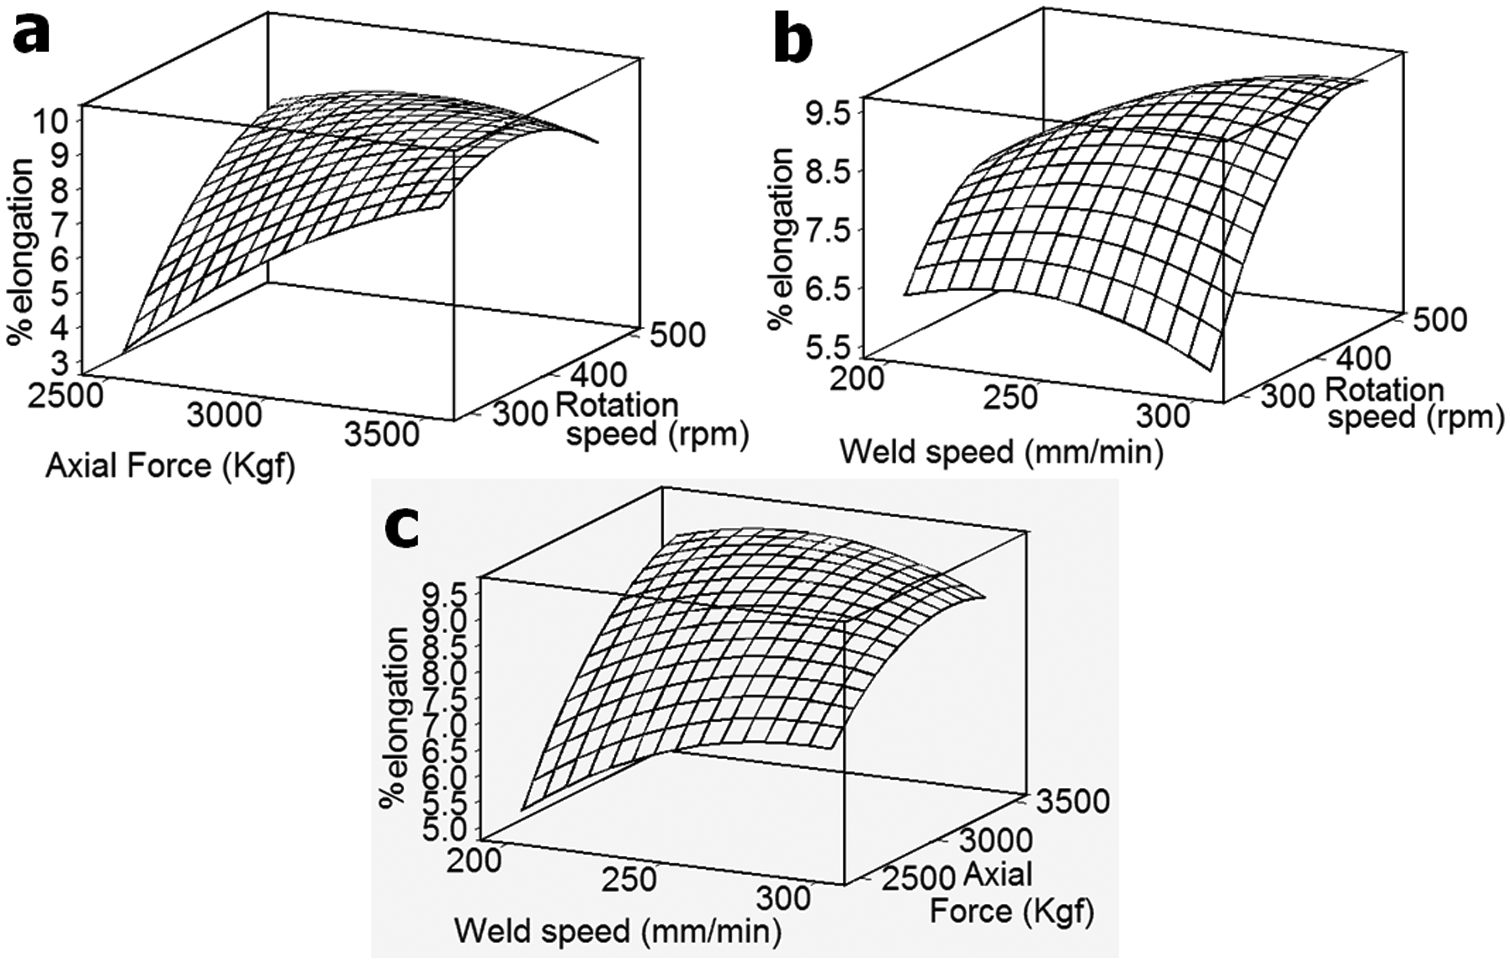
Surface plots for percentage elongation with respect to (a) axial force and rotational speed, (b) welding speed and rotational speed and (c) welding speed and axial force.
Multiresponse optimization of FSW weld characteristics
The FSW joint output characteristics such as UTS and percentage elongation are interdependent, and a multiresponse optimization technique is considered appropriate for optimizing the input process parameters. For multiresponse optimization problems, the desirability function–based optimization techniques have been advocated.21–24 In the present investigation, using the multiresponse optimization technique, the individual desirability value of FSW joint characteristics such as UTS and percentage elongation was utilized to compute the optimal desirability function. The optimal desirability function represented the optimal FSW joint characteristics.21–24 The desirability function was maximized to obtain the optimum FSW control factors (input parameters). For the present investigation, the FSW joints were considered of better quality with better UTS and percentage elongation. In this investigation, “higher is better” criteria was used to optimize the FSW joints’ UTS and percentage elongation. To accomplish the optimization, the target responses such as UTS and percentage elongation were set with an optimal desirability function having value close to 1. 24 The response surface regression equations were then utilized for predicting the optimal FSW input process parameter (control factors) based on the optimal desirability function. In the present study, UTS and percentage elongation are jointly optimized using the response optimizer option of Minitab software.23,24 In case of UTS, the target value was given as 340 MPa, lower and upper bounds as 330 and 346 MPa, respectively. Similarly, for percentage elongation, the target value was given as 9, and the lower and upper bounds were given as 8 and 9.5, respectively. The predicted sets of input variables in order to achieve the desired response and its comparison with the experimental results are given in Tables 7 and 8, respectively. The individual desirability “d” for UTS and percentage elongation is 0.99416 and 0.98210, and the composite desirability “D” is 0.99295, which are all very close to the ideal desirability value of 1. Test coupons were welded with the predicted optimized input process variables as given in Table 8. Tensile weld specimens were prepared and tested for UTS and the percentage elongation. The average value of UTS and percentage elongation for four tensile test specimens were found to be in good agreement with the predicted target response values as indicated in Table 9.
Target output and predicted optimized input variables.
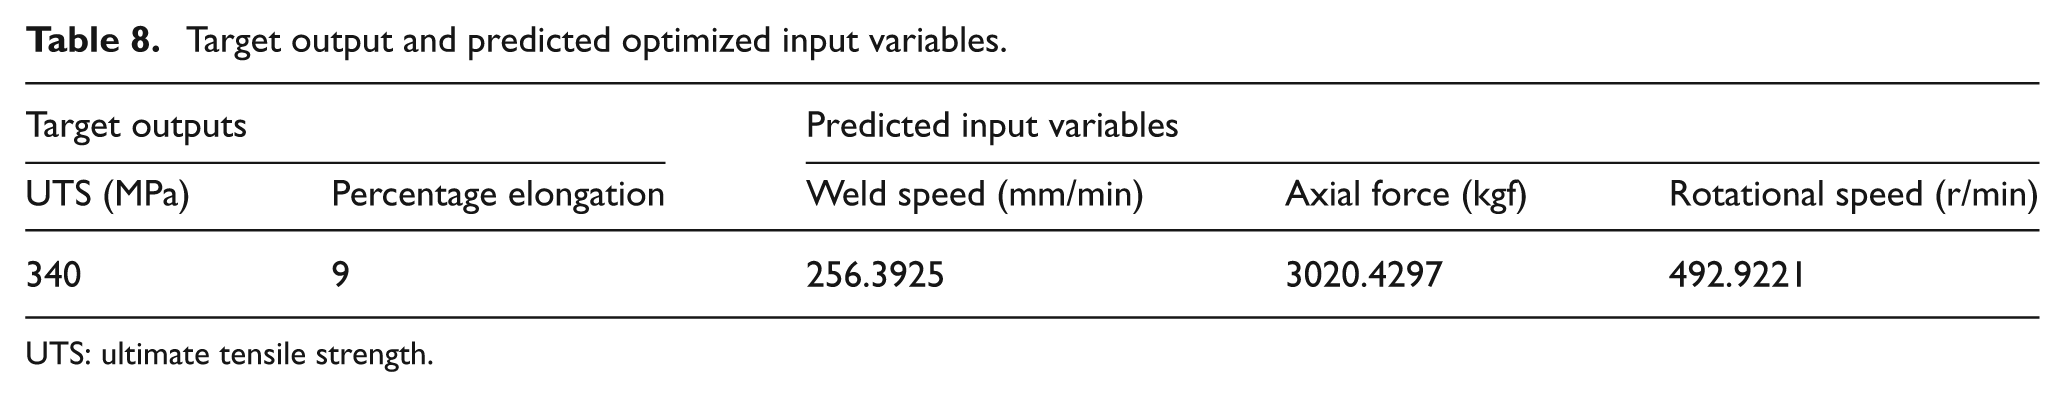
UTS: ultimate tensile strength.
Comparison of predicted optimized output and the experimental output.
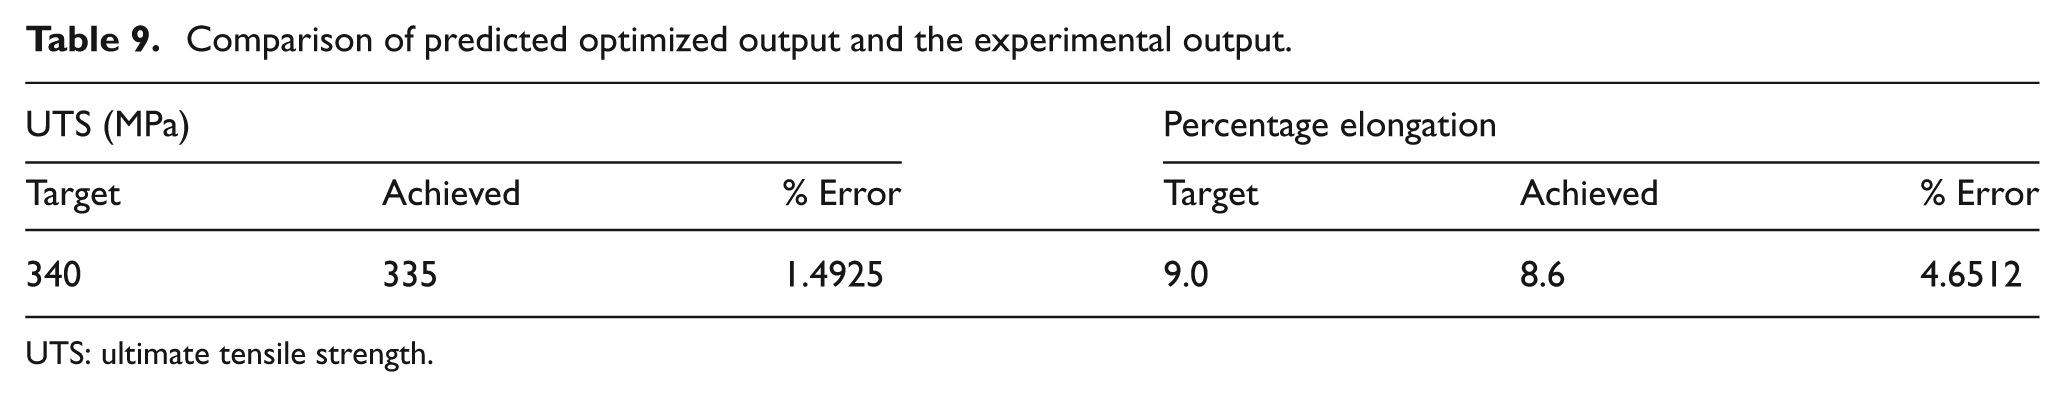
UTS: ultimate tensile strength.
Conclusion
In this article, an experimental investigation was performed to study the UTS and percentage elongation of friction stir welded AA2219 aluminum alloy welds. Mathematical models were also developed to predict the UTS and percentage elongation of the welds. The relative effects of each factor and the combination of factors on responses were also investigated. The welding parameters were optimized by using the multiresponse desirability function–based optimization technique. The optimized input variables that yielded the target values of responses were found to be with welding speed of 256.4 mm/min, axial force of 3020.4 kgf and rotational speed of 492.9 r/min. The main conclusions are summarized as follows:
The UTS and percentage elongation increases with the increase in axial force applied by the FSW tool on the joint. The UTS also increases with the increase in weld speed and tool rotational speed. The percentage elongation increases with the increase in weld speed and tool rotational speed up to an optimum value beyond which there is a decrease in the percentage elongation.
According to ANOVA results, axial force was found to be the most influencing factor on UTS and percentage elongation, followed by tool rotational speed and then the weld speed.
The results of the regression analysis and response surface analysis indicated the suitability of the data for predicting the output responses for the test cases.
The data were further used for optimization of responses, and the target-optimized responses were compared with the experimental data. There was a good agreement between the two.
The results of the modeling and optimization techniques applied in the present investigation indicate their suitability for modeling of FSW of AA2219-T87 aluminum alloy plates of 7 mm thickness.
Footnotes
Acknowledgements
The present work is dedicated to Late Shri Ajai Agarwal (Faculty, MIED, IIT Roorkee), who was also one of the supervisors of this work. Furthermore, the authors would also like to extend their gratitude to Hindustan Aeronautics Limited, Bangalore, India, for extending the FSW facility at their PSLV welding shop for conducting the experimental works. The authors gratefully acknowledge Indian Space Research Organization (ISRO) for providing the necessary material for the experimental work. The authors would also like to thank Shri T. Mohapatra, General Manager, HAL (Aircraft Division), Bangalore; Shri Ravishankar, General Manager, LPSC-HAL Work Centre (LHWC); and Shri P. Srinivasa Rao, Scientist (ISRO) for their timely help and support.
Funding
This research received no specific grant from any funding agency in the public, commercial or not-for-profit sectors.