
Abstract
In this study, sawability analyses of granitic rocks were carried out using segmented circular diamond sawblades. In the experimentations, a computer controlled cutting machine was used and the experiments were performed with the same-direction cutting mode. Effects and contribution of each operating variable (the peripheral speed, workpiece traverse speed, cutting depth and flowrate of cooling fluid) on the cutting force were determined and cutting forces were correlated with rock properties. Moreover, models were built depending on the operating variables and the rock properties (physico-mechanical and mineralogical properties) for the estimation of cutting force. The results indicated that the higher cutting forces were obtained for higher cutting depth and traverse speed and for lower peripheral speed and flowrate of cooling fluid. The most significant operating variable affecting the cutting force was determined as cutting depth. It was concluded that rather than the physico-mechanical properties, mineralogical properties (such as quarts, plagioclase and feldspar content) is the dominant rock properties affecting the cutting force. Results also revealed that the predictive models derived from operating variables and materials properties have high potentials for practical applications.
Introduction
Circular diamond sawblades have extensive applications in the processing of natural stones. Because of its potential applications in sawing rocks, various attempts have been made in the relevant literature in order to investigate and optimize the sawblades performance. Jennings and Wright 1 defined the factors affecting sawblade performance. Luo and Liao 2 investigated the worn surfaces of diamond segments in sawing of hard and soft granites. The results of the study showed that when cutting the relatively soft granite, the worn particles produced a greater portion of whole crystal and micro-fractured grit on the worn surface and the amount of crystal pull-out was also high. Xu 3 investigated the friction characteristics of the process in circular sawing of granites with diamond segmented sawblade. The results indicated that most of the sawing energy was expended by friction of sliding between diamonds and granites. The sawing mechanism and structural properties of diamond impregnated circular saws were explained by Konstanty. 4 Tönshoff et al. 5 emphasized that the natural stone sawing process is a complex system influenced by a variety of factors. They listed the factors as follows: physical material properties of the stone, such as grain size and strength, forces between the diamonds and the material, stress distribution in the rock, and temperatures in the tool–workpiece interface. Lan et al. 6 conducted sawing tests for the cutting performances of sawblades manufactured with a new formula. The researchers concluded that the sawblade segments with SiC whiskers up to 2vol% had a higher cutting efficiency and longer life than that of the segments without SiC whiskers. An experimental study was conducted by Xu et al. 7 to investigate the characteristics of the force ratio (tangential force/normal force) in the circular sawing of several kinds of granites. Researchers found that the cutting depth ranked first in governing two force components compared with workpiece velocity. Eyuboglu et al. 8 investigated the relationship between blade wear and the sawability of andesitic rocks. In their study, a multiple linear regression analysis was applied to derive a prediction equation of the blade wear rate. The study showed that the wear rate could be predicted from the statistical models using a number of stone properties. In the study, shore scleroscope hardness was determined as the most important rock property affecting wear rate. Ersoy and Atıcı 9 sawed a group of rocks using three types of diamond circular saws at different feed rates. The results of the study demonstrated that a high feed rate was associated with the low cutting energy for the diamond saws. In the study, excellent relationships between the cutting performance and material properties were also established. An experimental study was conducted by Kahraman et al. 10 to analyze the performance of large-diameter circular saws in sawing of different carbonate rocks. Slab production was selected as performance criteria and models were developed using multiple curvilinear regression analysis for the estimation of slab production. The results of the study showed that the slab production could be estimated using one of the models built. Buyuksagis and Goktan 11 investigated sawing performances of different types of marbles. For the tested marbles, the researchers determined the optimum sawing conditions in terms of specific energy. They found that shallow cutting depths and low workpiece travel speeds were highly inefficient in terms of specific energy. Delgado et al. 12 indicated that the use of microhardness could provide more precise information in sawability studies of rocks. Xipeng and Yiging 13 evaluated the sawing performance of Ti–Cr coated diamonds. They concluded that the wear performance of the specimens with coated diamonds was improved, as compared with uncoated diamonds. Buyuksagis 14 carried out a study to investigate the influence of the cutting mode on sawing performance. The results of the study showed that the better performances were obtained in the up-cutting mode. Fener et al. 15 predicted the performance of circular diamond saws from mechanical properties of rock in cutting carbonate rocks. They found strong correlations between compressive strength, tensile strength and Los Angeles abrasion loss, and production. Yilmaz and Göktan 16 investigated the effect of sawing rate on the force and energy requirements of two granite types. The authors concluded that higher sawing rates and feed velocity, and lower cutting depth improved the efficiency of the process in terms of cutting forces, power and specific energy, respectively. The authors also indicated that the magnitude of this improvement varied with respect to the mineralogical properties of the tested rock. Ucun 17 found that as an alternative coolant, the using of boron–oil resulted in a decrease in power consumption, specific energy and specific wear of the diamond segments. Yilmaz et al. 18 carried out an experimental study to determine the most significant rock properties influencing sawblade wear performance. Maximum grain size of quartz and alkali feldspar minerals were determined as the most dominant factors influencing specific wear rate. The author also emphasized that the quartz content alone might not be a major contributor to sawblade wear performance owing to relatively weak correlations between quartz content and specific wear rate.
The cutting force is an important parameter for better understanding the cutting process, since they are directly related to the tool wear, cutting temperatures and surface integrity. 19 In order to achieve a better understanding of the cutting process of any rock, a model is required to demonstrate the relationship between cutting force and the variables (operating and rock properties) affecting the cutting force. It is very hard to build a predictive model for the cutting force, valid for all rock types since the effect of the process parameters and materials properties on sawing performance varies from one rock type to another. Therefore, a particular group of rocks (granitic rock) were studied in this study. This work aims at investigating the relationship among the cutting force and the relevant operating variables (such as peripheral speed, traverse speed, cutting depth and flowrate of cooling fluid) and material properties (physico-mechanical and mineralogical) of rocks tested. The study also aims at modeling the cutting force as a function of both operating variables and material properties.
Experimental study
Experimental set-up
Cutting tests were performed on a high precision cutting machine (Figure 1). The cutting machine consists of three major sub-systems: a cutting unit, instrumentation and a PC. The diamond sawblade used in the tests was of 40 cm diameter, having 28 impregnated diamond segments (circumferential length 40 mm, width 3.5 mm and height 10 mm). The diamonds were sized at 40/50 US mesh with a concentration of 30, which is recommended for the sawing of hard materials. Sawblade movements, forward–backward in the horizontal plane and up–down in the vertical plane, were driven with two 0.75 kW a.c. motors, while the turn of the disc were driven with a 4 kW a.c. motor. Moreover, a 0.75 kW a.c. motor was used to move the wagon through the cutting line. Operating variables such as peripheral speed, traverse speed, cutting depth, traverse speed, flowrate of cooling fluid, vertical and horizontal axial forces were measured using sensors, load cells, transducers and an encoder in the monitoring system. All movements of the cutting machine were controlled by the computer and industrial electronic cards. Transmissions to the computer were carried out using processing software.
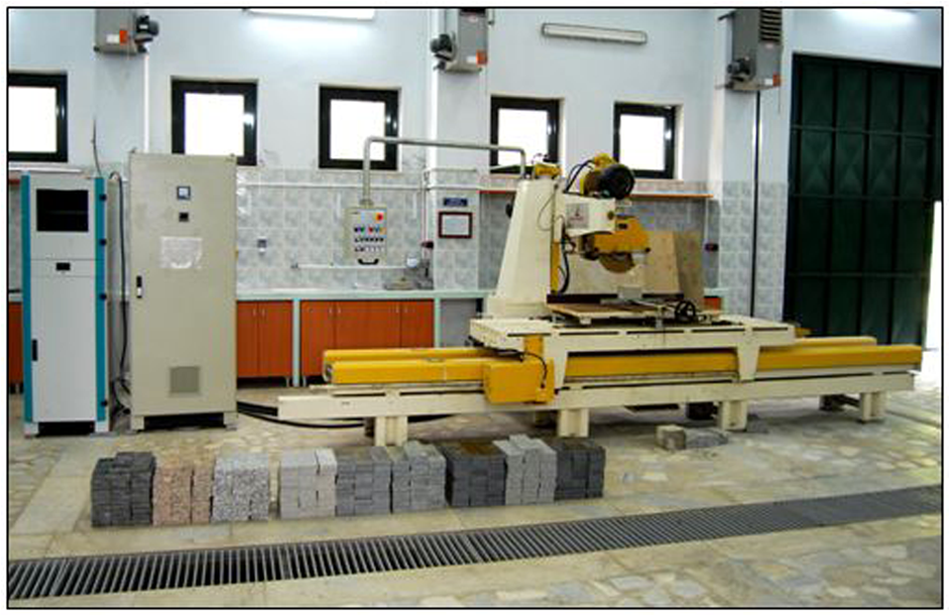
Experimental set-up.
Material characteristics
For the execution of experiments, nine granitic rocks having different percentages of minerals, different grain size distributions and substantial market potential were selected from a stone processing plant and dimensioned according to the requirements of experimental studies. The selected rocks include Verde Butterfly (R1), Giallo Fiorito (R2), Porto Rosa (R3), Crema Lal (R4), Giresun Vizon (R5), Balaban Green (R6), Bergama Gri (R7), Nero Zimbabwe (R8) and Star Galaxy (R9). The samples have a length of 30 cm and 10 cm × 3 cm section.
Some properties of the tested granites are presented in Table 1. It may be important to note that, in practice, there are serious difficulties for supplying enough samples having suitable dimensions, preparing and testing for their mechanical properties, such as uniaxial compressive and bending strength. For these reasons, the uniaxial compressive and flexural strengths of the tested rocks were provided by the stone processing company where the tested rocks were supplied. Density (kN/m3), water absorption by volume (%), porosity (%), ultrasonic velocity (m/s), Schmidt hammer hardness and shore hardness were determined according to related ISRM 20 suggested methods.
Mechanical and intact properties of the rocks used in the sawing tests.
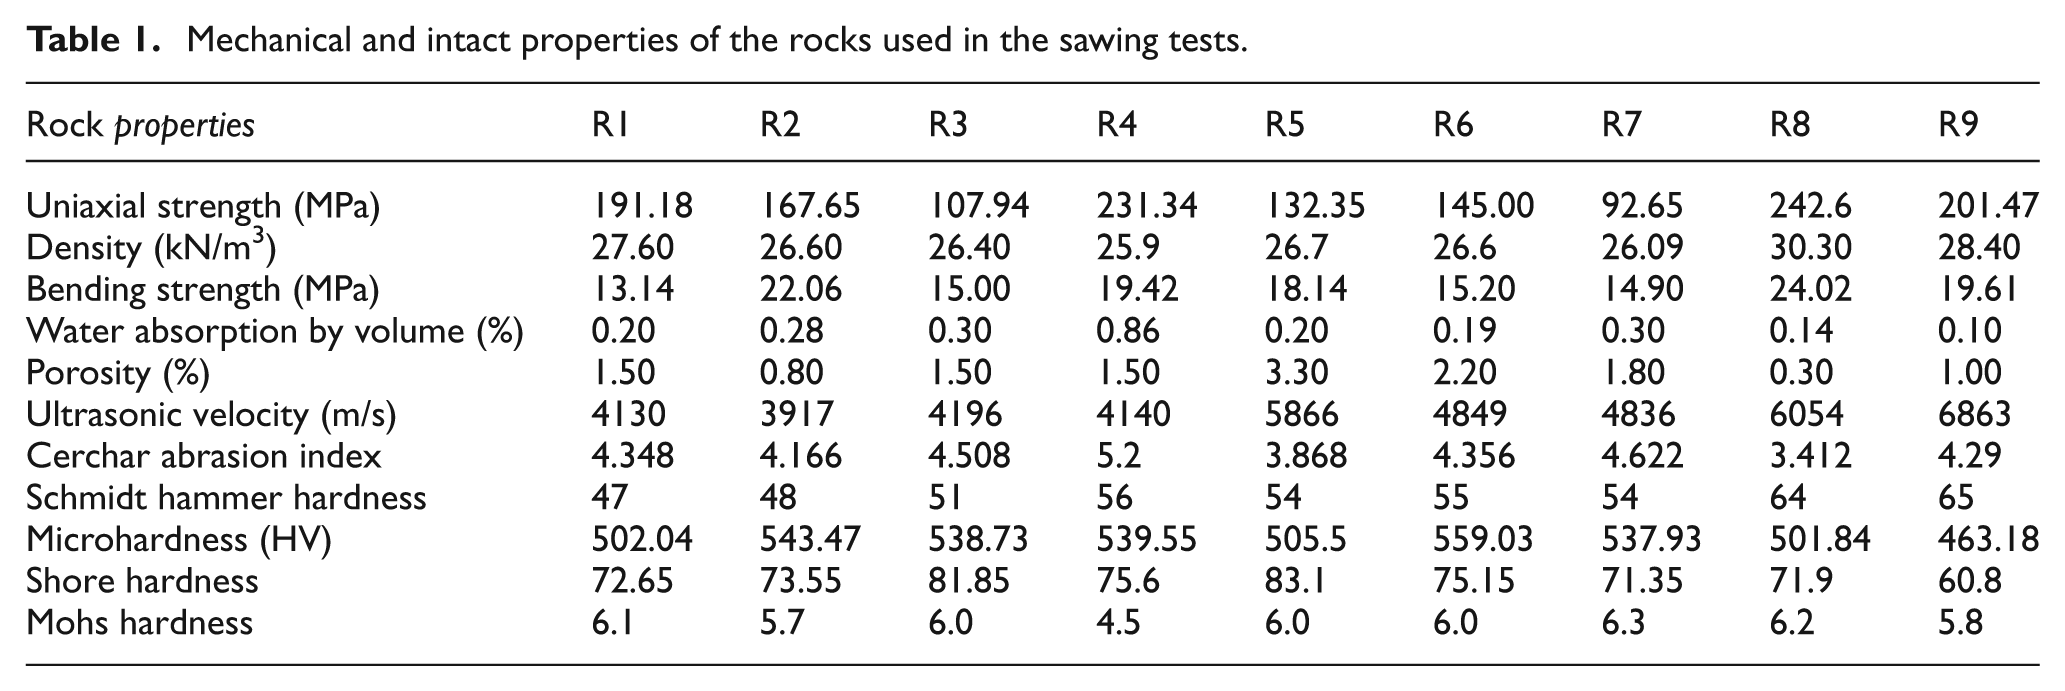
The microhardnesses of samples were measured by a Vickers Microhardness Meter, which is an average of 3–5 points for a mineral. In the experiment, it is difficult to identify indention diagonal of various hard brittle minerals owing to the fracture around the indention, thus a measure load of 100 g was chosen. 21 Microhardness stands for a weighed average value of granite microhardness in a whole, concerning mineral microhardness and its weight in granite. Similar procedure was applied for the determination of Mohs hardness of each rock sample.
For Cerchar abrasiveness index testing, a pointed steel pin that has 610 ± 5 Vickers hardness, 200 kg/mm2 tensile strength and a cone angle of 90° was applied to the surface of the rock samples for approximately 1 s under a static load of 68.646 N to scratch a 10 mm long groove. This procedure was repeated five times in various directions using a fresh pin for each repetition. The abrasiveness of the rock was determined by the resultant wear flat generated at the point of the stylus, which was measured in 0.1 mm units under a microscope. The unit of abrasiveness was defined as a wear flat of 0.1 mm, which is equal to 1 Cerchar abrasivity index, ranging from 0 to 6.22,23
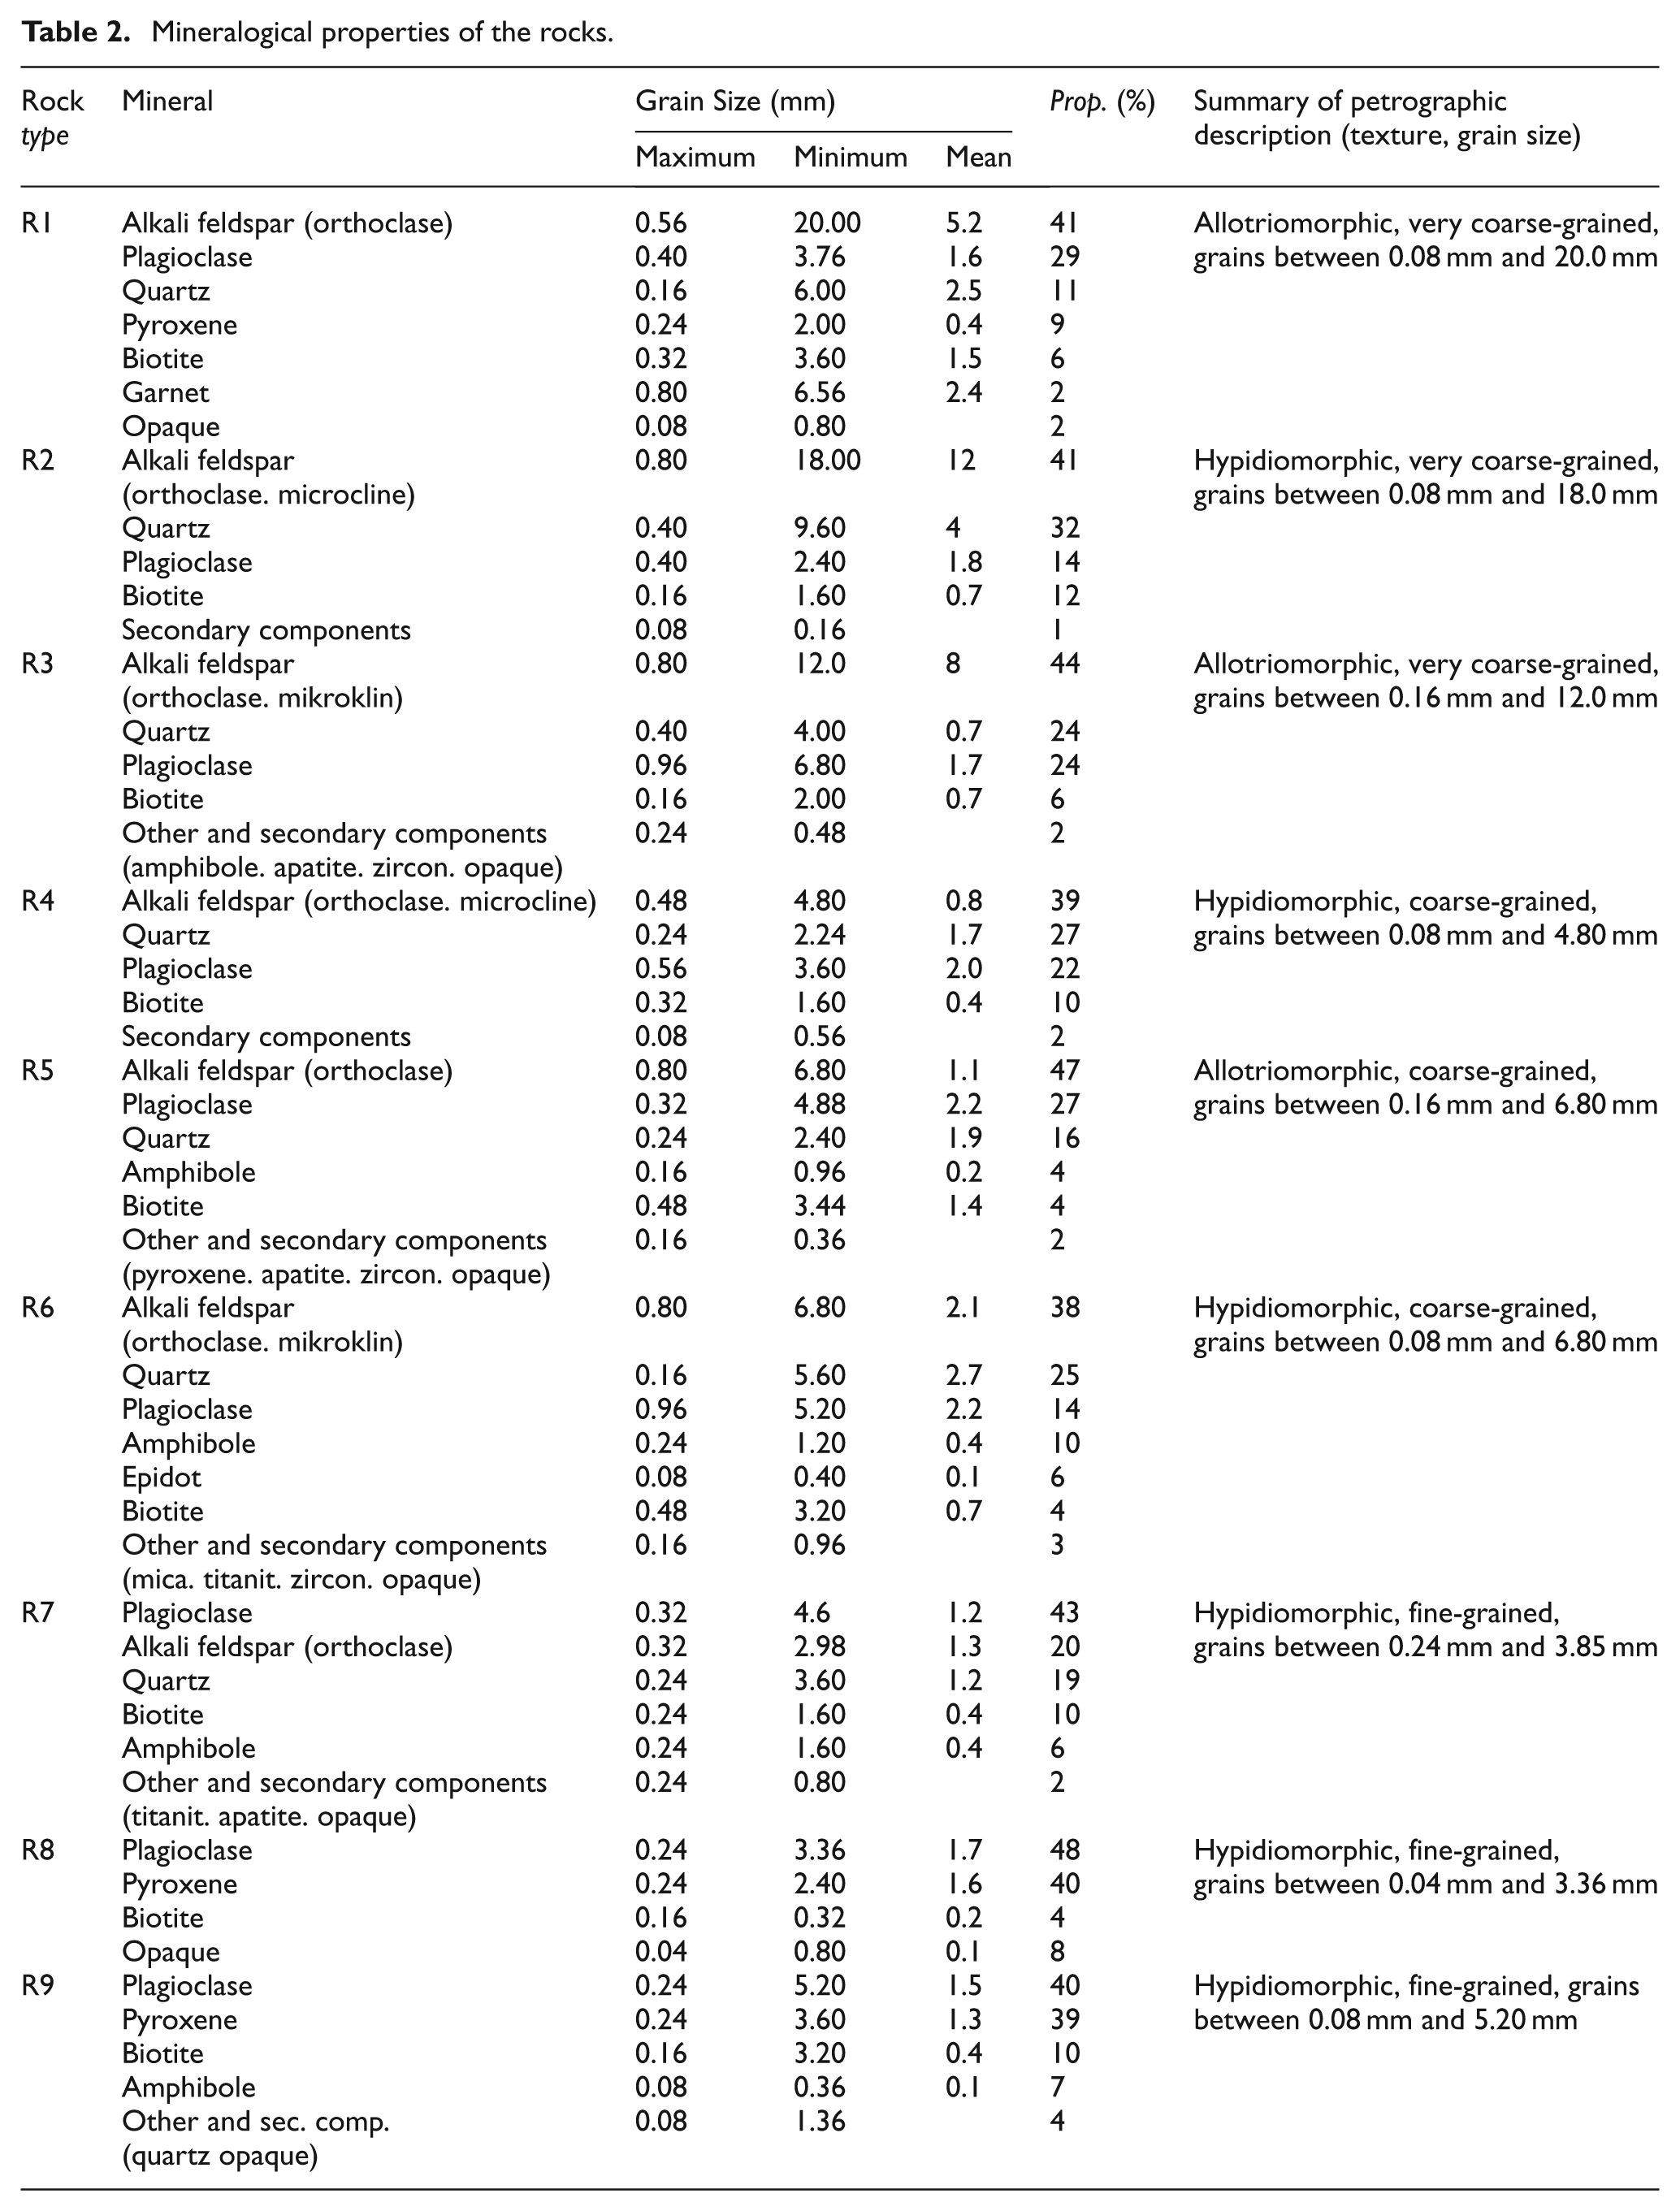
Petrographic studies conducted in the study include the determination of composition and grain size of the minerals. For this purpose, thin sections for each rock were prepared and examined under the polarizing microscope. Polished hand specimens were also examined for the grain size characterization for the coarse-grained rock samples. Petrographic descriptions, mineralogical compositions and grain size ranges of the studied rocks are given in Table 2. As can be followed from the table, quartz, K-feldspar, plagioclase and biotite were the main rock-forming minerals in all samples, varying in their percentage contents (see Figure 2).
Mineralogical properties of the rocks.
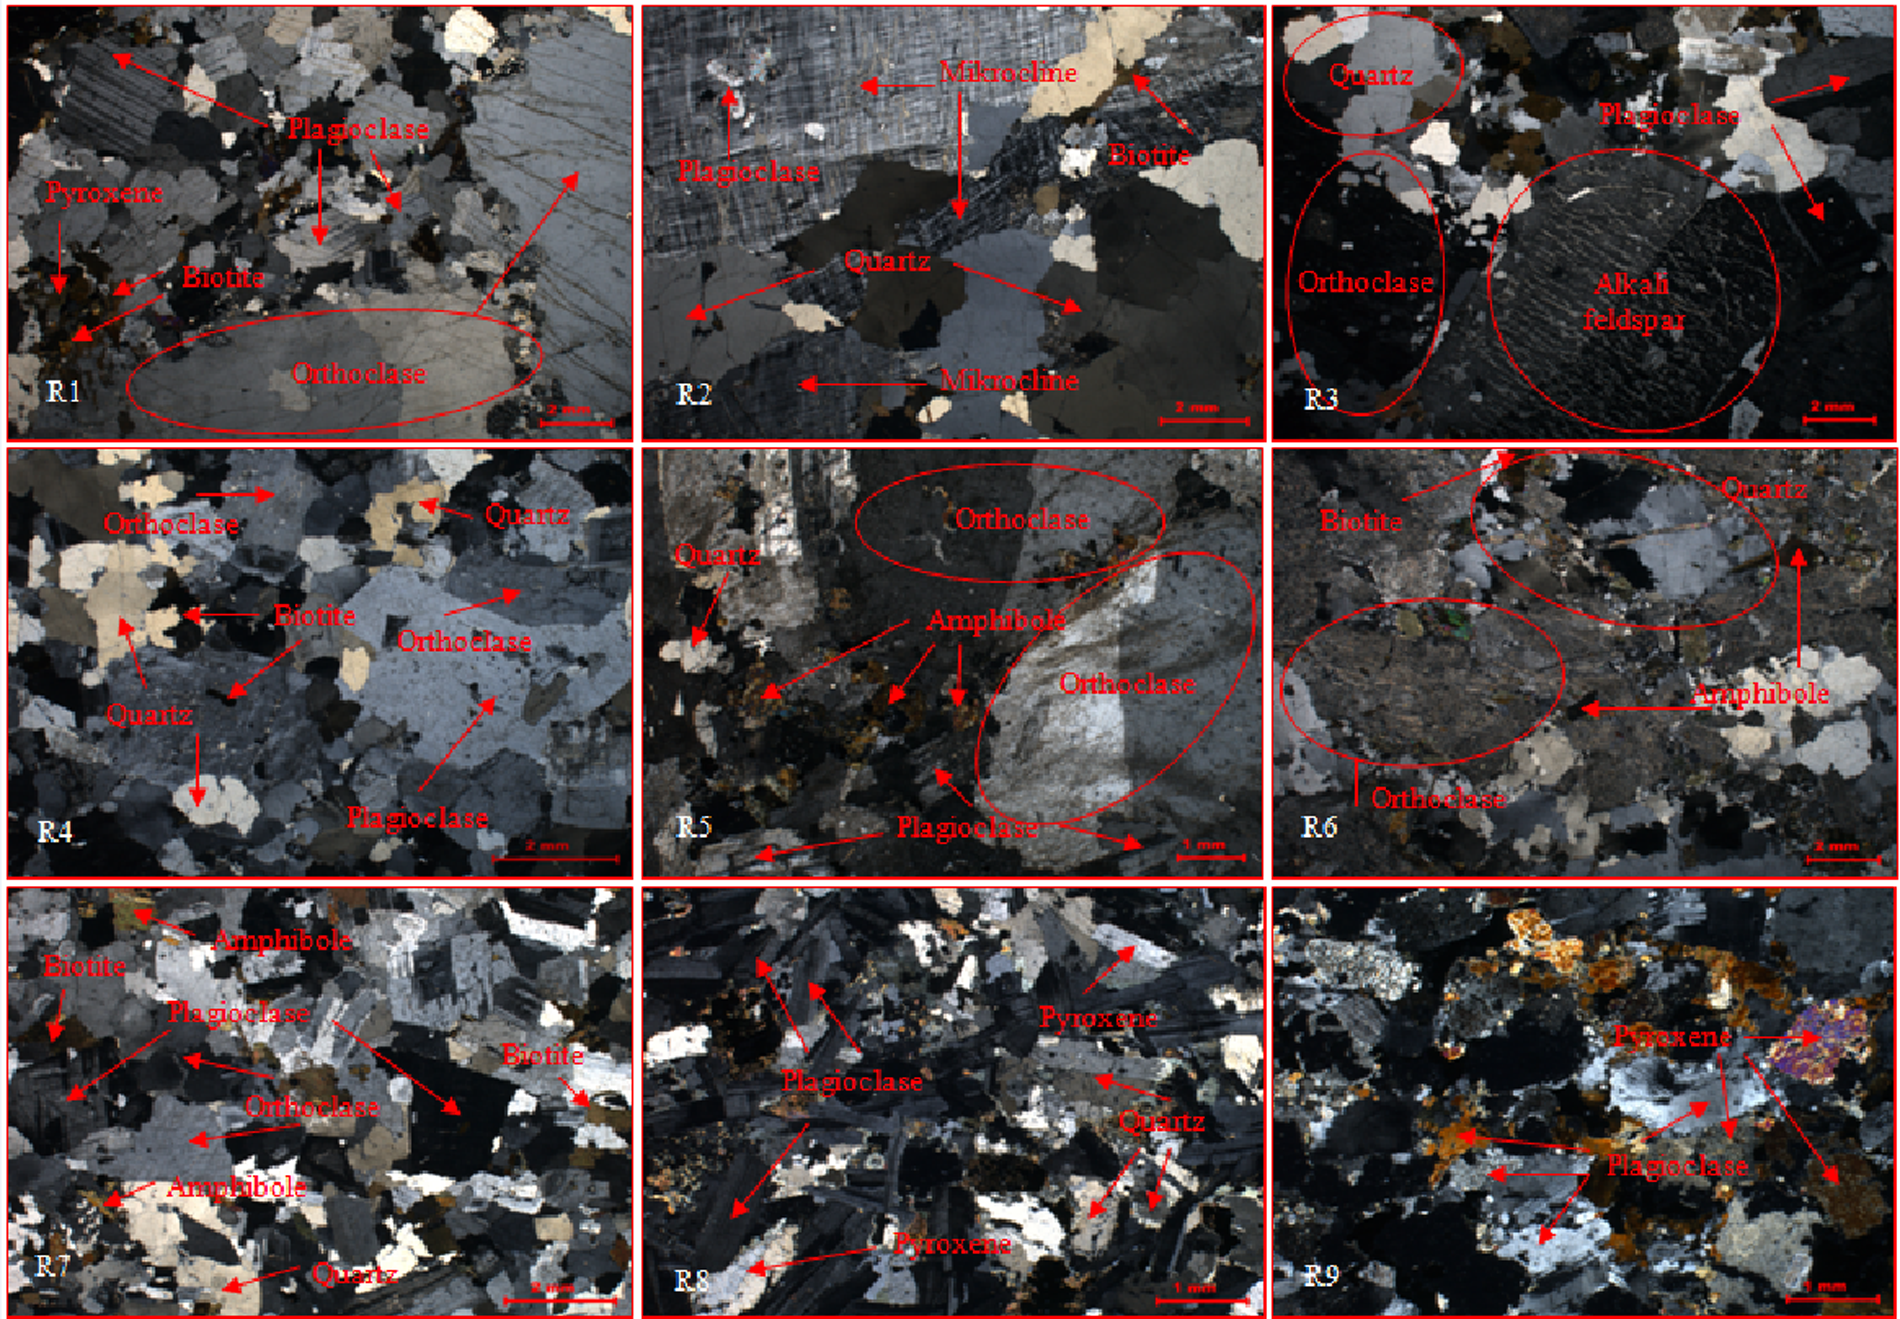
Photomicrographs of the rocks tested.
Experimental procedure
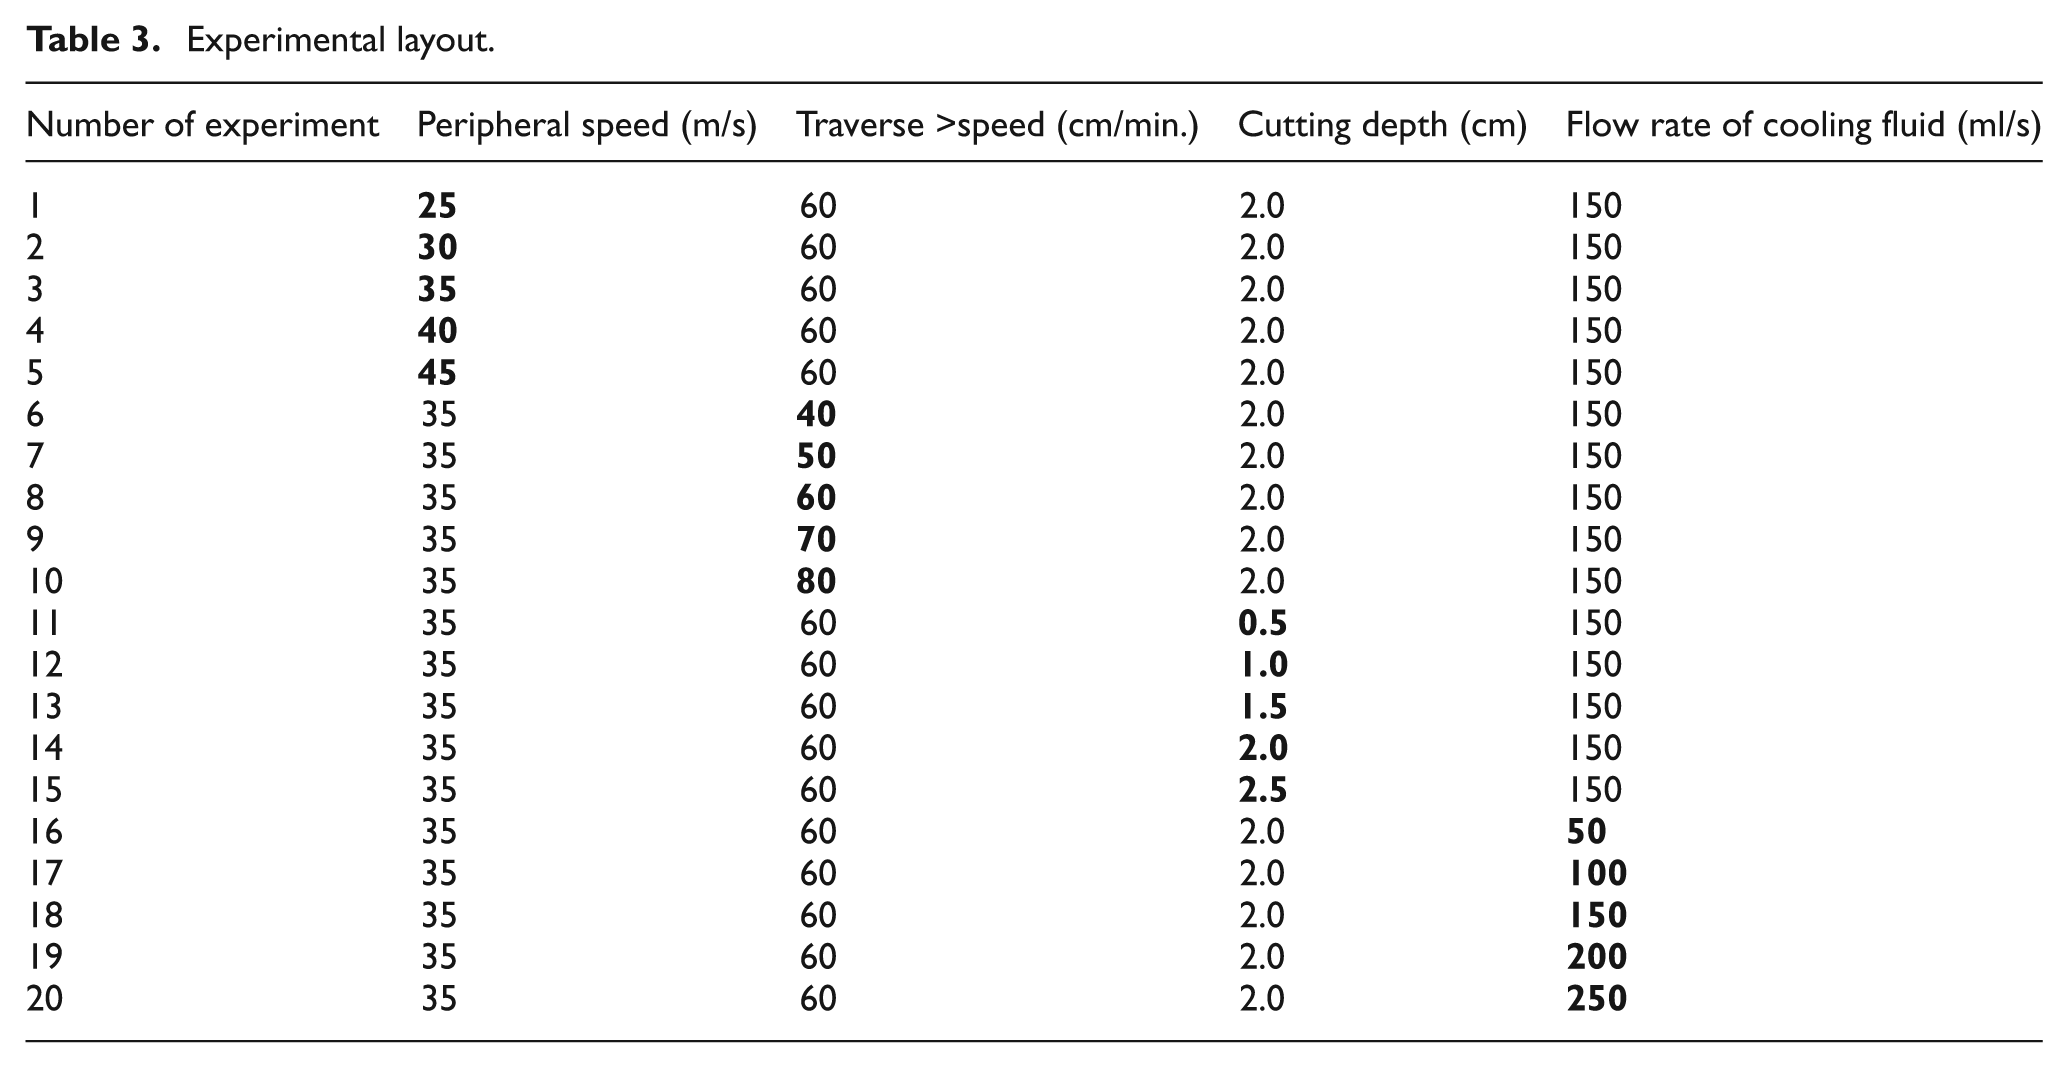
In order to determine the levels of the operating variables for the study, preliminary cutting tests were conducted by considering instructions of diamond disc manufacturers and related studies. Consequently, valid for the type of tested granites, the following operating variables were varied at the following levels: peripheral speed: 20/25/30/35/40 m/s; traverse speed: 40/50/60/70/80 cm/min; cutting depth: 0.5/1.0/1.5/2.0/2.5 cm; and flowrate of cooling fluid: 50/100/150/200/250 ml/s. The experimental layout is presented in Table 3. Each experiment was repeated five times to increase the accuracy of the results obtained. Additionally, the diamond sawblade was dressed by cutting a siliceous sedimentary tuff block before the cutting tests. The cutting experiments were then conducted in the down-cutting mode. The horizontal (Fh) and vertical (Fv) force components acting on the diamond sawblade were measured using load cells. The tangential (Ft) and normal (Fn) force were derived from the equations (1) –(11) considering the geometrical relations presented in Figure 3
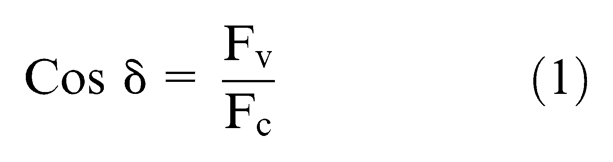
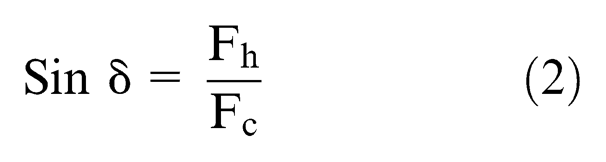
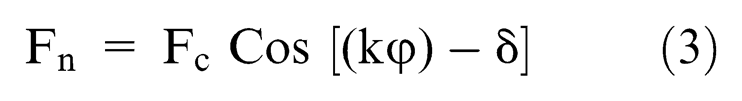
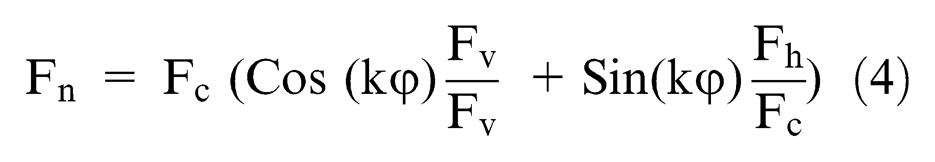
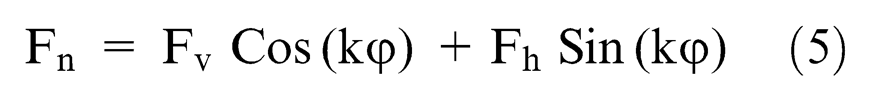
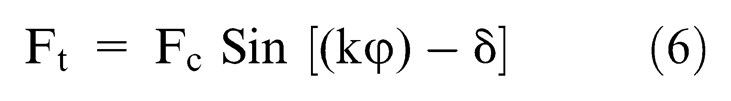
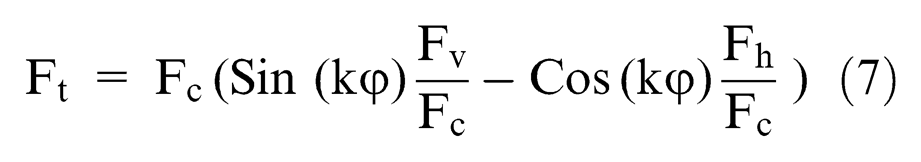
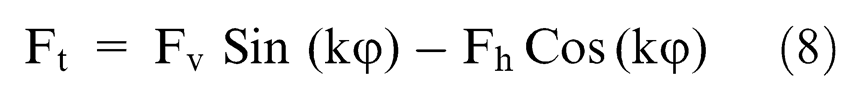
where Fh is the horizontal force (N), Fv the vertical force (N), Fz the axial force (N), Fn the normal force (N), Ft the tangential force (N), Fc the resultant cutting force (N), Ds the disc diameter (mm), d the cutting depth (mm), Vc the workpiece traverse speed (m/s), Vp the peripheral speed (m/s), φ the total included angle of the contact zone (degrees) and kφ is the angle showing the location of the resultant force (degrees). The total included angle of the contact zone (φ) and the angle (kφ) indicating the location of the resultant force can be calculated by
Experimental layout.
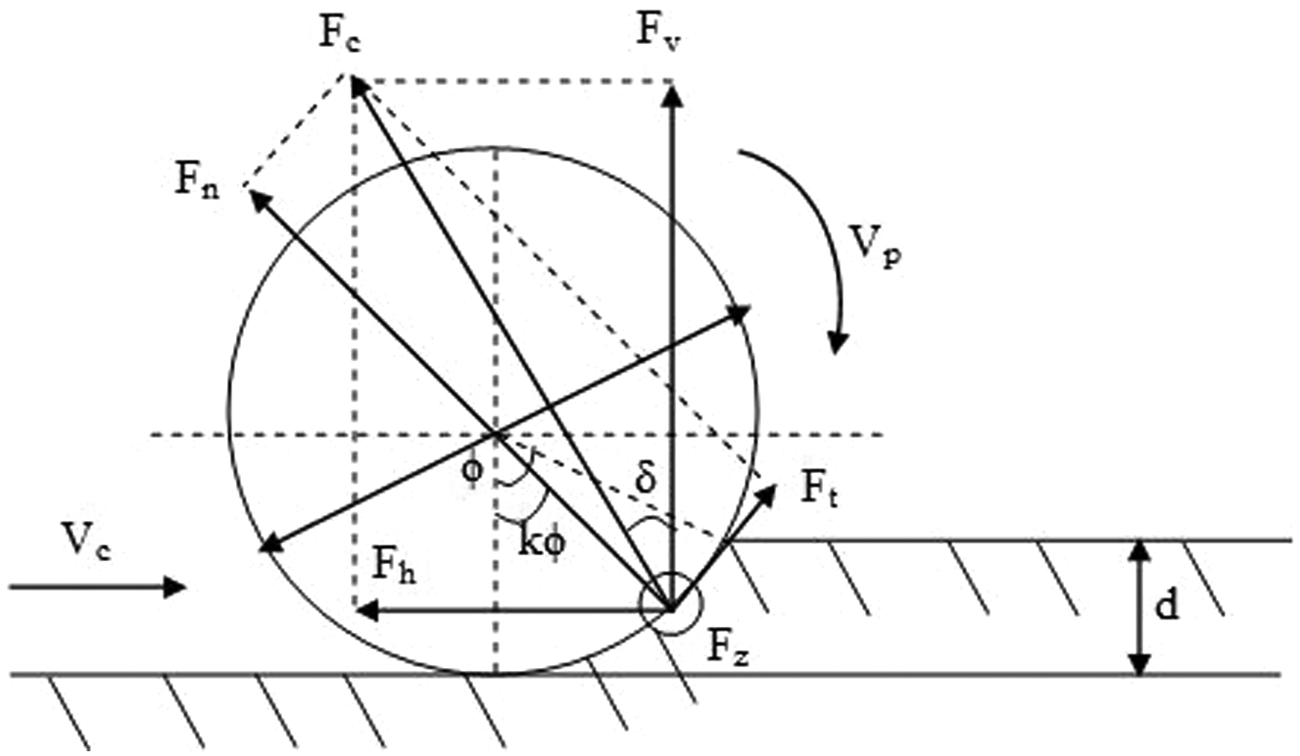
The kinematics of cutting process for the down-cutting model.
Results and discussion
The effect of the operating variables on the cutting force was first analyzed and then the contribution of each operating variable on the cutting force was investigated. Correlation analysis was performed for the experimental data derived from 19th test in order to determine the most important material properties in terms of cutting force. In other words, a constant specific removal rate of 120 cm2/min was employed throughout the experiments so that all granite types could be easily sawn within the available power limits of the cutting machine. The same cutting rate enabled a direct comparison of results obtained for all the rock samples.
Experimental results are presented in Figure 4 as plots of peripheral speed versus cutting forces (tangential and normal force), workpiece travel speed versus cutting forces, cutting depth cutting forces and flowrate of cooling fluid cutting forces. Moreover, Figure 5 presents the trends in the cutting force derived from tangential and normal forces with respect to operating variables. Additionally, the trends in the cutting force related to a specific removal rate at the constant peripheral speed and flowrate of cooling fluid are also presented in Figure 6. As can be understood from Figure 4, valid for all operating variables, the normal forces are higher than the tangential forces. On the other hand; the higher cutting forces are obtained for R2, R4 and R6, while the lowers are obtained for the R8 and R9.

Relation between operating variables and tangential and normal force.
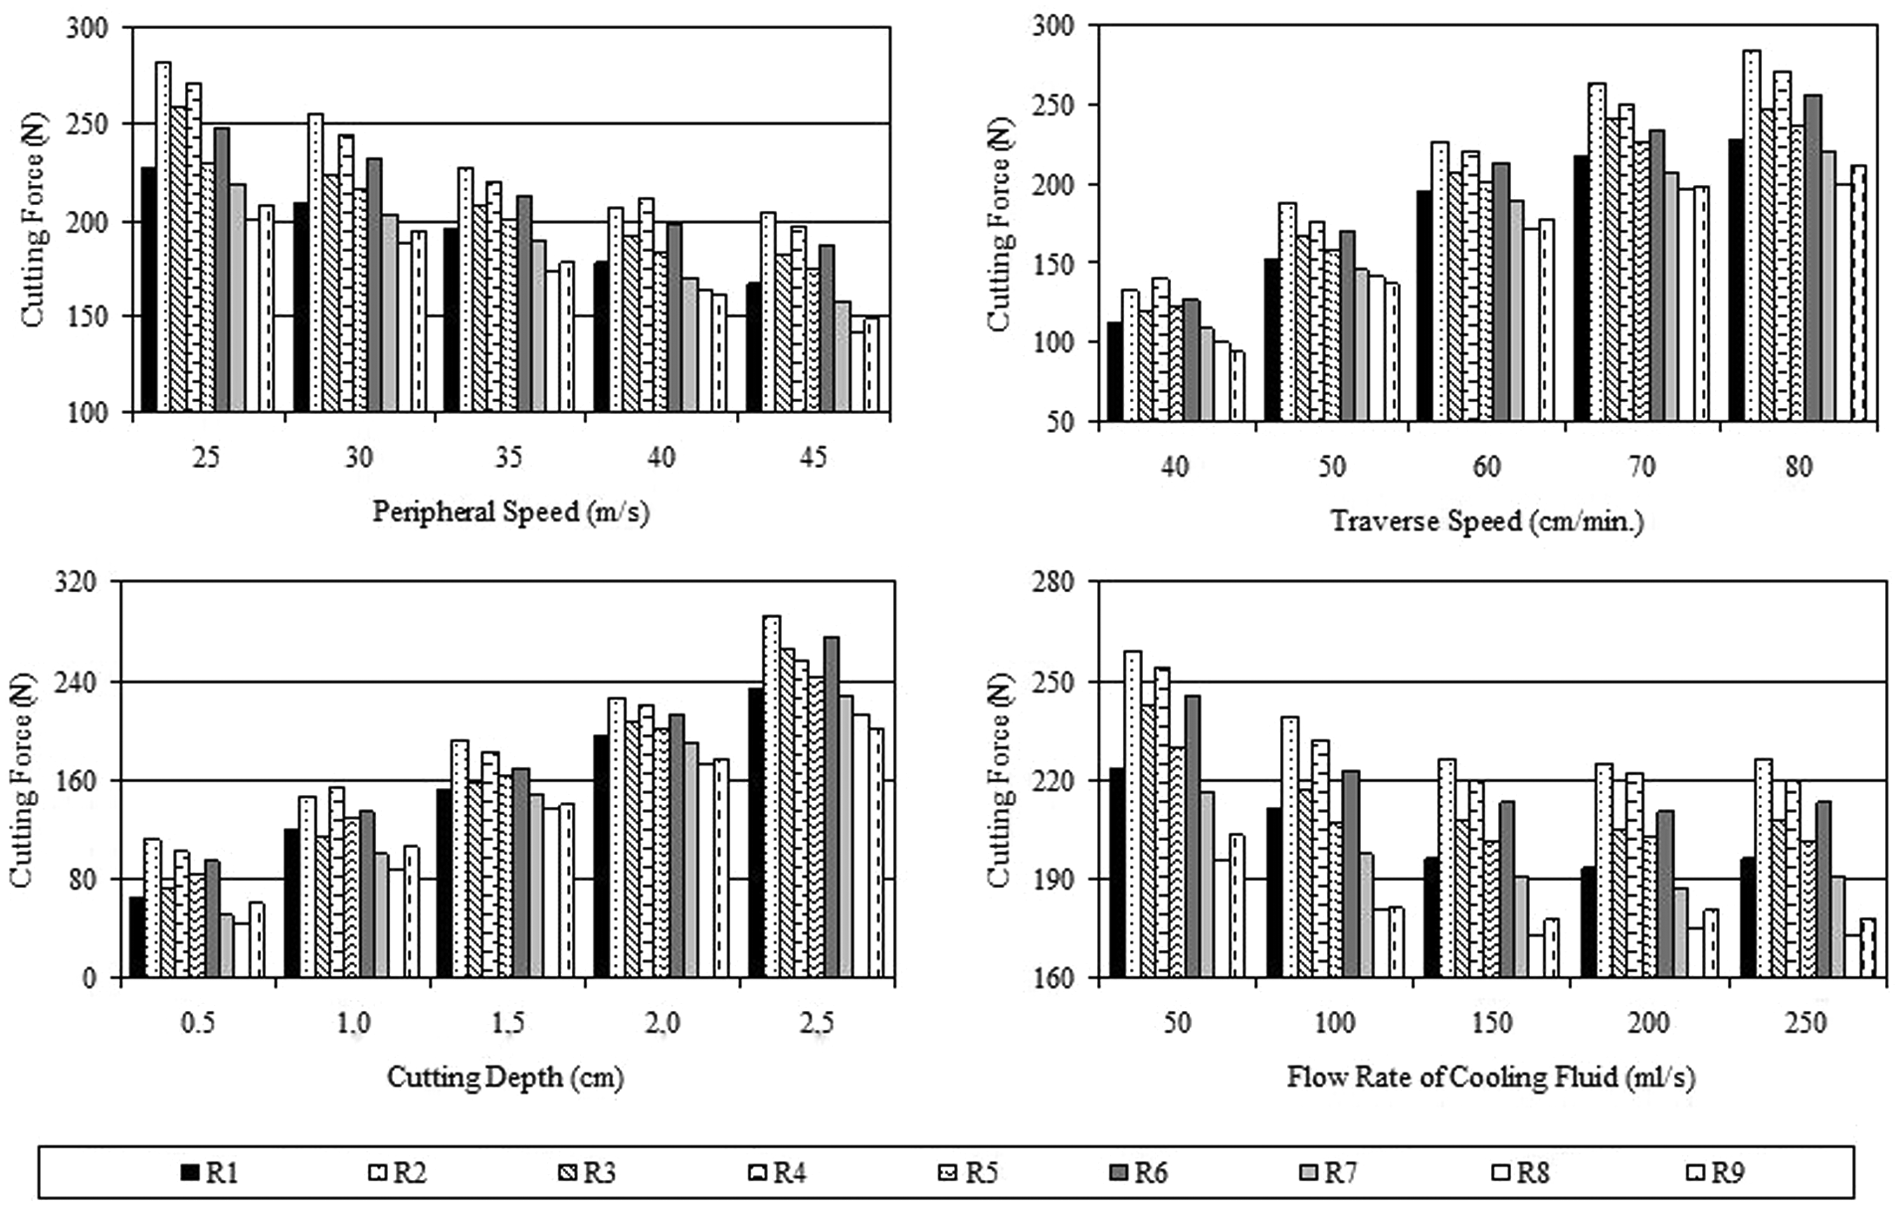
Relation between operating variables and cutting force.
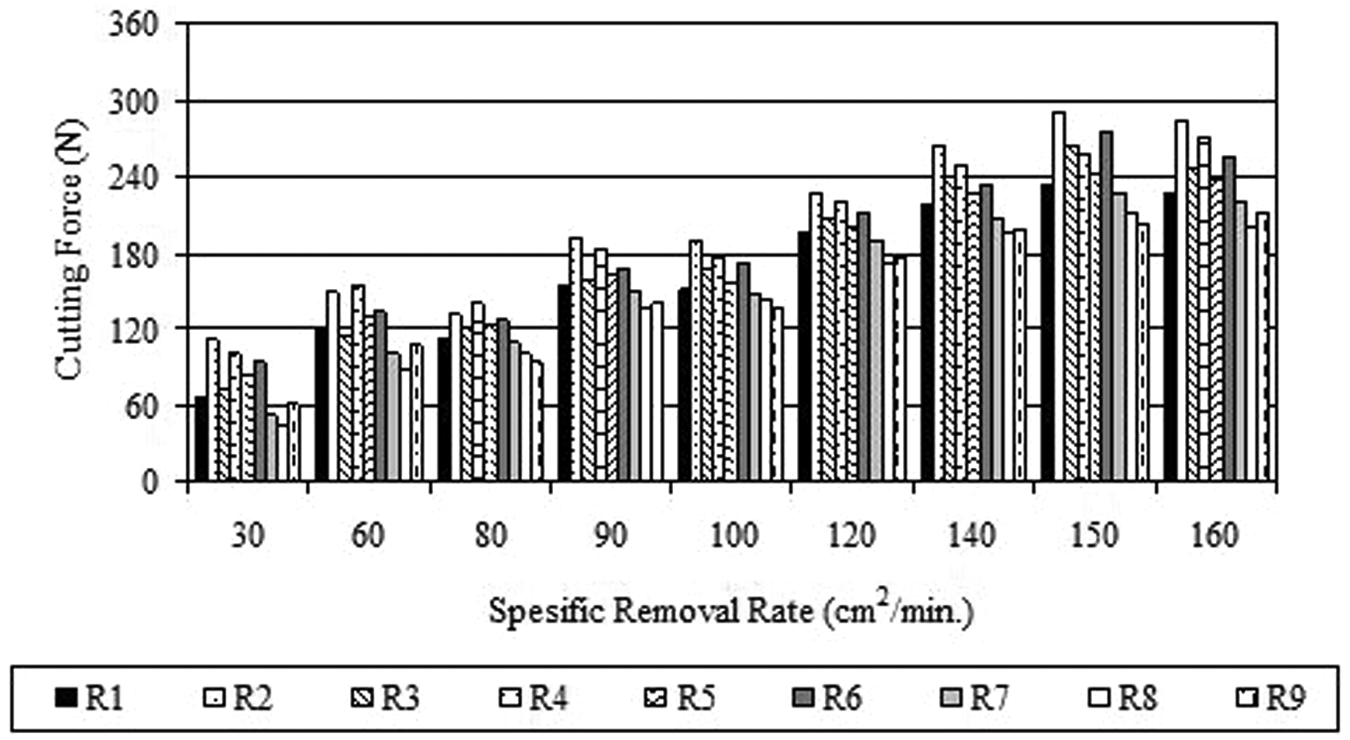
Relation between spesific removal rate and cutting force.
Effect of the operating variables
Depending on the increase in peripheral speed and flowrate of cooling fluid (especially for the lower flowrate of cooling fluid), a decrease was observed in the forces (especially normal and tangential). The increase of the peripheral speed results in a decrease in quantity of the rocks sawn by each segment in unit time. However, a further increase (above 40 m/s) in the peripheral speed may also result in a damaged segment, such as polished and pull out (see Figure 7). As a result of this phenomenon, lower chances in the cutting forces in response to peripheral speed between 40 m/s and 45 m/s were observed. The critical levels of the flowrate of cooling fluid in terms of the cutting force were determined as 100 ml/s for the R5 and the R9 and 150 ml/s for the other rocks tested. In the lower flowrate of cooling fluid, the chips produced may not be efficiently removed from the cutting area and this may lead to get higher cutting force. Therefore, it is recommended that the flowrate of cooling fluid must be above the critical values for achieving the effective cutting.
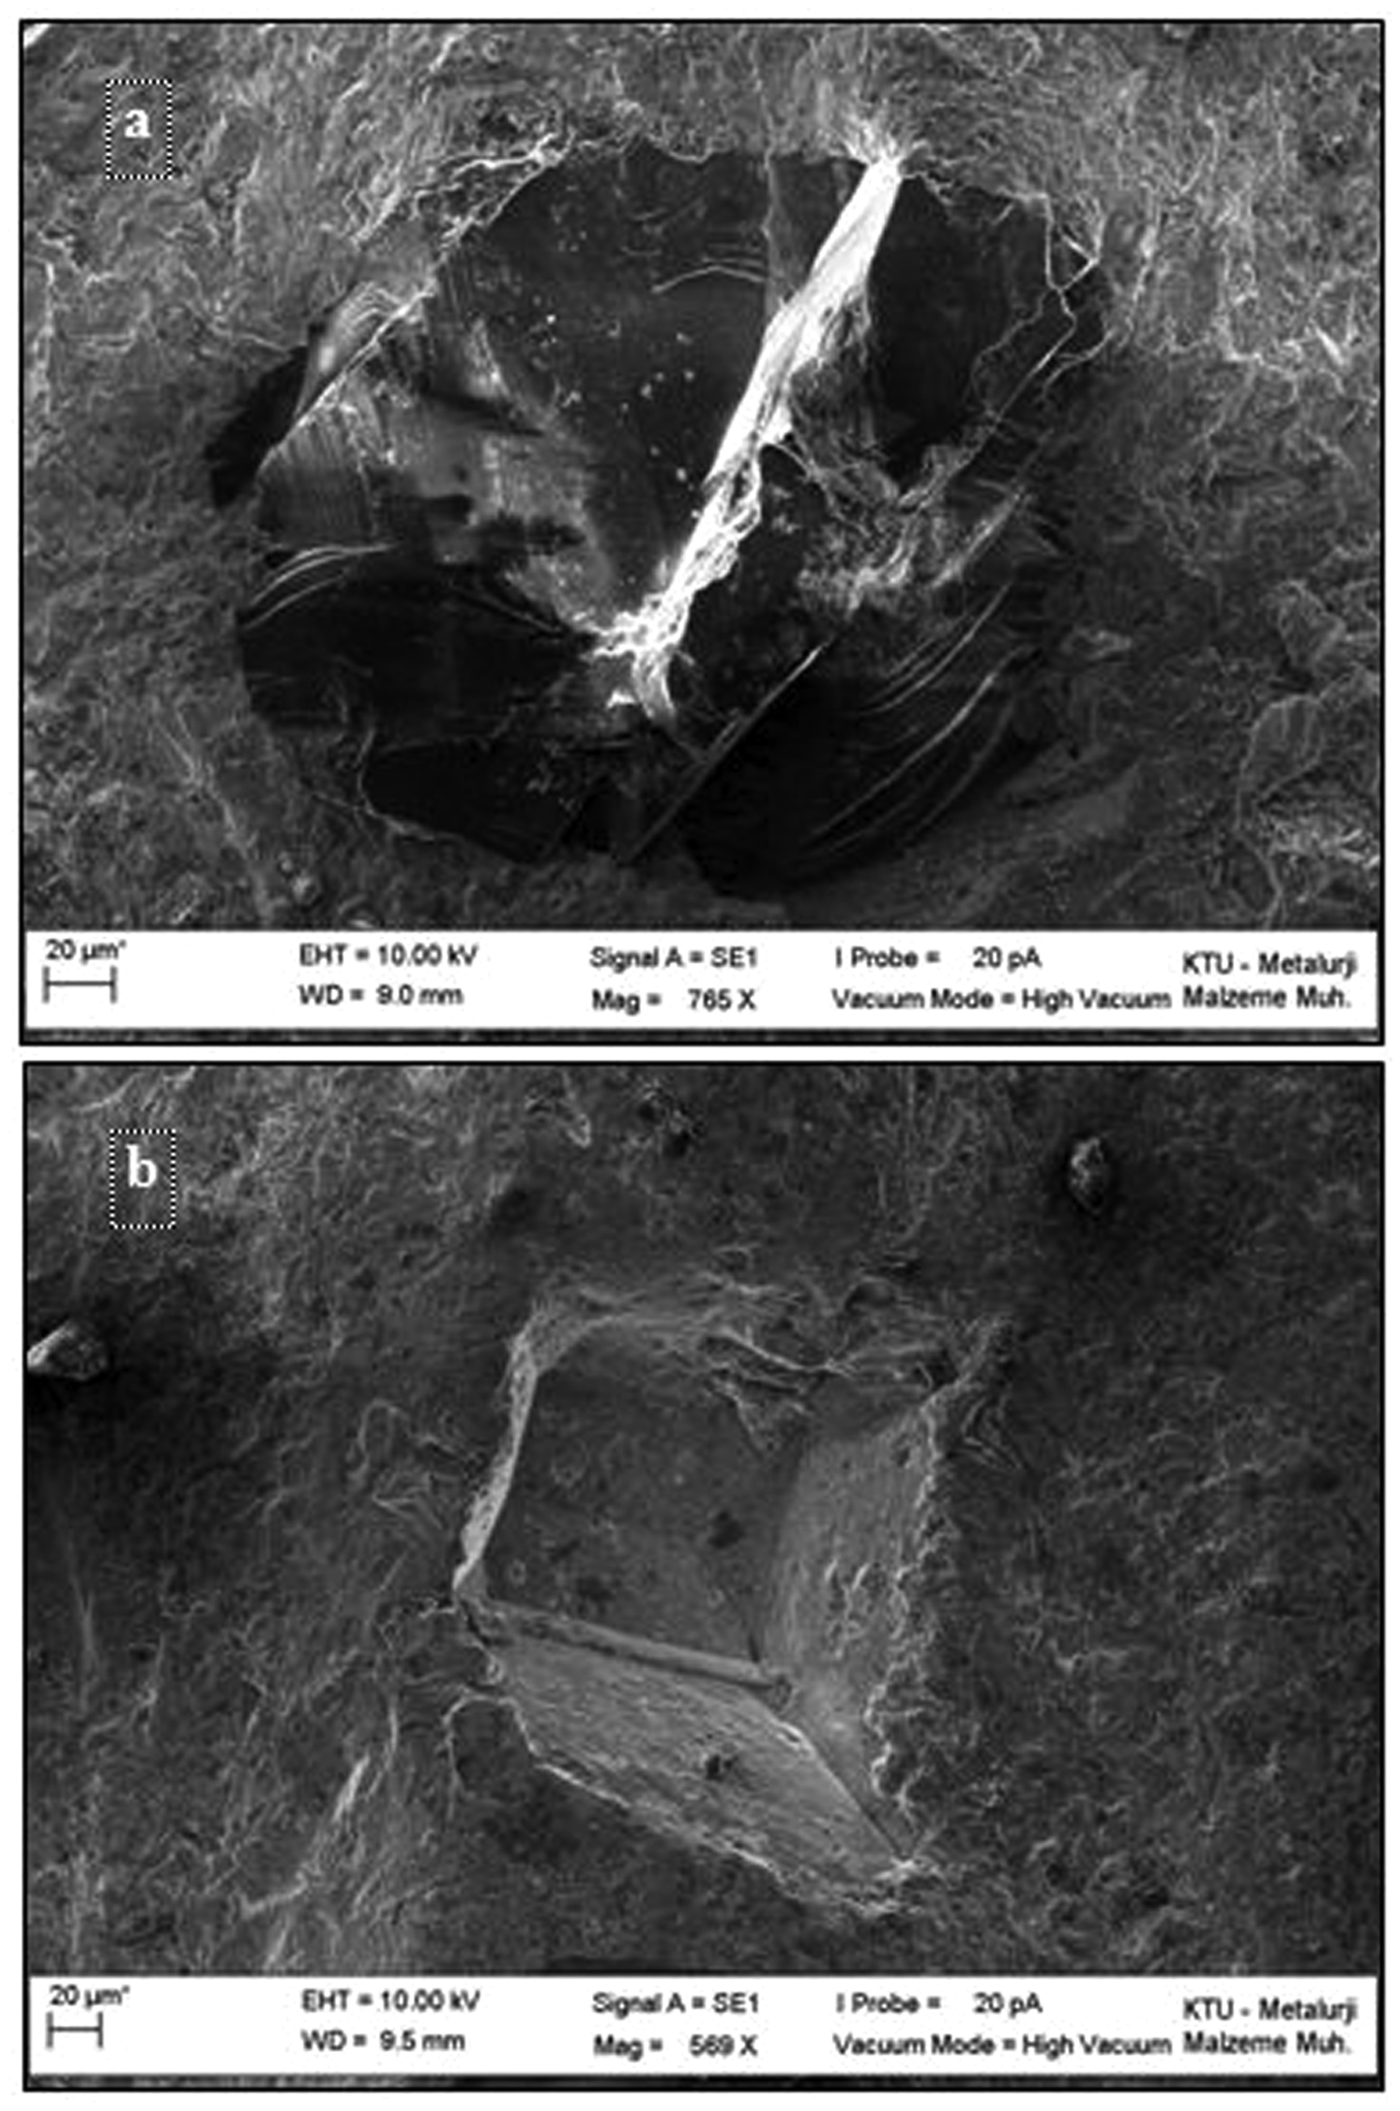
(a) Scanning electron microscope (SEM) micrographs of the diamonds polished, (b) pull out diamonds.
The cutting force increased with respect to the increase in both traverse speed and cutting depth. It is clear that the cutting force initially increased, and with further increase of the traverse speed, it did not show any significant changes. As can be also seen from Figure 6, the cutting force generally increased as a result of the increase in specific removal rate that is the quantity of material sawn in unit time or the area cut per unit time.
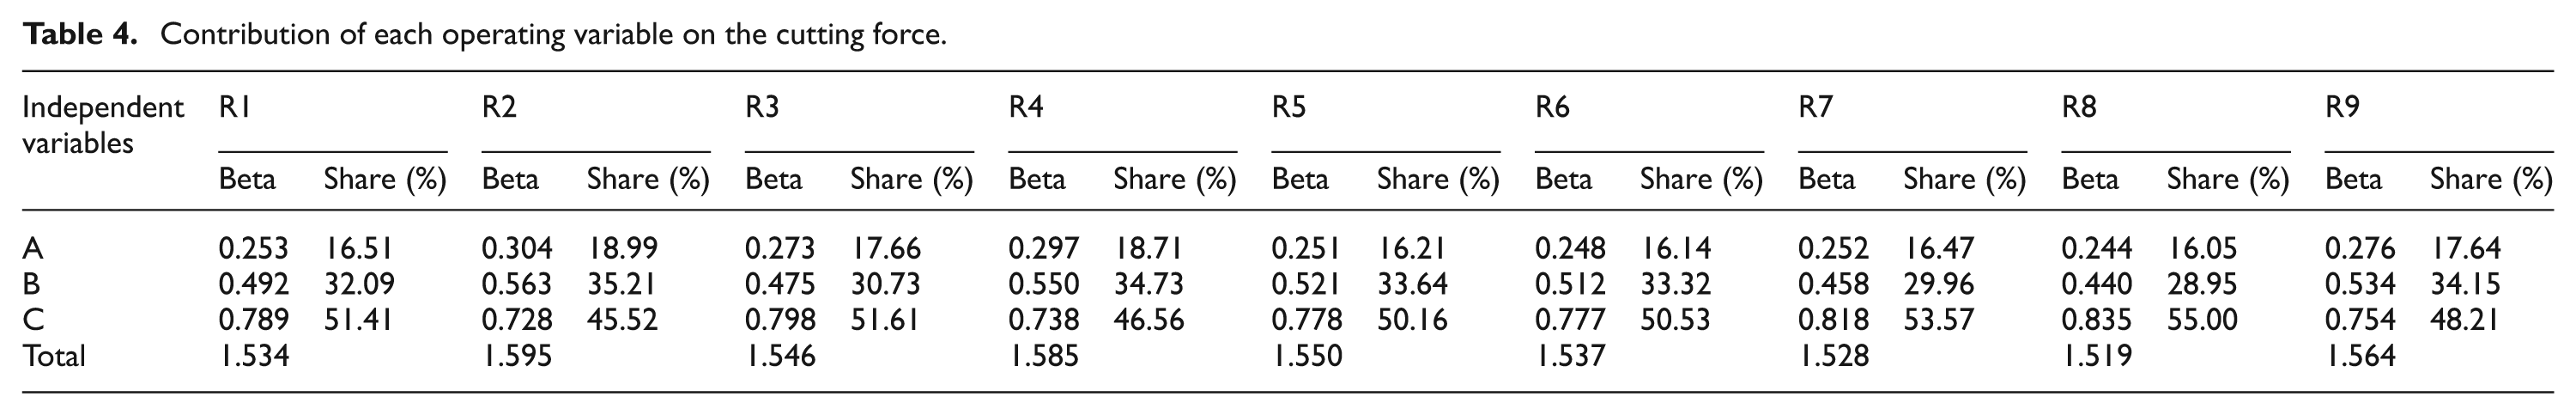
Contribution rates (CRs) were used to determine significant process factors. It is a tool to see which process factor has a significant effect on the process. Higher CRs indicates that there is a considerable change on the performance characteristic owing to the variation of the related operating variables. The most significant operating variable affecting the cutting force was determined as the cutting depth (see Table 4). It was followed by the traverse speed and peripheral speed. The flowrate of the cooling fluid was not determined as an important operating variable. This may be associated with the stable trends in the cutting force for the flowrates above 100 ml/s.
Contribution of each operating variable on the cutting force.
The necessity for the determination of the cutting force ratio (Ft/Fn) according to the specific removal rate was emphasized by some researchers.7,17,24 As can be obtained from the related figures, the cutting force ratio generally decreased depending on increasing of specific removal rates.
Effect of the material properties
The relationships between material properties and cutting force were investigated on the basis of the statistical approaches and the best relations established were depicted in Figure 8. Generally, there are moderate correlations between the cutting force and some physico-mechanical properties, such as density, ultrasonic velocity and microhardness. It may generally be possible to obtain higher cutting forces when cutting hard rocks having a higher density and ultrasonic velocity. However, unlike the expectations, lower cutting forces were observed for these kinds of rocks in the current study. This phenomenon may be attributed to different mineralogical properties. Reliable correlations were found between the cutting force and some mineralogical properties such as quartz, plagioclase and feldspar contents. Generally, the higher cutting forces were obtained for the rocks including a high percentage of quartz and alkali feldspar owing to their high resistance to the wearing. Therefore, it may be important to note that, rather than the mechanical properties of the rock, mineralogical properties could primarily be responsible for the cutting force. Additionally, it can be stated that some moderate correlations were found between the cutting force and mean and maximum grain size of quartz.

Relations between rock properties and the cutting force.
Prediction of the cutting force
A computing package program (SPSS 11.5) was used for the statistical analysis. Multi-variable linear regression analysis was employed to predict the cutting force. A number of statistical parameters or terms are associated with the multi-variable linear regression analysis. Some of the most important include the coefficient of multiple determination, the coefficient of correlation, the confidence level, standard error, model error, the significance level, the t-distribution, the F-distribution and the residual. Detailed explanation of these parameters or terms can be found from the related sources.25,26
In order to facilitate the analysis and interrelation of the results, the dependent and independent variables are denoted by Fc (cutting force), A (the peripheral speed), B (the workpiece traverse speed), C (the cutting depth), D (flowrate of cooling fluid), X1 (uniaxial strength, MPa), X2 (density, kN/m3), X3 (bending strength, MPa), X4 (water absorption by volume, %), X5 (porosity, %), X6 (Schmidt hammer hardness), X7 (ultrasonic velocity, m/s), X8 (Cerchar abrasion index), X9 (microhardness, HV), X10 (Shore hardness), X11 (Mohs hardness), X12 (plagioclase content, %), X13 (alkali feldspar content, %), X14 (quartz content, %), X15 (biotite content, %), X16 (maximum grain size of plagioclase, mm), X17 (maximum grain size of alkali feldspar, mm), X18 (maximum grain size of quartz, mm), X19 (maximum grain size of biotite, mm), X20 (mean grain size of rock, mm), X21 (mean grain size of plagioclase, mm), X22 (mean grain size of alkali feldspar, mm), X23 (mean grain size of quartz, mm) and X24 (mean grain size of biotite, mm).
The best models (12)–(20) developed from the operating variables for the estimation of cutting force for each rock were given below


Equations for the estimation of the cutting force from the material properties were divided into the groups so that estimations could be made of both physico-mechanical and mineralogical properties. Eight variables were adopted to fit the force model to catch the best regression equations. Fewer than eight variables, any equation whose determination coefficient is one could not be obtained. It was observed that uniaxial compressive strength, microhardness and Mohs hardness were included in the best models developed from physico-mechanical properties. Quartz and biotite contents, maximum grain size of plagioclase, maximum grain size of alkali feldspar, mean grain size of alkali feldspar and mean grain size of biotite were also included in the best models developed from mineralogical properties (see Appendix).
Although equations have the highest possible correlation coefficient, these equations are not useful owing to the complexity and impracticality. Therefore, multiple regression analysis was reapplied to develop simple and practical equations. For practical considerations, the following equation, whose correlation coefficient is 0.97, was selected among all the possible equations. As seen, plagioclase and quartz contents were included in the model

Validation of the models
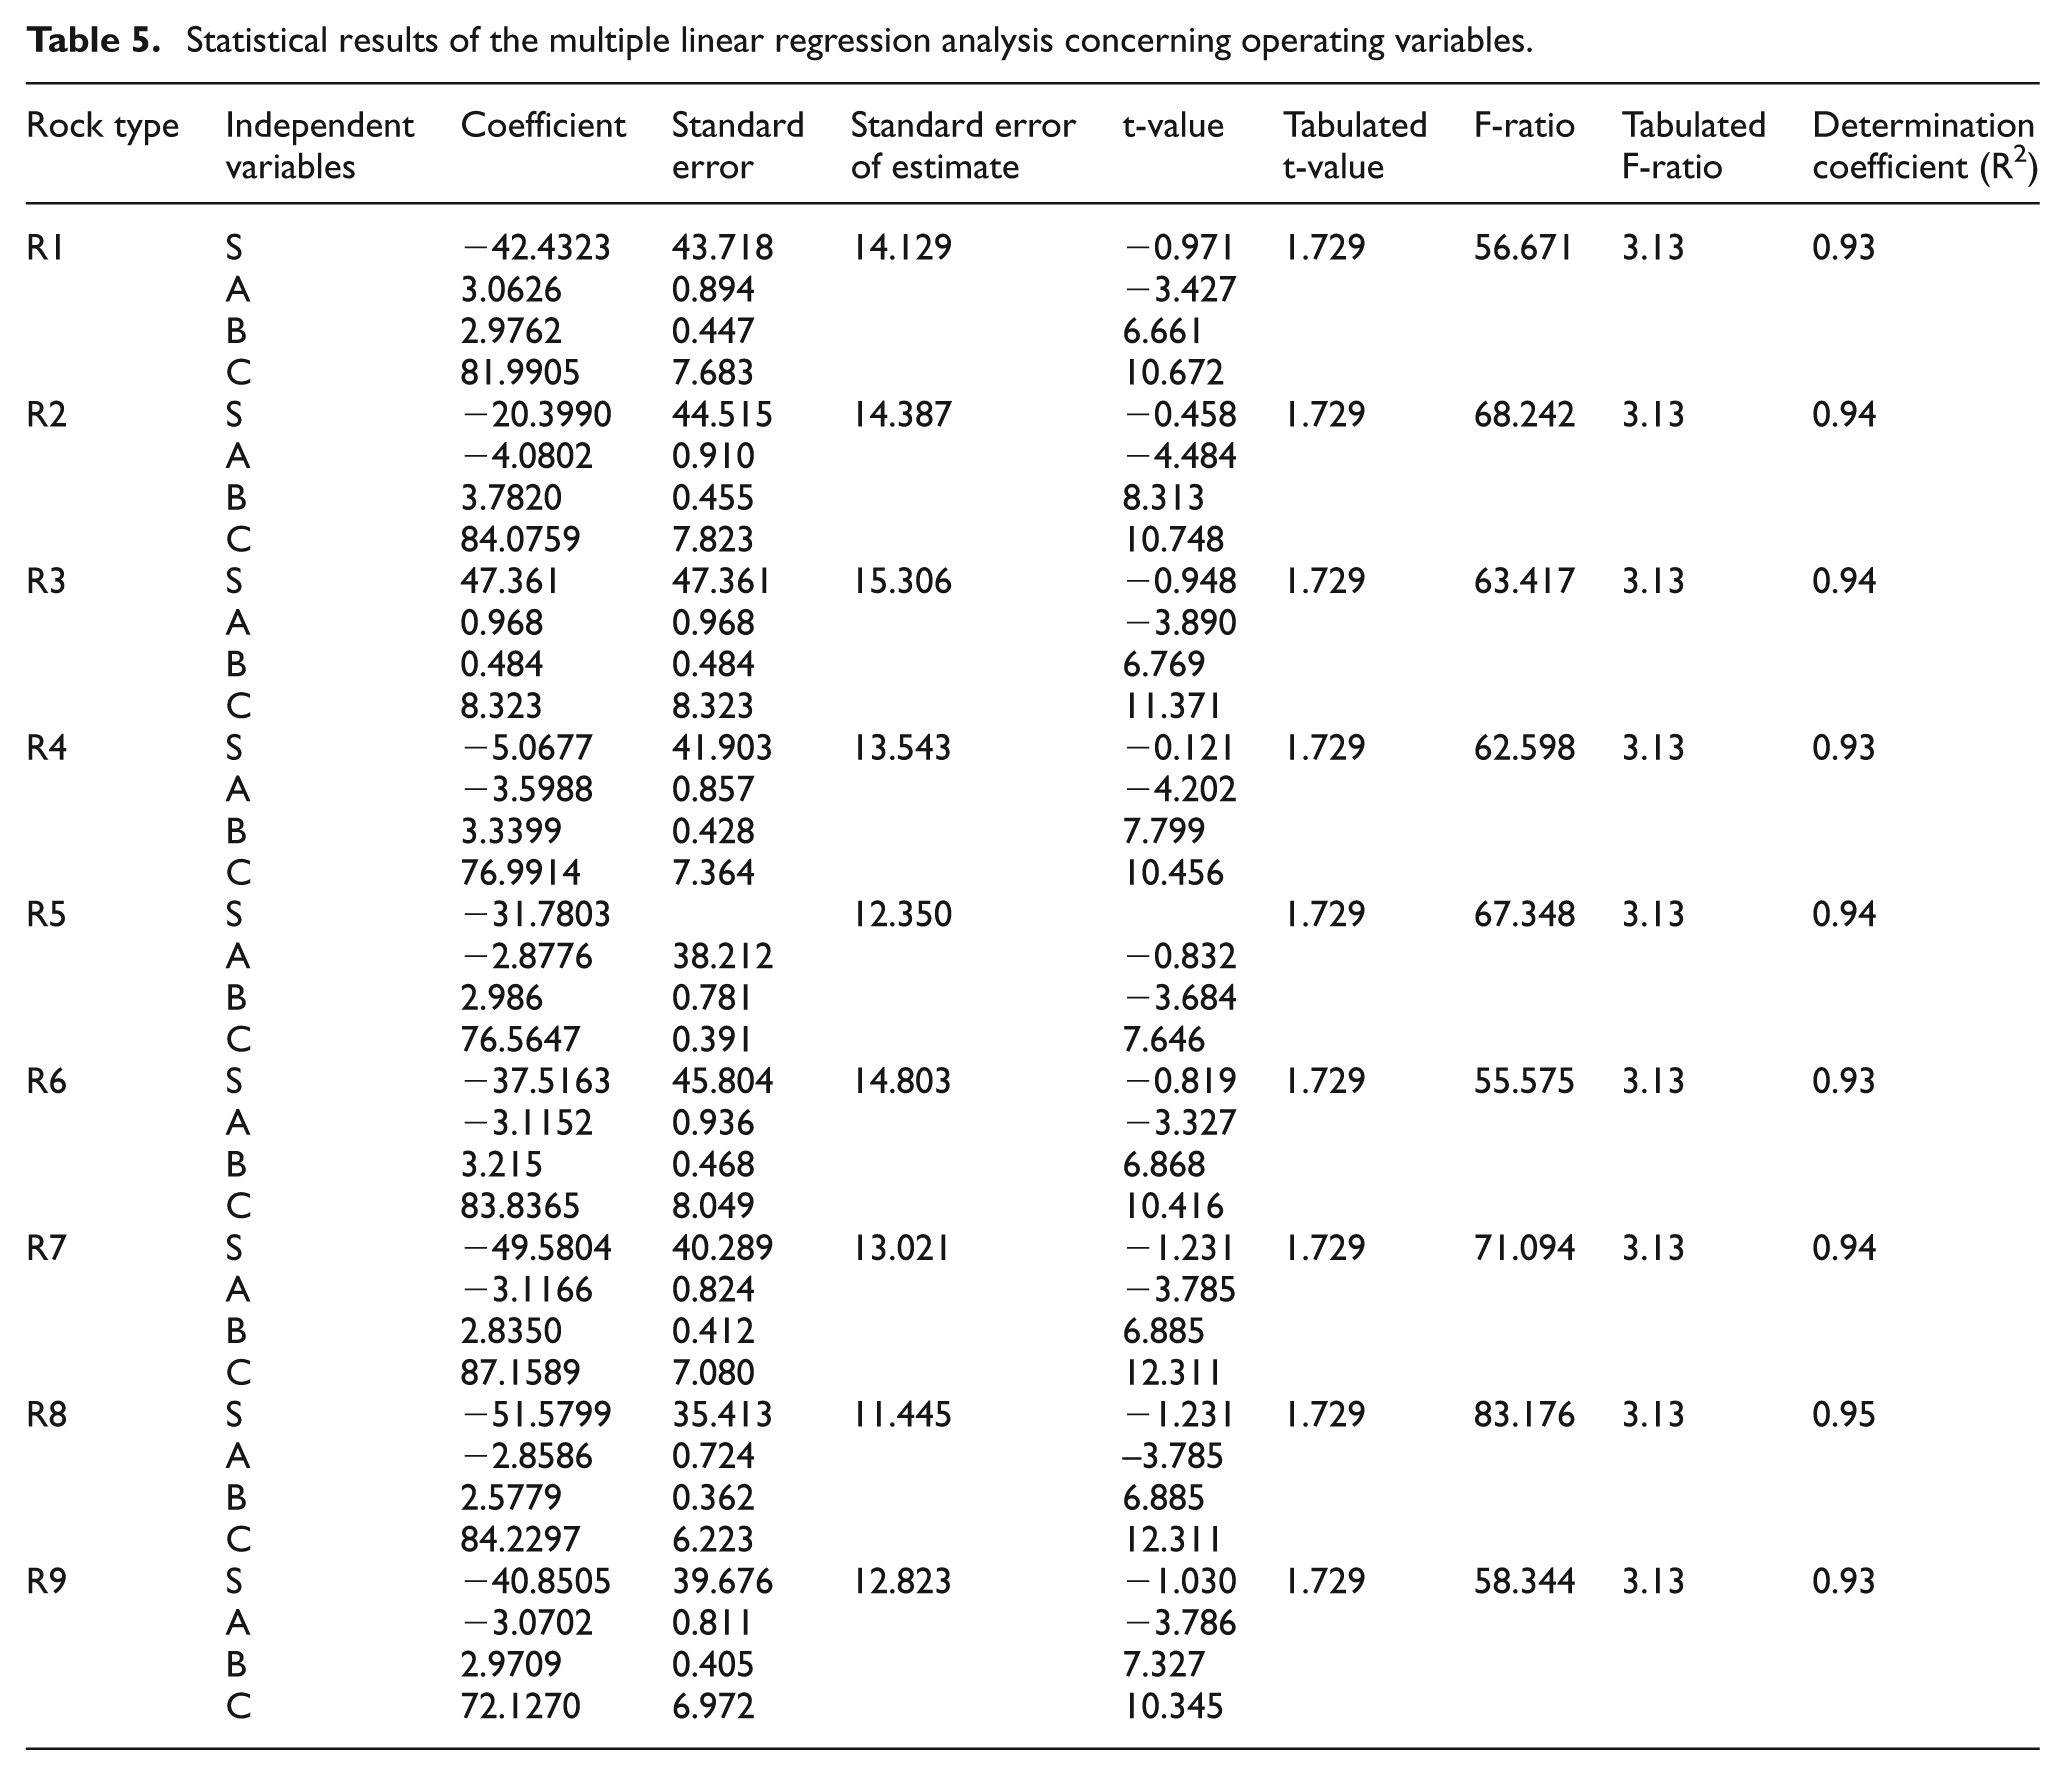
The derived models were verified by considering the following criteria: the behavior of R2, and, the t-test, the F-test and the residual analysis. The predicted cutting force built from operating variables versus cutting force observed is plotted for the rocks tested in Figure 9. The points are distributed fairly uniformly about the diagonal line, suggesting that the models are reasonable. R2 values for all models built are higher than 0.90, indicating a high degree of relationship between the predicted and observed cutting force. As can be seen from Table 5, the computed t-values are greater than the tabulated t-values, suggesting that the models built are statistically valid. An analysis of variance, again at the 95% confidence level, was also applied in order to test the significance of the regressions. Valid for all the models built, the computed F-values are greater than the tabulated F-values, indicating that the models are statistically valid. The plots of the residuals against the predicted cutting force for the model case are shown in Figure 10. The figure indicates that the residuals appear to be randomly scattered about the line, confirming the accuracy of the model.
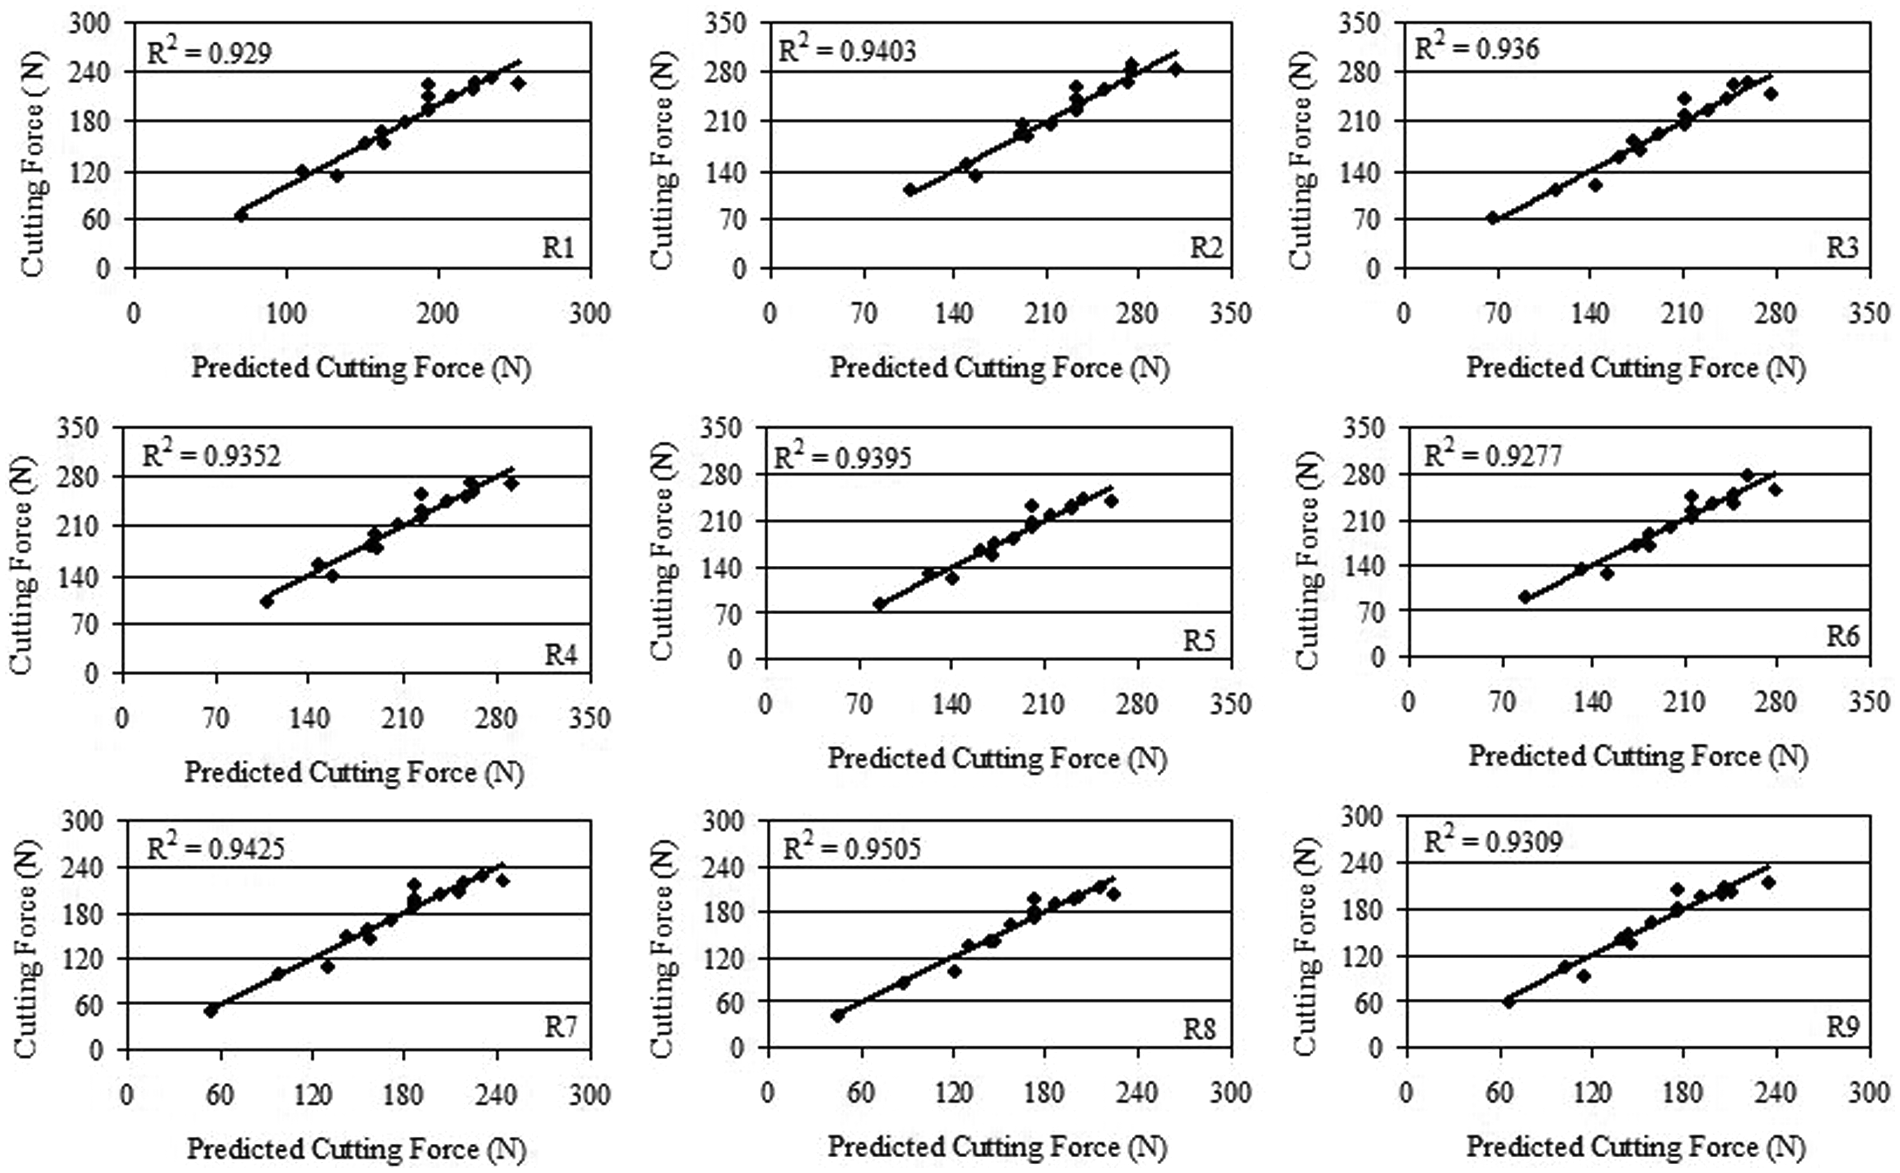
Predicted cutting force from operating variables versus observed cutting force.
Statistical results of the multiple linear regression analysis concerning operating variables.
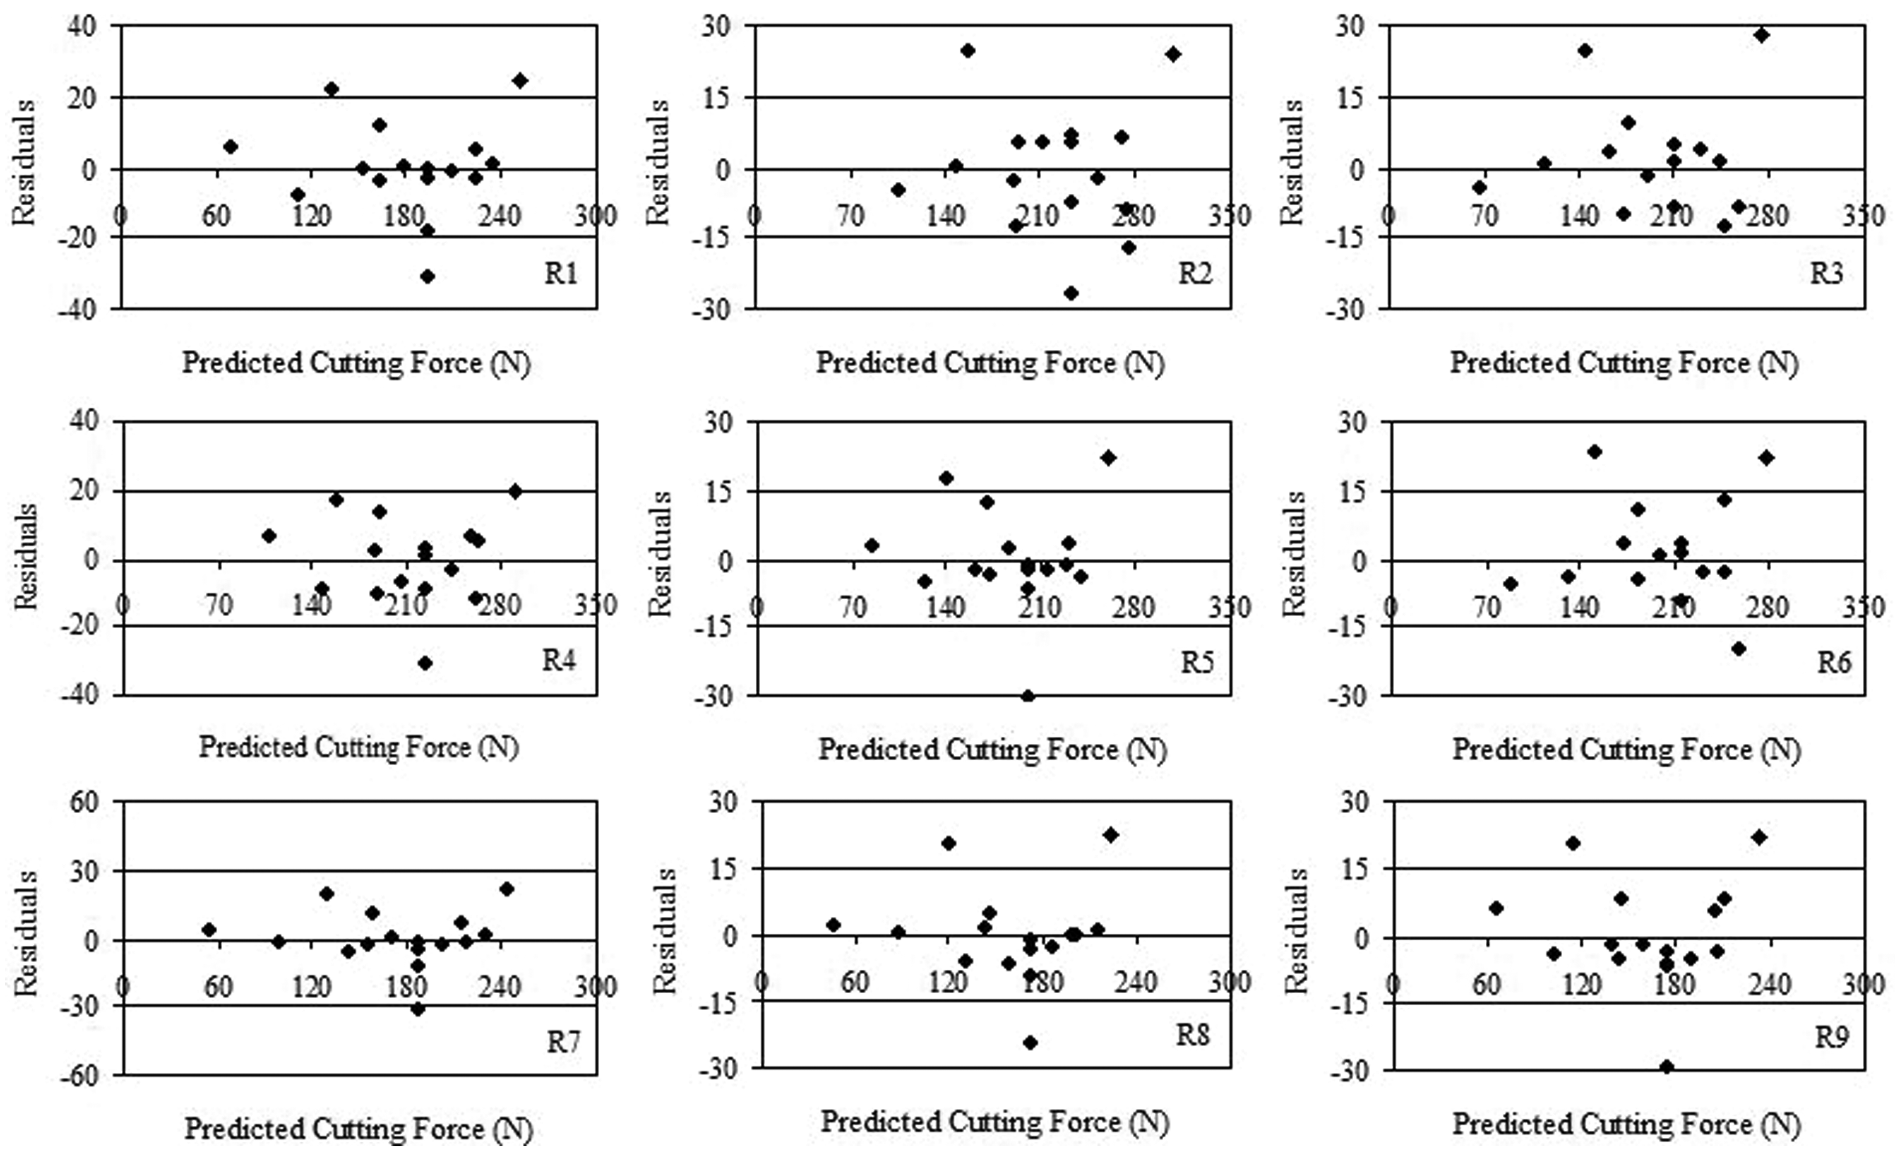
Residuals against the predicted cutting force from operating variables.
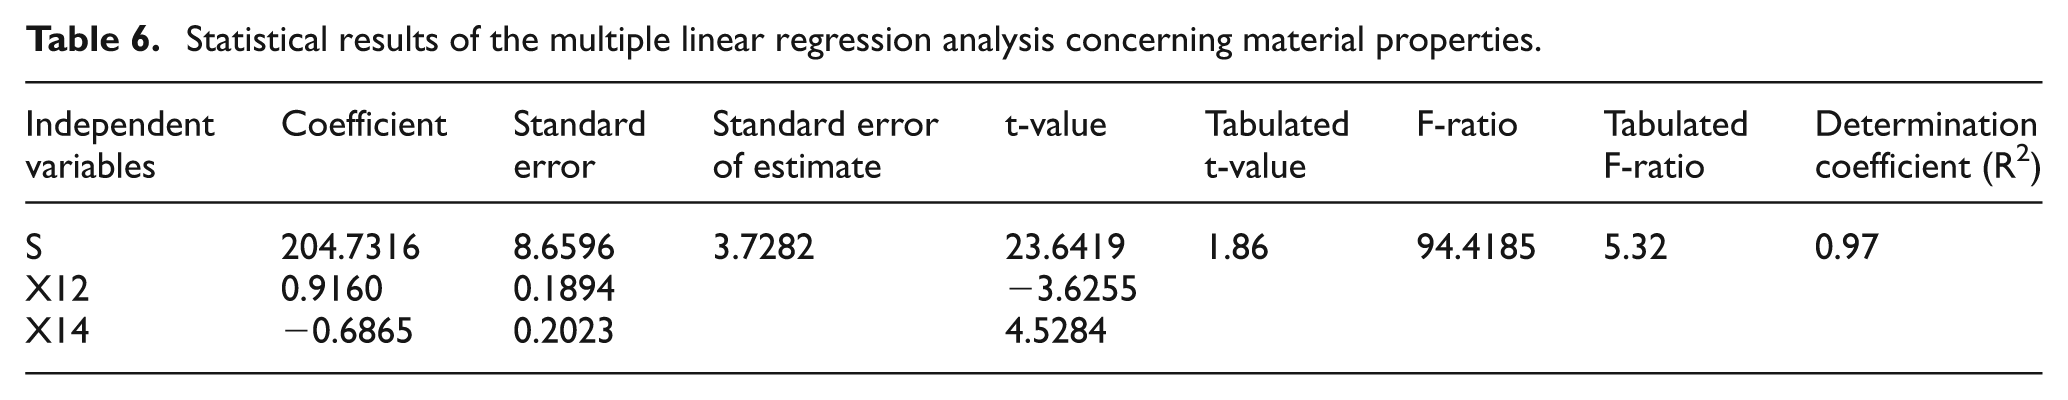
The models (see Appendix) built from material properties were not tested since the coefficients of these models are 1. That means 100% of the variation of the experimental data is explained by the equations. Additionally, the determination coefficient of the simple and practical equation (21) is 0.97, which implies that 97% of the variation in the data is explained by equation (21) (Figure 11). As can be seen from Table 6, the model is statistically valid in terms of t-test and F-test. The plots also confirm the accuracy of the models developed.
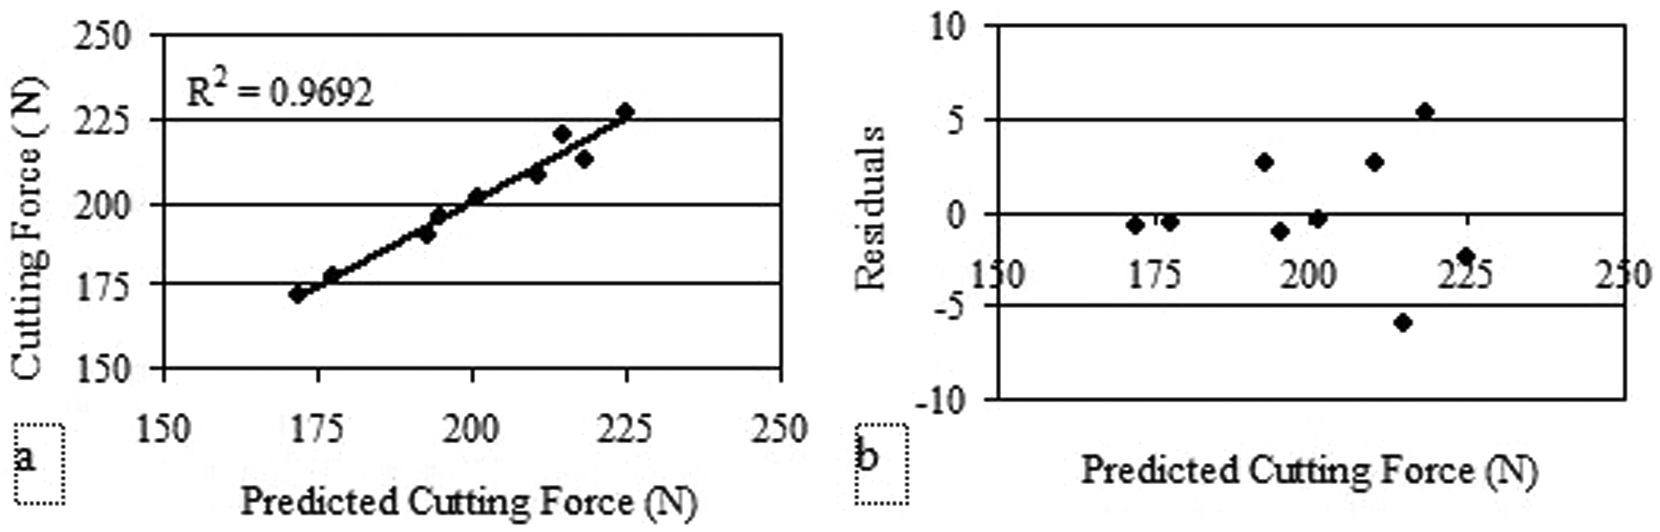
(a) Predicted cutting force from material properties versus observed cutting force; (b) residuals against the predicted cutting force from material properties.
Statistical results of the multiple linear regression analysis concerning material properties.
Conclusions
An experimental study on the cutting force acting on a diamond sawblade during the sawing of granitic rocks has been presented. It was determined that the cutting force increased with increasing cutting depth and traverse speed, while it decreased with increasing peripheral speed and flowrate of cooling fluid (especially for lower flowrates). Results showed that the cutting depth ranked first in governing the cutting force compared with peripheral speed, traverse speed and flowrate of cooling fluid. Moreover, reliable correlations were obtained between the cutting force and some mineralogical properties, such as quartz, plagioclase and feldspar content. This could be evidence that mineralogical properties could primarily be responsible for the cutting force rather than the mechanical properties of the rock. Results also revealed that the models derived from the operating variables and materials properties for estimation of the cutting force have a high potential for practical applications. In order to be able to evaluate the sawability of all rock types without sawing tests involving complicated testing procedure, similar studies are required for other types of the rocks.
Footnotes
Appendix
Acknowledgements
The authors are most grateful to Granitaş A.Ş. stone processing company for supporting this research by providing dimensioned rock samples for the sawing experiments.
Funding
This research received financial support from the Scientific Research Fund of Karadeniz Technical University [Project No. 2009.112.008.3].