
Abstract
Increasing the cost of electricity and the global obligations for efficient use of energy have added additional pressure to industrial companies in an already challenging market. Manufacturing companies are adopting methods to have a greater agility to respond quicker to the market dynamics and varying demands by changing production configurations. In recent years, deploying virtual engineering design approaches and extensive simulation methods have facilitated an early insight into how a system may perform, in advance of the physical build. However, the impact of system reconfiguration on the cost of energy consumption is typically unknown.
Much research has been carried out on the development of new energy-efficient drives (e.g. motors and actuators) and also the possibility of turning off the drives when idle to save energy. However, in this article, the authors propose a new method of energy saving for engineering production lines by fine tuning the low level device motions to optimise energy consumption.
An integration method between virtual engineering design and simulation modelling is proposed, and as a result a simulation method for energy optimisation is developed. In this article the method of interpreting virtual design data for use in simulation modelling of a production assembly line in an automotive industry is discussed. Furthermore, a developed algorithm for optimising energy usage based on adjusting dynamic properties of the system components (e.g. accelerations, torque and mass) is discussed and the result of implementing the concept in an experimental application in the powertrain industry is reported.
Introduction
To have market competitiveness manufacturing companies need a vigorous control over the enterprise processes, resources and the value adding factors. One of the important value adding factors that acts continuously as a parameter of production cost is energy consumption. 1 Energy analysis is important because it not only increases the product price, but also has environmental impacts. 2 Nowadays most industries have increased their automated processes, in particular automotive industries with probably the most intensive use of automated machines on manufacturing and assembly lines powered by electrical energy.
The cost of electricity in a typical automotive production plant may rise to hundreds of thousands of pounds per year. Typically electricity is used throughout the production, for instance, for compressed air, lighting, ventilation, air conditioning and in particular for motors and actuators for the machines, materials handling and welding. 2 Estimation of the energy usage in vehicle assembly plants varies among the processes, as shown in Figure 1.
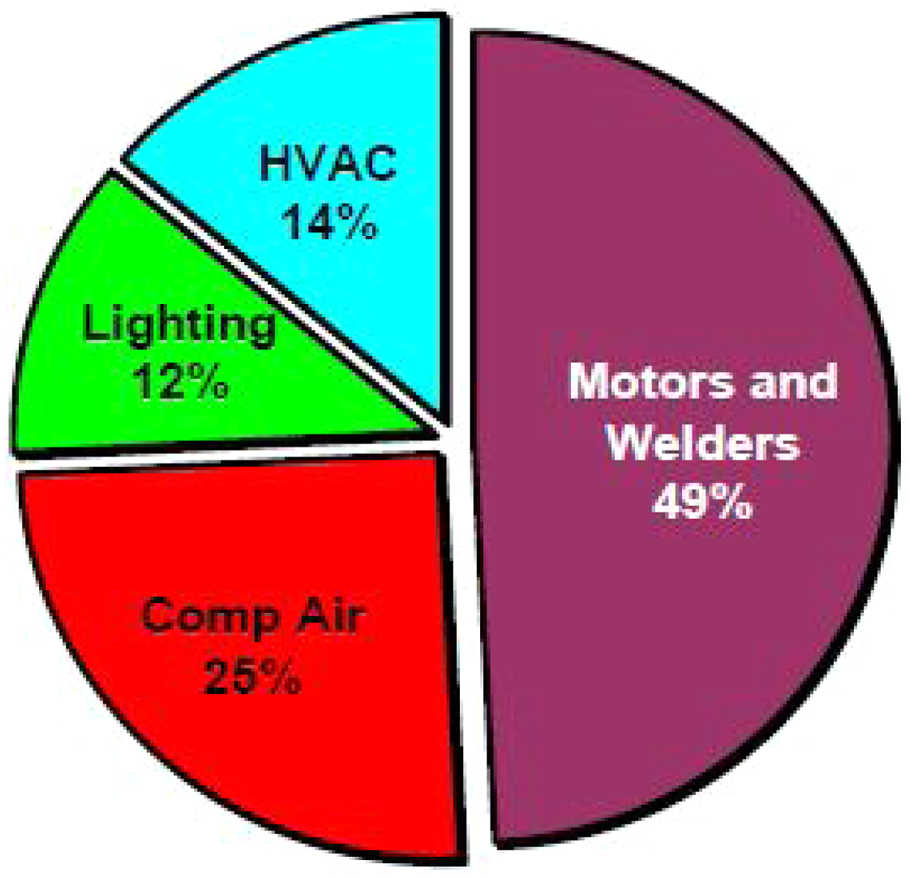
Energy consumption distribution in the automotive industry.
As illustrated by the figure, the electric motors and welding machines in such plants account for nearly 50% of the energy costs. 3 This emphasises the importance of optimisation of the processes and facilities with respect to minimising energy consumption. However, to ensure energy saving schemes do not impact on the plants’ productivity, detailed analysis of the enterprise facilities, down to device levels, are required. Such information could enable prediction of energy consumptions at design level and could facilitate design reconfiguration in order to optimise energy usage.
The emerging virtual engineering (VE) approaches have been used to develop and validate system designs, manufacturing and assembly machines prior to the build. Virtually validating the machine/system made of various re-useable components can provide necessary data for use in energy consumption analysis.
Figure 2 illustrates the conventional and VE environment used in the production system development and analysis.
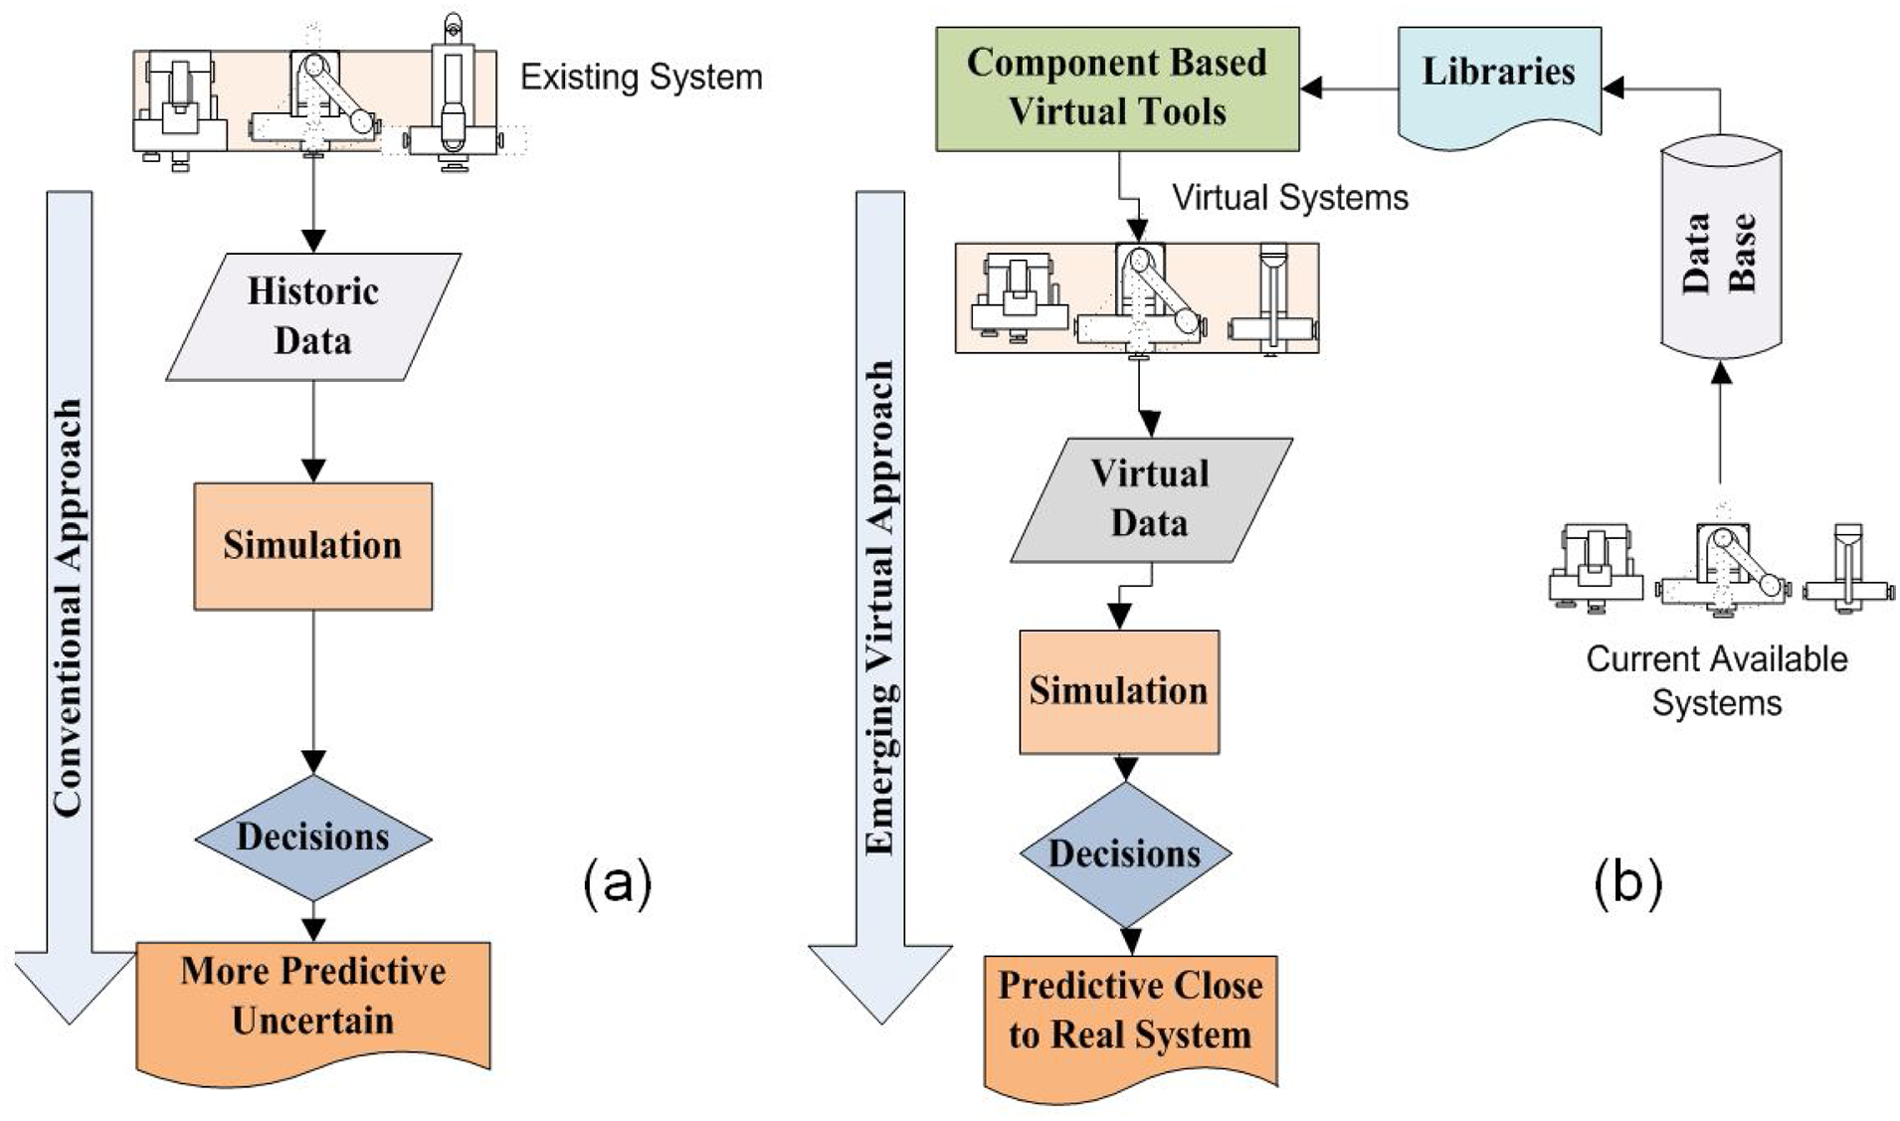
Conventional (a) versus emerging virtual driven analysis (b). 1
In a conventional method, the production system analysis is based on data being captured from the physical systems, as shown in Figure 2(a). However, in a VE environment, systems are decomposed into components and a set of digital representative models of those components are stored in a library to be reused in various systems design configurations. As shown in Figure 2(b), a library of components is developed based on existing (or past) physical systems. The components are then used to develop virtual systems, and data derived from such environments could be used to analysis and predict system behaviours. This is implemented prior to the build of physical systems.
Although the development of engineering systems based on a virtual environment is not a new approach, the application of the knowledge generated in a VE environment to drive process validation and energy consumption analysis are emerging concepts and the focus of this research.
Typically process validation in engineering systems are carried out with the help of discrete event simulation (DES), which produces predicted results with a wide range of experimental variations particularly in the area of system performance evaluations. However, as proposed by this research, there is potentially significant benefit in integrating (or rather populating) DES models with the data from the VE environment. The DES analysis could be very effective if at the system design stage a real time virtual data is used to observe the machine utilisation, reliability impacts, human operation, scheduling and cycle time balancing along with the energy consumption at the processes level.
This article is focused on describing the development of a new approach to optimising level of energy consumption at systems’ processes level, during the design and validation phase in a VE environment.
An obvious solution to the current energy inefficiencies in systems’ devices is a gradual replacement of existing motors and actuators with more efficient ones, as investigated by other research groups 2,4,5, which has its own financial impact on companies. However, this article reports an energy optimisation approach that monitors process timing and speed and their impacts on the energy consumption, and their inter-relationship with productivity factors, such as cycle time, volume and shift pattern.
State of the art
An extensive study about energy consumption in different manufacturing industries with respect to their environmental impacts has been carried out by the US Environmental Protection Agency (EPA). 4 The EPA has sponsored a project completed by G. Boyd 6 to develop a performance-based indicator in the automotive sector to motivate the energy saving trends. In addition, the United Nations has provided the audit procedure for energy savings in building applications on a mass scale. 7 Furthermore, development of the energy star scheme 3 by the EPA in 1992 has also provided rules and techniques to control and give visibility to energy consumption at utility level in the plants, especially in the automotive industry.
One of the commonly used approaches in the engineering environment when seeking energy saving opportunities is known as Outside-In. 8 In this approach, the energy is analysed at the plant’s boundaries and incrementally moves inward to the machine levels. On the contrary, the Inside-Out 8 approach is the method used to monitor the utilities’ energy consumptions in automotive plants. It emphasises the identification of energy saving opportunities that begin at the heart of the production plant, with the equipment that actually manufactures the product. As part of the Inside-Out approach, the process flow diagrams are used to indicate the magnitude and location of energy use, waste generation and production costs of the manufacturing processes.
Another energy consumption study reported in 2009, known as the Kaizen Teian approach, 10 is centred on continuous improvement to aware the employees about energy importance in production processes. It focuses workers participation for the effective utilisation of machines, while bearing in mind the importance of energy. The frontier approach 10 is a descriptive statistical-based analysis technique used to identify the efficiency gap between the best and average practices in terms of energy use by the resources. The approach applies to a set of production plants operating under similar conditions, which helps mangers to understand how individual plants are performing relative to their peers. This makes mangers able to set targets and goals to minimise inefficiencies of the resources with respect to energy use.
Most studies reviewed as part of this research concentrate on energy usage during the operational phase of a plant, and despite great benefits, they only monitor areas where energy is used. Such information may be used for the design of the next engineering project in the same family of the industrial sector, or provide instruction for improving physical devices (e.g. replacing old, oversized motors). However, a number of current commercially available VE applications can potentially facilitate the control and monitoring of energy consumptions prior to the physical build. Examples of these applications include: Delmia by Dassault Systems, 11 Process Simulate and UGX technomatix by Siemens, 12 and Core Control Editor (CCE) by Loughborough University. 13 Most VE tools can interpret systems’ specifications in the form of a standard data set, for example an XML format. 14 The specification data can potentially be used to drive other analysis tools, for instance, a simulation model to evaluate device-level energy consumption. However, the nature of these data are often very different and a significant effort is required to interpret one to another. Currently, the authors are not aware of any attempt in industry or academia to have exploited such a potential.
Virtual driven DES approach for energy analysis
An on-going research study carried out at Loughborough University has resulted in the development of an approach to integrate the VE to the DES models. The virtual driven discrete event simulation (VDSim) provides a framework to enable two way integration between generic VE applications and simulation systems. Such integration enhances VE systems by enabling evaluation of a virtual design, such as a production line, over a period of production time, and therefore enables the prediction of key performance factors by taking into account the random nature of manufacturing system behaviours, such as uncertainty in machine breakdowns, repair time and human factors. Furthermore, it provides simulation and what-if analysis capabilities to the VE designs. In addition, a simulation system can also benefit from obtaining system design specifications in advance of the system build, which significantly improves the accuracy of the estimations.
Figure 3 illustrates an overview to the structure and components of the VDSim approach.
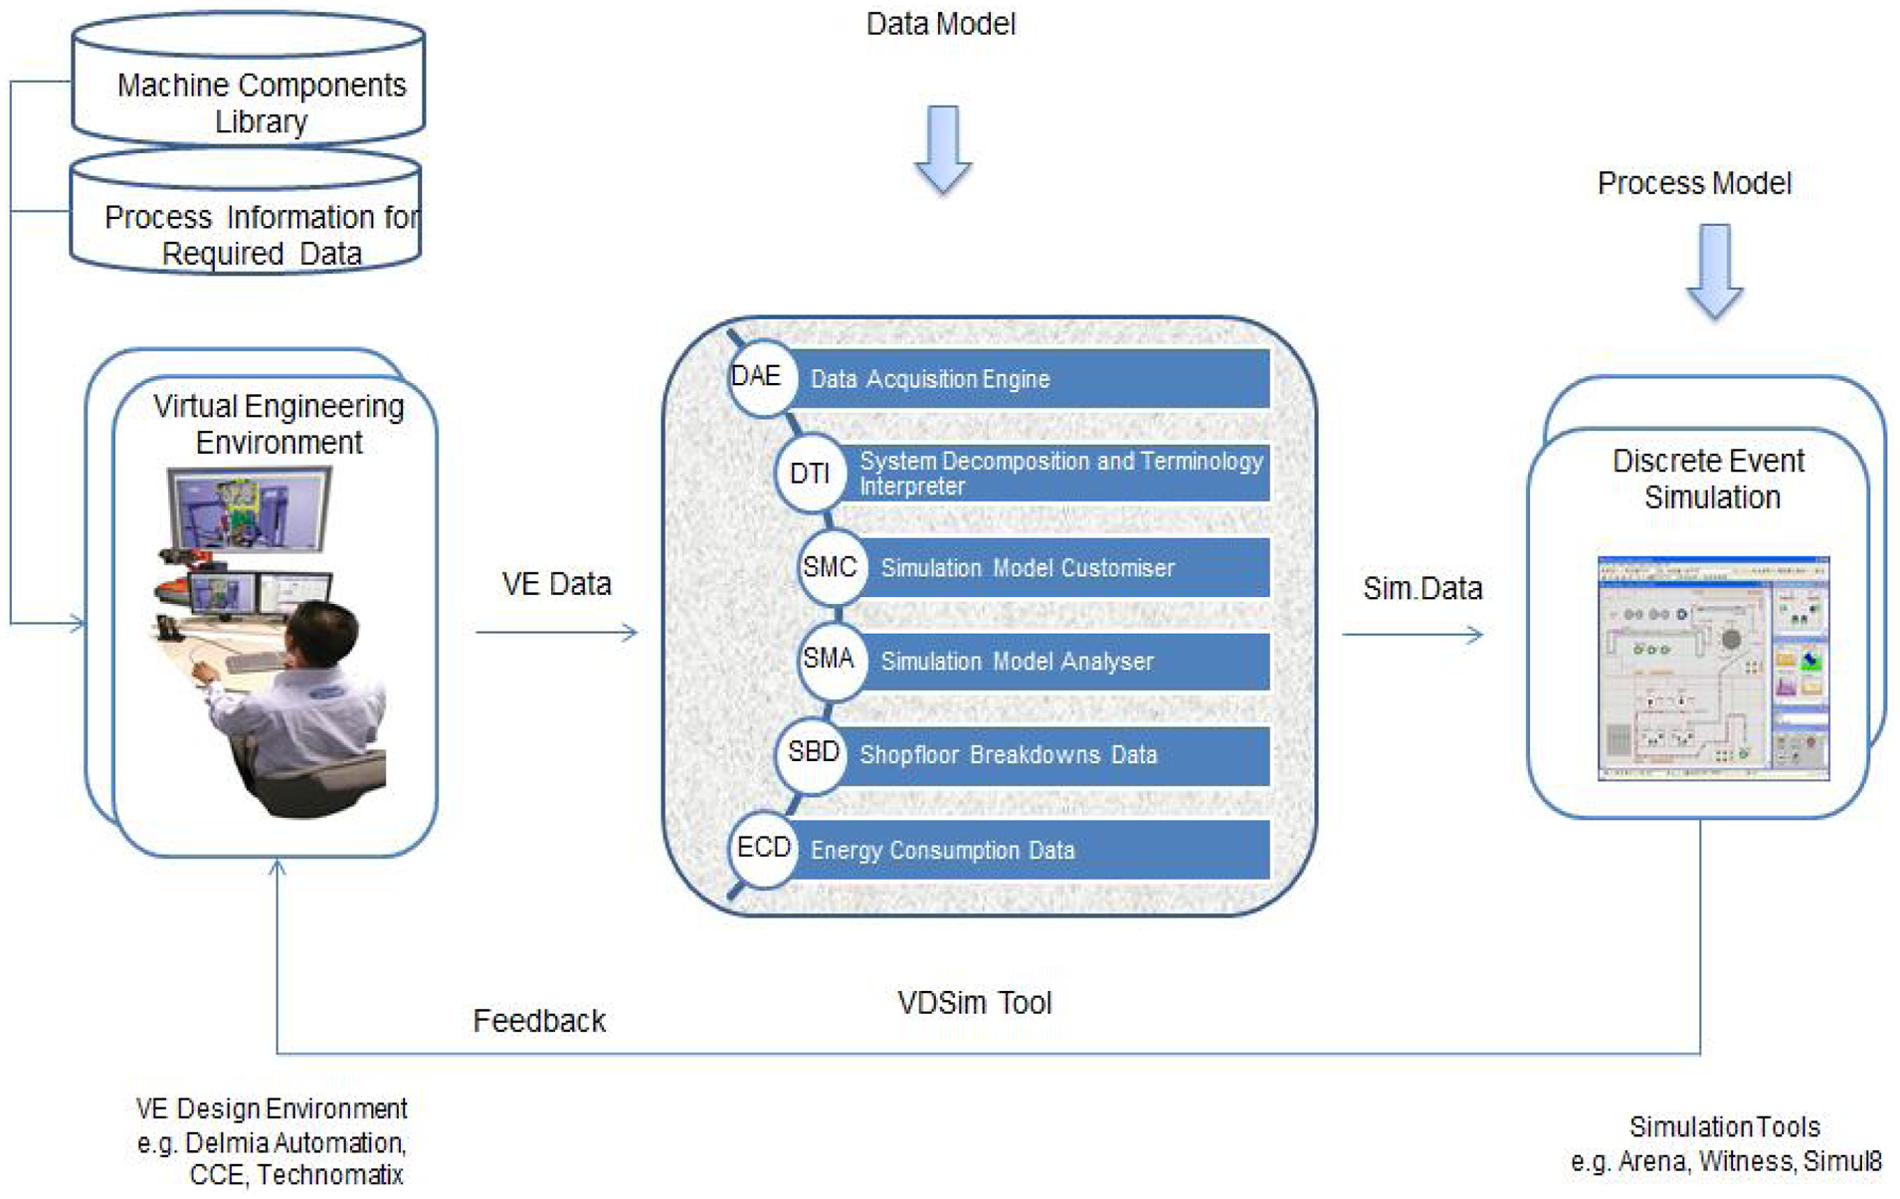
VDSim approach for energy analysis. 15
Briefly, the VE tool uses a set of pre-defined machine components from the library. The digital components (comprising 3D model, kinematics, and physical/operational data) provide sufficient information to build a virtual production system. The required production information (e.g. production sequence, process timing, and interlocks) are typically designed by users or already embedded into the library’s components. The simulation models benefit greatly from such integration by accessing to some of the virtual production information such as sequence, conditions/limitations and timing of processes, and resource requirements (typically machine and operators). This enables perdition of the system behaviour in a far greater detail and much earlier within the production life cycle. Furthermore, the components’ physical and operational data, such as mass, velocity and acceleration are embedded into the digital components and can provide vital data required for the simulation models to calculate the energy consumptions at component and device levels.
The VDSim approach includes a toolset (and associated modules) to assist extraction, interpretation and customisation of the VE information to a simulation modelling environment. The simulation models also provide perdition capabilities to the VE environment with regards to the uncertainty parameters of the production system such as breakdowns and energy consumptions. The information related to the components’ computer-aided design (CAD) models existing in the VE environment is provided to validate the associated data virtually from the kinematics of the components with respect to each other. The VDSim includes two types of system specification data: VE data and process modelling data. The VE data, structured in XML format, is extracted from the virtual model of the system by the data acquisition engine (DAE) module of the VDSim. The process model includes the process sequences and the operational conditions and enables development of the simulation model based on the virtual model of the system. The data terminology interpreter (DTI) module applies an experimental rule-based mechanism to translate the VE model to the data objects required for simulation models. The system breakdown and repair information and nominal energy usage for the system’s devices are provided by the shopfloor breakdowns data (SBD) and energy consumption data (ECD) modules, respectively (please see Figure 3). The simulation model customiser (SMC) module provides user interaction with the model to apply what-if scenarios. The energy related simulation is the main focus of this article. A detailed description of the VDSim concept, used to facilitate the integration between VE and DES models is reported previously by the authors 15 .
Energy optimisation algorithm
The energy analysis component of the VDSim is developed to compute the electricity consumption of the system devices during operation and idle periods of the devices.
Two techniques are suggested 16 for calculating the power in engineering systems.
Power calculated based on force over a distance, i.e. energy is calculated simply from the equation used for ‘work’ carried out,
Power calculation based on the torques applied. This technique takes into account the power used for stationary states of motors and actuators, in addition to the normal energy consumption, for example, when a motor is continuously running under the torque only to hold a component at certain positions.
The first method is valid for simplified cases but in complex systems this method could produce unacceptable errors. The second method considers torques as a key parameter to control device motions in addition to the work, and therefore is perceived to be more accurate.
Figure 4(a) represents the approach developed to calculate power consumptions for the processes based on the torques and motions performed at a components level in virtual systems.
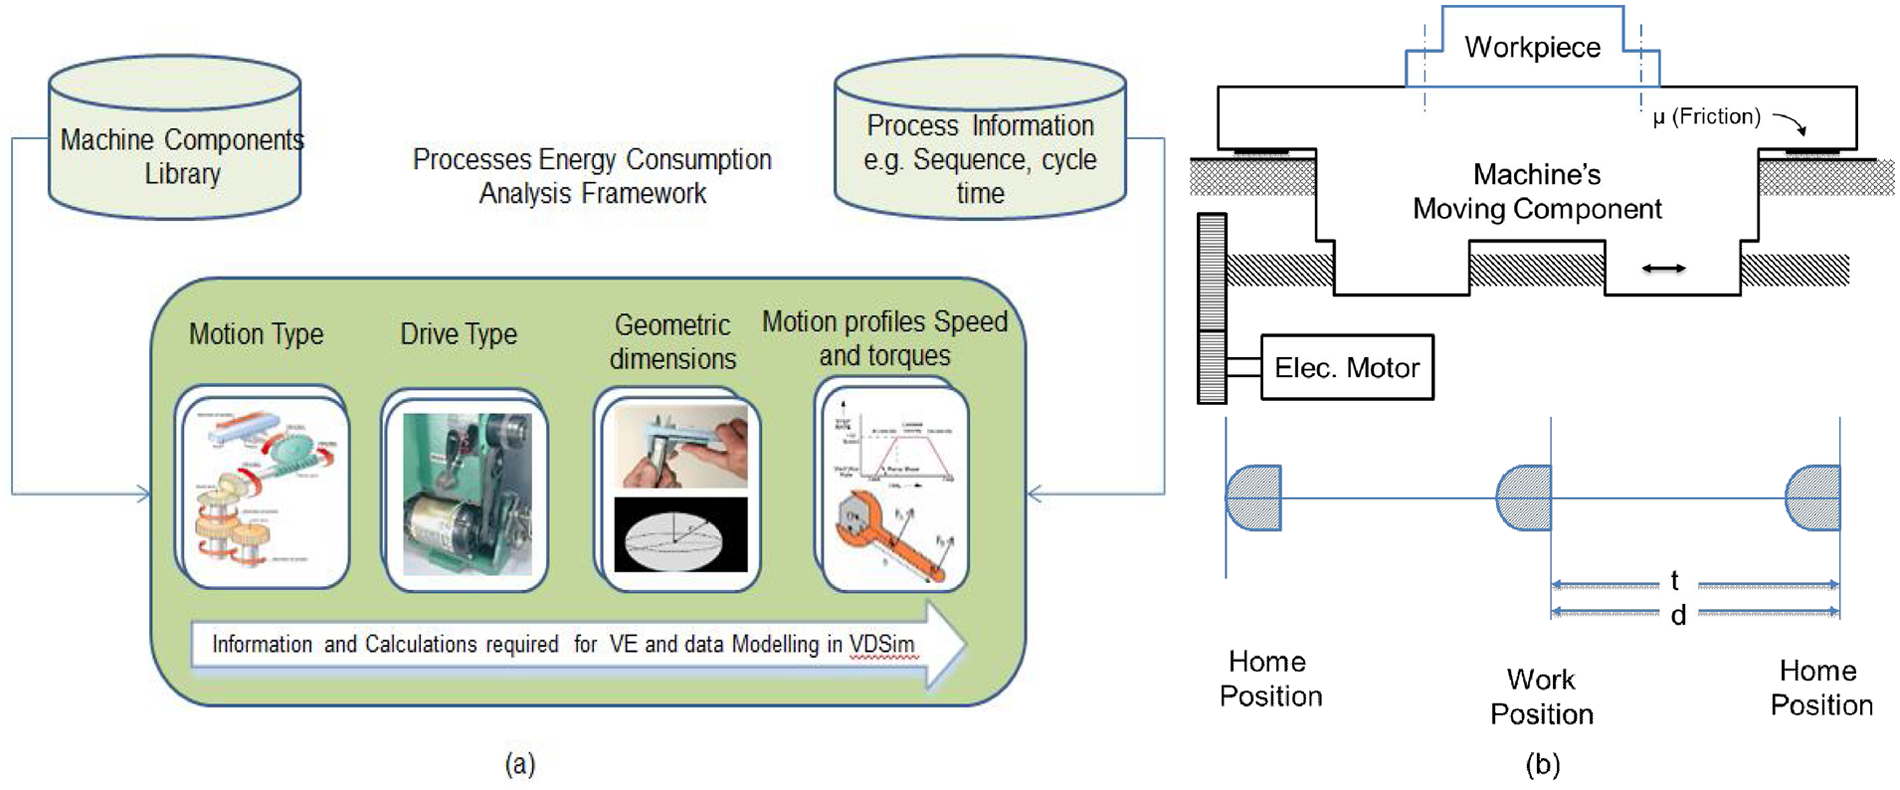
(a) Power calculations method and (b) example of power consumption mechanism.
Based on machine components and their process times in the overall cycle time as well as the process sequence, a method has been proposed that includes motion type, type of drive, geometry and motion profile and torque, as shown in Figure 4(a). While Figure 4(b) represents the component mechanism to be driven, along with the positional states referred to as ‘home position’ and ‘work position’. The design framework is based on the single move as a base line, for example to identify the parameters used in power consumption while moving a component, such as a machine table, from the home position to work position, covering distance “d” in time “t”, which is also known as a duty cycle for this process. Brief descriptions of the parameters used in energy consumption are as follows.
Type of motion
In automation, control over the motion is important because energy consumptions are linked to the motions. Therefore, to calculate power consumption based on the motions, the identify of the type of motion is required. Typically two types of motions were analysed in this research:
(a) linear motions, which could be linear horizontal (LH) as shown in Figure 4(b), or linear up–down (LUD);
(b) rotary motions. 17
A clear understanding about the type of motion leads to choosing the right type of drive at design level, and a more accurate power calculation.
Type of drive
Drives are the key enablers in performing processes according to the duty cycle sequence in the overall cycle time. Various types of energy, including pneumatic, hydraulic and electric, are used to actuate motions. In automotive industries, the pneumatic- and electric-powered drives are used most commonly. To accurately calculate the power consumption, the impact of the transmission mechanism, such as belt pulley, chain sprocket or lead screws, should also be considered.
Geometric dimensions, loads and inertia
Data related to the dimension/mass of drives are important because they are used to calculate the inertia being reflected at the motors’ shaft, based on the drive’s mass. The dimension is calculated based on the shaft diameters, pitch of the lead screws, thread angle and coefficient of frictions. Regarding the inertia, two types are being considered: one is reflected by the drive movement’s mechanism, and the second is the load being carried out by the drive. The load could be the mass of parts, for example ‘work’ as shown, in addition to the frictional forces. Equation (1) represents a general method to calculate the inertia being reflected at motors, which consumes energy in the move from home position to work position

Motion profiles, speed and torque
It is important to take into account the profile of motions from home to work positions when determining the actual power consumption. Depending on the duration of the components’ duty cycles, two types of motion profiles are used mainly along with the corresponding torques profiles as shown in Figure 5. This figure illustrates the trapezoidal profile that is applied when sufficient distance is covered to reach contestant speed for the duration of the move. Initially, the component is accelerated (ta) up to the maximum speed/velocity (calculated from the distance between positions and time taken), then for time tc, a constant speed is acquired to get to the destination, and the component decelerates to stationary position (td). The corresponding torque during the acceleration period is the accelerating torque, which is used to overcome the inertia, while along the constant speed of the component, the torque is known as constant torque, which is applied continuously during the move because of the frictional and gravitational force of the load. In the deceleration, the torque acts in the reverse direction and is not consuming power. Generally a wide range of applications, such as chain drive, lifting and scanning operation, used such types of motions. 18
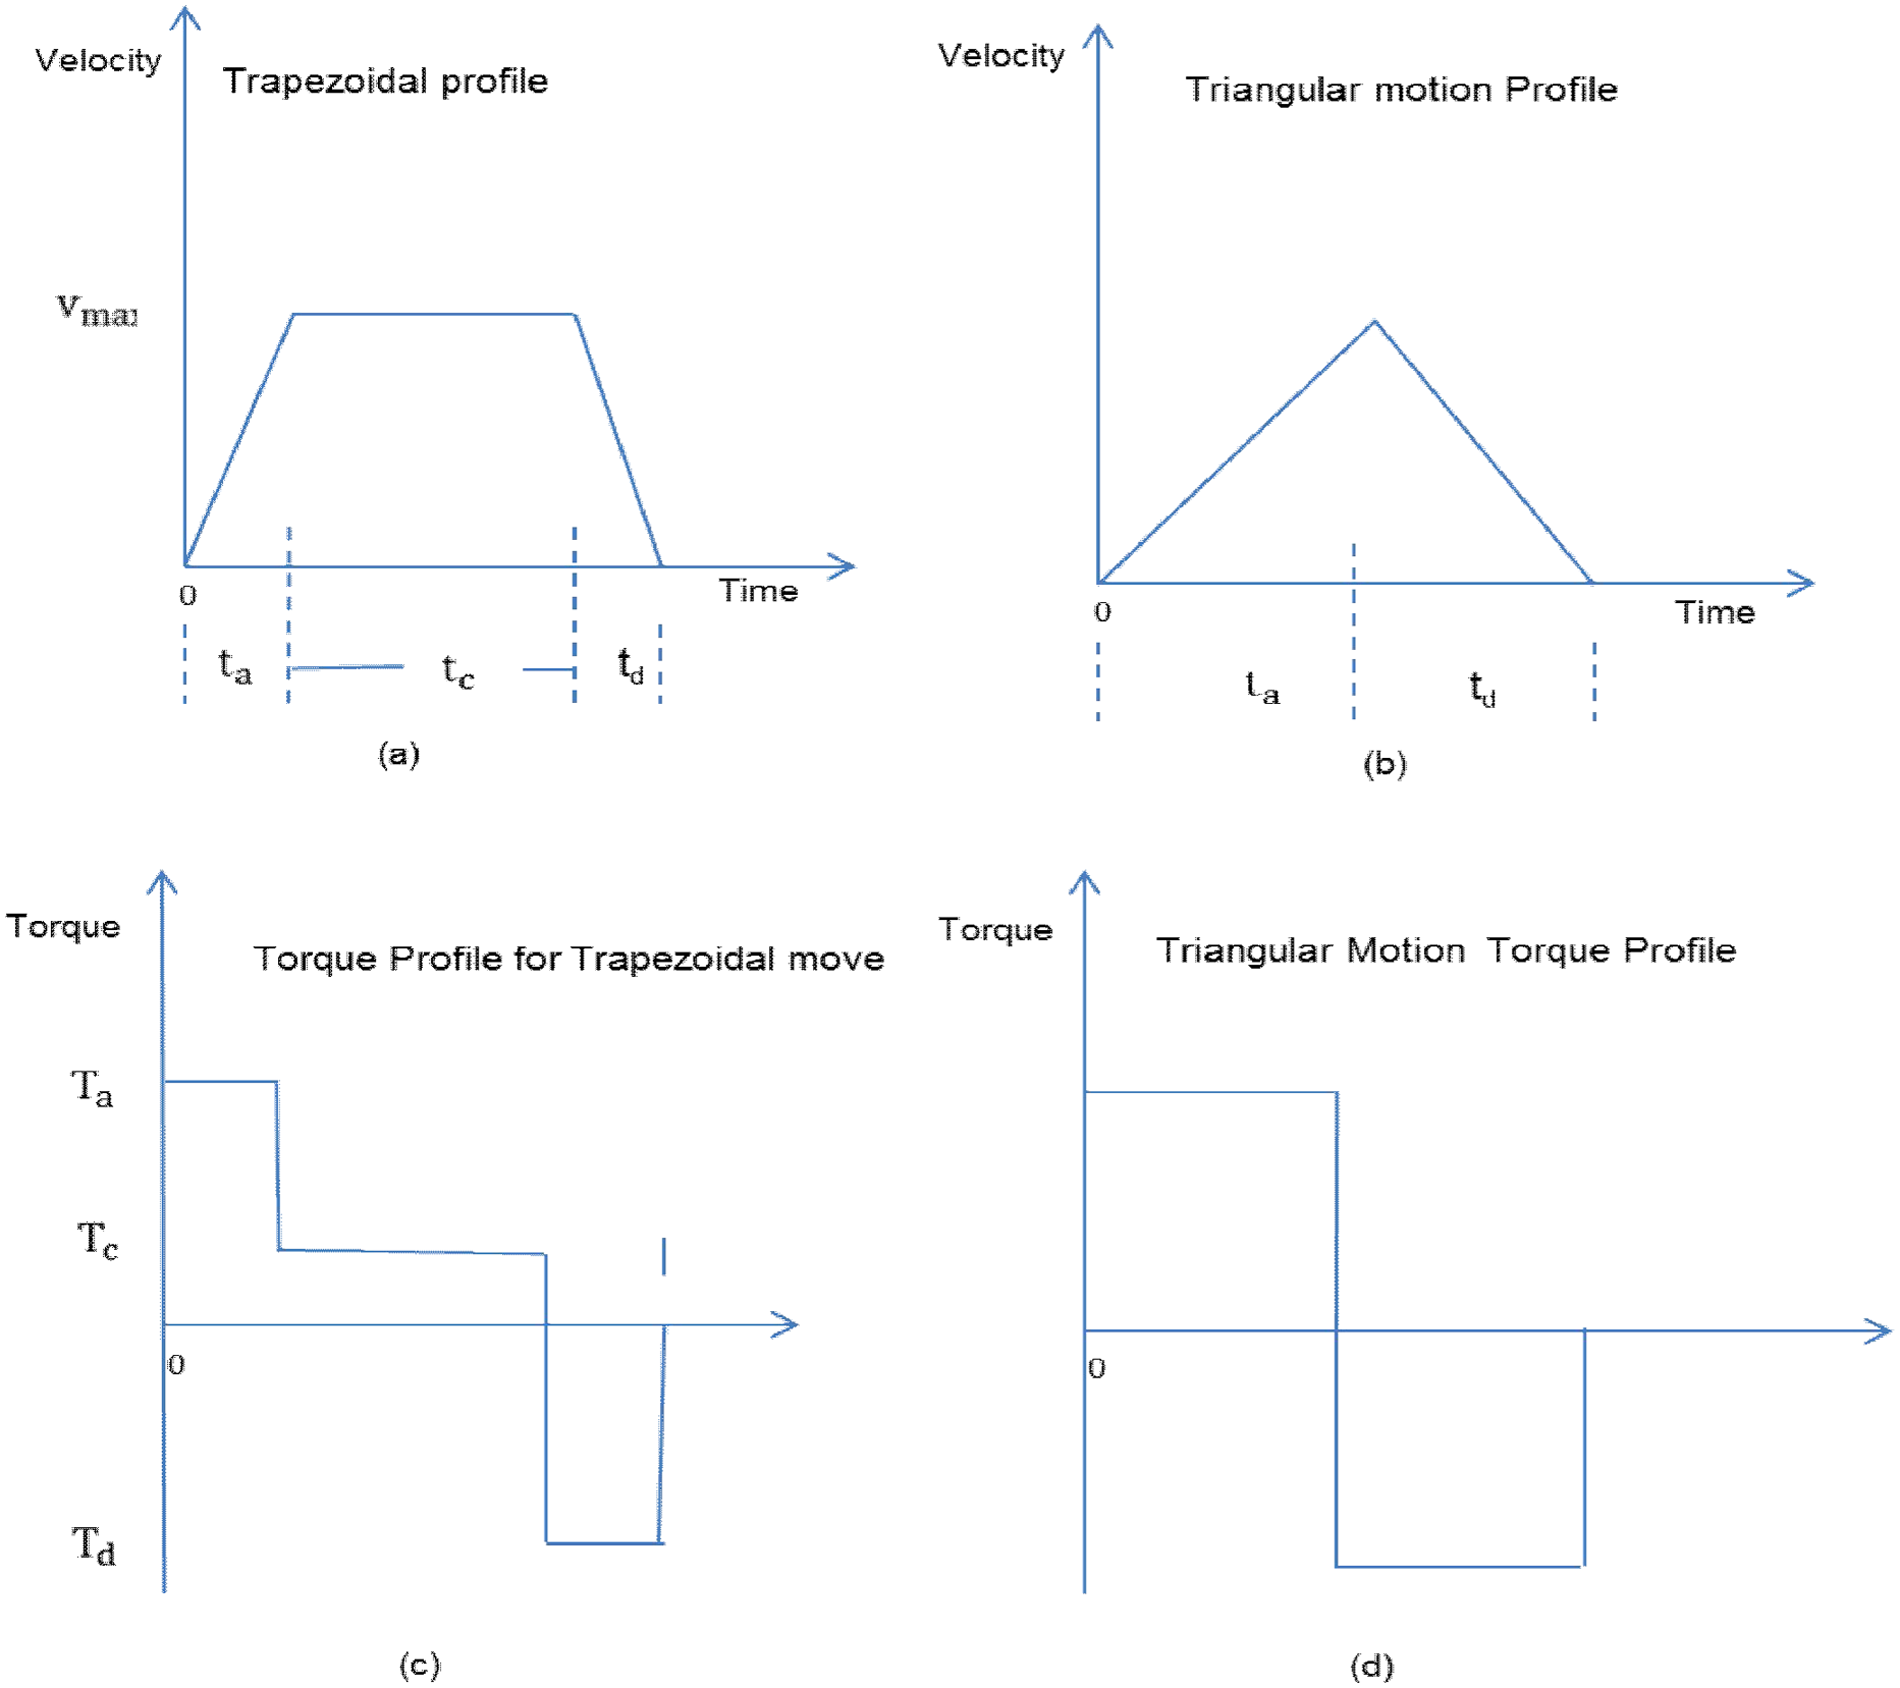
Trapezoidal motion profile (a), triangular motion profile (b), and corresponding torques profiles (c), (d), respectively.
Figure 5(b) represents the triangular motion profile to be used when the duration of the processes is very short. In this profile the component is accelerated up to the maximum speed and then decelerated before stopping. As shown, the associated torque illustrated in Figure 5(d) has no constant torque. Examples of this motion type are pick and place operations. 18
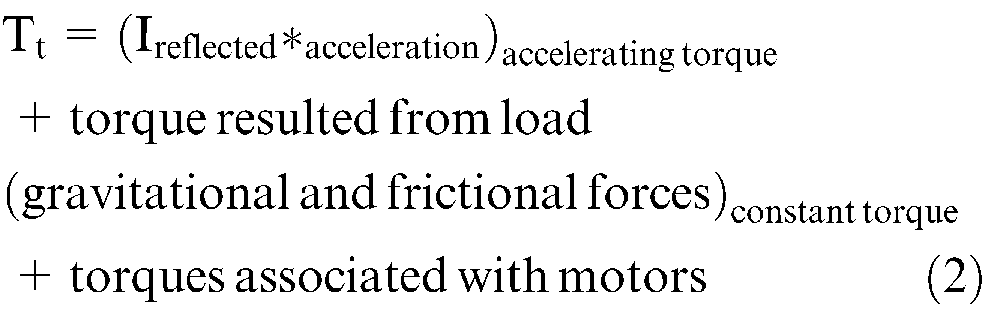
It is proposed that if the average velocity of a profile is less than half the maximum velocity of the components actuators, then the triangular profile is the better fit. Otherwise a trapezoidal profile can be used. Equation (2) represents the method of calculating the accumulating torque (Tt) during the motion where the accelerating torque is inertia reflected multiplied by acceleration
Having linked the power consumption to the motion of the system devices, the required sequential process of the devices are provided by the VE model. Capturing such data and integrating them to the DES models enables the energy consumption analysis, as discussed below.
DES model
As part of the VDSim approach, the process model and the sequence of operations are available through the conversion of the VE data to the data sets suitable for simulation. 15 Simulation models are developed to examine the system performances during the operational time (e.g. 8 h production cycles), with taking into account the production parameters, such as cycle time, volume, shift patterns, breakdowns and utilisations. These parameters are not typically included in the VE designs, as the VE tools often represent system configurations (e.g. a complete production line) for one cycle operation.
The simulation method developed in this research, however, enables what-if analysis of scenarios to commonly occur, and therefore, can potentially predict possible energy saving when re-configuring the production parameters for each scenario.
Two scenarios were considered in this study based on observation of industrial cases in the powertrain sector.
A fixed production volume is targeted to be produced in a certain shift pattern with a nominated cycle time. The shift hours and cycle time could vary (slightly) to provide best fit to the volume requested, while minimising the energy consumption.
A fixed shift pattern is given and resources are required to be fully utilised. The cycle time, i.e. speed of operations (at component levels), will vary to achieve targeted volume within a given production time, while minimising the energy consumption.
In the above two scenarios, the DES model is deployed to determine the optimised production parameters for the least energy usage when targeting a certain production rate.
Figure 6 illustrates the structure of the simulation approach developed for predicting and optimising the energy consumptions. An exemplar ‘clamping’ process within a developed simulation model is shown with the associated production parameters, resource and energy data at component level (originated from the VE model), and the what-if scenario interface to the simulation model.
The simulation model is built using a commercial application (i.e. Witness 19 ) and interfaces to the VE environment and information models are developed using standard programming languages and data transfer methods. In this study Visual Basic (VB) assisted spread sheets and XML format have been deployed.
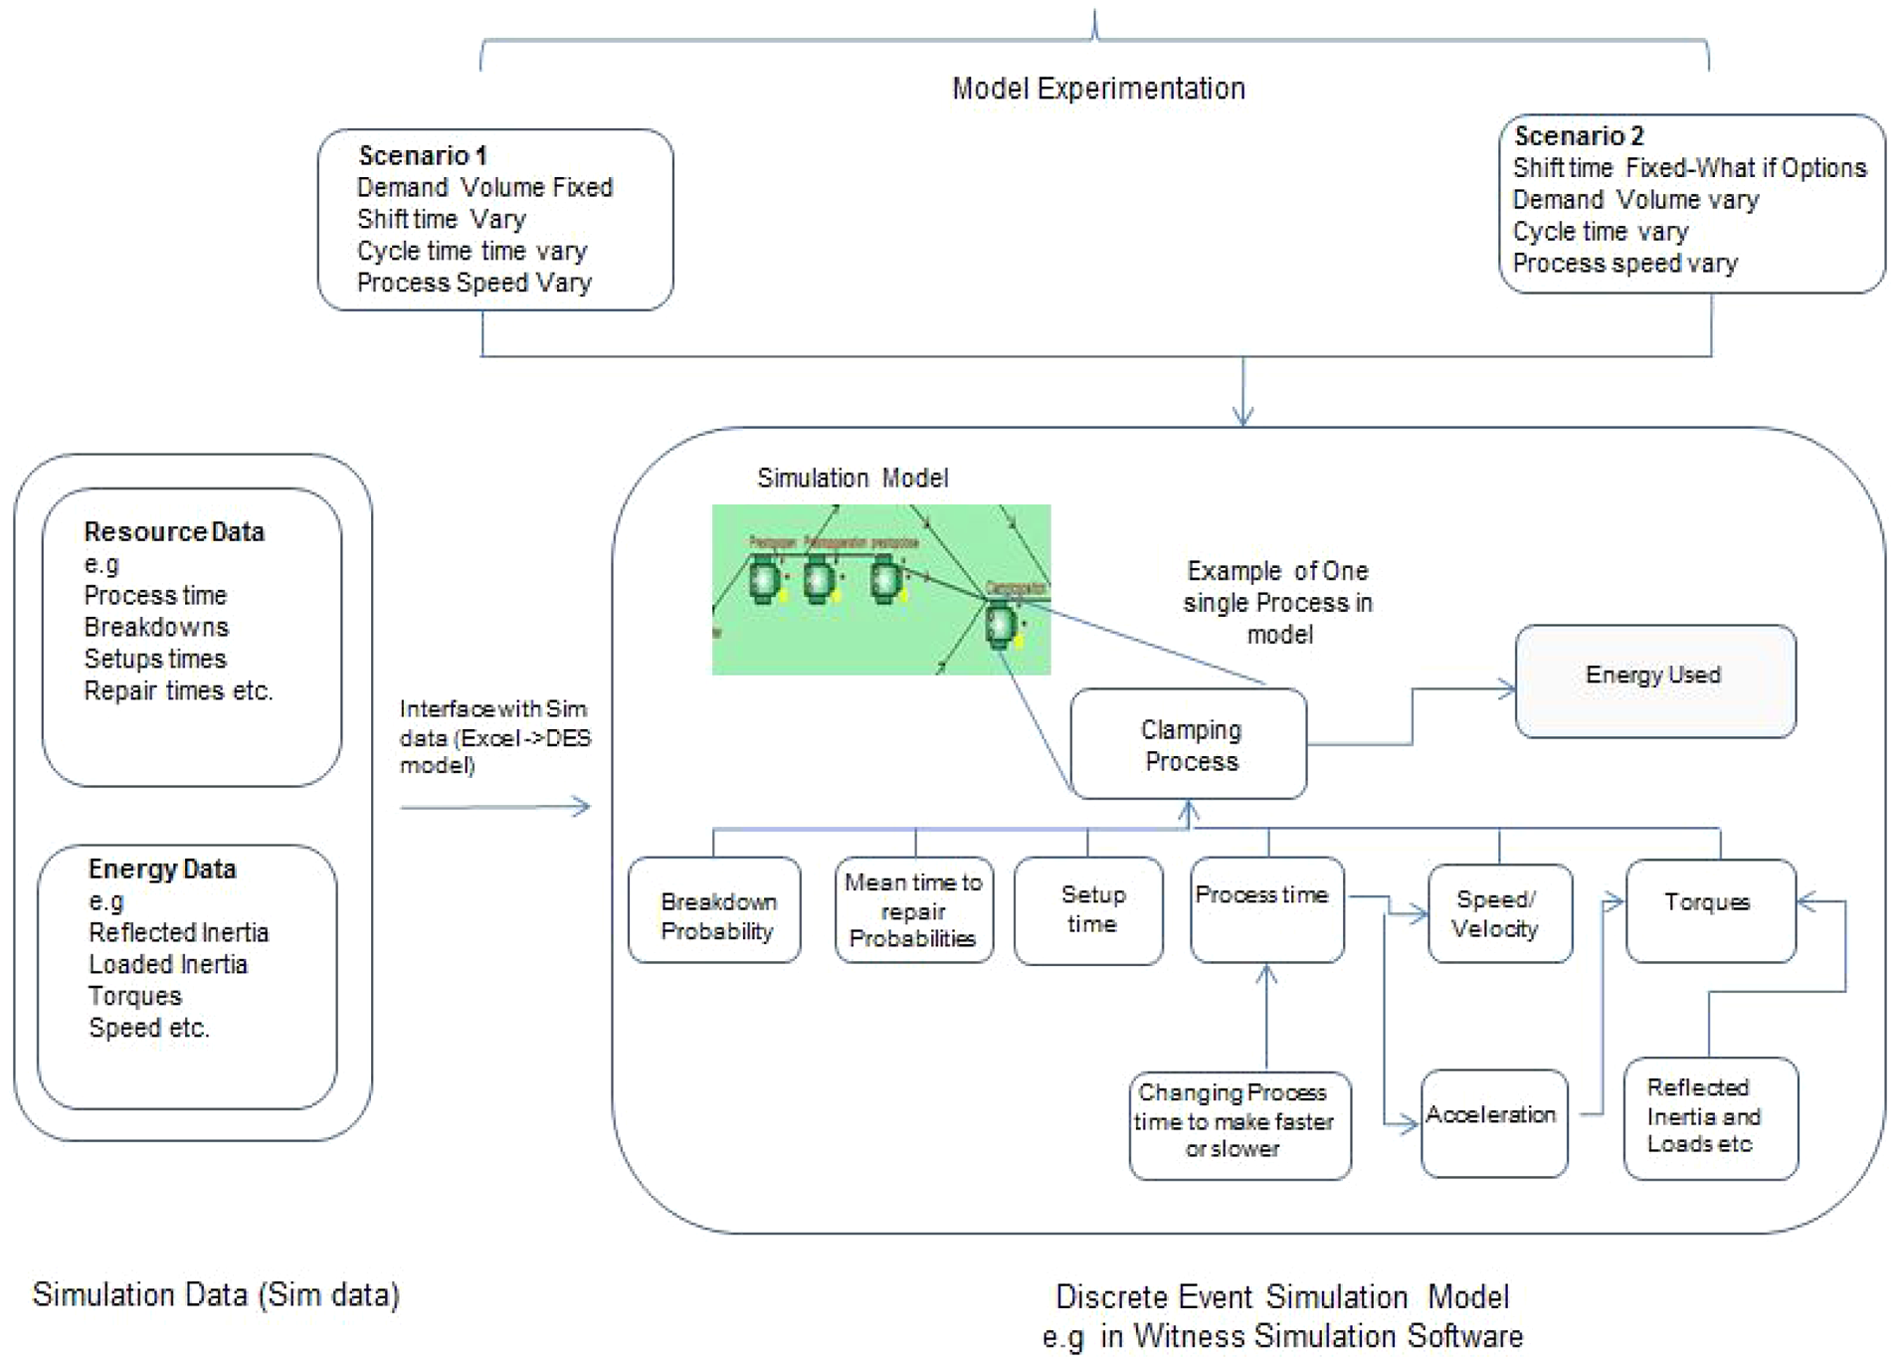
DES model used to calculate the electric power used.
Data mode was particularly analysed for variation exist at different inputs in the model. Reliability related data such as machine breakdown and repair time come with variation in their corresponding occurrences, which need to provide related inputs with appropriate probability distribution function.
Analysing the historical pattern of breakdowns, theoretical and experimental practices were applied to choose a suitable probability distribution for this study. It was concluded that the pattern of the machine failures occur continuously, independently and at a relatively similar average rate and therefore an exponential distribution 20 was selected as the most favourable probability pattern for this simulation modelling case. Furthermore, the collaborator’s expert opinion about the practice with simulation modelling and breakdowns data inputs over a long period of time also supported choosing the (negative) exponential distribution for reliability related data.
Reliability related data calculation of “mean time between failures” (MTBF), the “mean time to repairs” (MTTR) and setups times are embedded into the simulation model using negative exponential distributed function. The information about torques, inertias, accelerations and loads for each device associated to the processes in the simulation model are imported from the VE environment, therefore, the model calculates the individual and the accumulated energy consumption for the system as a whole and also at the device level. This is in accordance with the process sequences defined by the VE environment.
Furthermore, an additional variable has been included in the simulation model to allow adjustment of the speed of operations (where possible based on the operational limitations). This variable, the ‘process speed’, can marginally change the cycle time of each operation at component level. This is an experimental practice typically applied to physical production systems to meet volume rates by increasing speed or maximise utilisation by decreasing speed. For example, in a powertrain line, to meet a nominal cycle time the overall device speeds may have to be increased, which in turn results in more energy usage owing to the higher acceleration and inertia. Similarly, the production volume could spread over a working shift by decreasing component speeds, which in this case saves energy. The process speed variable in the simulation model impacts on the energy calculation for individual components, leading to identifying optimum parameters for maximum energy saving.
The simulation model will run for different production rates with high replications to increase the accuracy of the simulation results, taking into consideration the uncertainty issues of a typical production line (e.g. breakdowns and production volumes).
Proof of concept: case study
As part of a wider collaboration between Loughborough University and Ford Motor Company, the VDSim approach was implemented and tested at Ford’s Technical Engineering Centre in Dunton, UK. The first author spent significant time in the site to understand and observe the current practices regarding VE and simulation modelling processes. Various VE applications, such as those developed by Siemens and Loughborough, are used by Ford (in full or experimental capacities), covering product and production design phases. In addition, Witness DES software 19 is also used by the productivity department to produce production line analyses for processes’ verification and observing the impacts of the machine breakdowns, repairs and human resource performances on productivity. At the time of the visit, an on-going engine assembly project was being completed and the VDSim concept was considered as an experimental approach to shadow the actual project processes. The case study was narrowed down to one station known as ‘Operation 900’ (OP900) within the assembly line. In this automated station a conveyor moves engine blocks mounted on a pallet towards a rotary plate for a nut running operation (see Figure 7). The objective was to develop simulation models of this station based on the VE models, analyse the energy consumption of this station and identify the optimised assembly parameters to minimise the energy usage based on the required productivity rate.
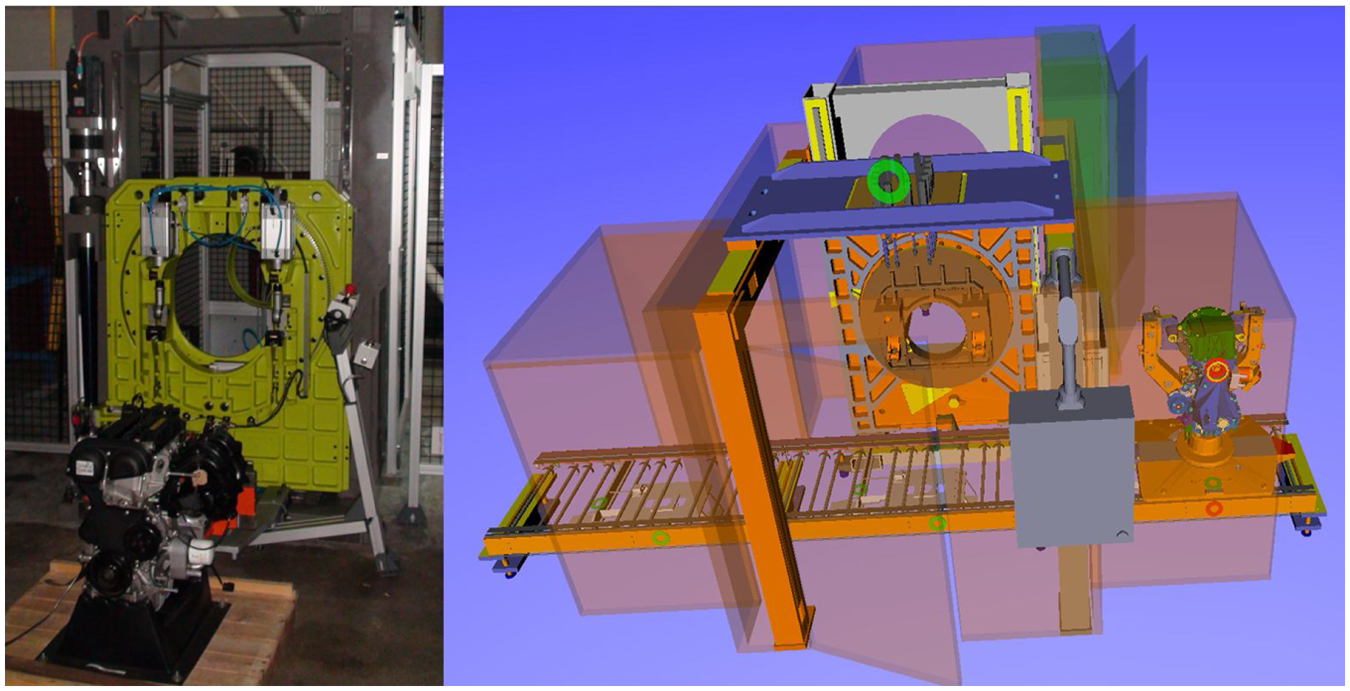
Physical and virtual OP900 station.
The existing practices for the OP900 station were understood to occur with little direct engagement between design and productivity departments. The VE design of the station completed around 24 months before ‘Job 1’ (i.e. when the first complete product is assembled). Simulation modelling is initiated around 13 months before Job 1 and continues for 6–12 months after Job1. The following potential limitations were observed.
The cycle times at station/machine levels are available to the productivity engineers, however further detailed cycle times for decomposed stations (e.g. component and device levels) are not available.
The process sequences at component level and energy usage related parameters (e.g. nominal consumptions, speed, mass and motions) are not available for the simulation modelling.
The simulation is built based on the experiences gained from previous projects and modifications on VE models (based on real-time validations) are not reflected in the simulation model until the physical assembly system is built and becomes operational.
Despite very successful productivity predictions by the engineers in this company, the observed limitations could cause a substantial margin of errors in early productivity analyses as they heavily rely on historical data and individual experiences.
Part of the case study related to the energy consumption is described below.
Implementation of VDSim
The VDSim concept illustrated in Figures 3 and 4 was deployed to build and integrate the VE and simulation models for the energy consumptions of the OP900 station. All processes in this station are automated and the motions are driven by electric and pneumatic drives. The detailed cycle times, device level process sequences and energy-related simulation data were extracted from the VE model. In this case study the latter set of data (e.g. inertias, speeds and pressures) were not available in the VE model and was enquired from manufacturers and manually added to the system.
The simulation model included the system devices that use energy during their duty cycles in both idle and active statuses (e.g. motors), and also devices that consume energy only in an active status (e.g. clamps, stop pins). The CCE virtual design tool and Witness simulation software were deployed to conduct this case study. The VDSim tools used in this case study were developed as a set of customised spread sheets powered by VB functions.
Figure 8 illustrates the developed VE model for this assembly station and part of the data extracted from this model required for the simulation by the VDSim tools. In this figure, only part of the simulation data related to the energy usage are illustrated. For instance, the overall cycle time for the OP900 station is 35.7 s, the rail component has a nominal rotation speed of 3.8 rev/s and acceleration is 2.07 rev/s2, while inertia is 0.272 kg-m2.
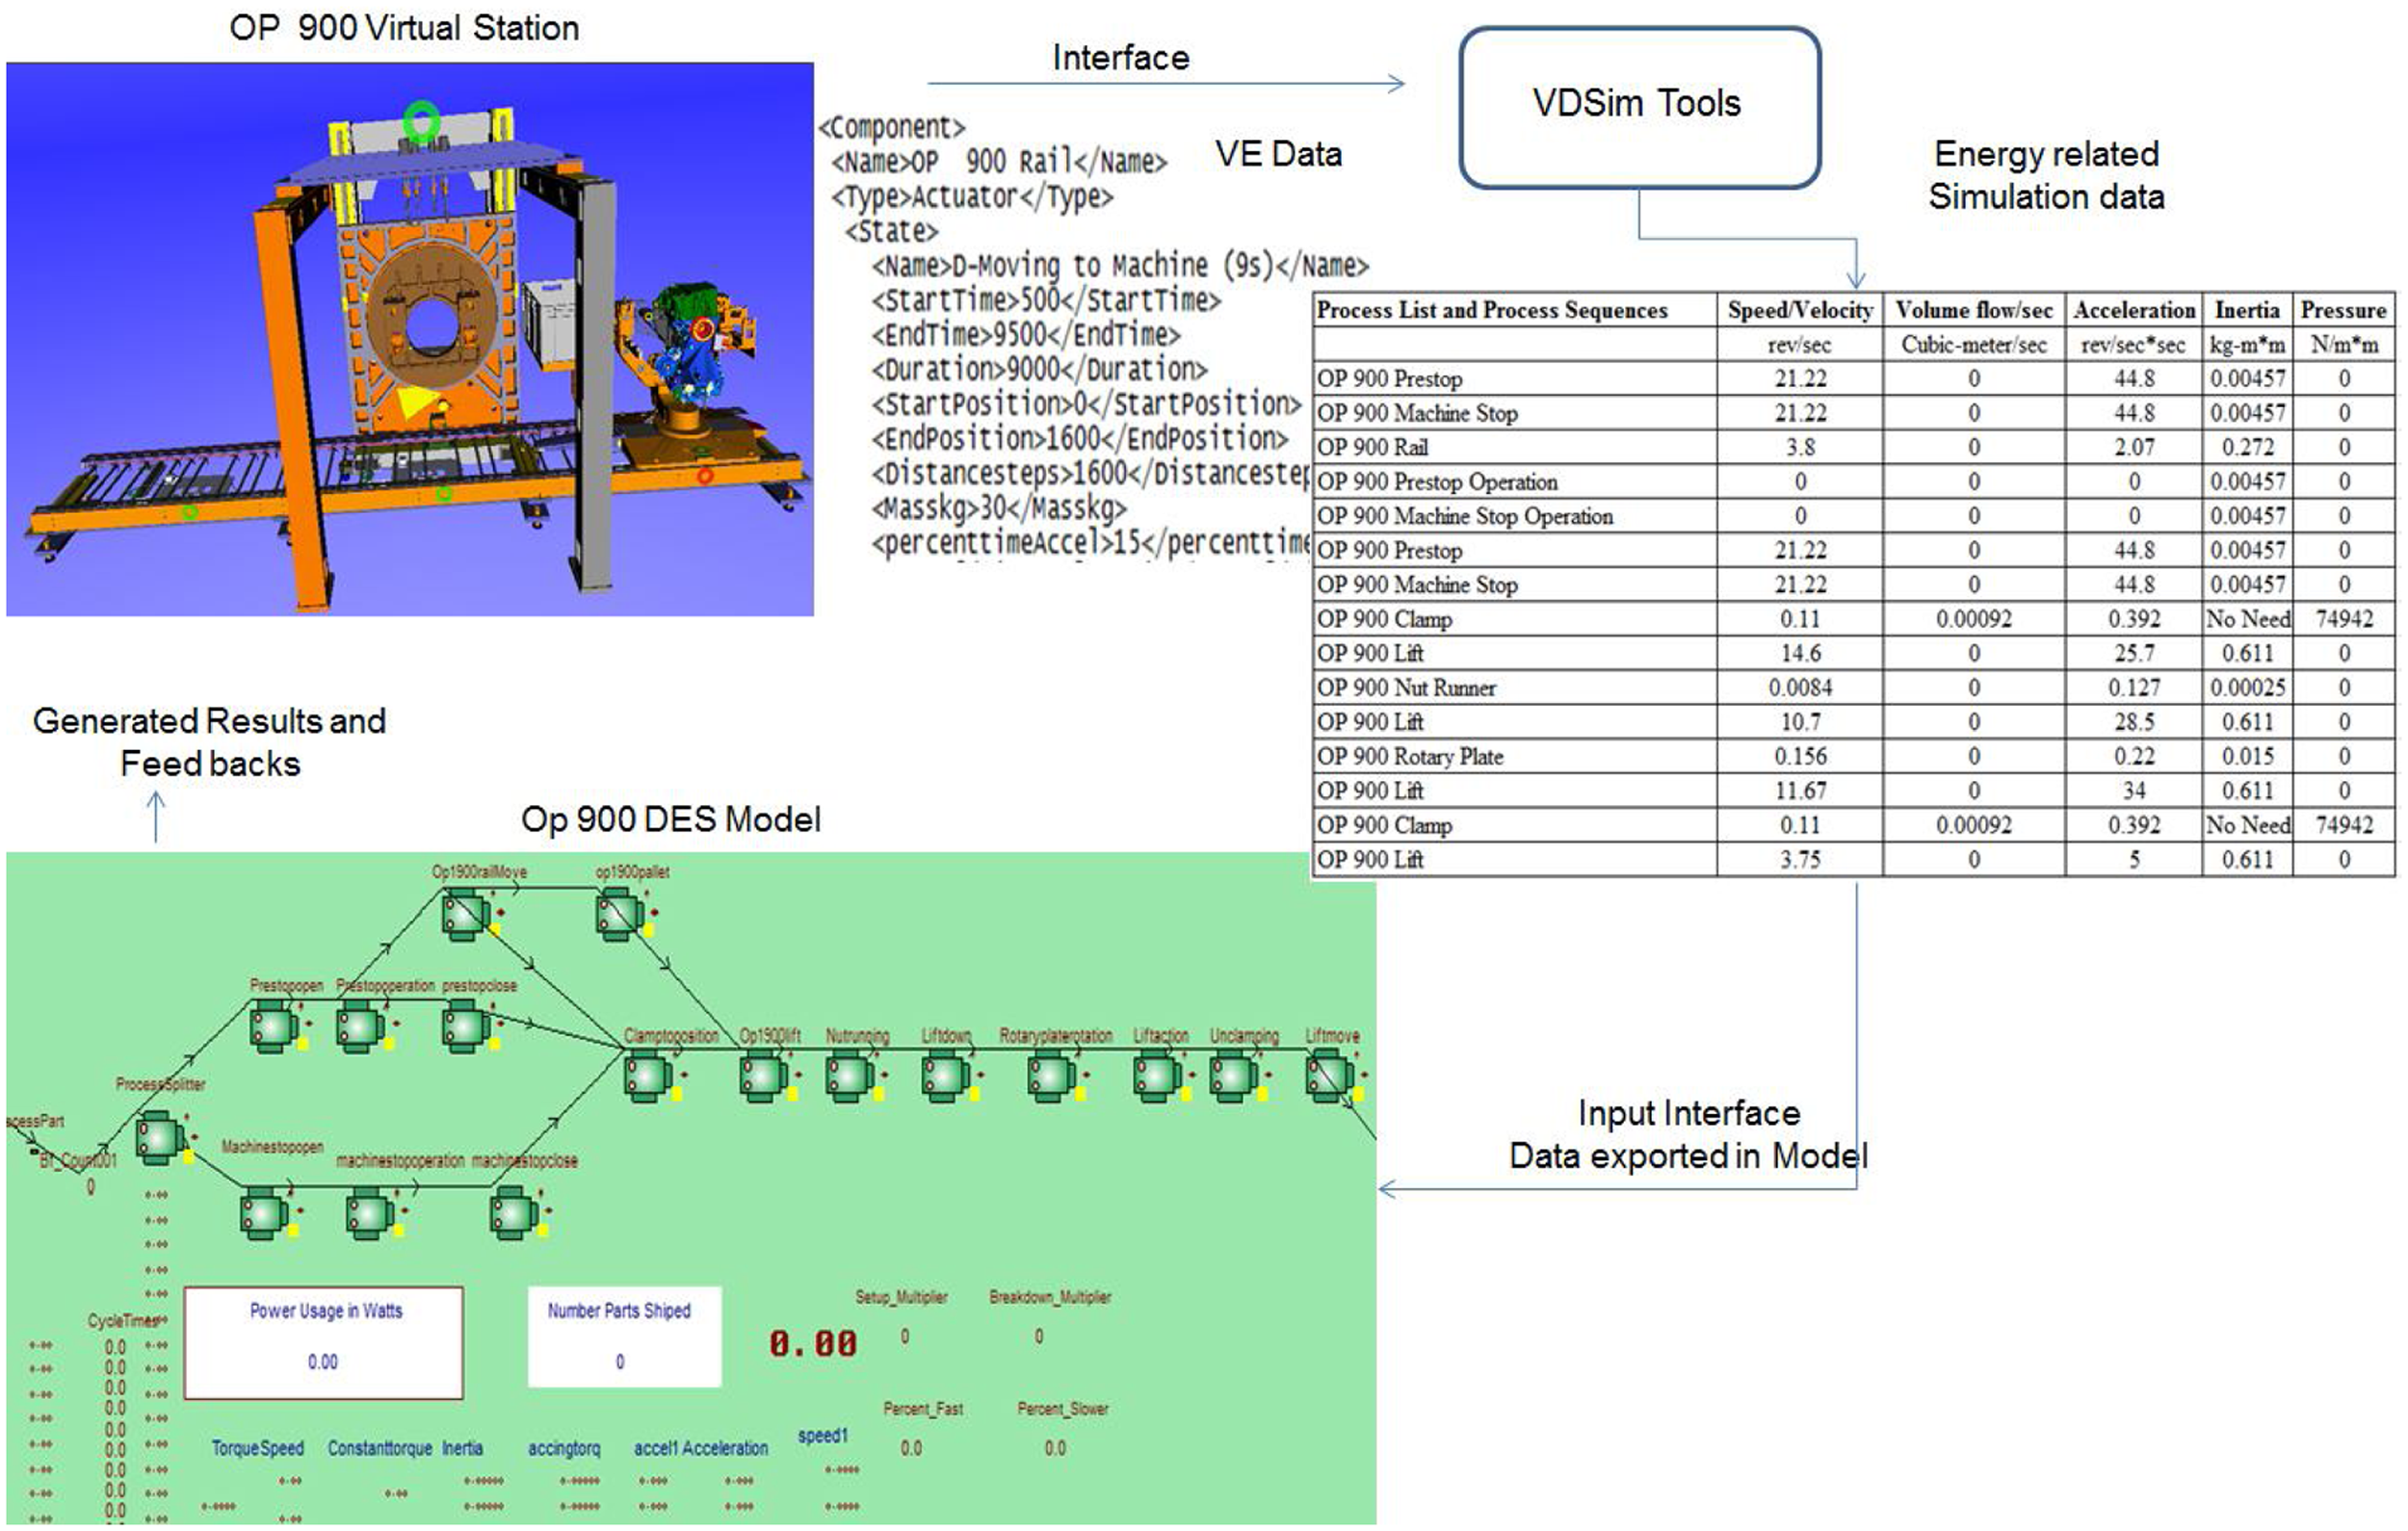
Implementing the VDSim approach to analyse energy consumptions.
Table 1 details some of the simulation data extracted directly from the VE model to be used for the energy optimisation of the OP900 station. These include types of the component motions and drives for each process, the device level duty cycles, component masses and the process sequences. For example, component 5, named ‘clamp’, used to clamp and unclamp the engine block having a 5 kg plunger moving linearly for 20 cm in 2 s driven by a pneumatic drive.
Components, process, move and drive types used in OP900.
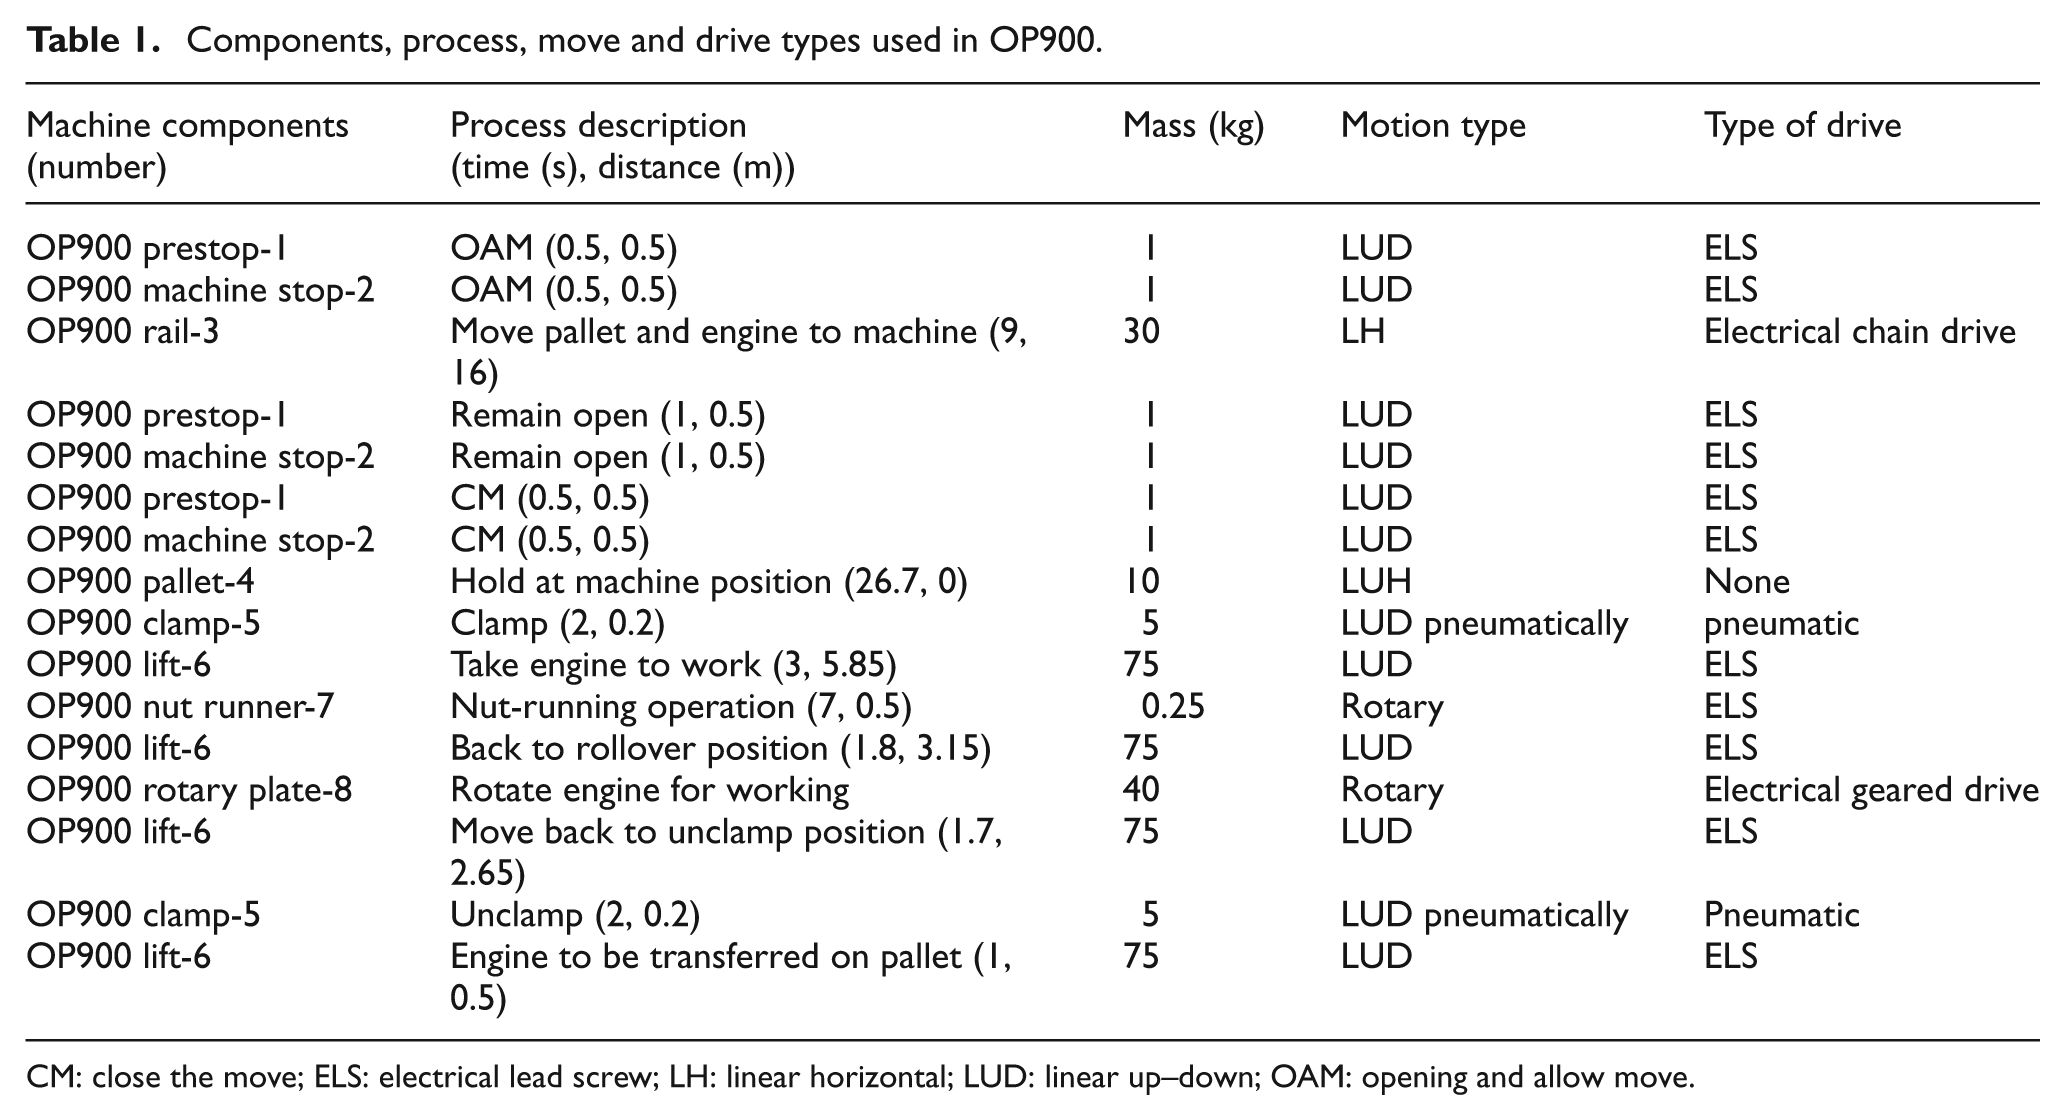
CM: close the move; ELS: electrical lead screw; LH: linear horizontal; LUD: linear up–down; OAM: opening and allow move.
The simulation model for the OP900 was developed based on the business process model 21 and the sequences of operations, with the calculating formulas embedded into the model for various drive and motion types. The calculations are based on the energy usage for each motion profile of a process and accumulation of the energy usage for the complete station. The optimisation of the energy usage is based on varying the assembly parameters according to the production scenarios. The uncertainty factors influenced on the overall calculations (e.g. volume size and breakdown time) are taken into account by using probability functions and multiple replication runs of the simulation model.
Figure 9 illustrates examples of motion profiles used for OP900. Figure 9(a) shows a linear movement of a conveyor carrying an engine block on a pallet driven by an electric motor. The motion profile shows the duty cycle of 9 s with their associated torque profile. The torque profile is the combination of accelerating, constant torques and the inertia of the pallet and the engine (shown as negative torque on the diagram) applied in this motion. The motion type is trapezoidal, having acceleration for ta seconds and deceleration for td seconds. The acceleration and velocity of the motor is taken into the simulation model, in addition to the torque and the inertia of the pallet and the engine block. Similarly, Figure 9(b) depicts motion profiles for an electric rotary table with a pneumatic clamping mechanism. For the pneumatic actuators, the amount of compressed air and volume of air flow are calculated and converted to energy (in W/h unit) and taken into the energy calculation equation for this type of drive.
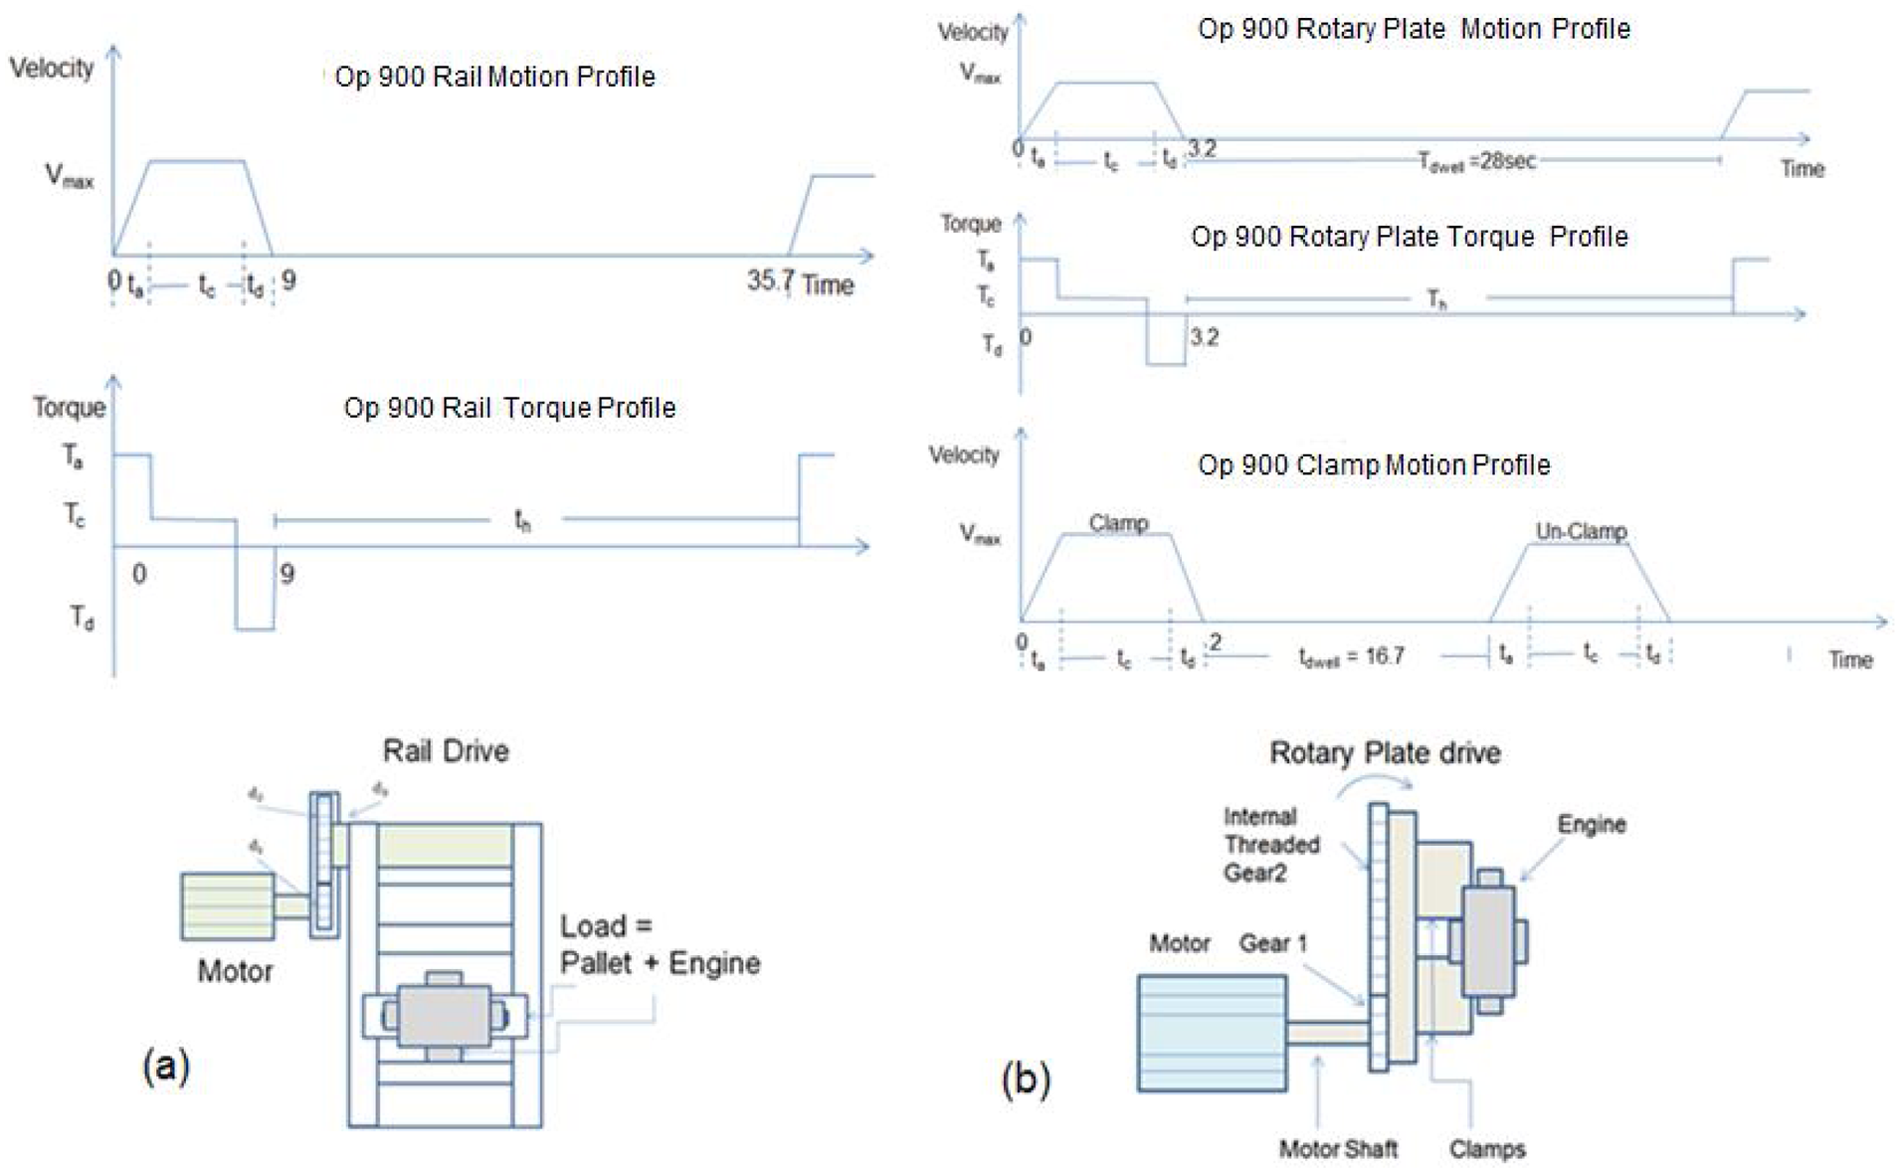
Motion profiles for electric rail motion, rotary table and pneumatic clamping.
Further example of the motion profiles embedded into the simulation model is illustrated by Figure 10. Figure 10(a) shows the engine’s lifting and turning mechanisms. This motion has four positioning states, as indicated in the lift motion profile. The gravitational forces at each state are also embedded into the formulation and the deceleration forces are represented as negative torque (see the torque diagram). Figure 10(b) shows the motion profiles for the mechanical pin stops (typically solenoid pins) and nut-runner devices. The triangular motion profiles represent a two-state motion for these actuators.
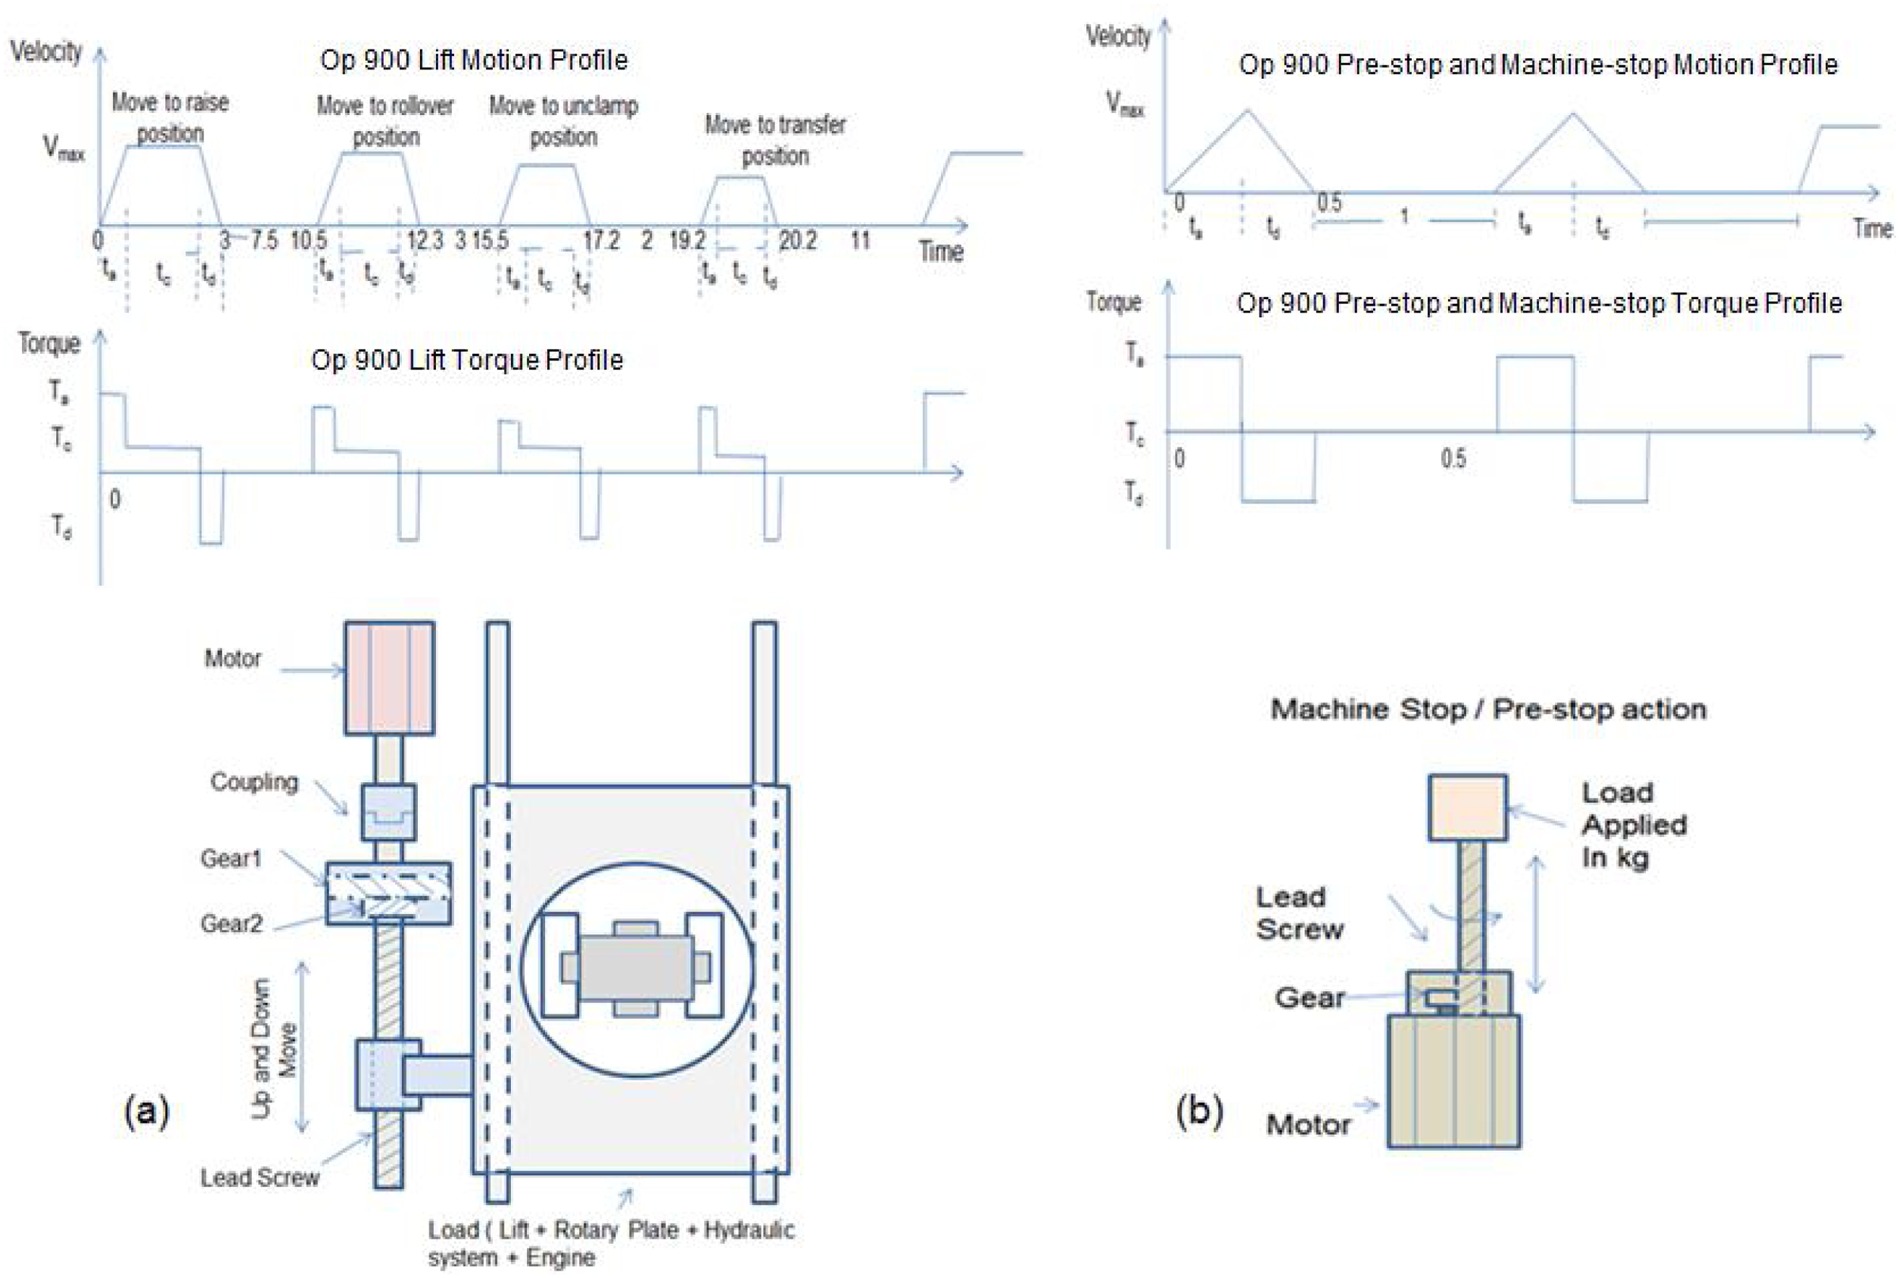
Motion profiles for lift mechanism and pre-stop processes.
Implementation results
The production line in this case study was designed for a nominal production rate of 800 engine blocks per shift. (Owing to the commercial sensitivity of data used in this research, only demonstrative figures are used in this article.) However in reality, the rate typically fluctuates based on changes in business targets, breakdowns and other production priorities.
It is customary in this industry to modify the overall cycle time to meet the new production rate. This is possible mainly in fully automated lines by speeding up (or down) the drives. In a conventional production line design, change in cycle time is an experimental process. However, in a VE-based line design, e.g. using CCE tools, the cycle times at a component level can be consistently modified by multiplying a ‘speed’ factor. This modification is applicable to certain component cycle times (e.g. components with motors) and will not have an effect on simple actuators, such as solenoid stop pins.
The simulation model was run for the OP900 station for two different production scenarios. Initially the nominal production rate was used and shift time and station cycle time were varied to obtain the optimum energy consumption. The simulation model was run with 10 replications and breakdown/repair times were calculated based on a negative exponential function. Following the first experiment, a what-if scenario was applied to understand the impact of change in the production rate on determining the optimum energy consumption. For example, if demand increases to 1000 engine block per day, which production strategy is more energy efficient; (a) reducing cycle time, or (b) extended shift pattern? If the required volume is reduced to 600, would it be more efficient in terms of energy usage to reduce the speed and fit the volume in one 8 h shift (i.e. by extending cycle time)?
Table 2 illustrates the results of simulation runs with various production parameters. For this experiment the model was run for production rates of between 400 and 1200, with variable shift patterns and cycle times, to obtain optimum a condition for energy usage per engine block. According to Table 2, a nominal production rate of 800 engine blocks in an 8-hour shift pattern will result in an optimum cycle time of 36 s and use of 4.666 W/h energy per engine block.
Energy consumptions for station OP900.
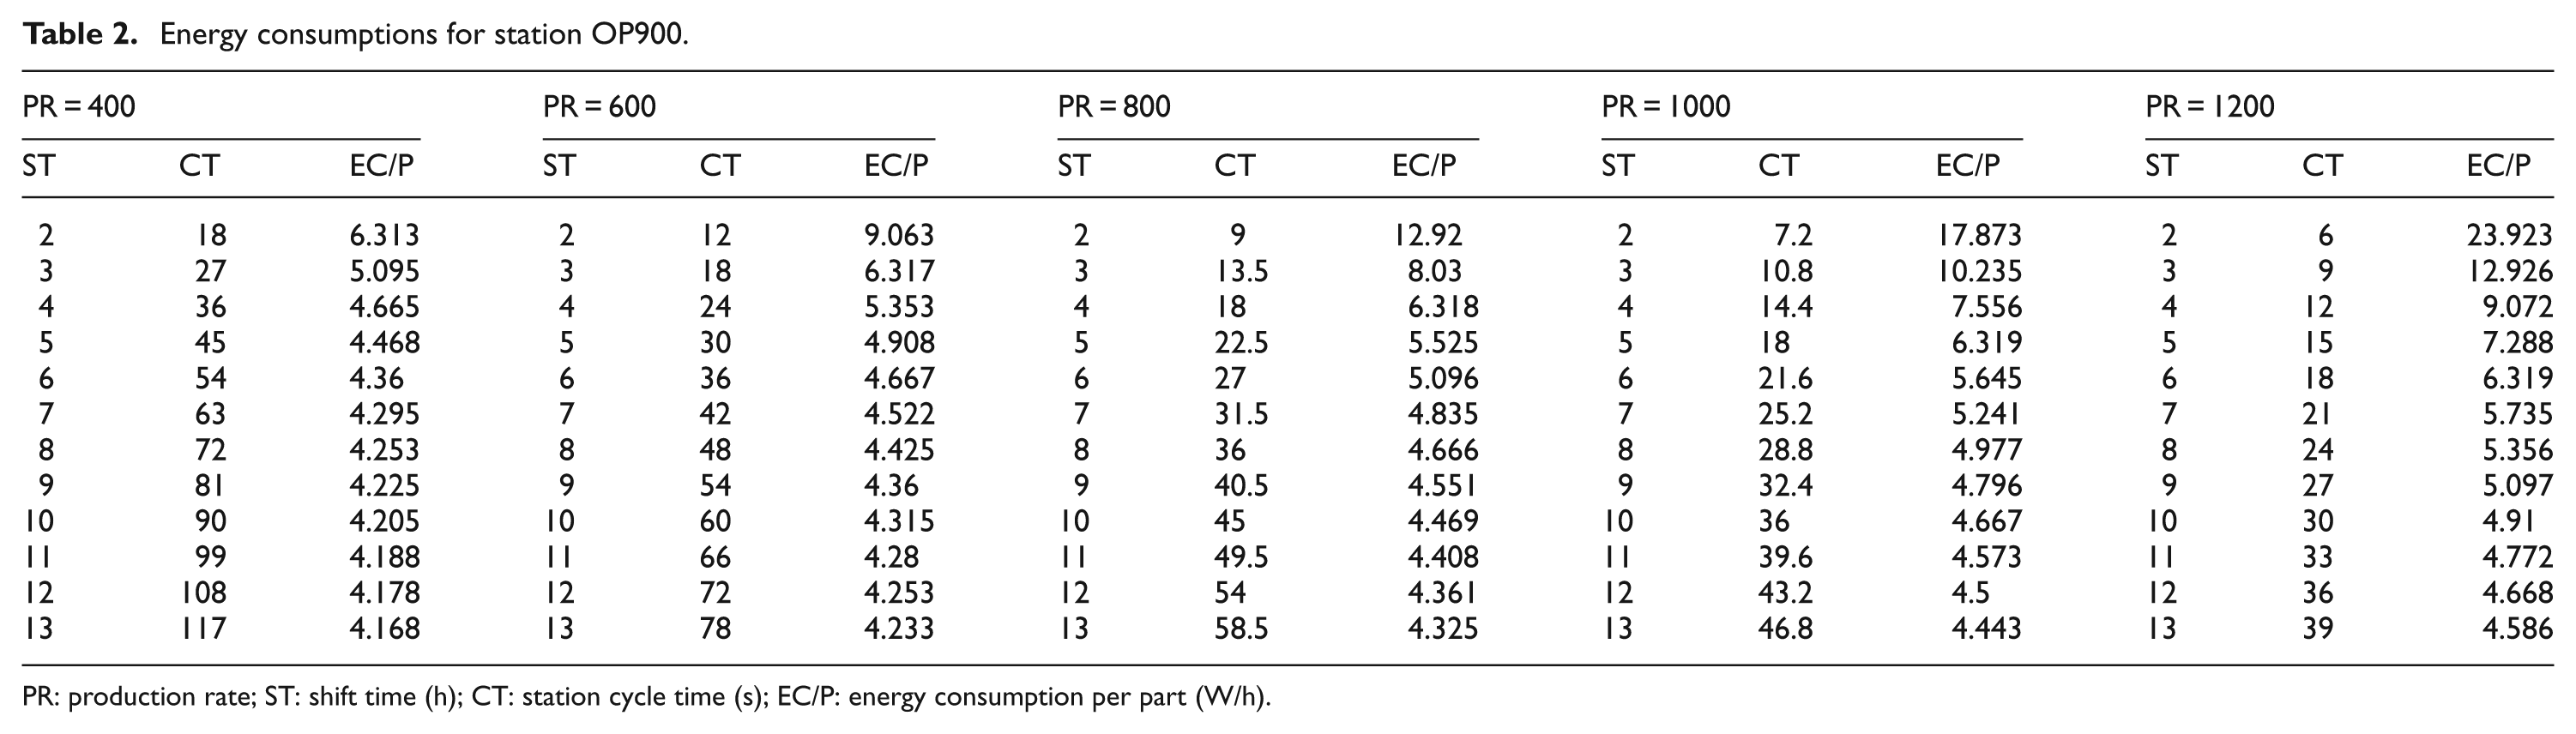
PR: production rate; ST: shift time (h); CT: station cycle time (s); EC/P: energy consumption per part (W/h).
When each set of simulation results is drawn in a graph similar to the one shown by Figure 11, they indicate that reducing the cycle time has an exponential impact on the energy consumption. The diagram shows a certain range in which the cycle time should be altered to optimise the energy usage. A much shorter cycle time will lead in a very high use of energy and a longer cycle time will have no significant impact on the energy usage. This range for the OP900 station is in the region of 20–45 seconds, depending on the production rate. Clearly this range will change for different stations based on the numbers and types of motors and actuators within the station.
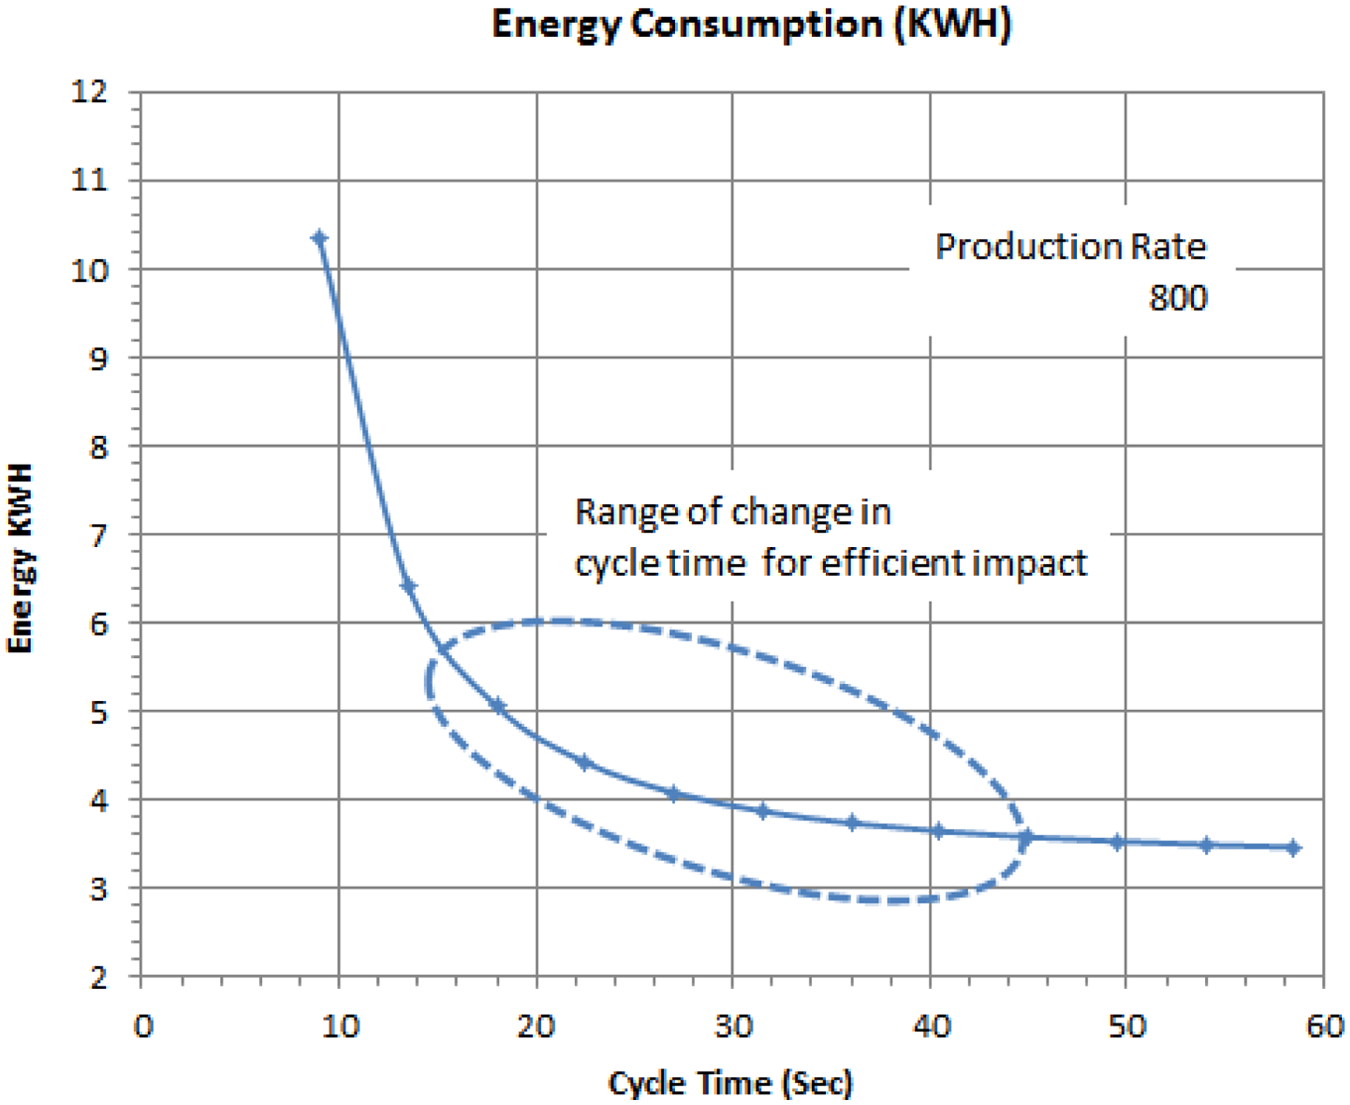
Energy used versus cycle time at the nominal production rate.
In this case study, it was demonstrated that if the nominal rate is changed to an examplary volume of 600 engines per day, increasing station cycle time from a nominal value of 35.7 s to 42 s will fit the volume in an 8-h working shift and will result in a 3% energy saving for this station. However, if the demands increases to produce 1000 engine blocks in the same shift pattern, the energy usage increases by 6.5%, whereas producing same volume in a 10-h shift will require the same amount of energy per part at the nominal production rate. It is envisaged that the optimisation of the energy consumption may have cost ramifications and feasibility issues on the overall system performances. Therefore, it is important to consider the other factors such as cost of operators when studying the business aspects of the optimisation. However, the primary focus of this article is to study the impact of optimisation on energy consumption.
Validation Process
To evaluate the reliability of the modelling development processes and the modelling results for energy consumption two methods were used. Firstly, the theoretical methods were deployed and consultation with domain experts was carried out. These include multiple simulation of the same case study, running what-if scenarios of cases with known results, constant feedback from industrial collaborators while developing the models and comparing the results with the historic data collected from previous industrial projects. Secondly, an experimental method was used. During the development of this study, the CCE virtual tool was also being tested within the collaborator site. Therefor the authors had a unique opportunity to implement the modelling results based on a real case study, i.e. OP900 station. During the assembly and installation of this station a temporary data collecting mechanism was used by the manufacturer to monitor a number of operational parameters including the power used for the overall station (using a standard watt metre). This information was compared against the VDSim results. The results gathered from the model in comparison with the physical systems showed around 7% deviation from the actual data extracted from station. This could be due to a number of practical issues such as frictions (which is largely estimated in the simulation models). However, when cycle time was changed based on the modelling prediction, the change in the energy consumption complies with the predicted modelling results, indicating acceptable 1.5% deviation.
Conclusions
Ever increasing cost of energy and environmental obligations have triggered a global effort to understand and measure energy consumption associated with detailed engineering operations. In this article the potential benefits of implementing a VE environment and DES methods at the early design stage of the powertrain industrial sector were discussed and its ability to analyse detailed energy monitoring was reported.
A current research study by the authors, titled the VDSim approach, integrating VE and DES methods, was also explained. In addition, the application of the proposed integration approach in predicting and monitoring energy consumptions of manufacturing and assembly production lines at device levels was detailed.
It was discussed that, as a result of proposed integration, detailed information about production engineering systems developed by VE tools are made available to the simulation models at an early stage of the engineering life cycle. Therefore, early prediction of the actual production parameters based on the VE data, such as cycle times, utilisation of resources and energy consumptions, are made possible.
The proposed approach was tested in an industrial case study of an assembly production line for an automobile engine block. The detailed design of the station’s components was developed in a VE environment, and the device-level operational parameters, such as drive and motion types, were imported to the simulation model through the VDSim tools. The model was run repeatedly for a selection of variables, including production rates, cycle times and shift patterns, to identify the optimum production parameters by which minimum energy consumption per engine block can be obtained.
Based on the results of the case study, it has become evident that the application of the VDSim approach for energy analyses provides a decision-making support tool to have an insight into the energy costs variation as a result of changing production parameters. The result shows the impact of changing a components cycle time on the overall energy consumption at an assembly line. In addition, it demonstrates the relation between the length of a production shift and the production rate on the energy usage. A follow-up research work is planned to extend the VDSim concept to the complete line rather than one station, in order to understand the impact of station changes on the other stations (for instance by changing cycle time, one station may starve momentarily or require temporary queue/buffer).
This research was concentrated on the production parameters directly related to the energy usage. However, further research is planned to include other industrial cost factors, such as cost of extending working shifts into the model to provide a more accurate prediction of energy optimisation.
Footnotes
Acknowledgements
The authors would like to thank Ford Motor Company, UK, for their support for this study.
Funding
This research received no specific grant from any funding agency in the public, commercial, or not-for-profit sectors.