
Abstract
Structural details and components in many types of products are continuously subjected to variable amplitude loading during operation. Fatigue loading and fatigue damage is thus the most common failure mode for the mentioned equipment in operation. The influence of the material grade, weld quality and fabrication procedure have a major impact on the structural durability of welded vehicle structures. The comprehensive research work within the Nordic research and development community have contained development of finite element modelling of complex structures, including crack growth in two- and three-dimensional fatigue testing of welded small-scale specimen and full-scale components, investigations of weld defects and flaws (e.g. cold laps) and weld roots. An important part of these projects is related to simulation and measurements of formation and relaxation of residual stresses. Within these projects three new quality systems, for welded and cast components and for cut edges, have been developed based on a scientific ground and a fitness for purpose design philosophy. Volvos new weld class system, which is an open standard, is now a base for the revision of the international weld quality system ISO 5817. In this article the major findings in these research activities are briefly presented and discussed.
Introduction
Load-carrying structures and components in construction machineries, cranes, forest machines, mining equipment, transport vehicles and agricultural equipment are often complex welded steel or cast constructions. A total of 60–75% of the structural weight is manufactured in steel with yield strength below 400 MPa and the structures are welded together and the total weld length could be over 100 m. The production is highly robotized, although several critical points are still manually welded owing to lack of precision of the welding robot, especially around corners. In some parts inserts with more high strength steel or cast steel are introduced, especially at points with high local loads. Weld improvement methods are used in a low scale owing to short-sighted cost reasons. Nodular cast iron is used in the load-carrying system as axle and transmission housings, axle bridges and linkages. The cast components can be large, weighting up to 500 kg, and may contain defects in critical areas. Non Destructive Testing (NDT) are normally only performed as sample testing, so the fatigue design has to be based on Stress/Number of cycles to failure (SN) curves for different defect levels depending on the requirements from design.
The fatigue life of welded joints shows a great scatter owing to variation of stress concentration, size and location of defects, different residual stress distributions, relaxation of residual stress fields during operation and influence from blasting, before painting. 1 The introduction of weld improvement methods often move the failure location to the weld root, which requires the introduction of NDT to estimate the lack of penetration of the weld. Fatigue life of cast structures also show a great scatter owing to location and size of cast defects, variation in residual stress and influence from the intensive blasting after casting. Thus fatigue properties in welded and cast structures are, in general, controlled by other properties than materials data, that is, the manufacturing processes have a dominating influence of the choice of material. Table 1 shows fatigue strength for different manufacturing processes, which show that a welded joint can have a fatigue strength of 15% in comparison with a machined component with the same material. The life for the machined component can be increased with high strength material combined with some adjustment on surface roughness. For a welded component, the fatigue strength will be the same for high-strength steel without improvement of the welded joints.
Fatigue properties of vehicle components manufactured by different methods.
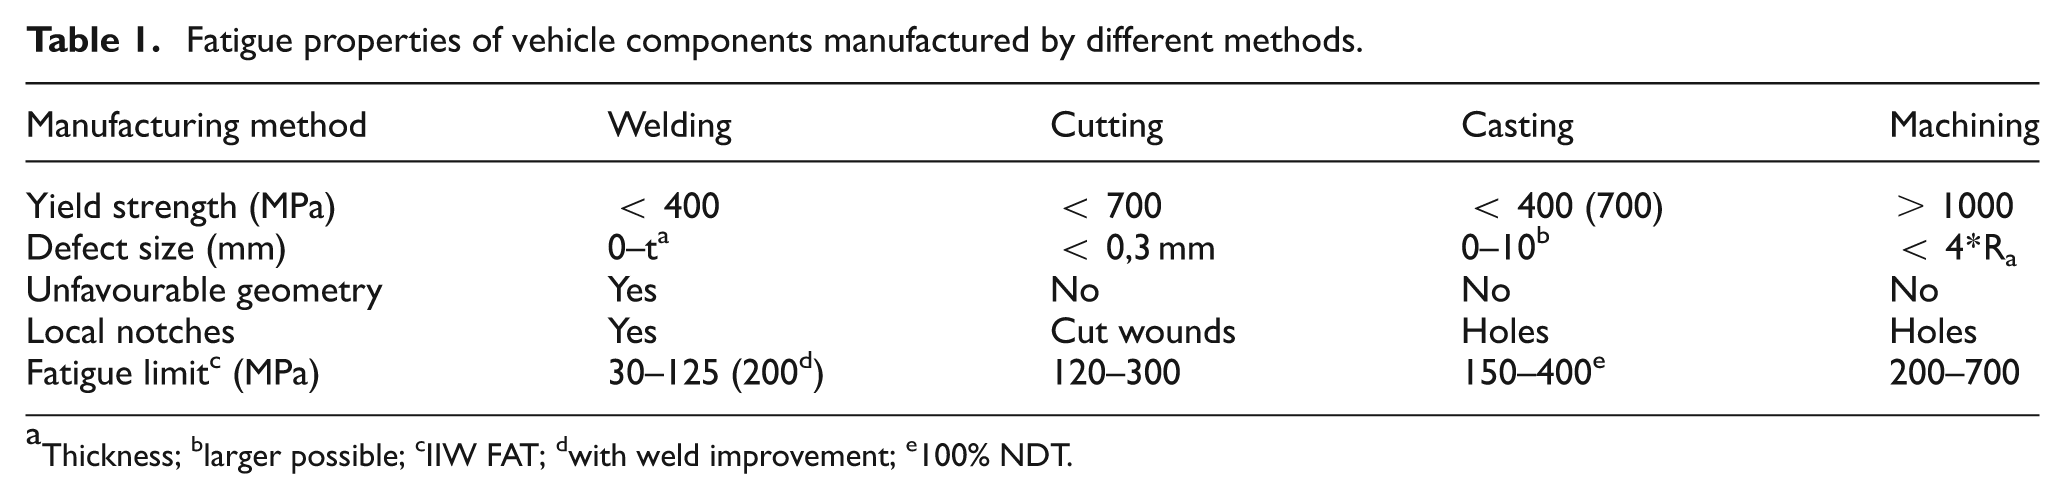
Thickness; blarger possible; cIIW FAT; dwith weld improvement; e100% NDT.
Structural details and components in many types of products are continuously subjected to variable amplitude loading during operation. Typical significant load ranges in operation lie between 1000–20000 cycles per hour for many types of vehicles and machineries. During an economic life of about 10,000–25,000 h operation, such structures will sustain 10–500 million significant load ranges. The type and toughness of load time history varies in different types of structures, within a structure, type of operation and between different drivers. For ground vehicles, such as trucks and articulated haulers, the load time history is mainly dependent on the weight of the load, speed and the road or track condition. For excavators, wheel loaders and some types of lifting cranes, the maximum loads are regulated by the relief and shock valves in the hydraulic lifting systems, and maximum/extreme loads are created frequently during operations. The operators (drivers) also have an in influence of loads, but at least the relief valve pressure will be reached in every working cycle. In blasted rock handling or in severe ground condition the chock valve pressure level will also be reached frequently.
The load time history is normally presented as a rain flow count, or more frequently as a range pair exceedance count, as a base for life calculations. Figure 1 shows examples of three types of design load time histories that represent different type of structures or operations. Curve 1 (C1) represents normal cars, buses, trucks, trains, small construction machineries and standard cranes where the extreme loads are very few during life. Curve 2 (C2) represents heavy-duty trucks, articulated haulers, graders and trains at bad track conditions where extreme loads are more frequent. Curve 3 (C3) illustrates typical conditions for excavators, wheel loaders, forest cranes, rally cars and proving grounds (for cars, trucks and haulers).
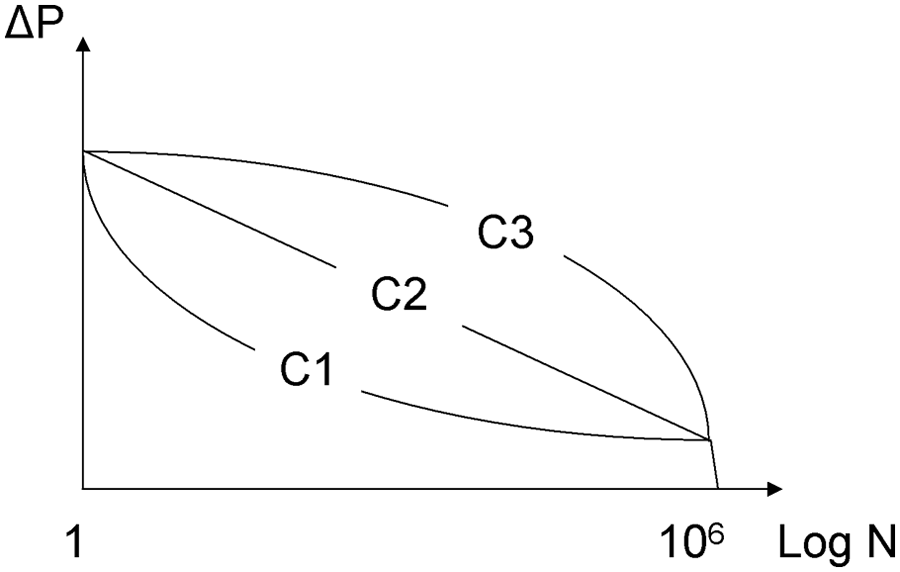
Different types of load time histories.
The life relation between these three load spectras calculated with slope three (welded structures) and the same SN curve gives an approximate life relation of 1/6/15 and C3 has the shortest life and C1 longest. If we require the same life with these three load time histories, the fatigue strength (at 2 million cycles) has to be increased by 1.8 for C2 and by 2.5 for C3. The load time histories are thus, in general, more severe for construction machineries and some types of cranes compared with trucks and cars. The yearly production number of construction machinery and cranes are generally much lower than for cars and trucks, and the cost of design, manufacturing and marketing must be carried by just 200–3000 units per year for one type of machinery from the major suppliers. But on the other hand, the owner lives from the income based on the productivity and reliability of the machinery. To produce products with as low a Life Cycle Cost (LCC) as possible is a challenge to all manufacturers and there is a need to reduce fuel consumption and reduce weight of such products.
Owing to cost reasons, high quality requirements on welded joints are seldom used, which limits the introduction of more high-strength steel and many welded components are 20–40% heavier than what is possible. Furthermore, there is lack of resources and competence within production units, which further reduces the possibility of introducing a higher quality in serial production. One important reason for the slow introduction of more high-strength material is that the quality requirements for welded structures as ISO 5817 and Volvos old system have no, or limited, scientific ground, and thus, not relevant for fatigue design. For cast material the situation is even worse because there are no internationally agreed quality requirements for fatigue design. Today there is an internal Volvo standard for cast material that connects cast defects with fatigue design.
Nordic research
Since 1989, Nordic industries, research organizations and universities have co-operated in numerous projects related to the design and fabrication of welded structures. The first project focused on the fatigue behaviour of welded structures during spectrum loading in corrosive environments. 2 The major findings in this project included observations of the relaxation of welding-induced residual stresses during spectrum loading and the documentation of the most frequent weld defect for high-speed welding operations, i.e. cold lap weld defects. The second project started in 1994 and included investigations of high-speed welding processes, weld improvement methods, finite element analysis (FEA), structural optimization and component testing. Major findings in this project included systematic studies of cold lap formation owing to different manufacturing processes and the influence of manufacturing quality on the fatigue strength of different welded joints and cut edges. 3
The third Nordic project ‘Finite element design 2000 – improved usage of high-strength steel by an effective FE-based design methodology for fatigue loaded complex welded structures’ started 1999. 4 In this project alternate fatigue design and assessment methods were compared with respect to modelling effort and accuracy and the application of fatigue crack growth simulations for complex welded structures. 5 The first analysis of current weld quality systems, EN-25817 and Volvo Standard (STD), was started indicating that the relation between acceptance limits and fatigue strength was weak, or in many cases none existing. The forth Nordic project ‘GD-2005 – design, quality and ndt for fatigue loaded cast components’, was started 2001. 6 The main objective of the project was to improve the reliability and reduce time and effort to design complex fatigue-loaded cast structures by developing design guidelines, quality rules and cost-effective NDT systems. Within this project, advanced modelling of cracks in cast components was developed, and the ground for the current quality and design rules for cast components within Volvo was established.
The fifth Nordic project was ‘QFAB – quality and cost of fabricated advanced welded structures’. 7 In this project several welding procedures were investigated and modelling of residual stresses was developed. The final research work with the Weld Quality standard was also performed within this project. 8 After this project an overview report was written, 9 which contains references to 70 scientific reports produced within Quality and cost of Fabricated advanced welded structures (QFAB). During the QFAB project a national technology platform for lightweight optimized welded structures (LOST) was started. 10 In this project, earlier experiences from the Nordic projects were combined with knowledge from the International Institute of Welding (IIW) and a great number of new investigations related to the development and manufacturing of lightweight welded structures. The following major conclusion can be stated.
The welding position (PA, PB) may affect fatigue in a negative way.
It is still difficult to find a reliable NDT method for detecting cold lap weld defects.
A new weld class system is developed and it will affect the international system ISO 5817.
Investigated commercial systems for NDE of welds do not have an industrially acceptable level.
Results from fatigue testing shows that modern cutting methods increase the fatigue strength of cut edges in high-strength steel in comparison with current design codes.
Simulation routines have been developed in Finite Element Method (FEM) for the prediction of generic residual stress distributions in welded joints usually used within the industry.
Fatigue testing of test coupons, welded with different welding processes, shows that these have an influence on the weld defect occurrence, stress concentration and the fatigue strength.
The results from the Nordic projects have been continuously presented and discussed within the IIW and influenced IIW design rules, best practice documents and the coming revision of ISO 5817.11,12
Fatigue design methods for welded structures
The fatigue phenomenon and progressive damage owing to cyclic loading is governed by local quantities (defects, flaws, stress concentrations, etc.) and in order to develop proper design methods they need to be based on local approaches. Today there are four main methods to predict fatigue on welded components and they are defined in IIW fatigue design recommendations; 13 nominal stress approach, structural/geometrical ‘hot-spot’ stress approach, effective notch stress approach and linear elastic fracture mechanical crack growth approach.
Fatigue resistance of complex welded components based on stress analysis performed with FEA can be assessed in many different ways with varying degrees of time consumption and accuracy. A large model will increase both the model preparation and the computational time. Large and complex FEA models may include several critical locations and complex boundary conditions, see example in Figure 2(a) where the stress value is continually changing. Nominal stress values are, in this case, difficult or impossible to define. Even if a nominal stress can be defined, one must select from a catalogue of details, the geometry most closely resembling the actual welded detail. In many cases the actual weld has little similarity to one of the geometries shown in the standard. A schematic overview of complexity and work effort for different design methods are presented in Figure 2(b).
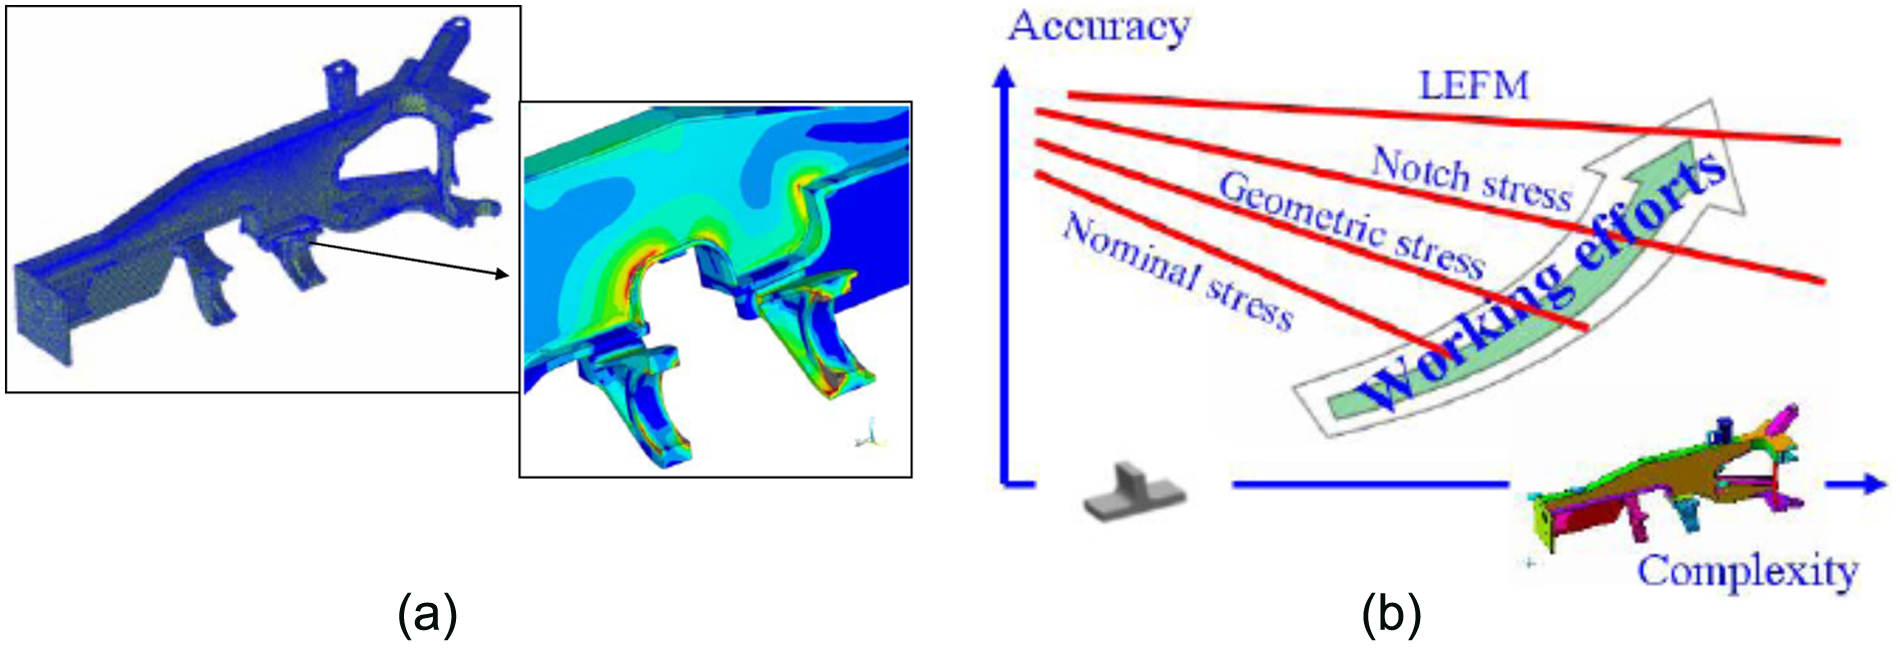
(a) Stresses in a construction machinery frame, near the attachment of the axle housing. (b) Schematic overview of accuracy, complexity and work effort associated with the different fatigue assessment methods for welded structures
One of the first research areas studied at Volvo VCE in the 1980–1990s for welds was the method used when analysing the welds. At that time the dominant way was the nominal stress method. The nominal approach often focuses on the weld-toe side, neglecting the weld root, where a design crack can often be found owing to lack of penetration. If penetration is small, or even zero, the crack size is of the same magnitude as the thickness of the attached plate.
From a more principle point of view, one can get an understanding of why nominal methods do not work well by realizing that fatigue in welds is more or less only a matter of the local geometry, which is considered in the local-based approaches and where the weld-root side is also considered.
Residual stresses in welded structures
Residual stresses are always present in welded joints that affect fatigue life and should be included in the fatigue life prediction. Figure 3(a) shows the residual stress distribution in a welded joint. In this case the residual stresses are 300 and 200 MPa at the toe and –100 and –300 MPa at the weld roots. In this particular case the planned production procedure was to apply stress releasing, which was rejected after these results. The results were also confirmed by fatigue testing of both welded and stress relieved versions, as the welded specimens showed significantly higher fatigue strength owing to the compressive residual stresses at the weld root. It is important to quantify the residual stresses and their relaxation owing to cyclic loading and subsequent crack propagation in order to incorporate them in fatigue life predictions. At present, no cost effective measurement method exists for estimating welding residual stresses by experiments. Hence, simplified finite element welding simulation routines have been developed for residual stress prediction and incorporation in fatigue life analysis and crack growth analysis.10,14 Figure 3(b) shows an example of fatigue life predictions of welded structures, where residual stresses have been incorporated in the analysis. The influence of residual stresses depends on the local weld geometry and the material grade, which are important features in the evaluation of high quality welds where the weld root is critical.
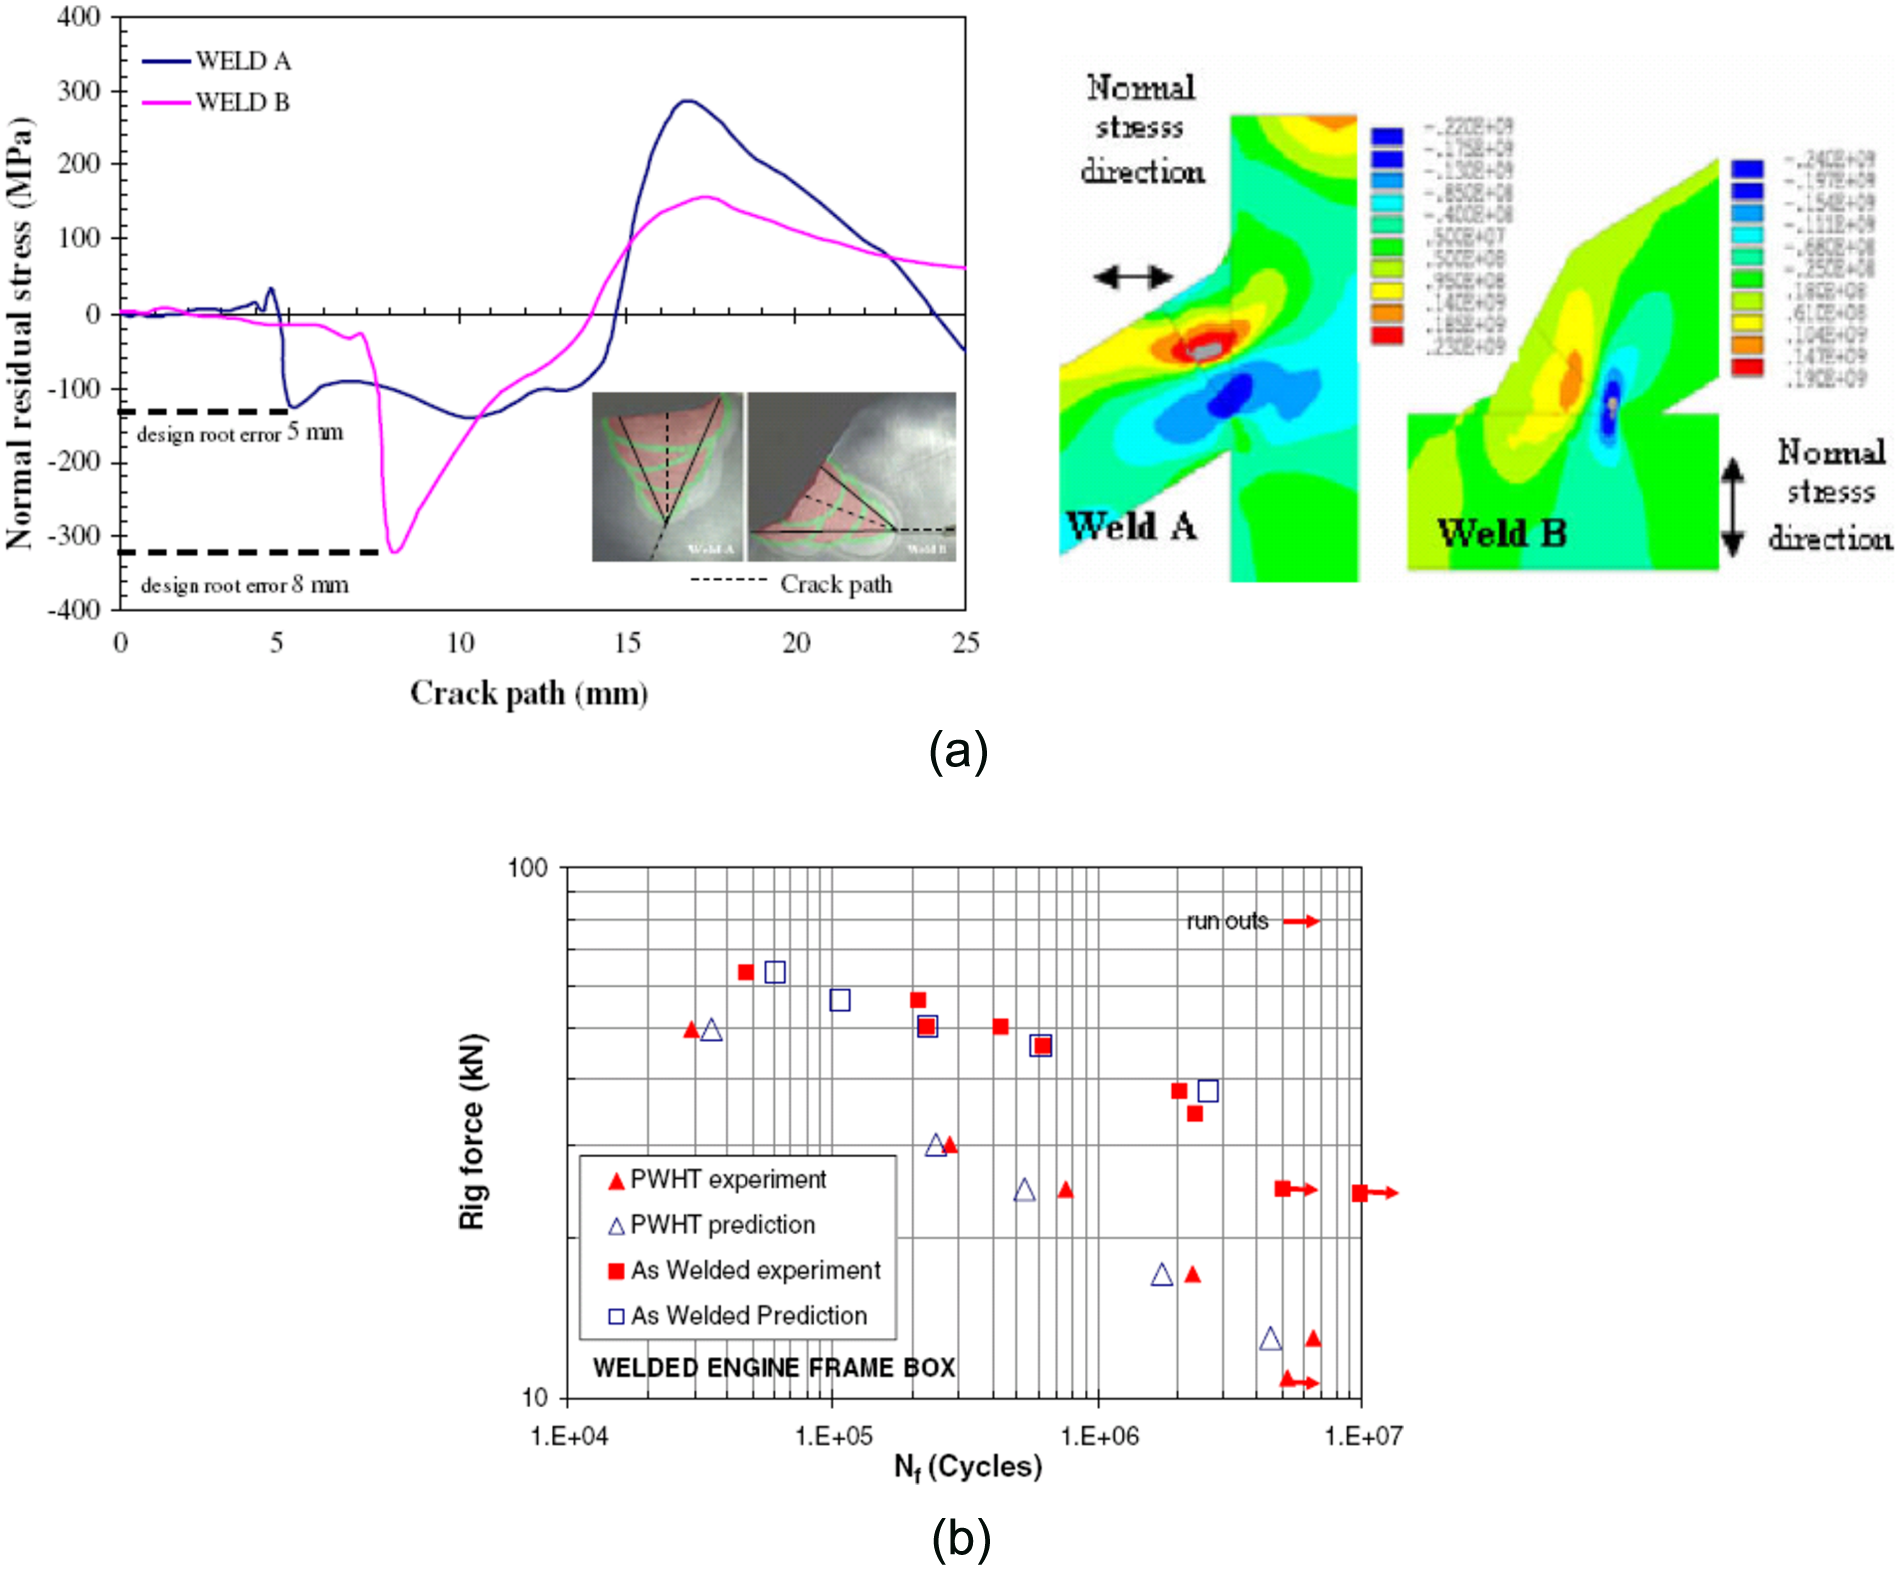
(a) Predicted residual stresses along the root and trough the weld in the normal direction of the assumed crack path. (b) Comparison between testing and prediction of fatigue life where residual stresses have been incorporated.
Welding residual stresses are difficult to measure at the weld root. However, simulations of fillet and butt welds show compressive residual stresses at the weld root at a magnitude of yield strength of the base material in mild strength steels for multi-pass welds. 10 Barsoum 14 showed that the residual stresses at the root side depend on the weld penetration and number of weld passes, where an increase of the compressive residual stresses where observed with an increased weld penetration and number of weld passes. However, the final residual stress at the weld-root side for multi-pass welding also depends on the inter-pass time.
Weld quality
When welding in steel, the general recommendation in norms and regulations is that the material grade has little or no importance for fatigue. The reason behind this is that defects are common in welds and these determine the fatigue life. Support for this can be found, for example, in the Kitagawa diagram, see Figure 4.
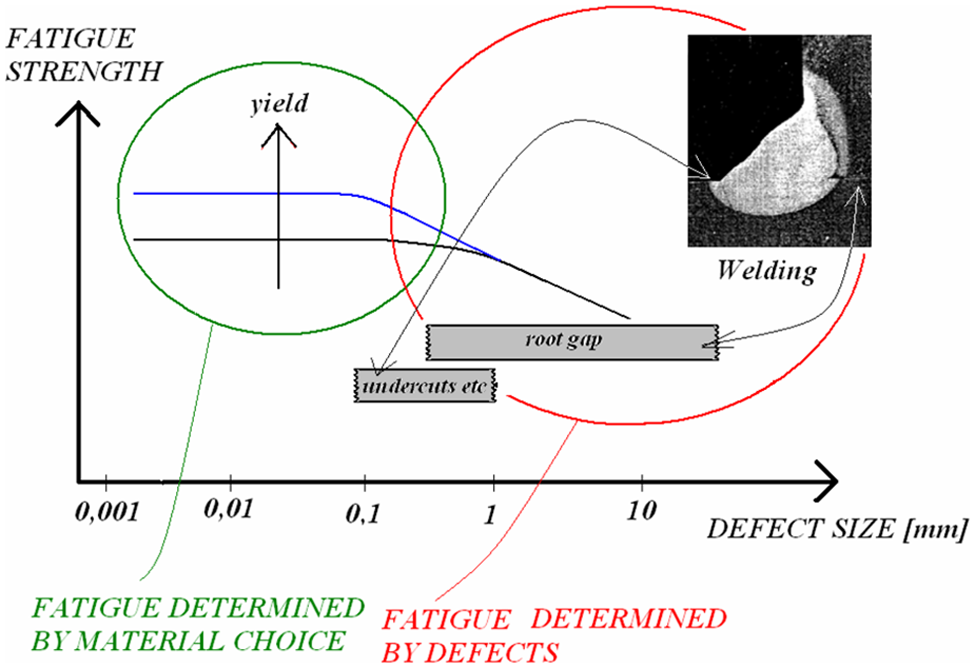
The Kitigawa diagram, fatigue strength versus defect size, with indicated weld positions.
Since defects, imperfections and other types of irregularities are common in welds, it becomes important to have rules and acceptance criteria for them. The weld class system describes many kinds of imperfections and states the acceptance limits for different levels of quality, e.g. ISO 5817 having the classes D, C and B. However, current rules given in this system show a week relation to fatigue, this has been proven in different investigations, see Figure 5.8,12 Consequently, if a designer uses this system and tries to reduce the weight of a load-carrying structure and optimize plate thicknesses along with the weld geometry for fatigue, they meets the problem of how to decide the appropriate quality expressed as the weld class level.
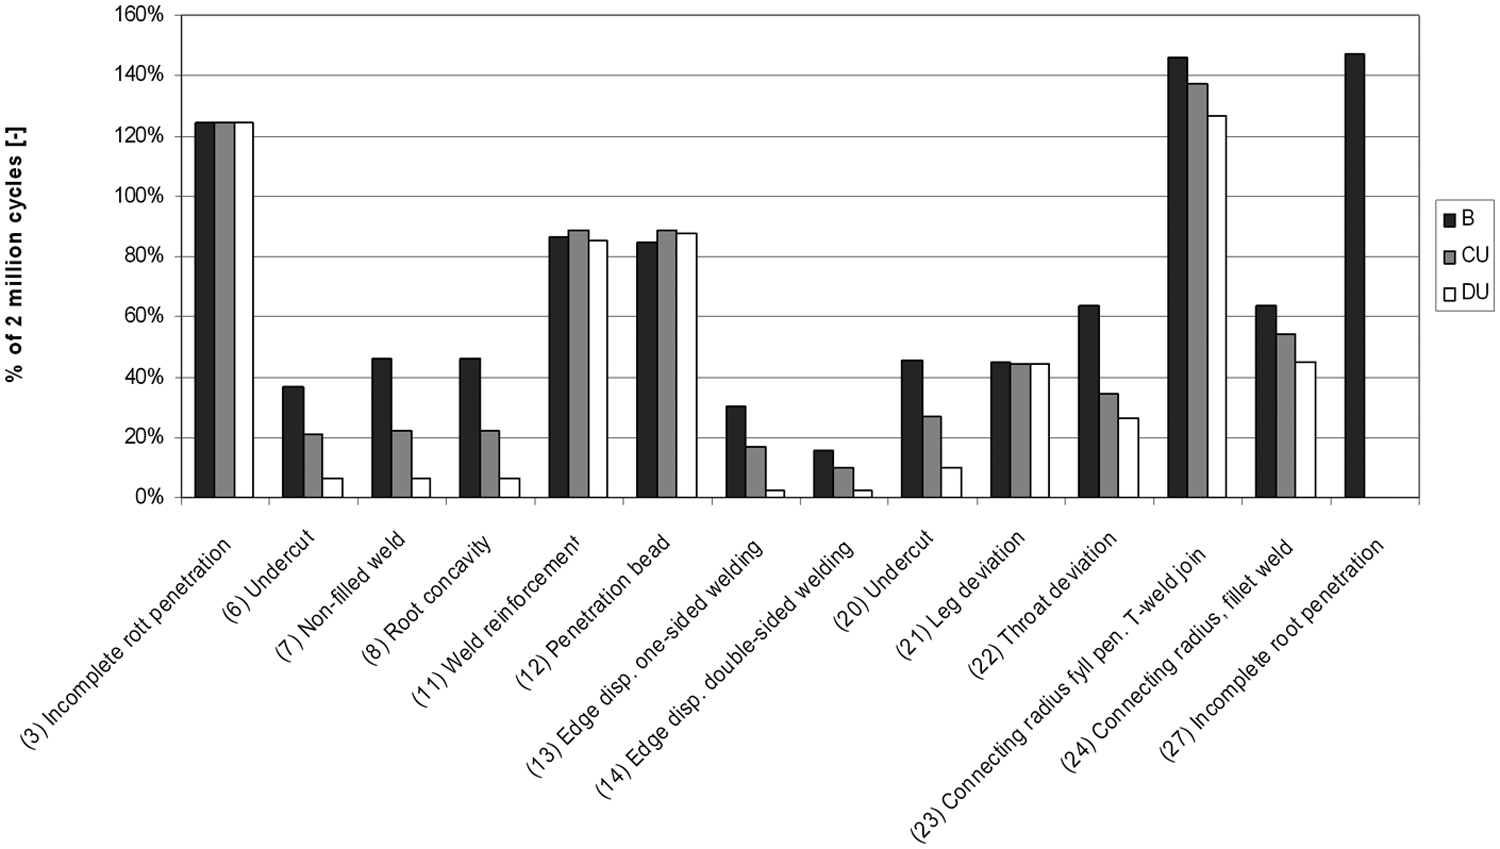
Fatigue life as function of imperfection types and weld classes.
Within QFAB and the technology platform ‘LOST’, studies were carried out on the relation between weld classes and fatigue. It was found that the correlation between imperfection levels and fatigue in the old weld class systems was low, see Figure 5. Later this resulted in the birth of a new weld class system, STD 181-0004. 11 The principle used in this system was ‘design for purpose’, see Figure 6. One weld class was designated as static-loaded welds and three weld class levels with different quality levels were assigned to fatigue-loaded welds. Consider a fatigue-loaded weld and compare with the Figure 6 load direction F1 for a weld requiring full strength with load direction F3, which only creates a stress concentration at the weld toe. The easiest load case, direction Q2, where the weld is of a kind ‘fixating’, only the shear capacity would be affected in a failure.
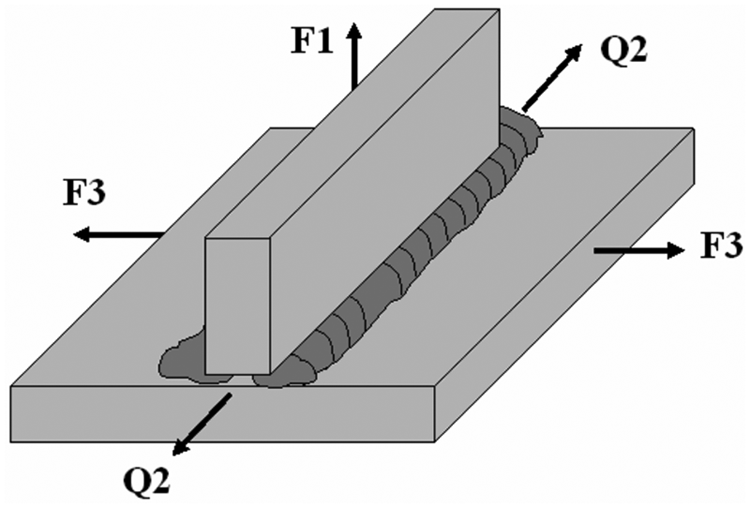
A fillet weld loaded in three directions.
The different weld class levels for fatigue assumes a life difference factor of two (2) between each class, so the designer could make use of this in the analysis and state the appropriate weld class level on the drawing. In this way, a direct connection is created between demands on the drawing (design) and the inspection later after welding (production).
Another important part of the weld is the root side. In the new system the penetration of the weld is determined by analysis and the resulting requirement is put on the drawing, i-size for a fillet weld and s-size for a butt weld, see Figure 7. This makes it possible to put different requirements on the weld-toe side and the weld-root side. One typical example is a non-load-carrying weld compared with a load-carrying weld, where quality requirements can easily switch from the toe side to the root side. 15 Having a quality system for imperfections that is well related to fatigue, the principle of ‘design for purpose’ can be utilized and it is possible to find the appropriate weld quality level for fatigue. Knowing the imperfections is important for fatigue, and focusing on these in production it is consequently possible to find the weld process, WPS, that gives the needed weld quality both on the in-side and the out-side of the weld, i.e. ‘weld for design’.
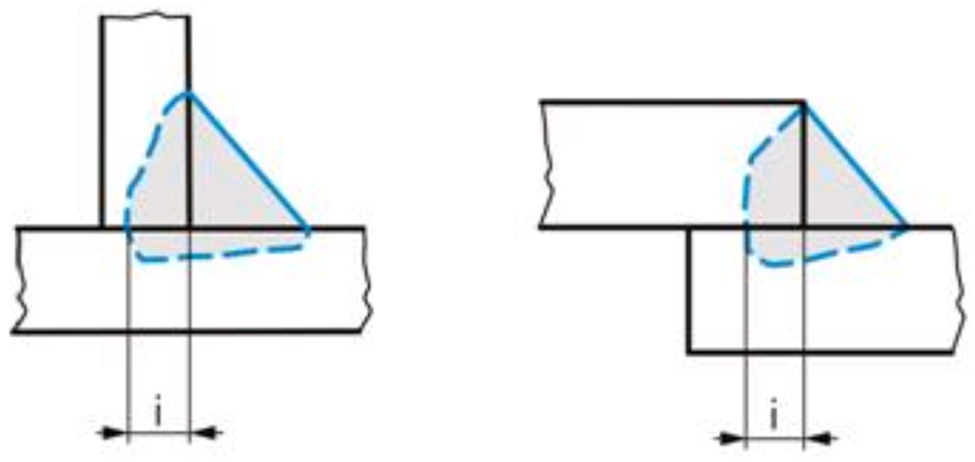
Definition of penetration in a fillet weld, the i-size.
The work regarding welded structures in an industry, from design and analysis to production and inspection, can be described as a cross-functional co-operation between departments. They are supported by this new weld class system since all parties can focus on one common view, where together they can seek the best solution of the weld geometry. This makes it not only possible to search for a lighter structure to increase the machine productivity or strive for a longer product life if this is desired, it can also promote the introduction of high-strength steel maintaining at least the same fatigue life. The old quality system states that ‘a higher material quality is not worth anything in fatigue loaded structures’; this is now out of date!
Fatigue of cast components – quality rules
Fatigue assessment of cast components is somewhat similar to welded structures, as defects of some kind are inevitably present in all castings. Thereby, it is also of great interest to systematize them according to some notation and to predict their impact on the fatigue strength. By combining a classification scheme for typical defects, it is possible to create design quality rules (QR) for general fatigue life assessment of cast components. The idea of QR is to establish a coupling between workmanship and properties. In other words, by controlling the outcome of the workmanship to be within certain limits, the fatigue properties of the product shall be known.
The Kitagawa diagram illustrates in an intuitive manner the characteristic of cast materials (which behaves very similar to welded structures). Figure 8 illustrates the relevance of the Kitagawa diagram. It shows the principal effect of defects of variable sizes. 16
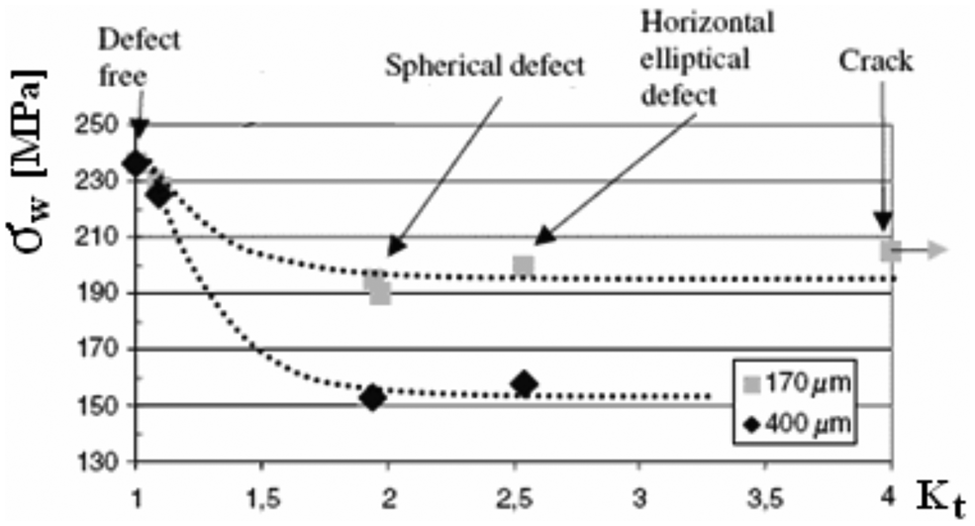
Fatigue limits as function of defect size and shape. Stress concentration factor at the x-axis and nominal stress at the y-axis.
Two zones can be distinguished within the defect population. When the defect is ‘less harmful’, i.e. between K t = 1 (e.g. no defects) and K t ∼ 3, there is a gradual transition of fatigue limit from defect-free material to an asymptotic level that depends on the defect size. Second, for defects that are more malicious, K t > 3, the fatigue limit is more or less constant for a given defect size independent of whether the defect is a three-dimensional formation or a pure crack. The behaviour is as the Kitagawa diagram states, i.e. the fatigue limit depends on defect size. Defects in cast components often show stress concentration factors of above three, which shows that fracture mechanics is preferred for cast components regarding fatigue life assessment. This provides the one component for establishing QR, the other is to have a framework for classification of defects, for example the Swedish standard SS-11 40 60, Founding – spheroidal graphite cast iron – defect classification. 17
The current framework defines a surface zone that is a layer of thickness 0.2 times the local section thickness from the surface (defect class 1, DC1), the rest is defined as interior volume (defect class 3, DC3). Defect class 2 was omitted in this work. All DCs are divided into defect levels (DL). The DLs indicate the size of the defect. Figure 9 illustrates the definition of the defect location.
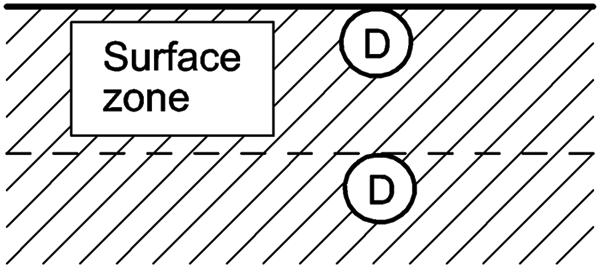
Definition of defect location, showing the most severe location of a defect in the interior volume and in the surface zone.
The work with QR was based on a numerical model utilizing the finite element method. Assumed crack-like defects (DL) were located in an area of the model where the stress gradient could be controlled and altered. A notch radius r was set to 5, 10, 25 and 50 mm, resulting in different stress gradients through the thickness. The local section thickness was set to 10, 25 and 50 mm, respectively. For all combinations of model dimensions, defect sizes (DL) of 1.2, 2.4, 3.4 and 5 mm were introduced in the surface zone as well as within the interior volume, all according to the framework. A series of propagation steps provided data on the (local) stress intensity ΔK(a) as a function of crack length. This function was then used for numerical integration of Paris law over the crack length until critical stress intensity, K 1c , was reached.
In order to define the size of the modelled defect to be used for various shapes of real defects, the square route area approach was utilized. 18 In Figure 10, the nominal defect size was considered as the embracing circle, which implicitly tells us that the true size of the defect (the white area inside the circle) is somewhat smaller. The difference, the shaded area, was assumed to constitute the initial crack area.
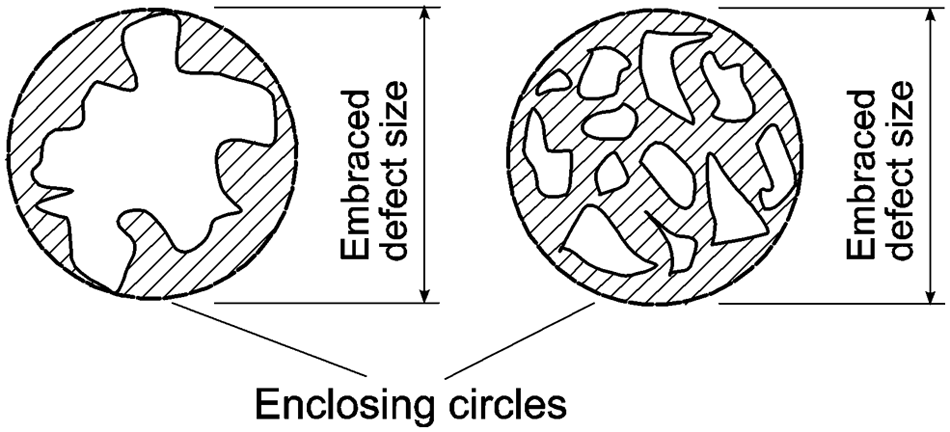
Definition of size for homogeneous and non-homogeneous defects.
In order to make the results more versatile, the capacity measure was introduced. As the capacity includes the governing parameters of curve inclination (m), stress (σ) and number of cycles (N), it is adaptable to all stress and cycle ranges. For further details about the capacity measure see Björkblad. 19 In Figures 11 and 12, results can be seen for two QR example configurations. The impact of stress gradients (quantified here by the stress concentration factor K t ) can be noted, especially for interior defects. For a more detailed description of the QR the reader is referred to Björkblad. 19
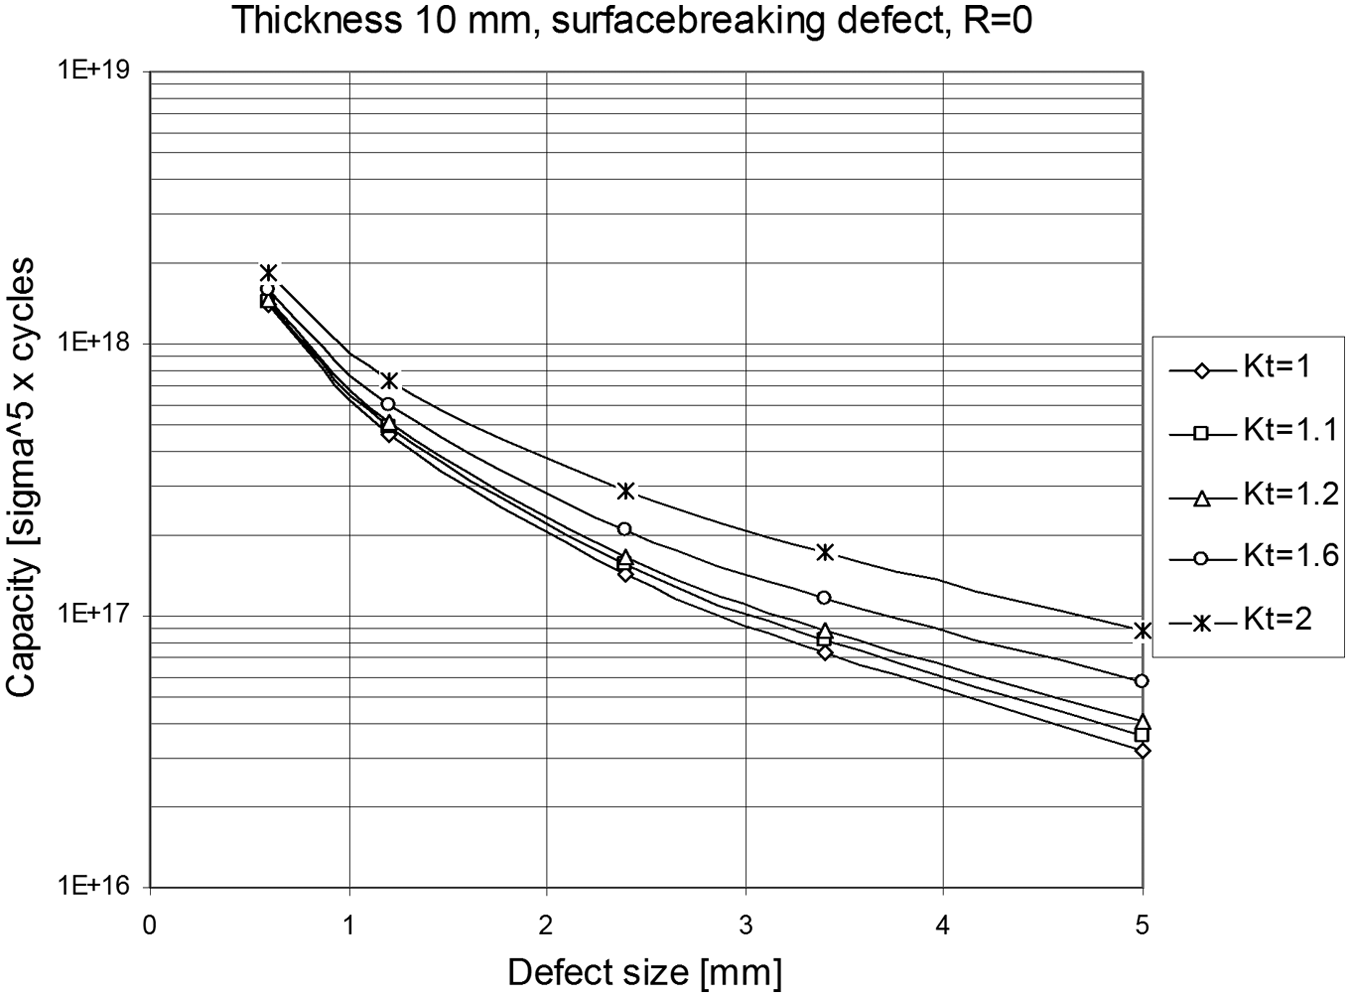
Capacity plot for model with t = 10 mm, surface-breaking defect and K t = 1–2.
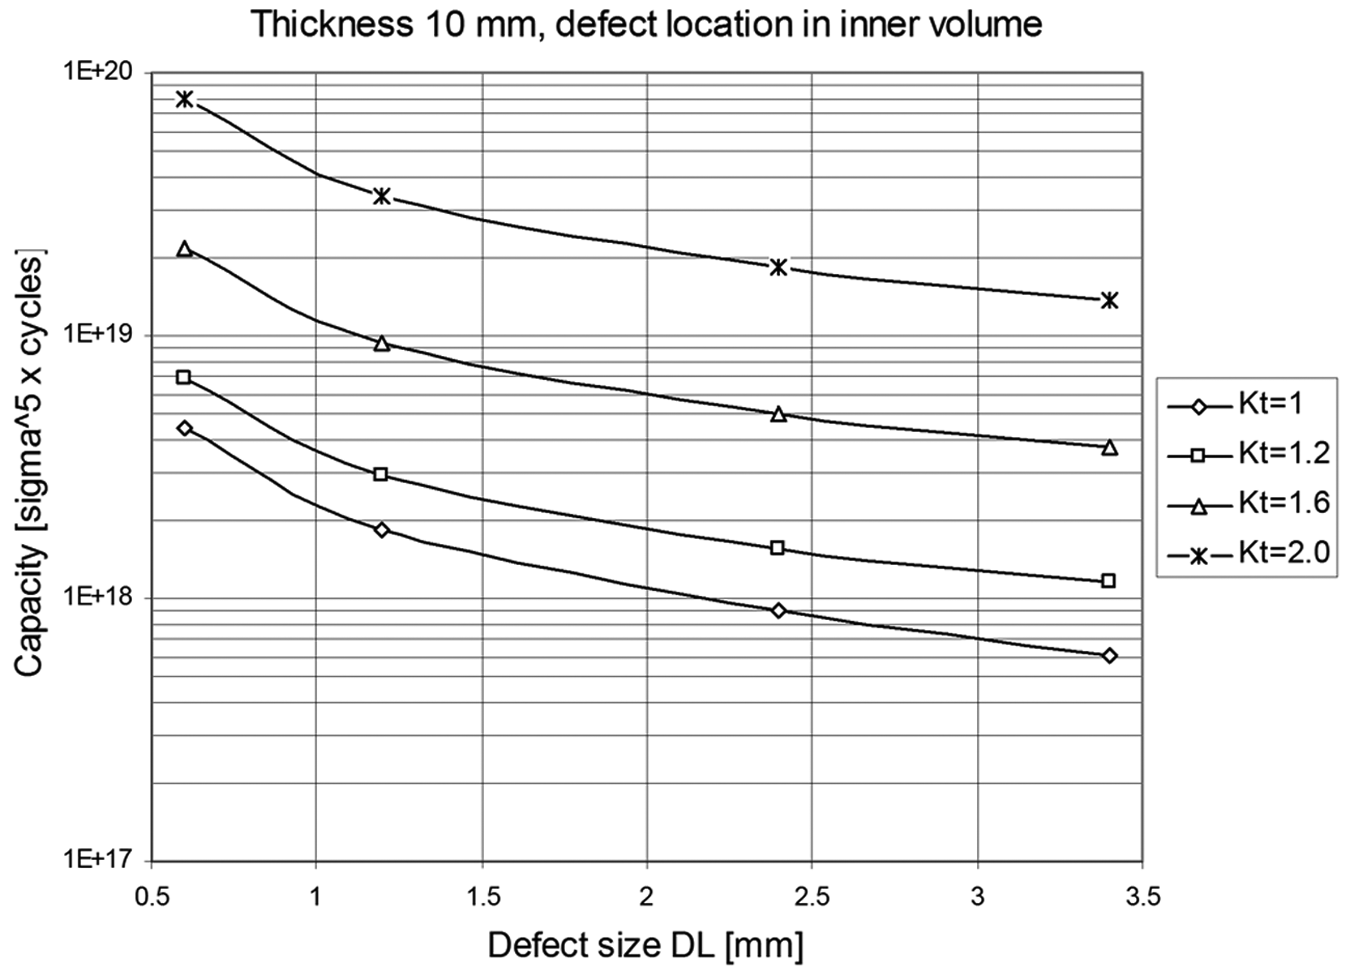
Capacity plot for model with t = 10 mm, defect within interior volume and K t = 1–2.
Discussion
Welding and casting are key manufacturing technologies for many fatigue-loaded structures. For lightweight welded and cast structures the stress levels increase and the structures are more sensitive to deviation from the specification or error in fatigue design. There is a need to establish and maintain technology platforms for lightweight structures that contain:
fatigue design methods;
material selection;
geometry optimization;
QR;
understanding of processes;
improvements methods;
NDT and Non Destructive Evaluation (NED)-methods;
All activities and methods within the platform should have a scientific ground, which means that recommendations, methods and design data should have a solid knowledge base. In some cases, for example as in fatigue assessment, the accuracy of life prediction is influenced by the steady-state residual stress distributions. The results may be affected owing to relaxation from spectrum loading or the surface stresses are redistributed by industrial blasting (before painting). This type of knowledge is important to have, especially in connection with the interpretation of fatigue test results of components or to understand service failures.
There is a need to have internationally agreed best practice design instructions and QR with scientific ground. The IIW commissioned XIII and XV has performed good work related to design and fabrication of welded structures.11,12,20 In the coming years there will be a best practice document relating to the effective notch stress method, which will gradually replace the traditional nominal-stress method.
The Nordic cooperation has improved fatigue design and manufacturing within Volvo and many Nordic industries, and research and education at Nordic universities. There has also been a large involvement with the IIW from all Nordic countries where results from the Nordic projects have been regularly presented.
Footnotes
Funding
The authors acknowledge the Swedish funding agency Vinnova for financing this research.