
Abstract
An experimental investigation is presented involving radius end milling of a new nickel-based superalloy; Haynes 282. When operating with coated carbide inserts at high cutting speed and a feed rate of 0.1 mm/tooth, flank wear measured 213 µm after 45 min of machining. Doubling the cutting speed or feed rate typically caused a pro rata reduction in tool life. The lowest operating parameters resulted in the best surface roughness with levels ranging 0.15–0.3 µm Ra. Microhardness depth profile data was similar for all tests with a hardened region of up to ~50 HK0.05 higher than the bulk value of ~480 HK0.05, which extended to a depth of up to ~50 µm from the workpiece surface. Surface/subsurface cross-sectional micrographs showed grain deformation/damage to a maximum depth of ~15 µm.
Introduction
Haynes 282 is a wrought gamma-prime strengthened nickel-based superalloy developed for high temperature structural applications in aeroengines and similar land-based gas turbine systems. Examples of target components include casings for compressor, combustor and turbine sections along with exhaust and nozzle parts. A key advantage of this alloy over other equivalent commercial Ni-based superalloys, such as Waspaloy, is its unique combination of creep strength (stress of 221 MPa to produce 1% creep in 100 h at 816 °C), thermal stability (Ultimate Tensile Strength -UTS of 975 MPa after exposure at 871 °C for 1000 h), and superior weldability. 1
The difficulties associated with machining nickel-based superalloys are well documented in literature;2–5 however the majority of studies have focused primarily on wrought/cast alloys, such as Inconel 718 and Udimet 720.6,7 This is despite the fact that there are over a hundred different nickel-based superalloy formulations currently available according to Reed, 8 each with diverse mechanical/physical properties and varying machinability/surface integrity characteristics. Work on newer powder metallurgy (PM) processed compositions, such as RR1000, have however begun to appear.9–11
Basic cutting data provided by the alloy manufacturer concludes that Haynes 282 has similar machining characteristics to other high temperature superalloys, with turning guidelines suggesting fluid cutting with positive rake carbide tools operating at ~30 m/min with a depth of cut of 1 mm and a feed rate of 0.12 mm/rev. 1 Additionally, preliminary testing by the authors also concluded that Haynes 282 gave comparable results with Inconel 718 and RR1000 when drilling. 12 The present article details the effects of operating variables on tool life and workpiece surface integrity when end milling for features such as bosses on engine casings.
Experimental work
Machine tool, workpiece material and equipment
The machine tool used was a Matsuura FX5 vertical computer numerically controlled (CNC) machining centre having a continuously variable spindle speed of 200–20,000 r/min, maximum power of 15 kW and a maximum feed rate of 4000 mm/min. The Haynes 282 workpiece material (Ni–20Cr–10Co–8.5Mo–2.1Ti–1.5Al–1.5Fe–0.3Mn–0.15Si–0.06C–0.005B) was supplied in the form of ~6.5 mm thick sheet measuring 615 mm × 700 mm, which was precipitation heat treated to provide a bulk hardness of ~32 mm. Grain size typically ranged from ~50 to 250 µm with carbide particles of up to ~12 µm in length interspersed within the microstructure, see Figure 1. Samples for the machining trials were electro-discharge wire machined (EDWM) to produce smaller plates having dimensions of ~100 mm × 100 mm. Figure 2 shows the experimental set-up used with the workpiece fixture mounted on a force dynamometer. Twin circular nozzles located at opposite sides in relation to the cutting tool and workpiece were employed to supply water-based flood coolant (Hocut 3380). The cutter was a 20 mm diameter, three-insert copy milling unit employing 8 mm diameter round, TiAlN-coated carbide inserts.
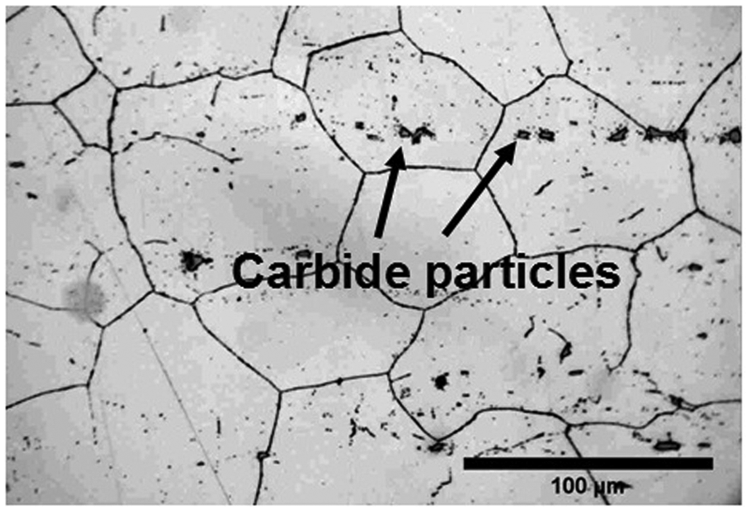
Microstructure of Haynes 282.
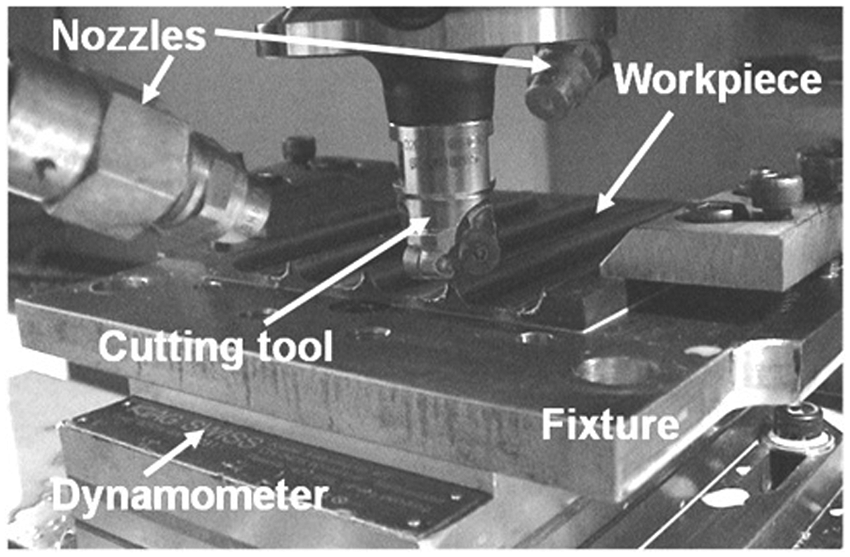
Experimental set-up.
Tool wear was measured using a Wild microscope equipped with a toolmakers table and digital micrometer heads, giving a resolution of 0.001 mm. Images of inserts were taken via a digital single lens reflex (SLR) camera attached to a PC running image capture software. Cutting forces (transverse-Fx, feed-Fy and axial-Fz) were recorded using a Kistler 8654A three-component piezo-electric platform dynamometer connected to a PC running Dynaware software for signal manipulation. Surface roughness (Ra) was measured using a Taylor Hobson Form Talysurf 120L based on a cut-off length of 0.8 mm and corresponding evaluation length of 4.0 mm. For workpiece surface integrity analysis, sectioned machined samples were hot mounted in edge retentive bakelite and subsequently ground/polished according to the procedure for nickel-based superalloy material, as recommended by VanderVoort. 13 This involved grinding using SiC paper and diamond suspension, followed by polishing and etching using Kallings No. 2 reagent. A minimum of 500 µm of workpiece material was removed to ensure that specimens were free of any damage owing to the EDWM process applied during sectioning. Workpiece microhardness depth profile measurements were obtained using a Mitutoyo 810 hardness testing machine with a 50 g load and indent time of 15 s. Readings were taken at 10 µm intervals from the surface until bulk hardness was achieved. Two replications were performed for each section, with the average over the three measurements at each depth calculated and plotted. Additionally, the level of workpiece damage was assessed using an optical microscope running Buehler Optimet software together with a JEOL 6060 scanning electron microscope.
Test programme and procedure
A full factorial experimental design involving two factors (cutting speed and feed rate), each at two levels, was selected. No replications were possible owing to workpiece material limitations. The variables for the four tests are shown in Table 1. The factor levels were chosen based on suggested operating parameters specified by tooling manufacturers. 14 Commercial restrictions preclude the reporting of the exact cutting speed used, although this was within the range of 15 to 75 m/min; with the high level double that of the lower value. All other operating parameters were kept constant. Depth of cut was 0.25 mm (finishing conditions), while cutting fluid was supplied at a pressure of 70 bar and a flowrate of 26 l/min through the twin nozzles. Tool overhang was 28 mm with a corresponding runout of <10 µm.
Full factorial test array.
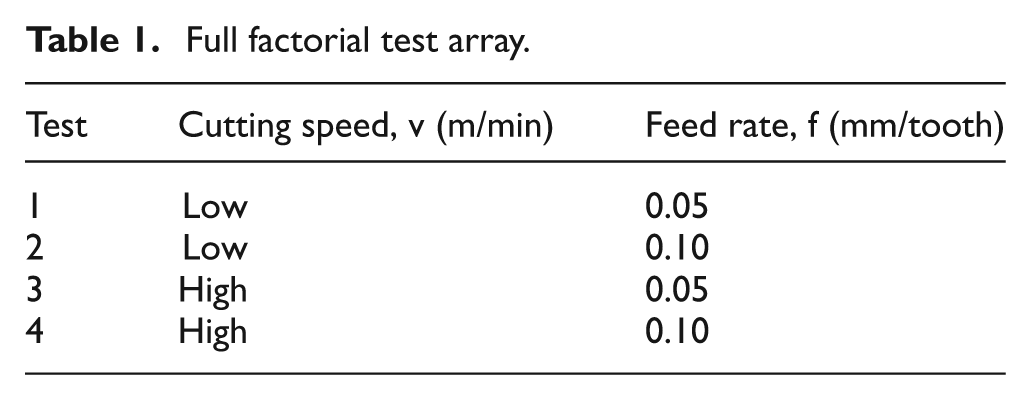
Figure 3(a) shows a schematic of the machining operation together with the corresponding force component directions. Each specimen plate was able to accommodate a maximum of four slots. Cutting proceeded along the entire length of the workpiece, followed by a tool retraction in the z-axis to clear the plate before returning to its initial position. The depth of cut was then incremented by 0.25 mm before a successive pass was milled. This cycle was repeated as necessary until the slot depth reached 4 mm. The cutter was then moved to the start position of the adjacent slot, where the process continued as required. The tool life criteria was a maximum flank wear of 500 µm on any individual tooth or uniform flank wear, up to 250 µm averaged over all teeth. Where possible, this was in accordance with ISO 8688-2:1989 standards relating to tool life testing for milling. 15 Owing to the limited availability of workpiece material, an additional end of test criterion was also specified, which was a maximum cut length of 12.8 m (two plates). Corresponding roughness measurements of the milled surfaces, both parallel and perpendicular to the feed direction at random locations within the middle two-thirds of the slot, were recorded at regular intervals during each test, and averages subsequently calculated. Figure 3(b) shows a diagram demonstrating the typical sections removed for associated surface integrity assessment. The schematic also highlights the relevant areas that were evaluated, with arrows indicating the approximate locations where microhardness data were obtained. In addition, measurements were taken from slots produced by both new and worn tools.
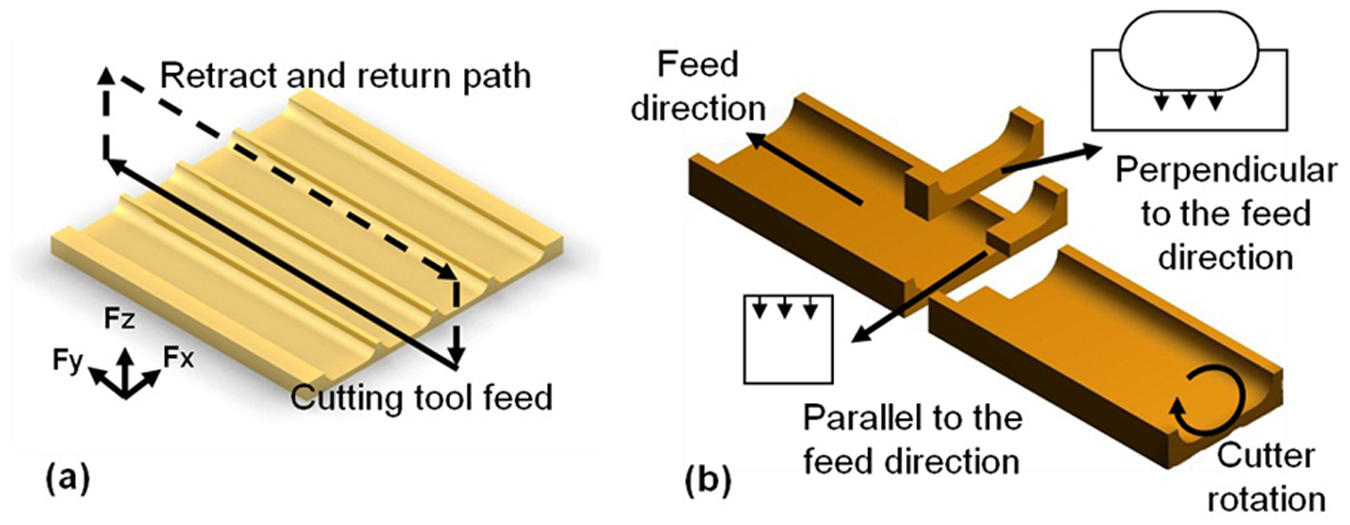
(a) Schematic of milled slot arrangement and machining procedure. (b) Notation for locations of surface integrity assessment.
Results and discussion
Tool life/wear
The progression of tool flank wear against machining time is shown in Figure 4. All four tools experienced heavy initial wear of up to ~70 µm following 2 min of cutting, irrespective of operating parameters. Wear rates, however, reduced considerably over the remaining life of the cutters, while wear scars on every tooth appeared to be uniform and consistent. Not surprisingly, the longest tool life corresponded to the lowest operating parameters (v = low and f = 0.05 mm/tooth), while doubling of either the cutting speed or feed rate to 0.1 mm/tooth (Tests 2 and 3) reduced the cutting time from ~130 min to ~85 min for a flank wear level of 180 µm. Under Test 4 conditions (v = high and f = 0.1 mm/tooth), tool life was significantly shortened, and an equivalent flank wear level (180 µm) was attained after only ~40 min. Similar tool life results were reported by Zhang et al. 16 when end milling Inconel 718 under dry and minimum quantity lubrication (MQL) conditions, albeit at significantly smaller widths of cut (1 mm versus 20 mm). None of the tools in the present study reached the average flank wear criteria of 250 µm, despite machining a length of 12.8 m. The results relate to the use of a single location on the round inserts, and as each insert could notionally provide up to four cutting edges (by 90° rotations), each tool was therefore potentially capable of up to 9 h machining time with the lowest operating parameters, or up to 3 h when employing the highest cutting conditions (based on a nominal flank wear level of 200 µm).
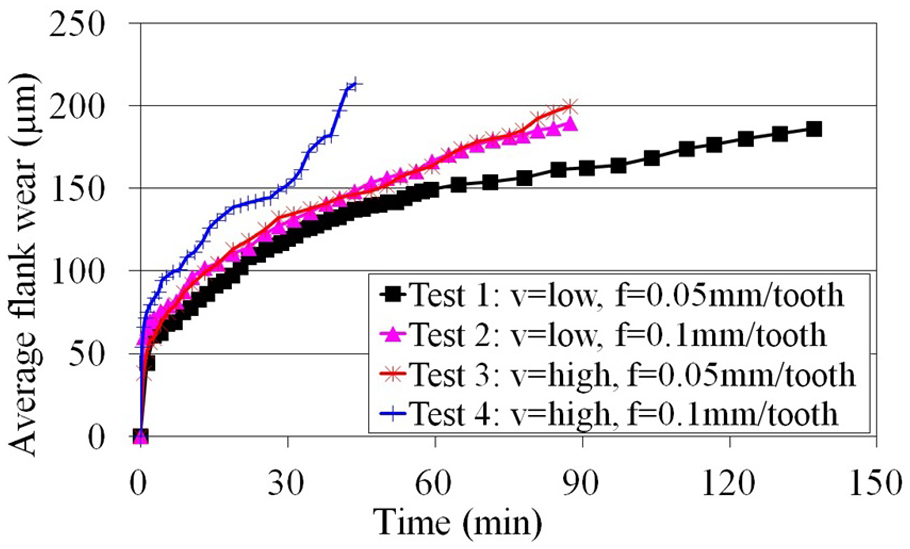
Tool flank wear progression.
A velocity–time (v–T) graph, based on an average flank wear criterion of 180 µm (see Figure 5), showed that the slope of the curves for the two feed rates tested were similar. In addition, the effect on tool life owing to an increase in either cutting speed or feed rate (while keeping the other factors constant) was nearly identical over the range of parameters tested. While employing somewhat different operating conditions, Jawaid et al. 17 reported a tool life of ~20 min (against an average flank wear criteria of 200 µm) when face milling Inconel 718 using uncoated tungsten carbide (WC) inserts with a cut width of 40 mm and depth of cut of 1 mm with water-based flood coolant. The superior machinability performance of the Haynes material reflects, in part, the lower depth of cut employed, but also the performance benefits derived from the use of high-pressure cutting fluid over flood coolant, as well as the TiAlN coating on the inserts.
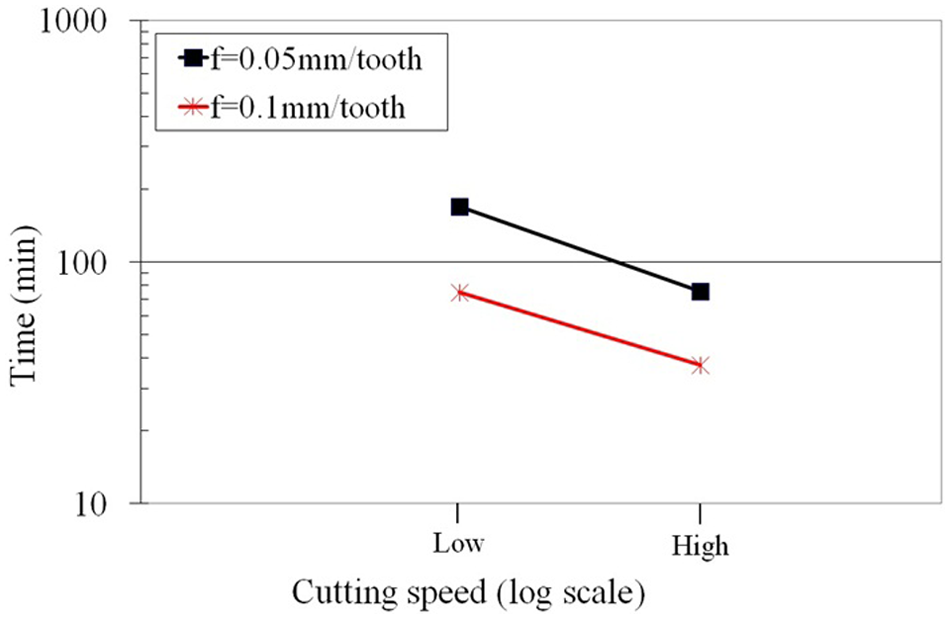
Velocity–time (v–T) curve.
Selected wear scar photographs for Test 4 (Tooth 1) are shown in Figure 6. In general, the type and pattern of wear was largely consistent for all tests performed, the majority of which were observed to be uniform in nature. The only exception was Test 4, where localised chipping was observed on Tooth 1 after a machining time of 28 min, although this did not increase significantly even after a cutting time of 43.7 min. The remaining two cutting edges used in Test 4 showed no signs of chipping. A limited built-up edge was also observed on the inserts, which was most likely owing to the use of the high-pressure cutting fluid. This was in contrast to results reported by Habeeb et al. 18 when end milling a Haynes 242 nickel-based superalloy, which has a higher nickel content (57% versus 65%), yield strength (715 MPa versus 868 MPa) and ductility (30% versus 36%) compared with Haynes 282. No details regarding effects on the workpiece surface integrity however were provided.
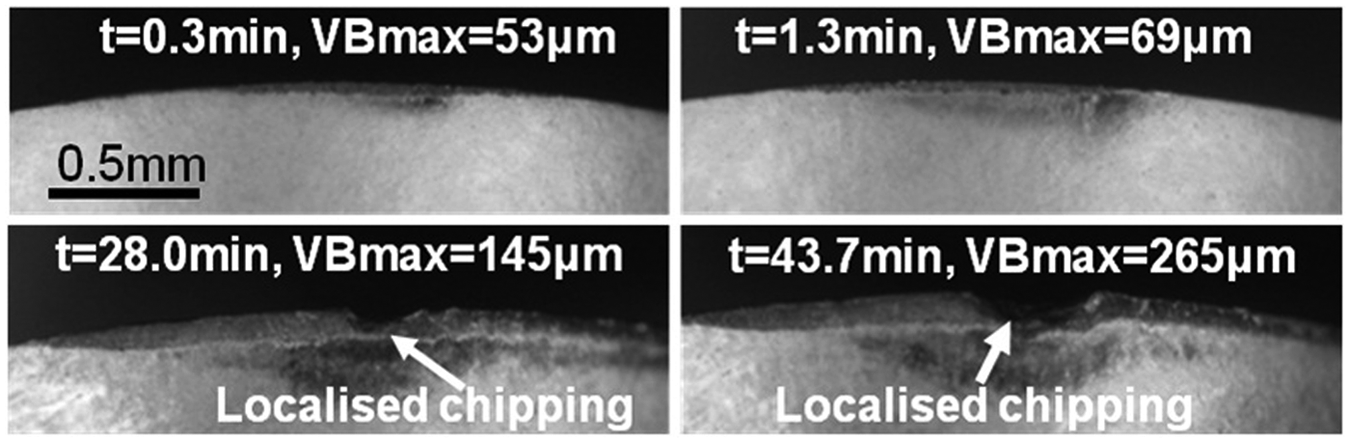
Wear scar micrographs (Tooth 1 in Test 4).
Cutting forces
Figure 7 shows the axial cutting forces (Fz) recorded at various slot/cut depths and plotted against flank wear for each test. These varied from a minimum of ~400 N to a maximum of ~1300 N over the range of parameters tested. The force magnitudes were seen to rise with increasing slot depths for all four trials when compared at equivalent levels of cutter flank wear. This was attributed to the larger effective diameter of the end mill in contact with the workpiece (owing to the round insert geometry) following increments in slot depth. Typically, the progression of tool wear from a relatively new (average flank wear, VBav of ~70 µm) to worn condition (VBav of ~200 µm) resulted in a two-fold rise in forces under all test conditions. While increasing the cutting speed and feed rate also led to higher forces, the differences were relatively small. Similar trends were observed with the transverse (Fx) and feed (Fy) force components. In addition, the axial force tended to be marginally higher compared with the corresponding Fx and Fy directions, however, any variations were within 10% at any given slot depth.
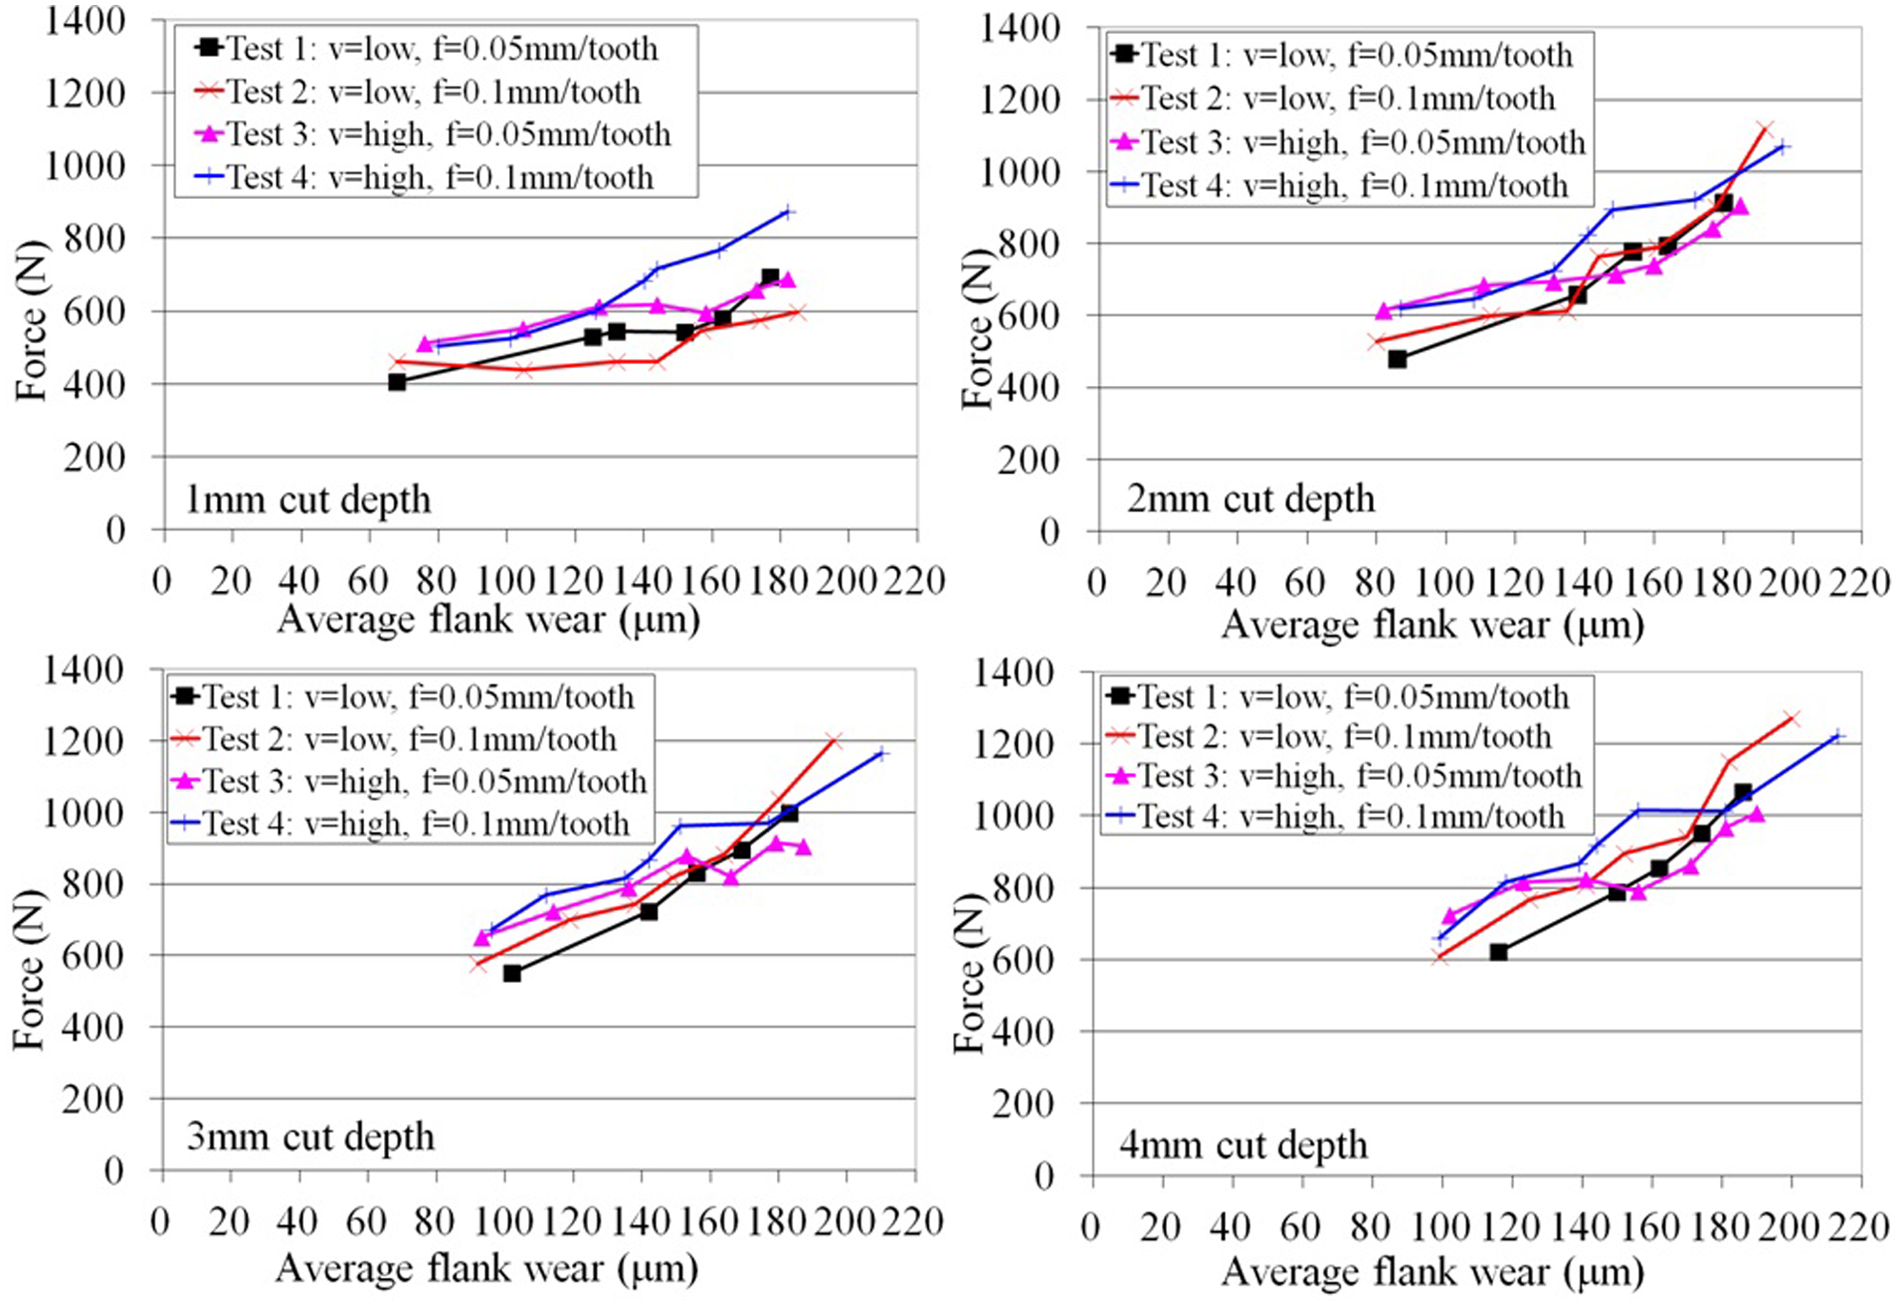
Evolution of axial force (Fz) versus average flank wear.
Workpiece surface roughness
The results from workpiece surface roughness (Ra) measurements taken perpendicular and parallel to the feed direction are shown in Figure 8(a) and (b), respectively. Surface roughness was generally found to be lower when evaluated across the feed direction (Ra of 0.15–0.5 µm compared with 0.25–0.8 µm). A similar trend was observed when end milling RR1000 material, 10 with maximum values of 0.4 µm Ra in the perpendicular direction and 0.55 µm along the feed direction. As flank wear increased from ~46 to 180 µm in Test 1, the corresponding workpiece surface roughness measured in the perpendicular direction doubled, as opposed to only a 33% rise along the feed direction. This trend was mirrored in Test 3 (also at 0.05 mm/tooth) although the magnitude of Ra was, on average, 75% higher. No obvious pattern however, was seen for tests at the higher feed rate (0.1 mm/tooth).
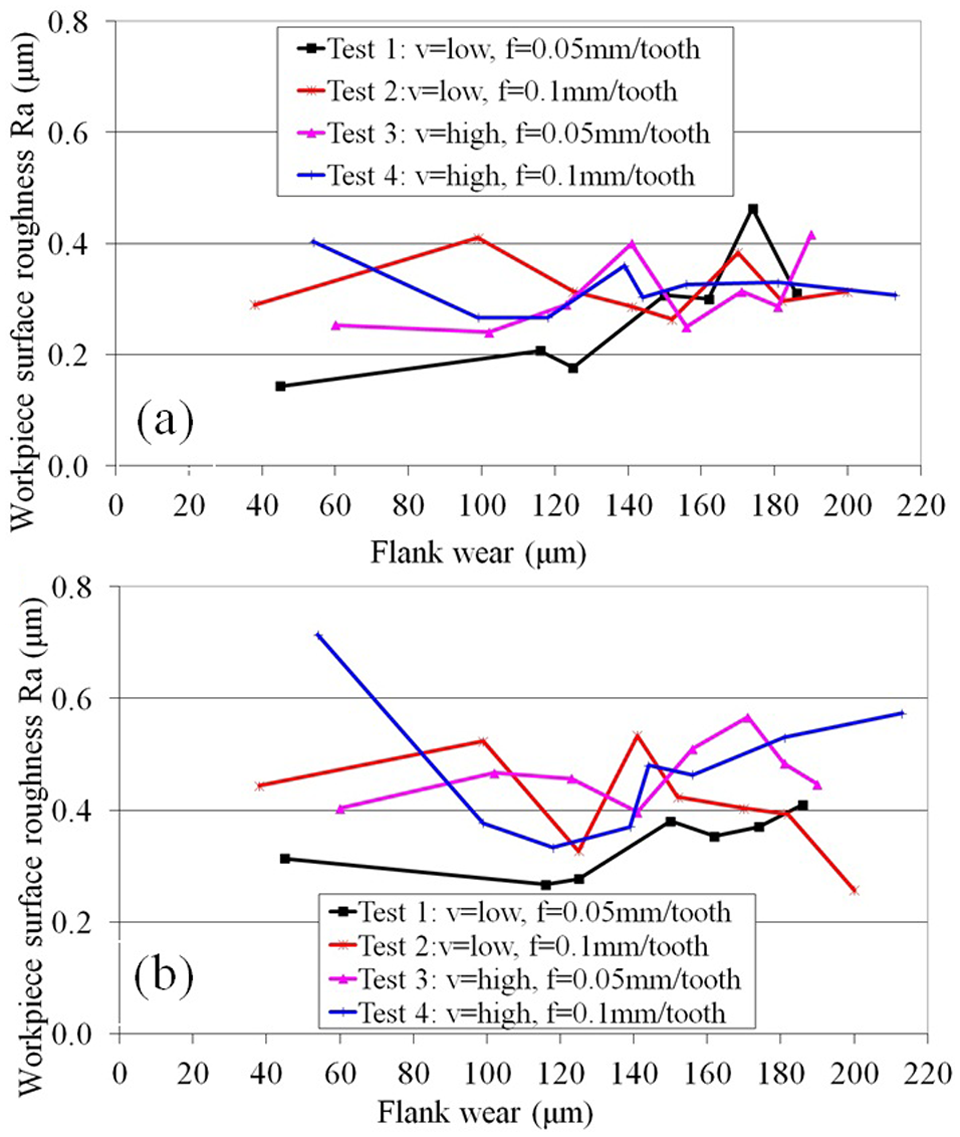
Workpiece surface roughness against flank wear: (a) perpendicular to the feed direction; (b) parallel to the feed direction.
Burr formation and slot quality
Inspection of machined workpiece surfaces showed the presence of burrs at both entry and exit locations, as well as along the sides of the slot. In general, increasing the operating parameters (cutting speed and feed rate) while employing heavily worn tools (VBav = 213 µm) led to greater levels of burring. This is illustrated in Figure 9, where burrs generated after the first pass using a new tool in Test 1 (v = low, f = 0.05 mm/tooth) did not exceed 200 µm in length, which was in contrast to the significantly larger exit burrs produced (up to 2 mm) when utilising worn inserts in Test 4.
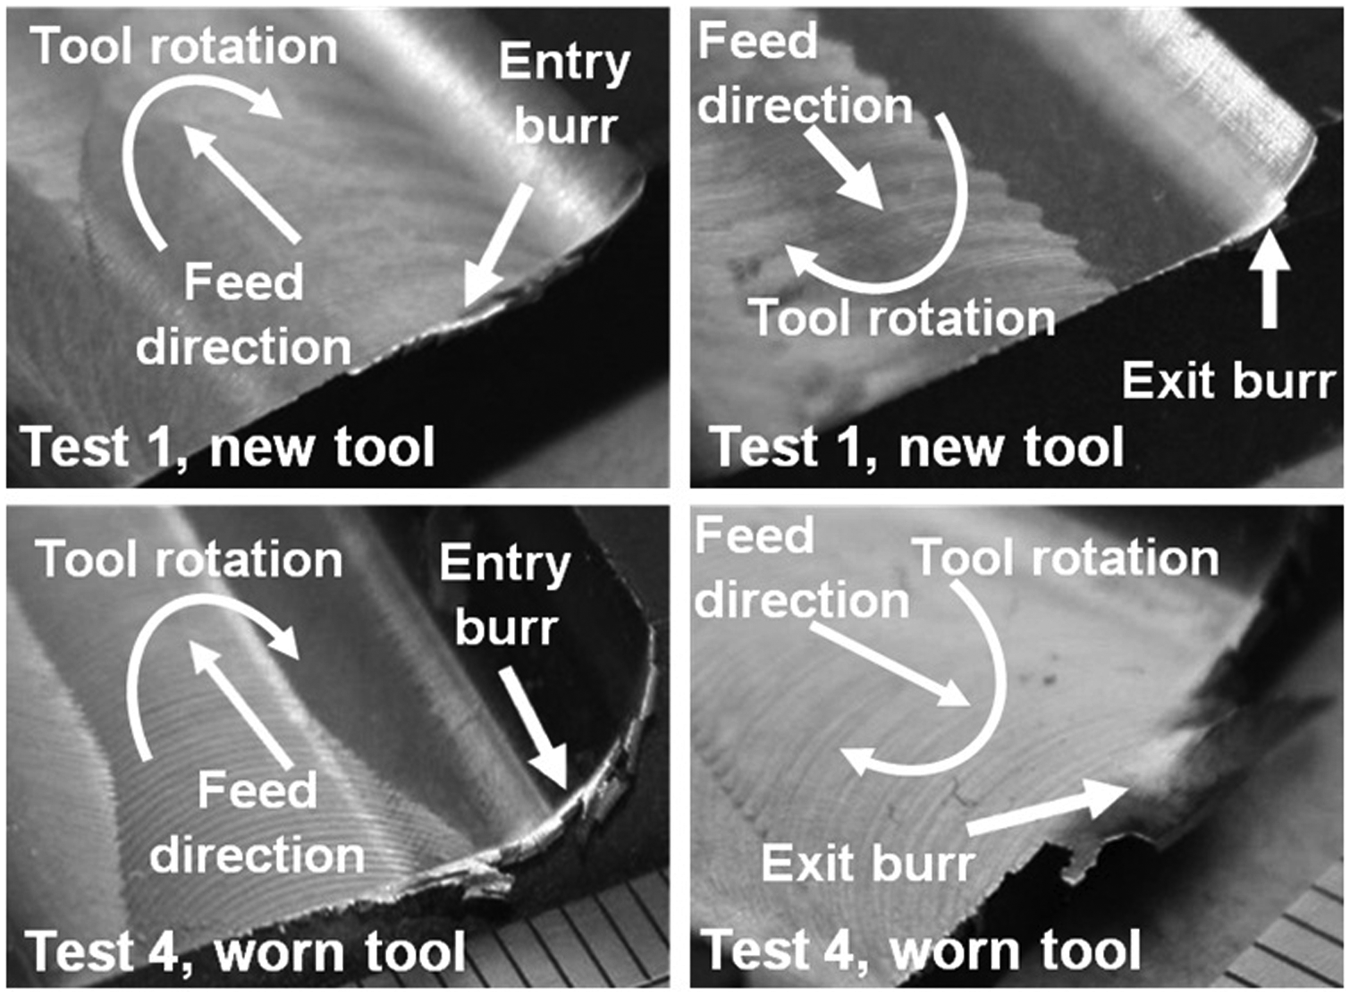
Entry and exit burrs using new and worn tools.
In addition to cutting parameters and tool condition, burr size also appeared to be influenced by slot depth. While limited burring was observed on the top edge of the sidewalls at low slot depths (<1 mm), burrs of up to ~750 µm in height were obtained when milling at depths of 4 mm. An example of this is shown in Figure 10(a) and (b), which compares the edges produced when cutting at a depth of 0.25 mm and 4.0 mm respectively.
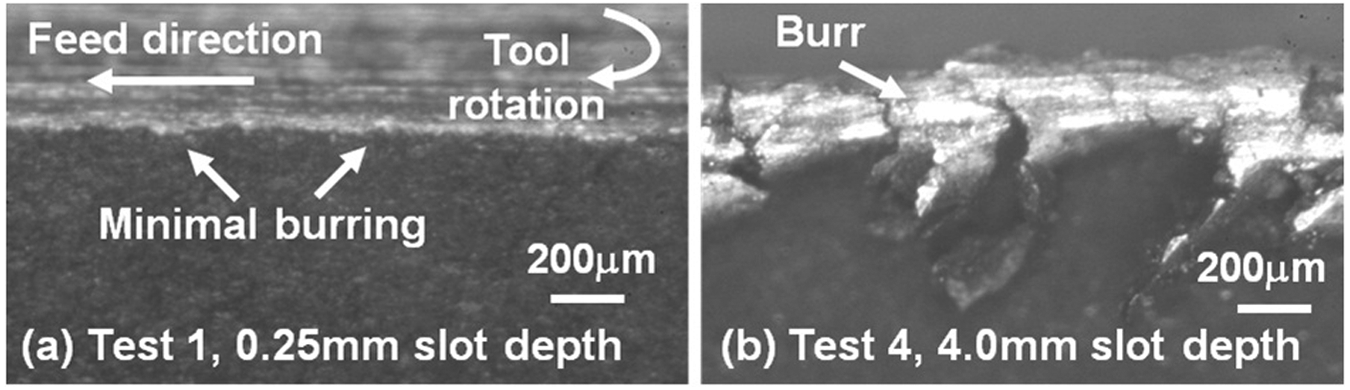
Burring on top of sidewall when milling at (a) 0.25 mm and (b) 4.0 mm slot depth.
Small deposits of adhered material were observed at random locations on surfaces of the slots evaluated, irrespective of the operating parameters or cut depth employed. In trials carried out at the higher cutting speed (Tests 3 and 4) with worn tools (VBav ranging between 180–220 µm), small ‘patches’ of smeared material was frequently visible over the entire slot surface, similar to that shown in Figure 11(a). Larger areas measuring up to 1.0 × 0.5 mm in length and width were found near the vicinity of the exit position in Test 4; see Figure 11(b).
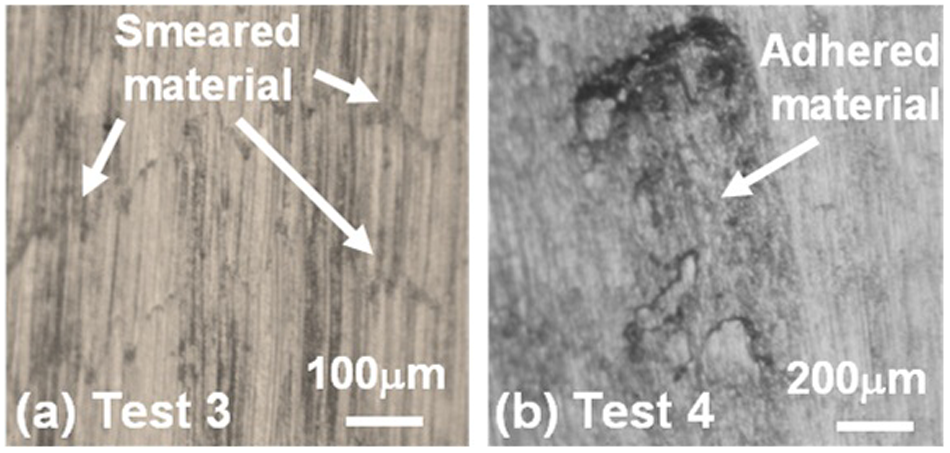
Micrographs of milled surfaces from (a) Test 3 and (b) Test 4.
Microhardness
Microhardness plots of slots machined using new and worn tools (measured perpendicular to the feed direction) are shown in Figure 12. Both show similar profiles with a strain hardened region of 50–70 HK0.05 above the bulk value of ~480 HK0.05 and extending to a depth of up to ~75 µm from the workpiece surface. In general, no discernible trends were evident as a result of changes in cutting speed or feed rate on the microhardness response. Although not shown here, the specimen from the first slot produced in Test 1 (new tool) measured in the direction parallel to the feed indicated softening of ~100 HK0.05 below the bulk hardness, close to the workpiece surface. The reason for this anomalous reading is unclear, but may have been owing to bulging of the sample at the workpiece surface.
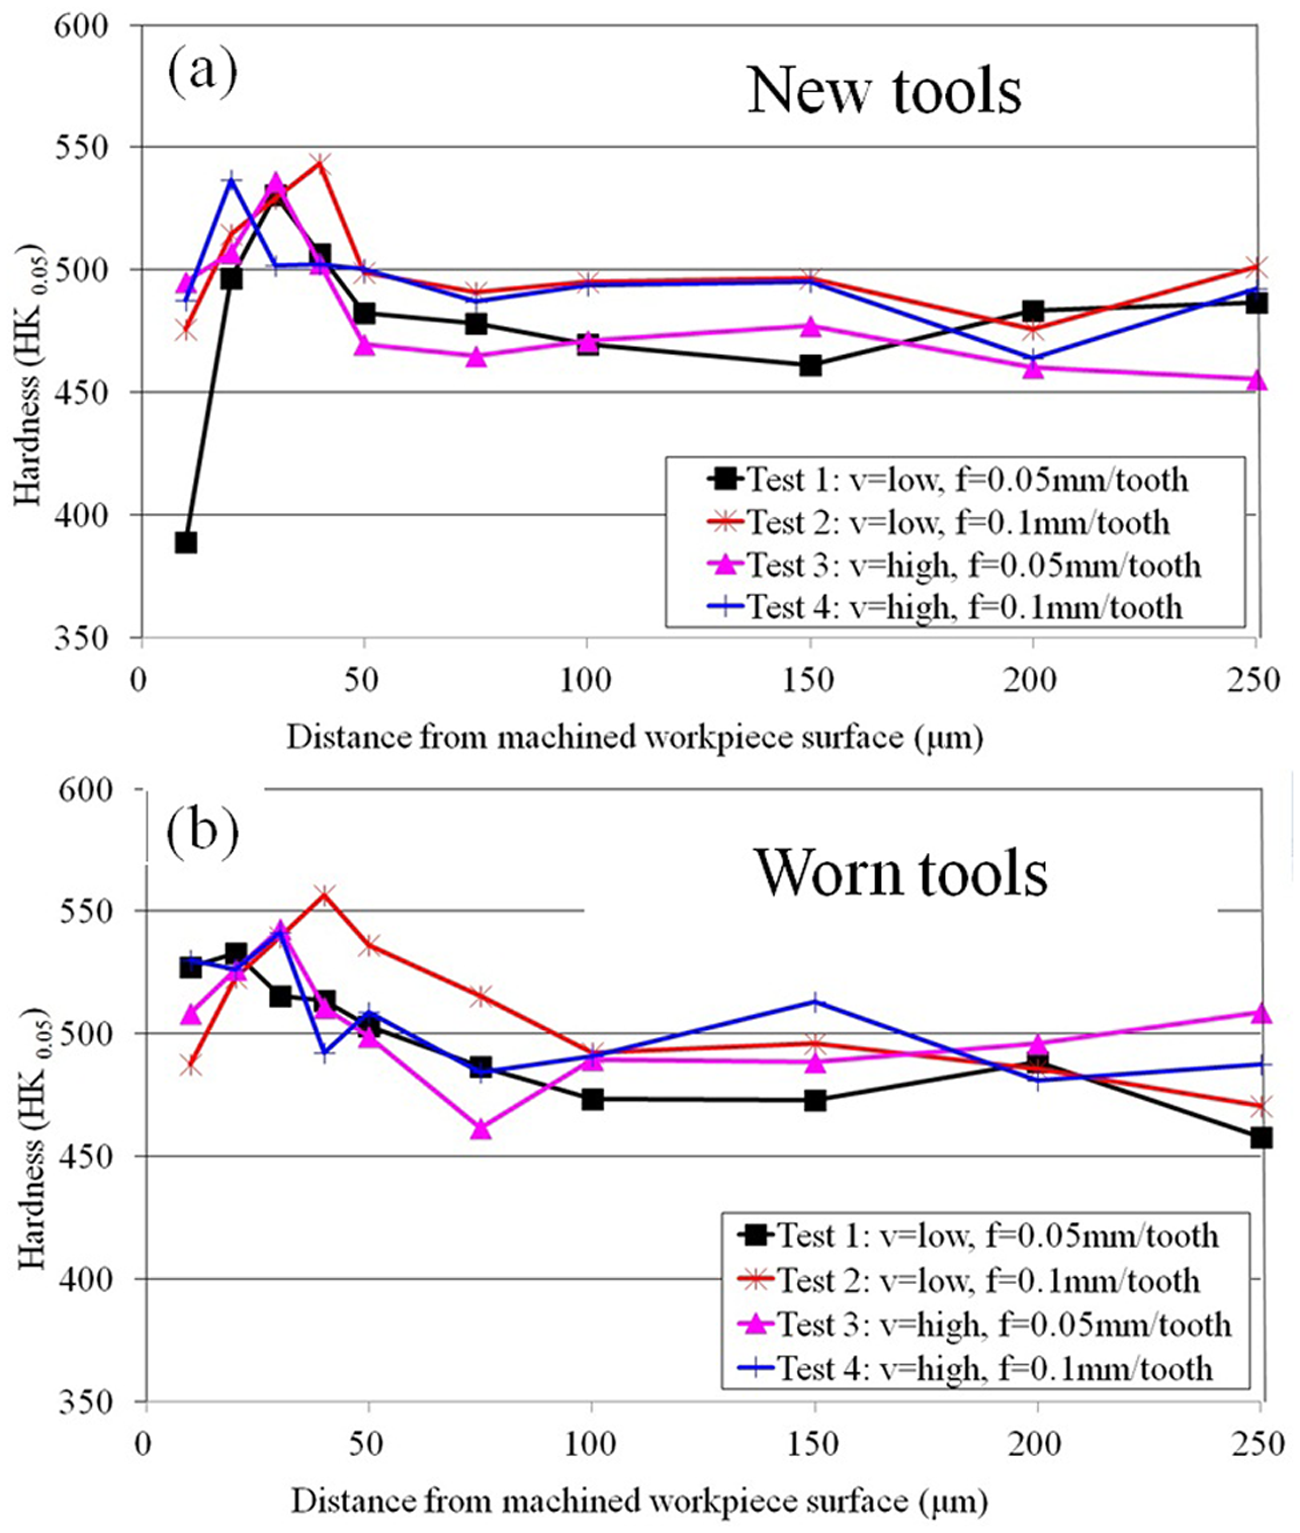
Microhardness depth profiles perpendicular to the feed direction.
Workpiece microstructure and subsurface integrity
Workpiece surface/subsurface cross-sections showed similar results in all of the samples analysed. For surfaces parallel to the feed direction, new tools typically produced minimal damage, which did not extend beyond ~8 µm from the workpiece surface when operating at the lower cutting speed. This generally consisted of intermittent grain boundary deformation and possible strain lines, see Figure 13. A similar trend was reported when end milling Inconel 718 in the feed direction with bending of the microstructure and strain/work hardening to a depth of ~15 µm. 19 As cutting speed and feed rate were increased, the level of grain deformation was more severe, although this only progressed to a depth of ~15 µm from the machined surface. Surprisingly, the use of worn tooling did not appear to cause any significant additional damage to the microstructure of the material, although several instances of deposited chips were observed at random locations on the workpiece surface.
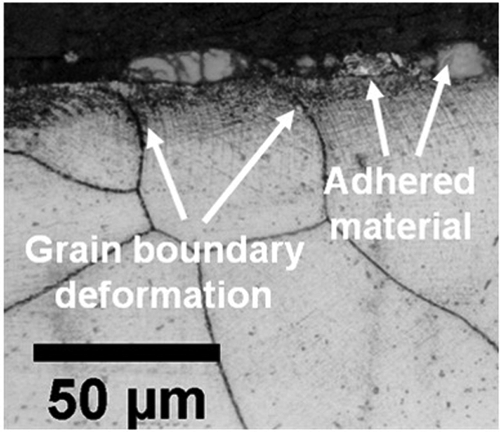
Microstructural deformation parallel to the feed direction.
Cross-sectional micrographs of surfaces perpendicular to the feed showed similar results to those in the parallel direction, with damage being limited to depths of <15 µm beneath the surface when using new tools. An instance of tearing between grain boundaries emanating from the machined surface was, however, observed on the specimen produced using Test 3 conditions with worn tooling (VBav = 190 µm), see Figure 14(a). While the level of workpiece deformation present at the radius ends of the slot section remained constant despite higher operating parameters (Test 4) and greater flank wear (VBav = 213 µm), there was a marginal increase in the amount of adhered material, as well as the size of burrs formed on the sides of the slot, see Figure 14(b). In addition, no white layers were evident, which was similar to that reported when end milling RR1000 material. 10
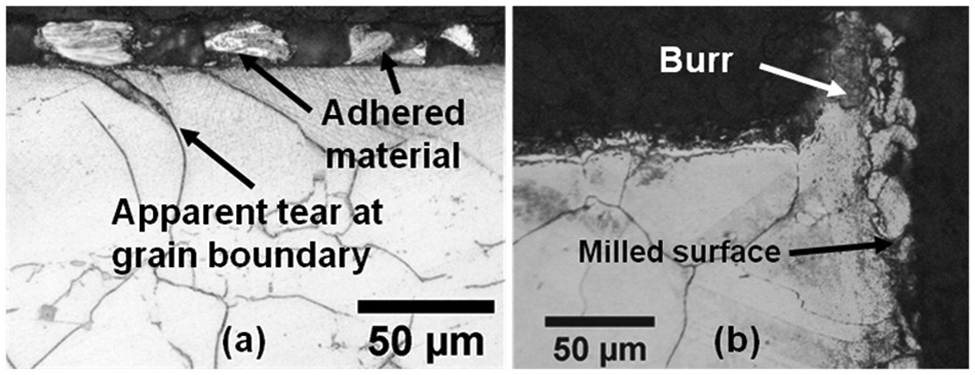
Subsurface cross-sectional micrographs perpendicular to feed direction.
Conclusions
The machinabilty performance of Haynes 282 was found to be similar to solution-treated and aged Inconel 718 when milling, but proved more difficult to cut compared with powder processed nickel-based superalloys such as RR1000.
Wear on the inserts was seen to progress gradually following an initial ‘spike’ for all conditions tested. A cutting time of 45 min was recorded when operating at the highest parameters (high cutting speed and 0.1 mm/tooth feed rate), which corresponded to an average flank wear of 213 µm. Although not detailed here, the main effects plot, based on means for machining time, showed that doubling either the cutting speed or feed rate led to a 50% reduction in tool life (based on an average flank wear criteria of 180 µm).
All three cutting force components (Fx, Fy and Fz) showed a near linear relationship against evolution of average tool flank wear where an increase from ~80 to 200 µm led to a doubling of forces, depending on the operating parameters and cut depth employed. In contrast, changes in operating parameters caused only a marginal rise in force levels.
Milling with the lowest operating parameters (v = low, f = 0.05 mm/tooth) typically resulted in surface roughness levels of 0.15–0.3 µm Ra, which increased two fold (measured in the perpendicular direction) as average flank wear progressed from ~50 to 180 µm. In contrast, there were no clear trends linking the flank wear level to measured Ra when using Test 4 parameters (v = high, f = 0.1 mm/tooth), although slot surface roughness was up to 250% higher compared with corresponding samples from Test 1 with new inserts.
Variations in operating parameters did not appear to have a significant effect on workpiece surface/subsurface microhardness, which was typically ~50 HK0.05 above the bulk hardness of ~480 HK0.05 and extended to a depth of up to ~50 µm from the workpiece surface. Worn tooling caused a further increase of ~20 HK0.05 on the magnitude of the hardened layer, however, no change to the affected depth was observed.
Cross-sectional micrographs, both parallel and perpendicular to the feed directions, showed damage on most surfaces consisting of grain deformation/bending and possible strain lines to a maximum depth of up to ~15 µm.
Footnotes
Acknowledgements
The authors would like to thank Tom Massey from Seco Tools (UK) for supply of the tool holder and inserts. We are also indebted to Dr Wayne Voice and Dr Jamie McGourlay from Rolls-Royce plc for the provision of workpiece material and technical advice, respectively.
Funding
This research received no specific grant from any funding agency in the public, commercial, or not-for-profit sectors.