
Abstract
In Oxley’s machining theory, efforts have been made to address work hardening and thermal softening effects and allow the material to flow continuously through an opened-up deformation zone. However, the strain, strain rate and temperature were calculated based on the average values. The distributions of these processing parameters, which are essential to describe the continuous flow, were not taken into account. In particular, the hodograph was adopted from the single shear plane model, in which the velocity field allowing for the continuous deformation was not described, and the issue of velocity discontinuity has not been resolved. In the current work, based on the detailed analysis on the boundary conditions of the velocity and shear strain rate fields, the thick ‘equidistant parallel-sided’ shear zone model was revisited. A more realistic nonlinear shear strain rate distribution has been proposed under the frame of non-equidistant primary shear zone configuration, so that all the boundary conditions can be satisfied. The obtained results have been compared with those obtained using the original Oxley analysis and the experimentally measured values. Although there was no significant difference in the force prediction, a clear improvement in the prediction of the deformation zone thickness was obtained.
Introduction
During the last century, intensive efforts have been made by many researchers towards the development of predictive machining models. The first quantitative analysis of the cutting forces based on the upper bound theory was made by Merchant. 1 It was assumed that the chip of the rigid perfectly plastic material is formed as a result of the intensive shearing along a thin shear plane. The model has been referred to as a ‘single shear plane model’. Lee and Shaffer 2 considered that for the resultant force transmission from the shear plane to the chip–tool interface, there must be a transmission zone. They represented this transmission zone with a slip-line field theory with which the theory of plasticity was applied to the area of metal cutting. In their study, although a slip-line field was built up, no deformation occurs, but the material is stressed to its yield point. Okushima and Hitomi 3 assumed that rather than along a single shear plane, the shearing should fulfill a transitional region that transforms the work material to the steady chip. The most distinguished contribution from this work is the gradual change of the shear strain, although in a discrete manner, it can be expressed in terms of the tool rake angle and the average friction angle. However, the effect of work hardening and the thermal softening are still excluded.
Oxley and co-workers devoted great effort into the consideration of the material flow behavior and the effect of work hardening and thermal softening during chip formation process in a series of work,4–6 and all the achievement was crystallized in an excellent book.
7
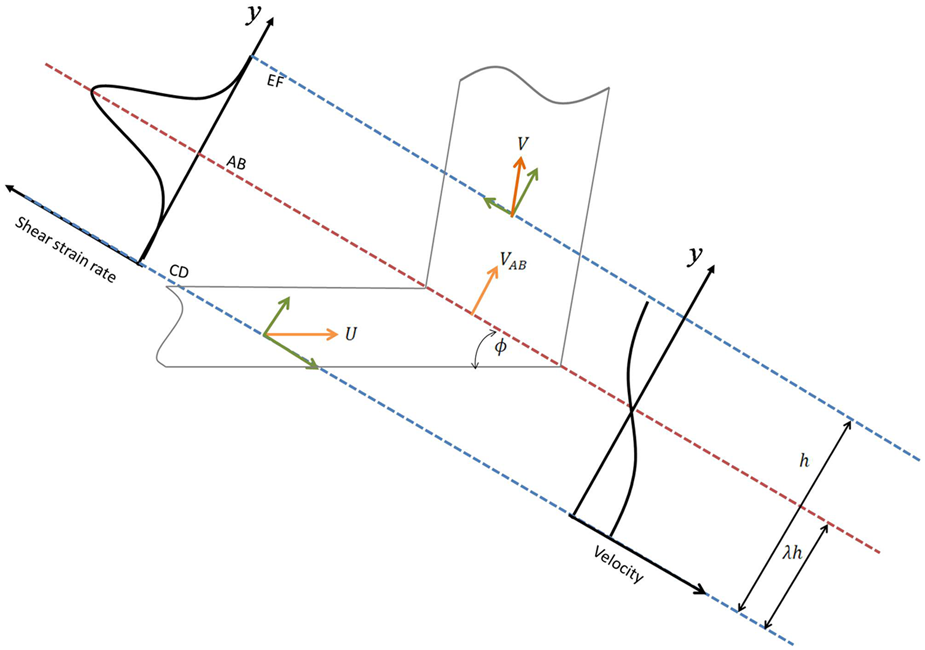
Under the ‘perfectly sharp tool’ assumption, the analysis of the shearing process was focused on the primary and secondary deformation zones. In the primary shear zone, the shear plane is opened up so that the continuous flow of the material can be considered. Once the material particles have passed through the primary deformation zone, further plastic shearing occurs in the secondary deformation zone, which extends from the tool tip, along the rake face, to the end of chip–tool contact. The basis of the theory is to analyze the stress distributions along AB (Figure 1) and tool–chip contact interface in terms of the shear angle based on the cutting conditions and work material properties. The effect of the work hardening and thermal softening on the plastic flow behavior was taken into account. The shear angle
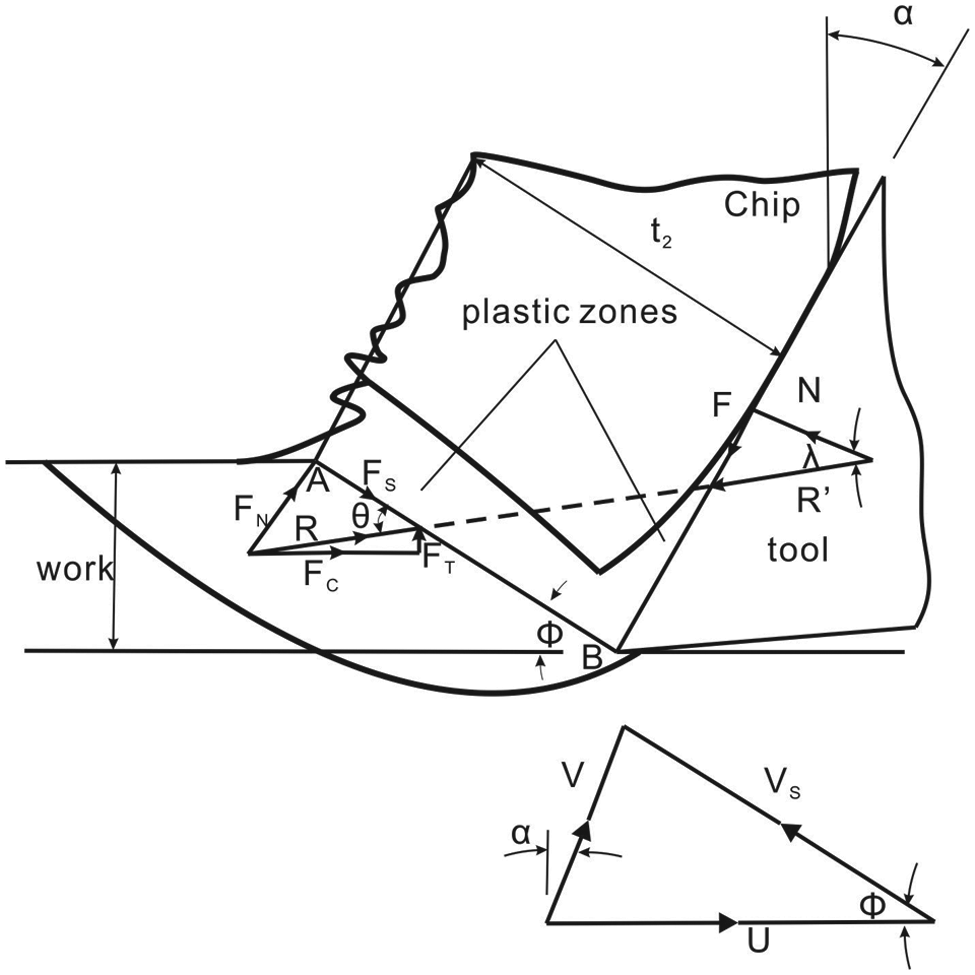
Orthogonal metal cutting model with thick deformation zone.

was introduced to account for the combined effect of strain rate hardening and thermal softening. The flow stress is expressed as a function of equivalent strain through the power law
In Oxley’s predictive machining theory, the relationship between velocity modified temperature
In the current work, the prediction of various processing parameters is based on Oxley’s method, 7 while the velocity, shear strain and shear strain rate fields in the primary shear zone that allows the continuous deformation has been analyzed, in an attempt to provide an improved insight into the flow behavior in the primary shear zone. The current model avoids the velocity discontinuity across the primary deformation zone and relies on a more realistic strain and strain rate distribution, rather than using an average value at an equidistance across the primary deformation zone, as per the previous analyses.
Fields of velocity, strain and strain rate in the primary shear zone
Based on the shear plane model, and considering the effect of strain hardening during chip formation, Oxley
7
proposed a parallel-sided shear zone model, as shown in Figure 1. The primary shear zone is bounded by the lower boundary, CD, where the deformation starts, and upper boundary, EF, where the deformation ends, as shown in Figure 2. An approximation was made so that CD and EF are all parallel to AB and the distances to AB are the same. The geometry of the primary shear zone is represented by the shear angle
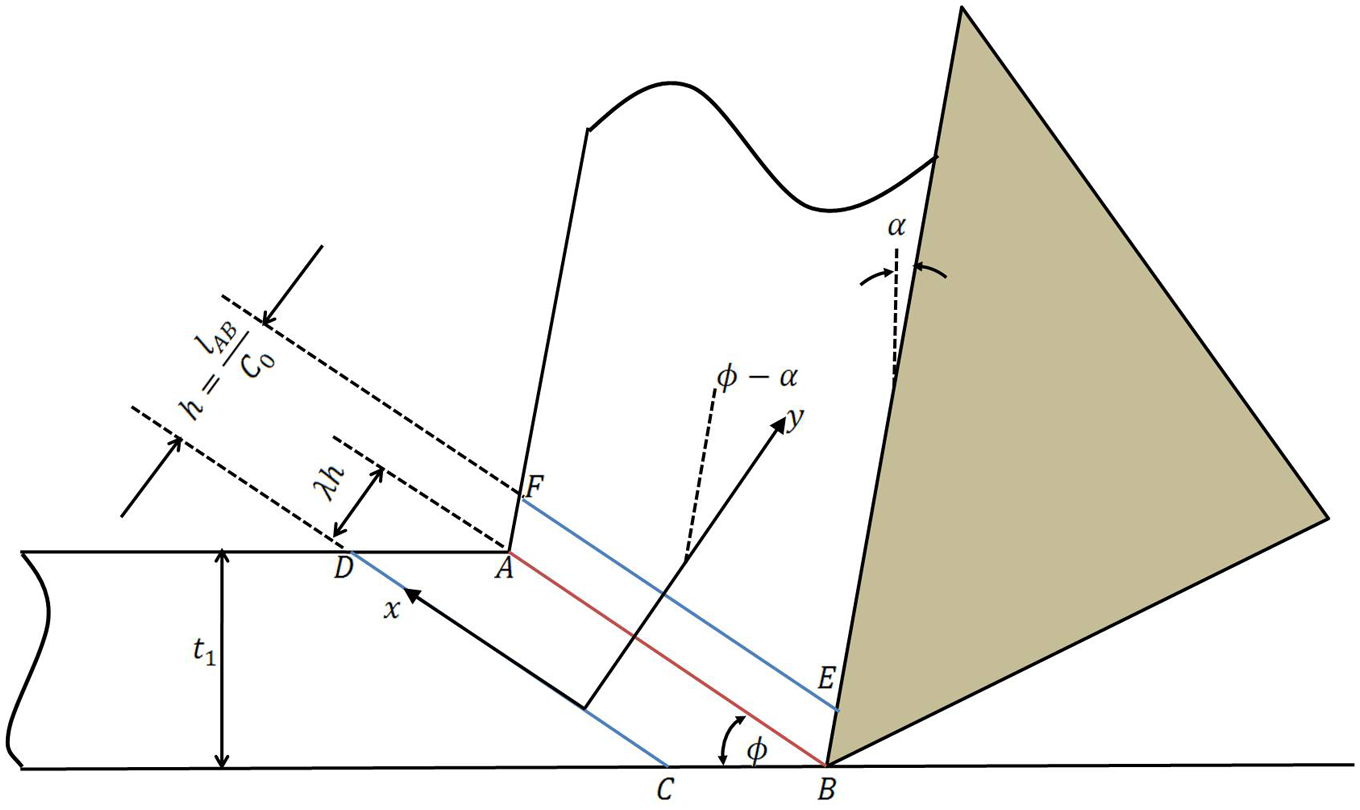
Simplified non-equidistance primary shear zone.
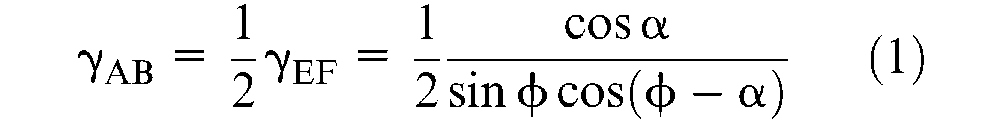
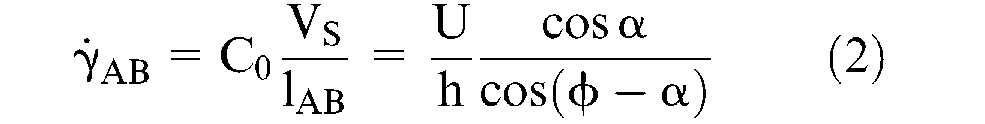
Based on experimental data, Oxley 7 showed that the distribution of the shear strain rate is close to a bell-shaped curve through the primary shear zone and the shear strain rate reaches the maximum at AB. However, the strain rate distribution was not formulated or utilized in the analysis and instead the shear strain rate at AB is used and calculated by
Based on the engineering plasticity, several researchers re-evaluated the orthogonal metal cutting mechanics in the primary shear zone.14–17 In their studies, the coordinate system is commonly set based on the shear angle, as shown in Figure 2, where the x direction is set along the shear zone boundaries and the y direction is perpendicular.
Since the boundaries CD and EF are assumed to be

Because the slip lines are simplified to be straight, equation (3) implies that

The continuity of incompressible plastic materials requires

Equations (4) and (5) imply that the normal component of velocity on the main shear plane AB is constant across the primary shear zone and, therefore, all the analysis in the primary shear zone can be carried out in one dimension. For a given cutting speed
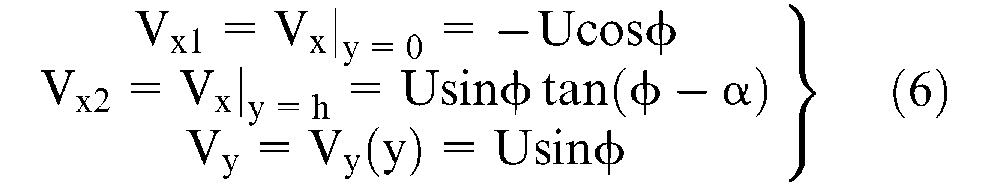
The velocity discontinuity
It should be noted that

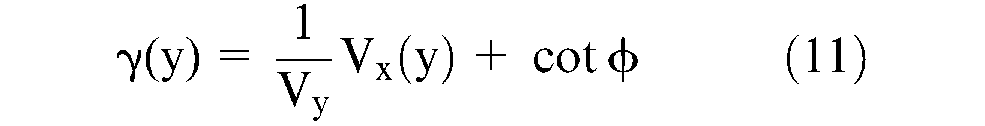
In this study, the simple shear is assumed along parallel planes and, therefore, no rotations occur during plastic deformation. Thus, the shear strain rate can be related to the shear strain and velocity, as shown in equations (9) and (10), respectively

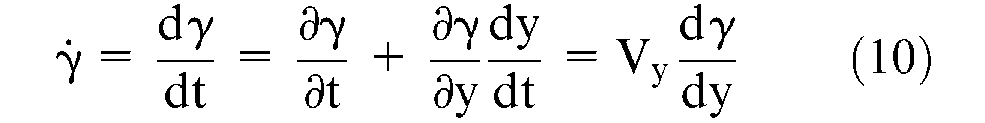
Substituting equation (9) into equation (10), and integrating with respect to y, the relation between velocity and shear strain field can be expressed such that
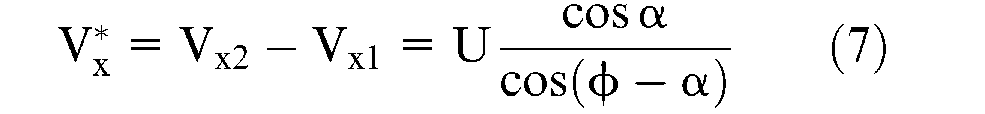
As can be seen from equation (6), as long as the shear angle is greater than the rake angle, the sign of
From the above analysis, if
The quantities defining plastic deformation depends only on y, the direction perpendicular to the main shear plane.
The tangential velocity is
The tangential velocity is zero at main shear plane AB

The shear strain rate reaches maximum at the main shear plane AB and is zero at the lower and upper boundary


Since the material particles move toward the primary shear zone with constant speed, the change rate of the velocity and the corresponding shear strain rate are zero before the lower boundary CD is reached. Similarly, after passing through the upper boundary EF, the strain rate of the particles reduces to zero again. If the strain rate distribution is assumed to be represented by a smooth differentiable curve across the entire primary shear zone from CD to EF (including both inner sides and outer sides), there must be an extremely thin buffer zone around CD and EF, in which the gradient of the shear strain rate with respect to y is zero. In this study, the locations around CD and EF, where the gradient of the shear strain rate reaches zero, are defined as lower and upper boundaries, respectively. Furthermore, the assumed differentiable nature of the curve leads to the fact that the gradient of the shear strain rate with respect to y is also zero at AB, where the shear strain rate reaches the maximum, that is


A fourth-order polynomial curve in terms of y and h could describe the distribution of tangential velocity in the primary shear zone for moderate cutting speeds. 17
According to these characteristics and boundary conditions, the pattern of velocity and shear strain rate distribution may be illustrated in Figure 3. Based on these conditions the following piecewise strain rate distribution is proposed.
Demonstration of the distribution of shear strain rate and tangential velocity in the primary shear zone.
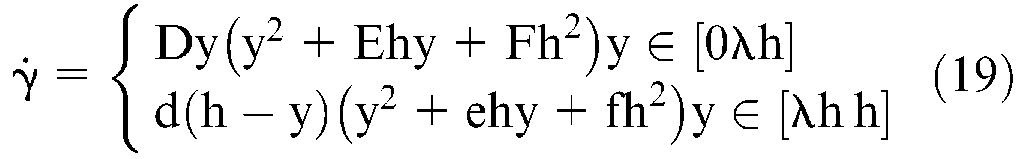
Considering the boundary conditions of equation (6), the velocity field can be obtained by the spatial integration of shear strain rate
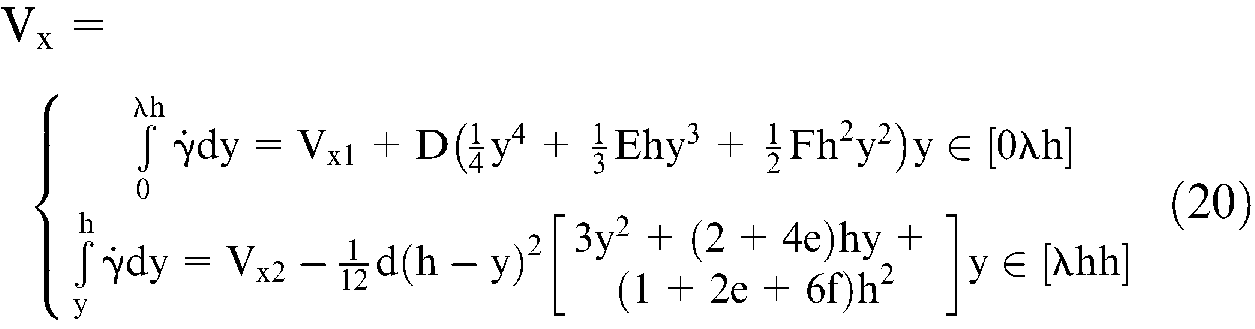
In which
As part a of solution, proportion factor


Using the velocity distribution in equation (20) the shear strain distribution in equation (11) can be determined and the shear strain at AB can be given by

Figure 4 shows the effect of the shear angle on the proportion factor for different values of rake angle. From the illustrated results, in order to locate the main shear plane right at the middle of the primary shear zone, a combination of a large negative rake angle and large shear angle must occur, see Figure 4. However, this circumstance would rarely happen, since cutting tools with a large negative rake angle result in severe plastic deformation, leading to large chip ratio and, therefore, small shear angle. On the other hand,
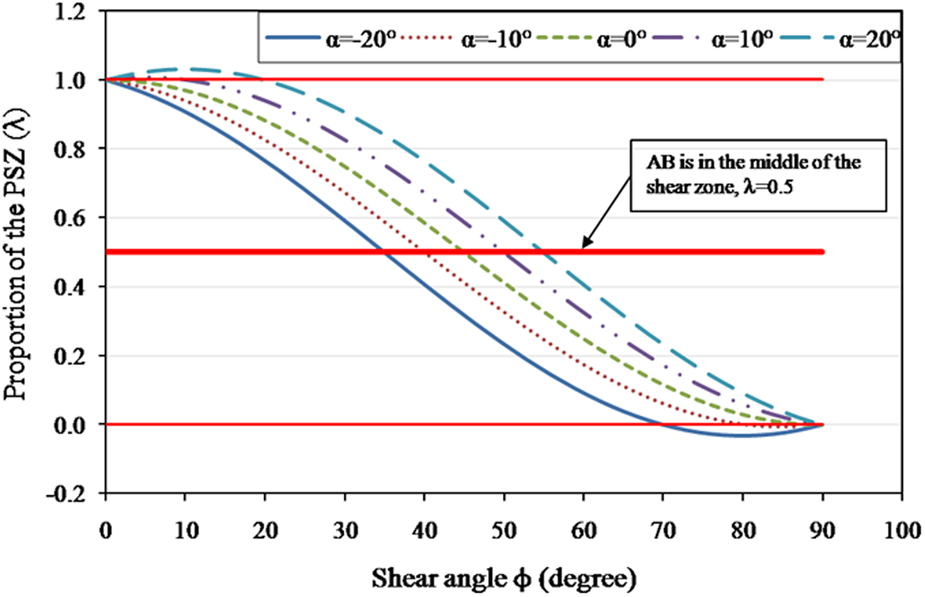
Primary shear zone proportion.
Figures 5, 6 and 7 plot equations (42) and (43) (Appendix 2) and equation (11) for different values of primary shear zone thickness, respectively. With the input of zero rake angle, the shear angles
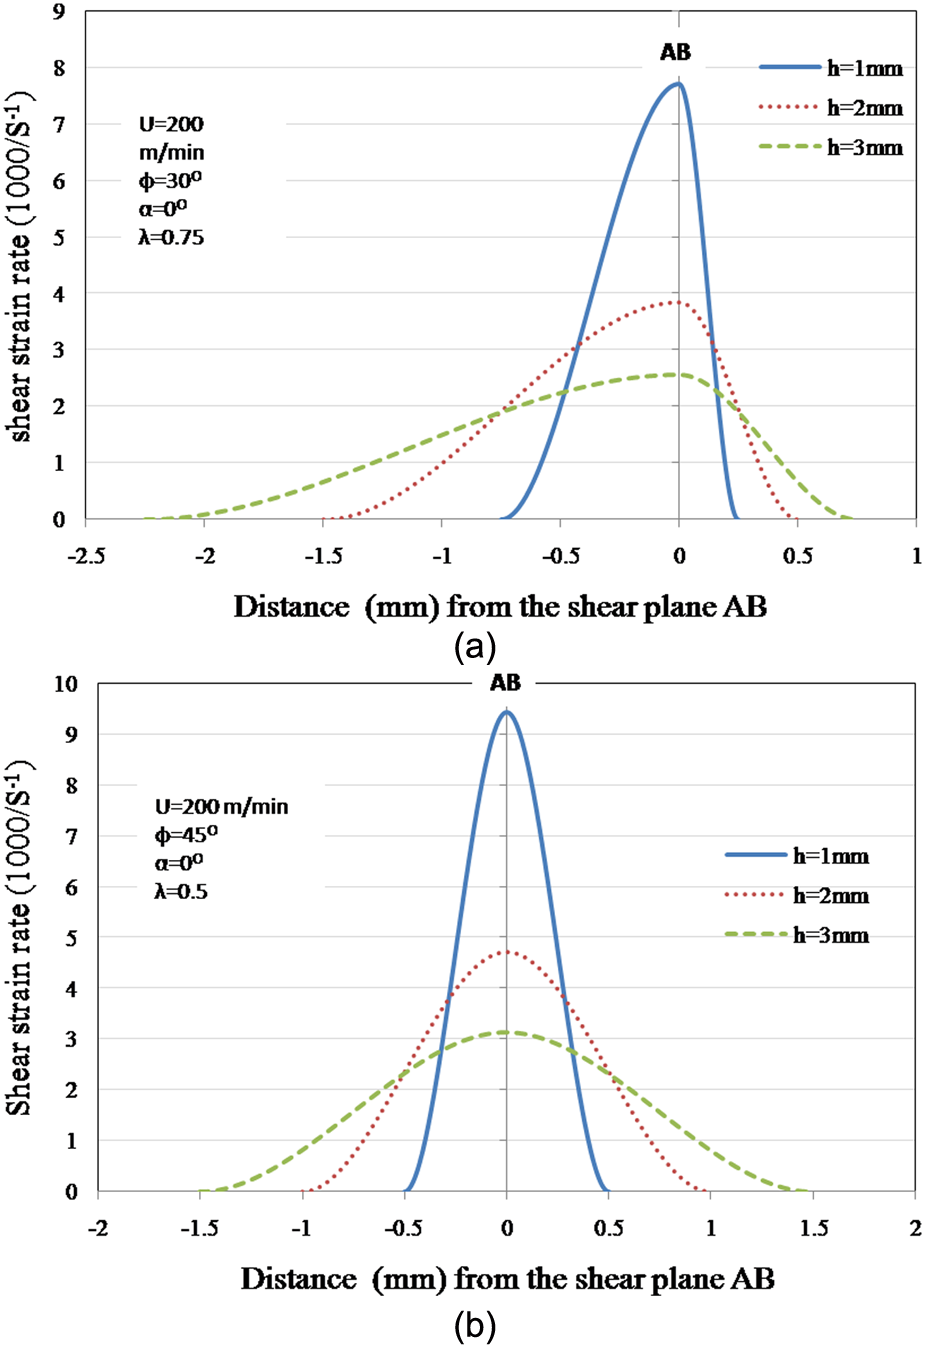
Shear strain rate distribution through the primary shear zone: (a) asymmetric distribution; (b) symmetric distribution.
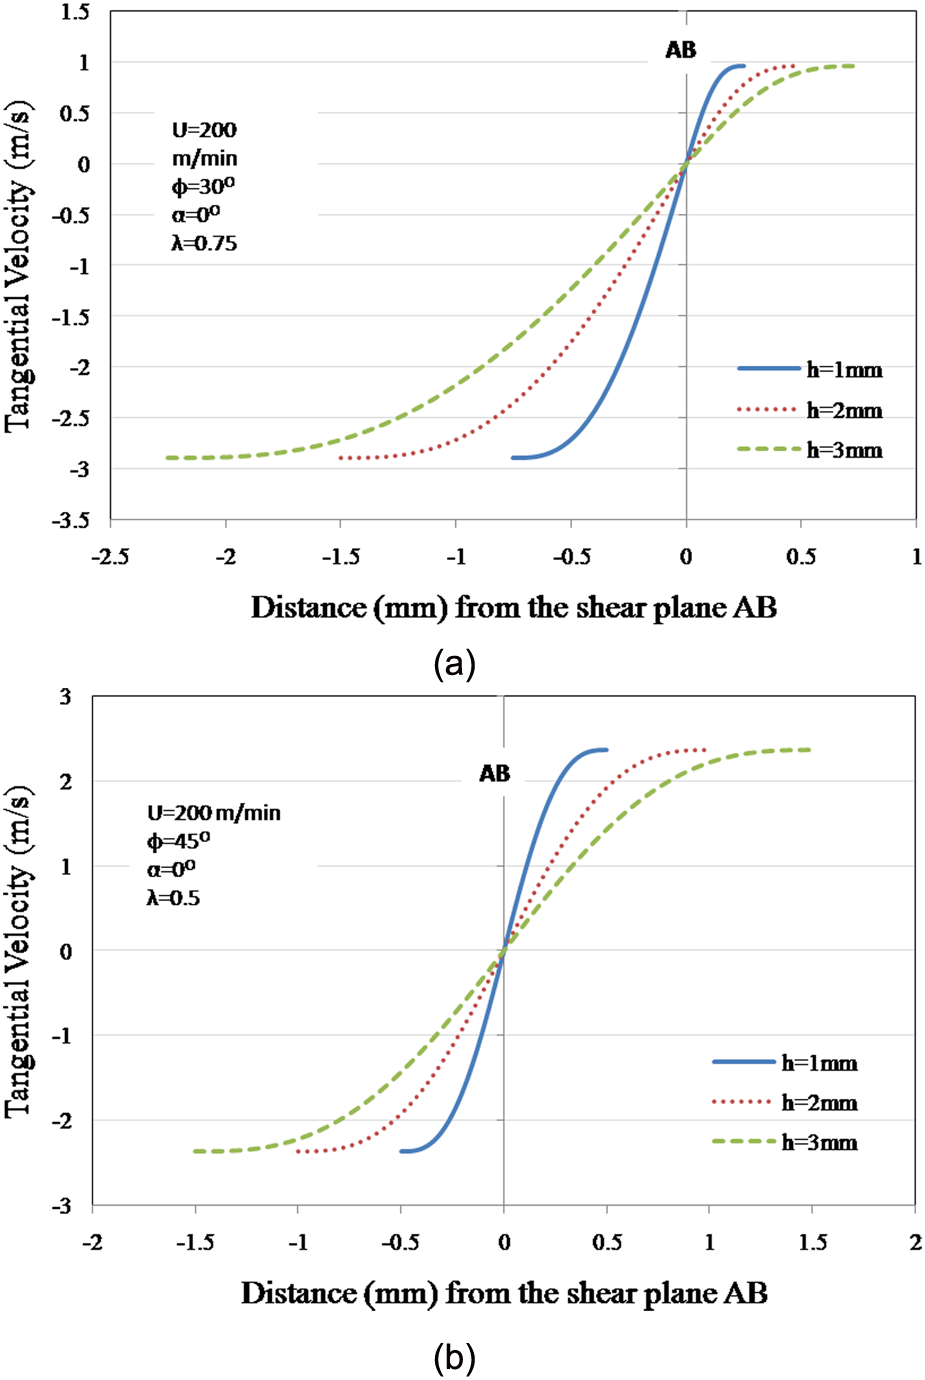
Tangential velocity distribution through the primary shear zone: (a) asymmetric distribution; (b) symmetric distribution.
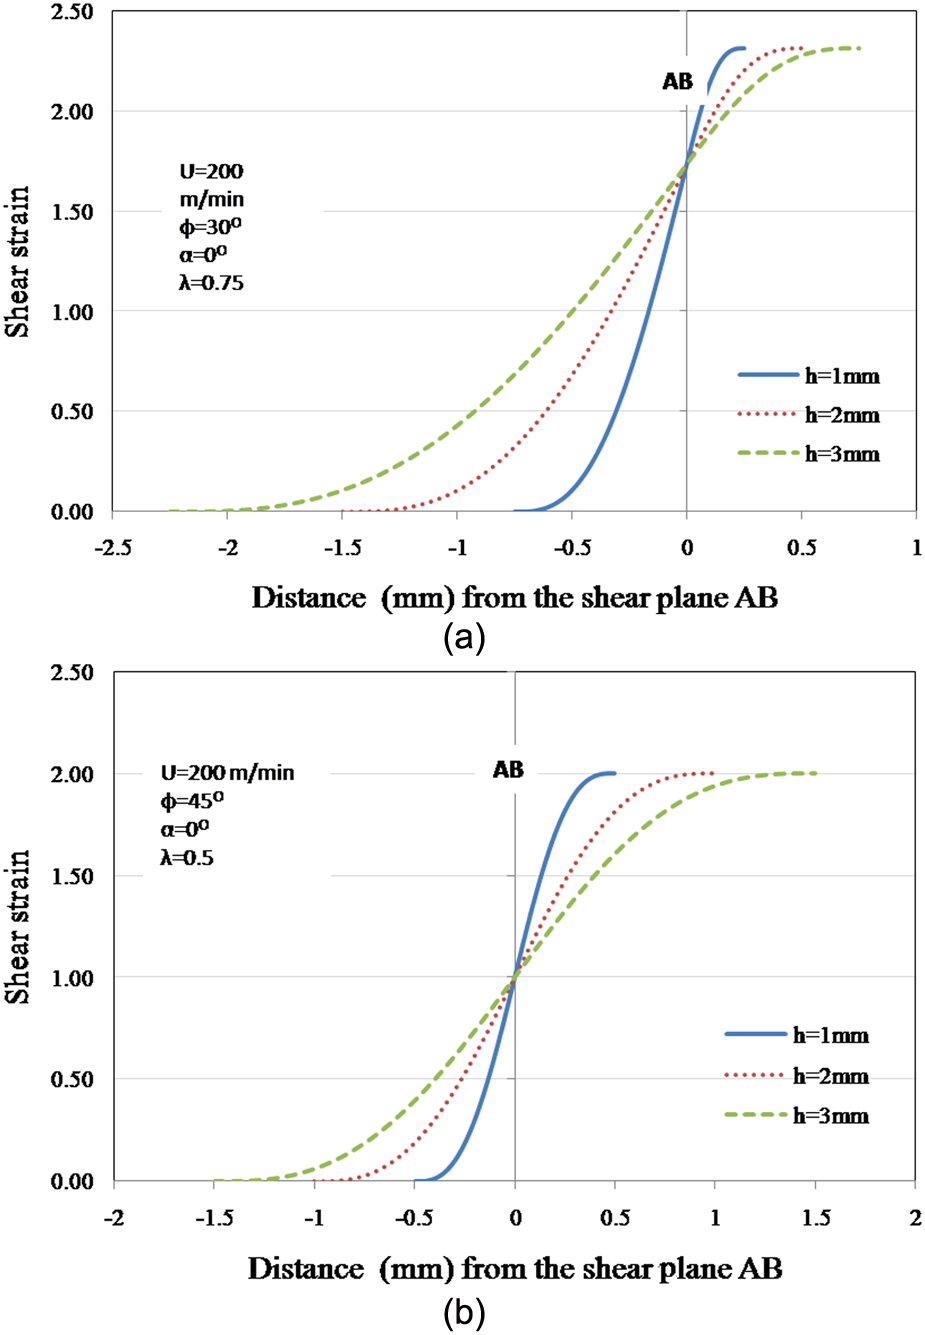
Shear strain distribution through the primary shear zone: (a) asymmetric distribution; (b) symmetric distribution.
Based on the determined shear strain and shear strain rate, the force

where


The main advantage of Boothroyd’s thermal model is to relate the proportion of heat conducted into the workpiece to the cutting conditions (
The prediction of cutting force and other processing parameters in the current work is based on Oxley’s method. The main scheme to obtain the final results can be summarized as follows.
The shear angle is determined by considering that the shear stress at the chip–tool interface, calculated from the constitutive equation, is equal to that transmitted from the resultant force on the main shear plane through the shear angle.
Similar to the determination of shear angle, the thickness of the primary shear zone is obtained by the identity of the normal stresses at the chip–tool interface.
The principle of minimum energy leads to the final secondary shear zone thickness and all other corresponding processing parameters.
The elaborate description and reasoning of the methodology can be found in Oxley. 7 The differences between the current work and Oxley’s original work are:
the ability to predict shear strain and strain rate distributions across the primary shear zone;
the ability to predict the location of the main shear plane where the shear strain rate is the maximum.
Results and discussion
In the current study, Oxley’s machining theory has been modified to consider the distributions of velocity, shear strain and shear strain rate across the primary shear zone. The presented analysis, based on the velocity and strain field for the incompressible material, reveals that the main shear plane is not located right at the middle of the shear zone, but can be expressed as a function of material properties and cutting conditions. In this section, the comparison will be made between the current and Oxley’s results when predicting process parameters, such as cutting forces, chip thickness and secondary shear zone thickness. The work materials used for comparison in this study are 0.20% carbon steel and AISI 1045 steel. The experimental data for 0.20% carbon steel is adopted from Oxley 7 and that for AISI 1045 steel is adopted from Ivester. 19
Figures 8 and 9 present the predicted and measured machining forces and chip thickness for 0.20% carbon steel. The marks with the solid fill are the data when a built-up-edge was observed. It can be seen that there is no significant difference between the current and Oxley’s predictions. This may be explained by the fact that the cutting forces are determined by both work hardening and thermal softening effects. With the ‘unequal distance’ configuration of the primary shear zone, the shear strain, shear strain rate and temperatures predicted in the current study are all higher than that by Oxley’s original method. So that the resultant effect of work hardening and thermal softening makes the results similar. However, the location of the main shear plane can be predicted in the current work. The predicted proportion factor
Machining forces for 0.20% carbon steel:
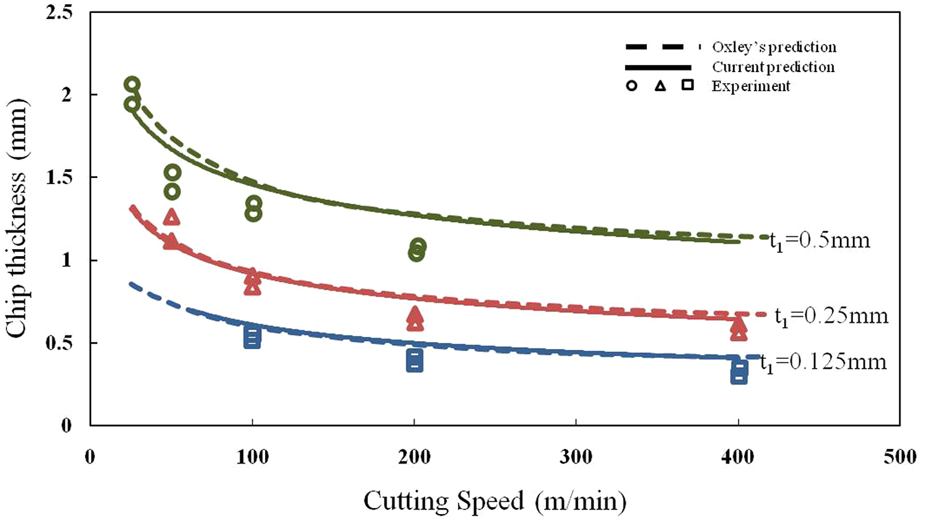
Chip thickness for 0.20% carbon steel: w = 4mm;
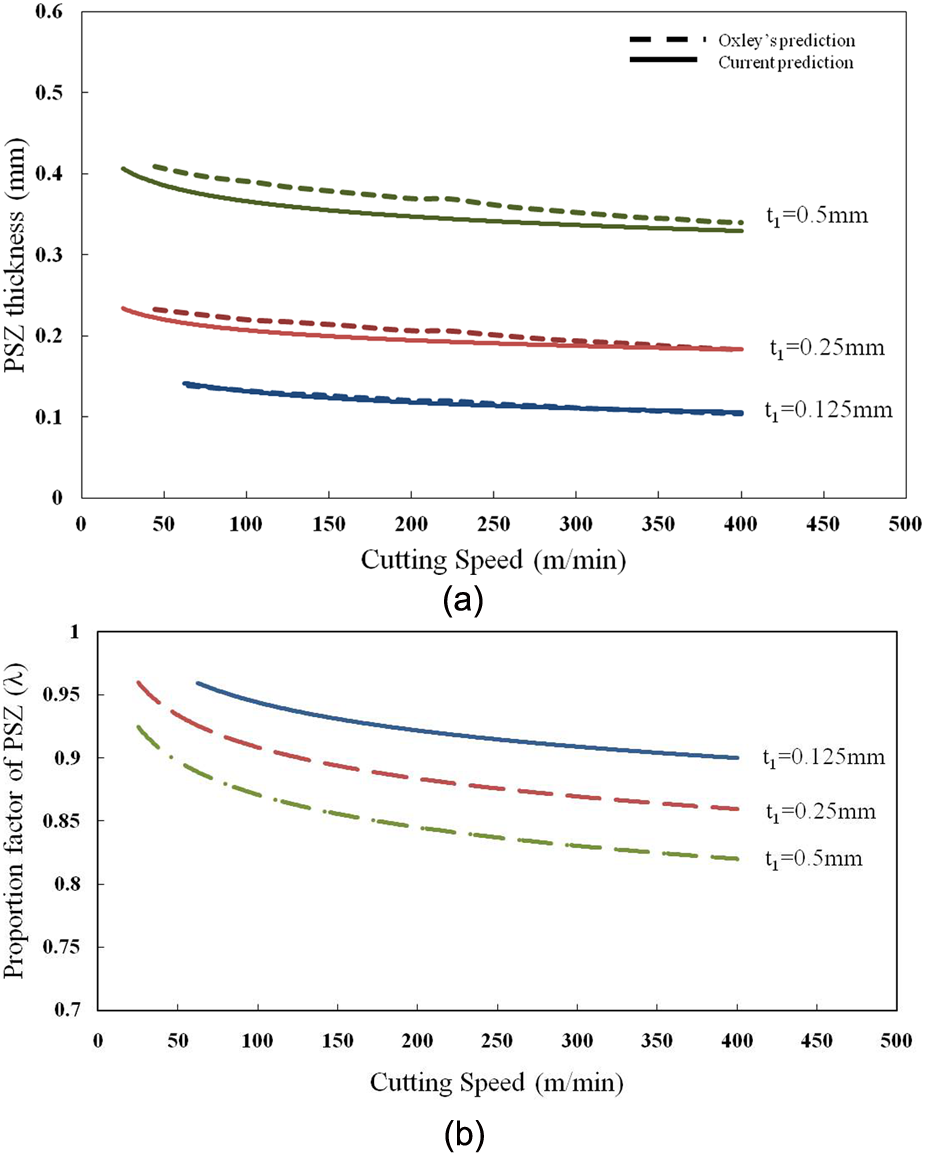
Predicted thickness and the proportion factor of the primary shear zone for 0.20% carbon steel:
Figure 10(a) presents the predicted thickness of the primary shear zone. Current predictions are quite similar to that in the Oxley’s study; they both decrease with the increase in chip load and cutting speed. However, in the current work the uncertainty about the location of the main shear plane is eliminated, it can be seen in Figure 10(b) that
Figure 11 presents the secondary shear zone thickness at various chip loads. As can be seen, the predicted values in the current work are lower than that predicted by Oxley’s model at low cutting speeds, and they tend to coincide at high cutting speeds, particularly for the high feed rate. The difference between the current and previous predicted results can be explained by the dependence of the secondary shear zone thickness on the extent of the further shear at the chip–tool interface. The more severe the shearing, the thinner the secondary shear zone. In order to balance the resultant force transmitted from the primary shear zone, the shear stress at the chip–tool interface
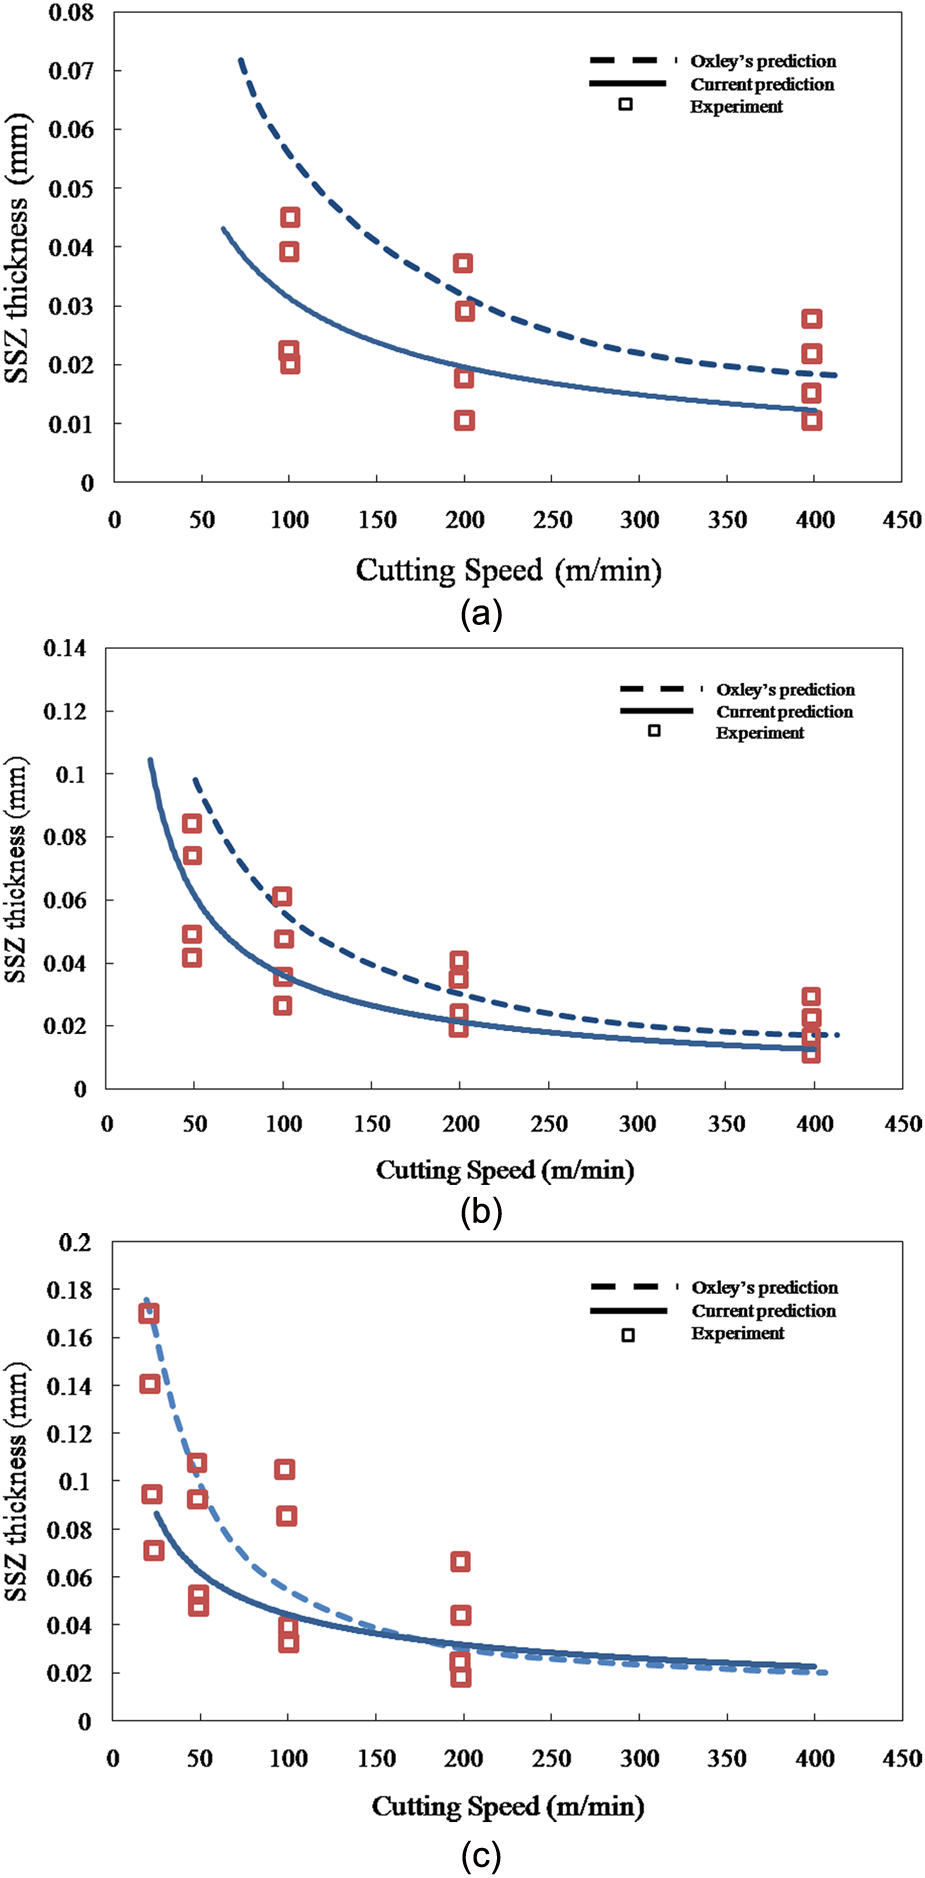
Secondary shear zone thickness for 0.20% carbon steel:
Figure 12 shows the predicted distributions of shear strain rate, shear strain and tangential velocity across the primary shear zone. As shown in Figure 12(a), the main shear plane AB is moving towards the lower boundary of the plastic deformation zone when cutting speed increases. Moreover, not only the average magnitude, but also the gradient of the shear strain rate and tangential velocity is increased, reflecting the fact that the time left for the gradual plastic deformation is less during cutting with the higher speed and the chip formation process tends to be localized at the main shear plane. On the other hand, the total shear strain at the exit boundary decreases with the increase in the cutting speed, as shown in Figure 12(b). In fact, the total shear strain is the accumulation of the local shear strains on all the layers across the plastic deformation zone. The lower cutting speed provides more time and space for the work material to respond to the external force, as can be seen in Figure 12(c). As a result, the width of the primary shear zone is increased by the decrease in the cutting speed, indicating that more material particles are involved in the plastic deformation and contribute shear strains to the total shear strain. Consequently, the developed strain energy is larger and the cutting energy needed to remove the material is higher. This can be reflected from the higher machining forces at lower cutting speeds.
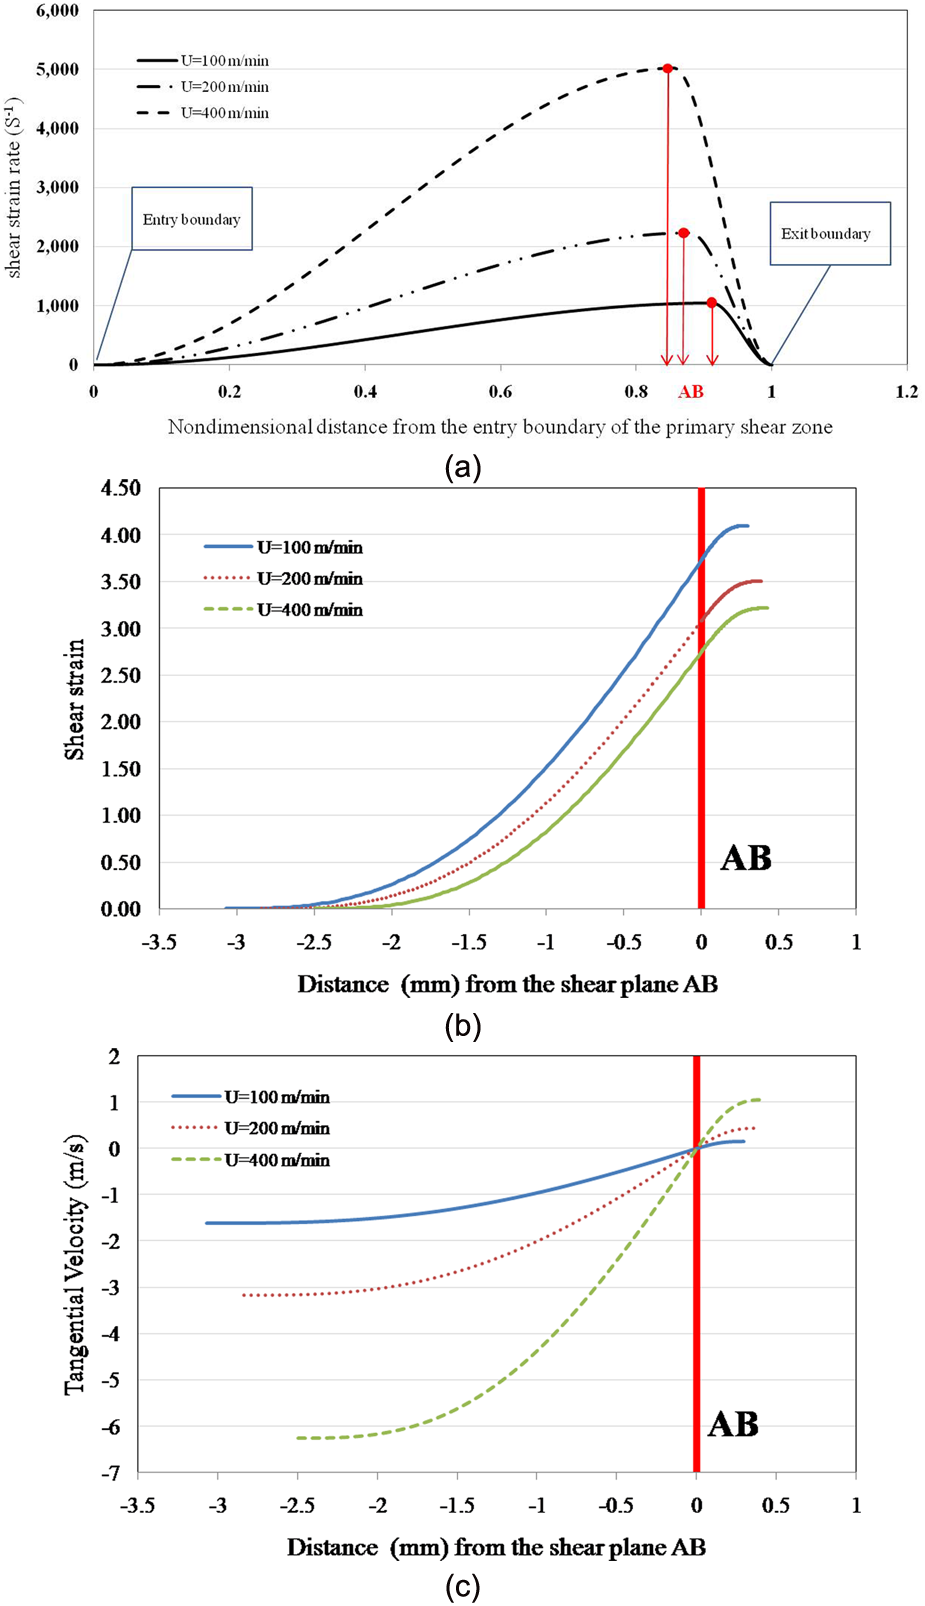
Predicted shear strain rate, shear strain and tangential velocity distributions across the primary shear zone for 0.20% carbon steel:
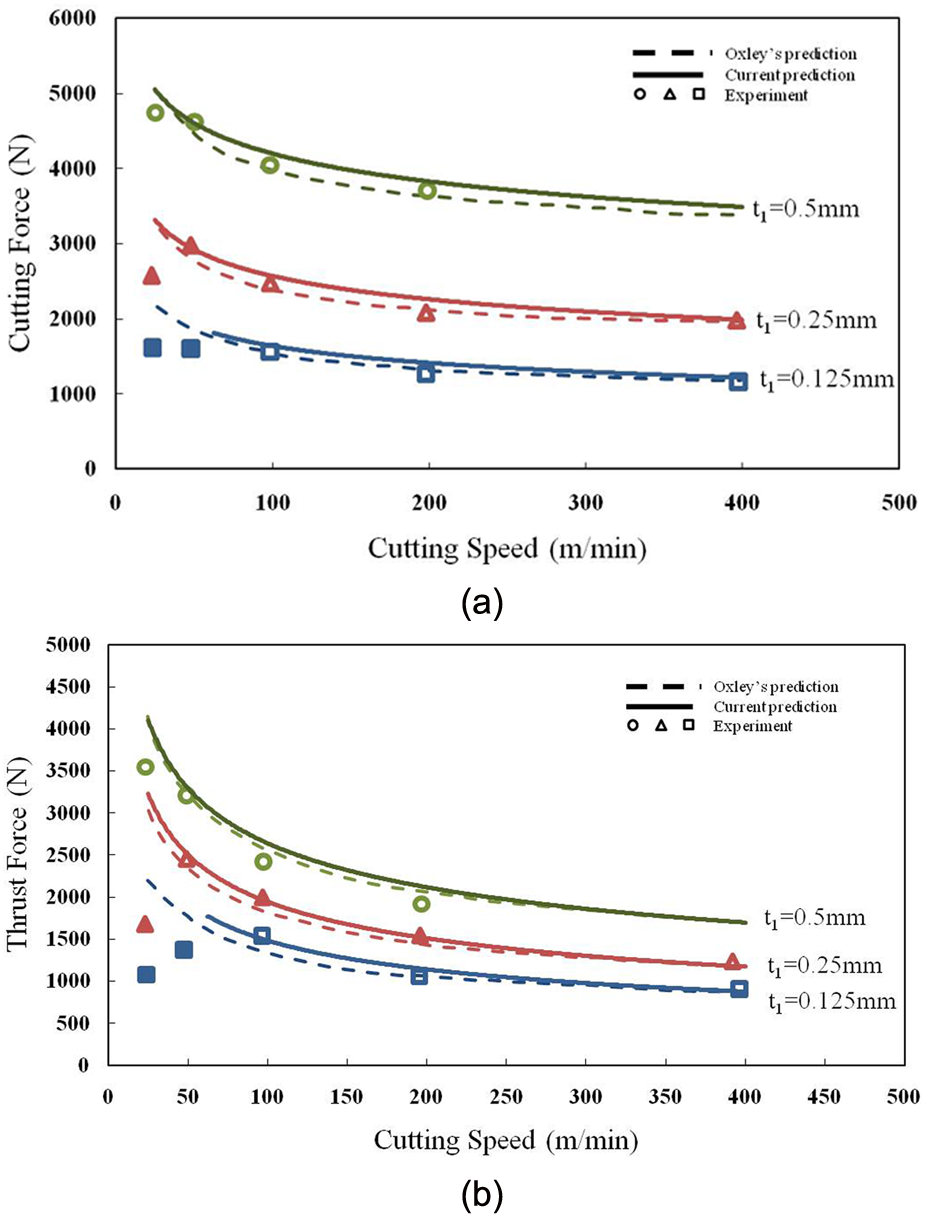
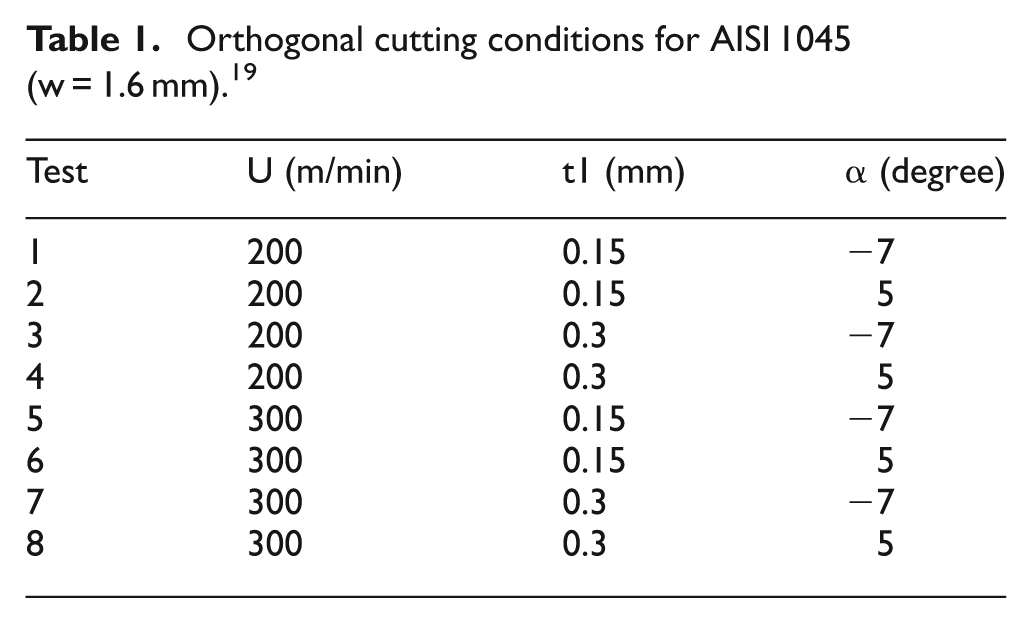
Furthermore, another set of data were selected from the experimental work done by Ivester et al., 19 to evaluate the effect of modifications under various cutting conditions. The cutting conditions are listed in Table 1. In their work, the orthogonal cutting tests were conducted from four laboratories using similar cutting tools. The upper bound (solid line) and the lower bound (dash line) of the measured forces are shown in Figure 13. It can be seen again, that no distinguishable difference can be found between the two models. One can see that the predicted cutting forces basically fall into the boundaries. However, most thrust forces are underestimated. This may be attributed to the assumption of the perfectly sharp tool applied in the current study.
Orthogonal cutting conditions for AISI 1045 (w = 1.6 mm). 19

Comparison of predicted machining forces with experimental data
19
for AISI 1045 steel:
Conclusions
In the current study, an attempt has been made to modify Oxley’s machining theory by considering the effect of shear strain, strain rate distributions. A more realistic bell-shaped strain rate distribution, through the primary shear zone, was proposed in an attempt to satisfy all the boundary conditions of the velocity field. The proportion parameter (
Footnotes
Appendix 1
Appendix 2
The boundary conditions needed for solving equations (19) and (20) are equation (6) and equations (12)–(18). It can be seen that equations (14) and (15) are satisfied by equation (19).
The gradient of shear strain rate through the primary shear zone can be expressed as
For
In order to satisfy equation (16)
Substitute equation (28) into equation (29)
In order to satisfy equation (13)
From equations (30) and (31), the constants
In order to satisfy equation (12), the shear strain rate at main shear plane AB can be obtained
Similarly, from equations (13), (16) and (18) for
Satisfying equation (12) by equation (27), the shear strain rate at AB can also be calculated as
The combination of equations (34) and (38) lead to the expression of
Considering
and
Finally, replacing
where
Funding
The authors would like to acknowledge financial support from Natural Science and Engineering Council of Canada (NSERC).