
Abstract
The concept of sustainable manufacturing is a form of pollution prevention that integrates environmental considerations in the production of goods while focusing on efficient resource use. Taking the industrial ecology perspective, this efficiency comes from improved resource flow management. The assessment of material, energy and waste resource flows, therefore, offers a route to viewing and analysing a manufacturing system as an ecosystem using industrial ecology biological analogy and can, in turn, support the identification of improvement opportunities in the material, energy and waste flows. This application of industrial ecology at factory level is absent from the literature. This article provides a prototype methodology to apply the concepts of industrial ecology using material, energy and waste process flows to address this gap in the literature. Various modelling techniques were reviewed and candidates selected to test the prototype methodology in an industrial case. The application of the prototype methodology showed the possibility of using the material, energy and waste resource flows through the factory to link manufacturing operations and supporting facilities, and to identify potential improvements in resource use. The outcomes of the work provide a basis to build the specifications for a modelling tool that can support those analysing their manufacturing system to improve their environmental performance and move towards sustainable manufacturing.
Keywords
Introduction
Manufacturing has traditionally been associated with undesirable environmental side effects. 1 Over the last four decades, the environmental burden linked to industrial activities has become an increasingly important global issue2–4 as well as a great challenge for our society.5,6 Manufacturing is deeply affected by these issues, and has a major role to play in addressing this sustainability challenge 7 as manufacturers are responsible for the transformation of resource inputs into useful outputs (i.e. products with economic value) with limits on efficiency owing to the laws of thermodynamics. 8
Various solutions have been developed to address these global environmental concerns, such as industrial ecology (IE), 9 green supply chain management, 10 product life cycle management, 11 corporate environmental management, 12 design for environment, 13 product-service systems 14 and many others.15,16 There are numerous factors playing a significant role in defining the requirements for the next manufacturing paradigm, such as increased product and systems complexity, growing environmental concerns, lack of knowledge integration and advances in technology. 17 Many researchers have worked on combining those topics using information technology (IT) to develop modelling and simulation tools that can capture and manage systems complexity. For instance, discrete event simulation has demonstrated the potential to support the analysis of interactions in complex systems for sustainability in manufacturing.18,19 There is also an increasing number of tools available to assess the life cycle impact of products and services, as well as companies’ environmental performance.20,21
In the last two decades, the concept of sustainable manufacturing (SM) has been developed under various labels (e.g. environmentally conscious manufacturing22,23 or green manufacturing 24 ) as a sub-concept of pollution prevention (P2). 25 The main objective of SM is to lower the environmental impact linked to manufacturing. Environmental activities have long been associated with a negative impact on business performance, but this assumption has been proved wrong by many researchers.24,26 An illustration of both the economic and environmental benefits of SM is apparent in the cost savings owing to energy reduction and waste minimisation.
Throughout the SM literature, the flow of resources in the form of material, energy and associated wastes reoccur. The material, energy and waste (MEW) flows must be interpreted in the widest forms to include, not just primary material conversion, but other inputs and wastes, such as water, consumables and packaging. Additionally, flows are typically considered in isolation within their functional boundaries. For instance, the joint analysis of energy usage in buildings and in manufacturing processes for environmental sustainability has only recently been investigated by various researchers.19,27 Conducting such combined analysis brings complexity that requires tools to support it across functional boundaries. However, tools enabling this type of analysis are not available. Therefore, there is a need for approaches to support and guide the development of such SM tools.
In this research SM is considered as a manufacturing strategy that integrates environmental and social considerations in addition to technological and economic ones. The work presented in this article focuses on environmental aspects and emphasises on-site solutions rather than ‘product life cycle’ or ‘product supply chain’ solutions. Using a biological analogy as promoted by the IE concept, an ecosystem view can capture the interactions within the manufacturing plant. This ecosystem view enables the study of interactions and interrelationships between components of a system and its environment.1,28–30 This research focuses on the MEW flows within a site to view the factory as an ecosystem and examines the approach by which the flows can be analysed and the techniques to support this. This approach and modelling techniques can be combined and used via the prototype methodology proposed in this article in order to improve the sustainability of manufacturing systems.
Research programmme
Aim and research question
The aim of the work presented is to develop a prototype methodology to guide manufacturers in the adoption of a systems view of their factory by focusing on the MEW process flows (modelling approach). Various modelling techniques are reviewed to identify those that can form the foundations for developing a tool to be used via the methodology proposed. This article focuses on the modelling approach and the prototype methodology, which feed into the specification of a tool currently being developed as part of a wider project.
The research question addressed is: how to adopt an ecosystem’s view of a factory using modelling of MEW process flows in order to move towards more SM? The work demonstrates that the integration of operations and facility systems can be achieved through modelling of MEW process flows and provides the prototype methodology for industrial application. Ultimately it provides support to approaching SM.
Research methods
The work was conducted in two main phases of description and explanation, followed by testing, as shown in Figure 1. Phase 1 is covered by ‘Manufacturing ecosystem modelling’ of this article and Phase 2 by ‘Techniques for MEW flow modelling’ and ‘Industrial case studies’.
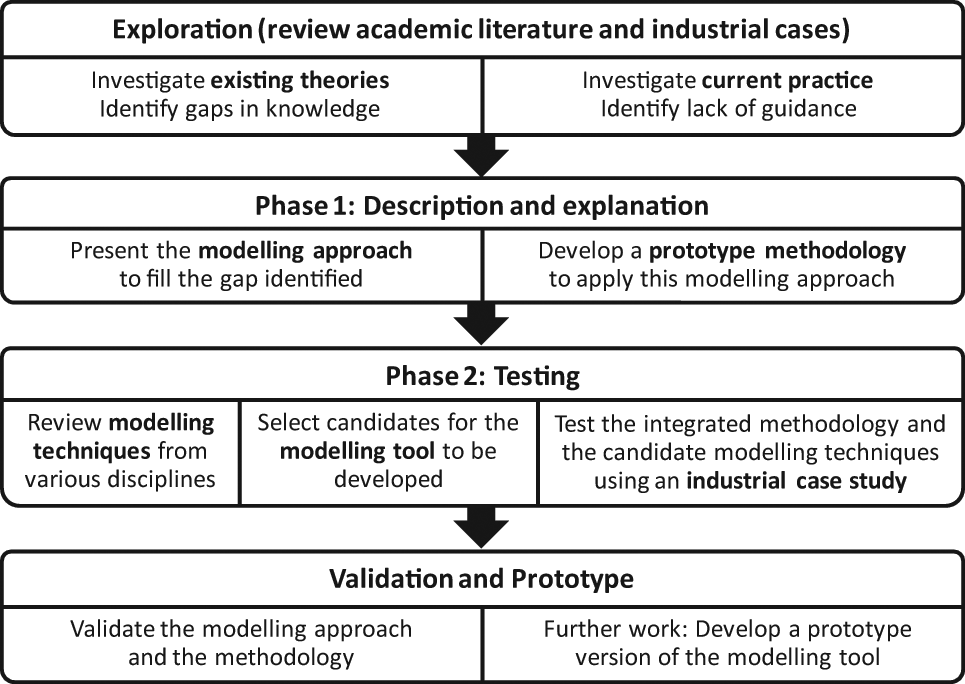
Research workflow: prototype methodology development (phases 1 and 2).
First, to gain a better insight into the current progress in SM, a literature review was conducted and industrial cases were collected using a broad set of search keywords. Owing to the exploratory nature of this research, not only academic journals were used, but also commercial and governmental websites. While there are numerous reported cases of SM practices illustrating what was achieved, few, if any, provide details on how these improvements were identified. 31 The literature review and case collection formed the foundation for the development of the modelling approach presented in this article. The research aims to bridge the gap between existing sustainability concepts applicable at factory level and to guide manufacturers towards a more sustainable practice by providing a modelling approach that captures the MEW flows throughout the manufacturing system and supports the adoption of a manufacturing ecosystem view of the factory. The modelling approach developed contributes to the specification for the development of a modelling tool to help manufacturers identify potential improvements in their activities.
Second, the review of currently available modelling techniques was conducted covering various fields of complex systems modelling. These modelling techniques were then categorised and compared, and potential candidates selected to test the initial steps of the modelling methodology in an industrial case study. The criteria for selecting the case included the energy intensity of the process (and therefore the potential for significant savings), the inclusion of a production process and its supporting facilities, and the incorporation of multiple MEW flows. Through the application of the modelling approach, the strengths and limitations of various existing modelling techniques could be understood, which helped work towards the specification of a modelling tool that could effectively capture the MEW flows.
Manufacturing ecosystem modelling
Existing modelling techniques may cover the physical building, product flows between machines, the timing of process flows, etc. But none covers all aspects to account for all MEW flows, intermittency of processes and spatial dimensions. In this section, a modelling approach and associated methodology are proposed to adopt an integrated systems view of a factory to view it as an ecosystem in a sustainable context. It combines various techniques that could potentially form the modelling tool being developed in the context of a larger project of which this research is part.
Modelling approach
The literature review revealed that most efforts in the field of SM are concentrated around product design, technologies, the ‘Rs’ strategies (reduce, reuse, repair, remanufacture, recycle, etc.) and supply chain management rather than the manufacturing system itself. Most approaches fail to consider MEW flows throughout operations, facility and buildings systems. They also fail to recognise the value of wastes as they can be reused within the system rather than being treated as losses to the manufacturing system. While material waste would not normally be consumed within the system that created it, it is possible that energy waste could. For example, heat being produced by chillers could be used to pre-heat water for a separate application.
IE was introduced as a shift from the ‘end-of-pipe’ approach to the P2 approach.5,32 The ‘end-of-pipe’ approach is a metaphoric version of pollution control, which allows ‘correction’ of pollution by cleaning up, installing wastewater treatment facilities downstream of the source of pollution or filtering emissions from industrial unit chimneys. Interpretations of P2 diverge, whether taken from the IE or the cleaner production (CP) perspective:16,32–34 In CP, P2 aims at reduction or avoidance of undesired outputs (wastes to be disposed of), whereas IE additionally considers the possibility of exploiting those same wastes as a resource somewhere else. Other differences are physical and time boundaries of the system: CP focuses on intra-enterprise (micro-level) and preventive process-oriented measures developed after the design phase, whereas IE is a system-oriented approach (inter-enterprise or macro-level) that integrates environmental concern in the early stages of the product’s life cycle and focuses on closing the loop of resource flow within the system. Aside from preventive and cleaner technological solutions proposed by the CP approach, IE requires a highly multidisciplinary approach 35 and fundamental paradigm shift for the move towards sustainable development. 36
The modelling approach presented in this section was developed under the influence of IE. The material life cycle model shows the value of material as it flows through the technosphere (Figure 2). This embedded value is conceptually described as the economic value of material as it is converted from raw form to components, then into assembled products (i.e. economically valuable goods) before deteriorating in use. Energy must be consumed to take material to another state, whether it is adding value or not. The material life cycle model also shows how this value can be retained by closing the loop using the shortest path. The ‘Rs’ strategies have been developed to show the various possible paths to close the loop and can be mapped against the life cycle stages to highlight how value changes depending on the path taken to close the loop. 37
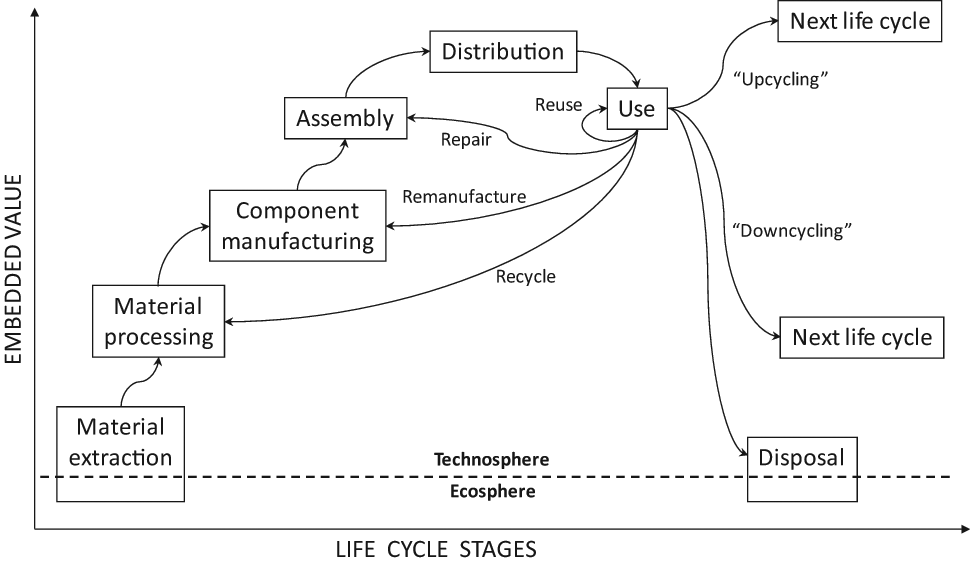
Material life cycle model with the ‘Rs’ strategies for keeping the value.
The first and most desirable options are to minimise the consumption of resources during the use phase and to extend product life span through reduce and reuse. No resources are needed to apply these strategies. Then repair and remanufacture extend the life span of the product or parts of the product by going through one or multiple processes. Some resources are consumed to achieve closed-loop circulation of material using these strategies. Recycle is closing the loop of material by taking a longer route. Typically, recycling results in losing some of the value as it requires even more energy to be consumed to restore the material to a finished product. Therefore, companies are increasingly reusing and remanufacturing components rather than recycling them, thereby making economic savings and ‘keeping the value’. Other options exist in addition to these ‘Rs’ strategies. Following product use, energy could be used to recover the value in material to give it a second life by creating an even more valuable product (upcycling) or a product that still retains some value (downcycling).
The work reported in this article focuses on the factory level and, therefore, encompasses component manufacture and assembly. Manufacturing operations are part of a systems view that integrates three sub-systems: manufacturing operations, supporting facilities and the surrounding buildings. This integration is achieved by using the MEW flows that link these sub-systems as per Figure 3. The MEW flows within and between these sub-systems are crossing functional boundaries and, therefore, promote an ecosystem view of the factory, as well as a factory-wide analysis. With this perspective in mind, the aim is to reduce the overall input (associated with resource depletion) and undesirable outputs (waste and pollutants) of the complete system, rather than the efficiency of individual components of the system. In addition to classic prevention and technological measures, the material life cycle model also provides an effective way to improve resource flow: closed-loop circulation of the resource within the system using the shortest path.
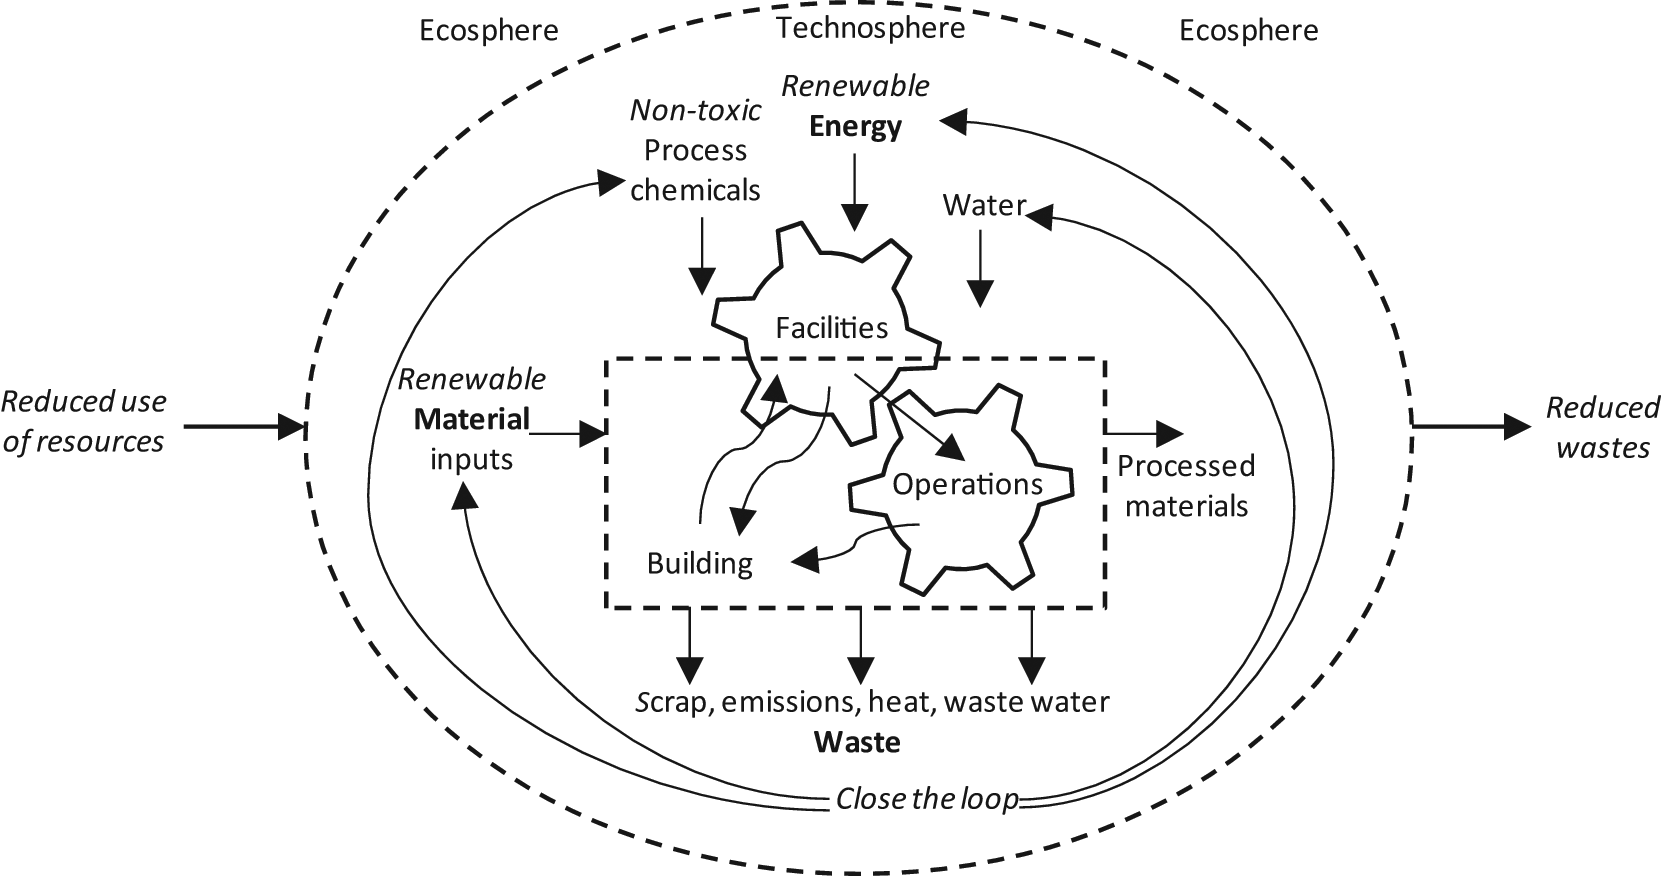
Manufacturing ecosystem model with the three subsystems based on IE.
This modelling approach (Figure 3) provides a systems view of a manufacturing plant to support the identification of improvement opportunities in the resource flows through the system. It takes into account the manufacturing processes/operations, the supporting facilities and the surrounding building, as well as the flows linking all those system components. In order to adopt such a perspective on a manufacturing system, a modelling methodology that combines a modelling approach with supporting modelling techniques is required. Such a methodology is described in the next section.
Prototype methodology
The methodology proposed in this section (Figure 4) is based on industrial process flow/energy analysis by Brown and Shah 38 in the context of CP. Their analysis is composed of six steps.
Conduct plant walkthrough.
Develop a process flow diagram.
Complete an energy and mass flow balance for each process.
Prepare a profile of energy, energy costs, and waste by process step.
Develop process performance parameters.
Assess process improvement opportunities.
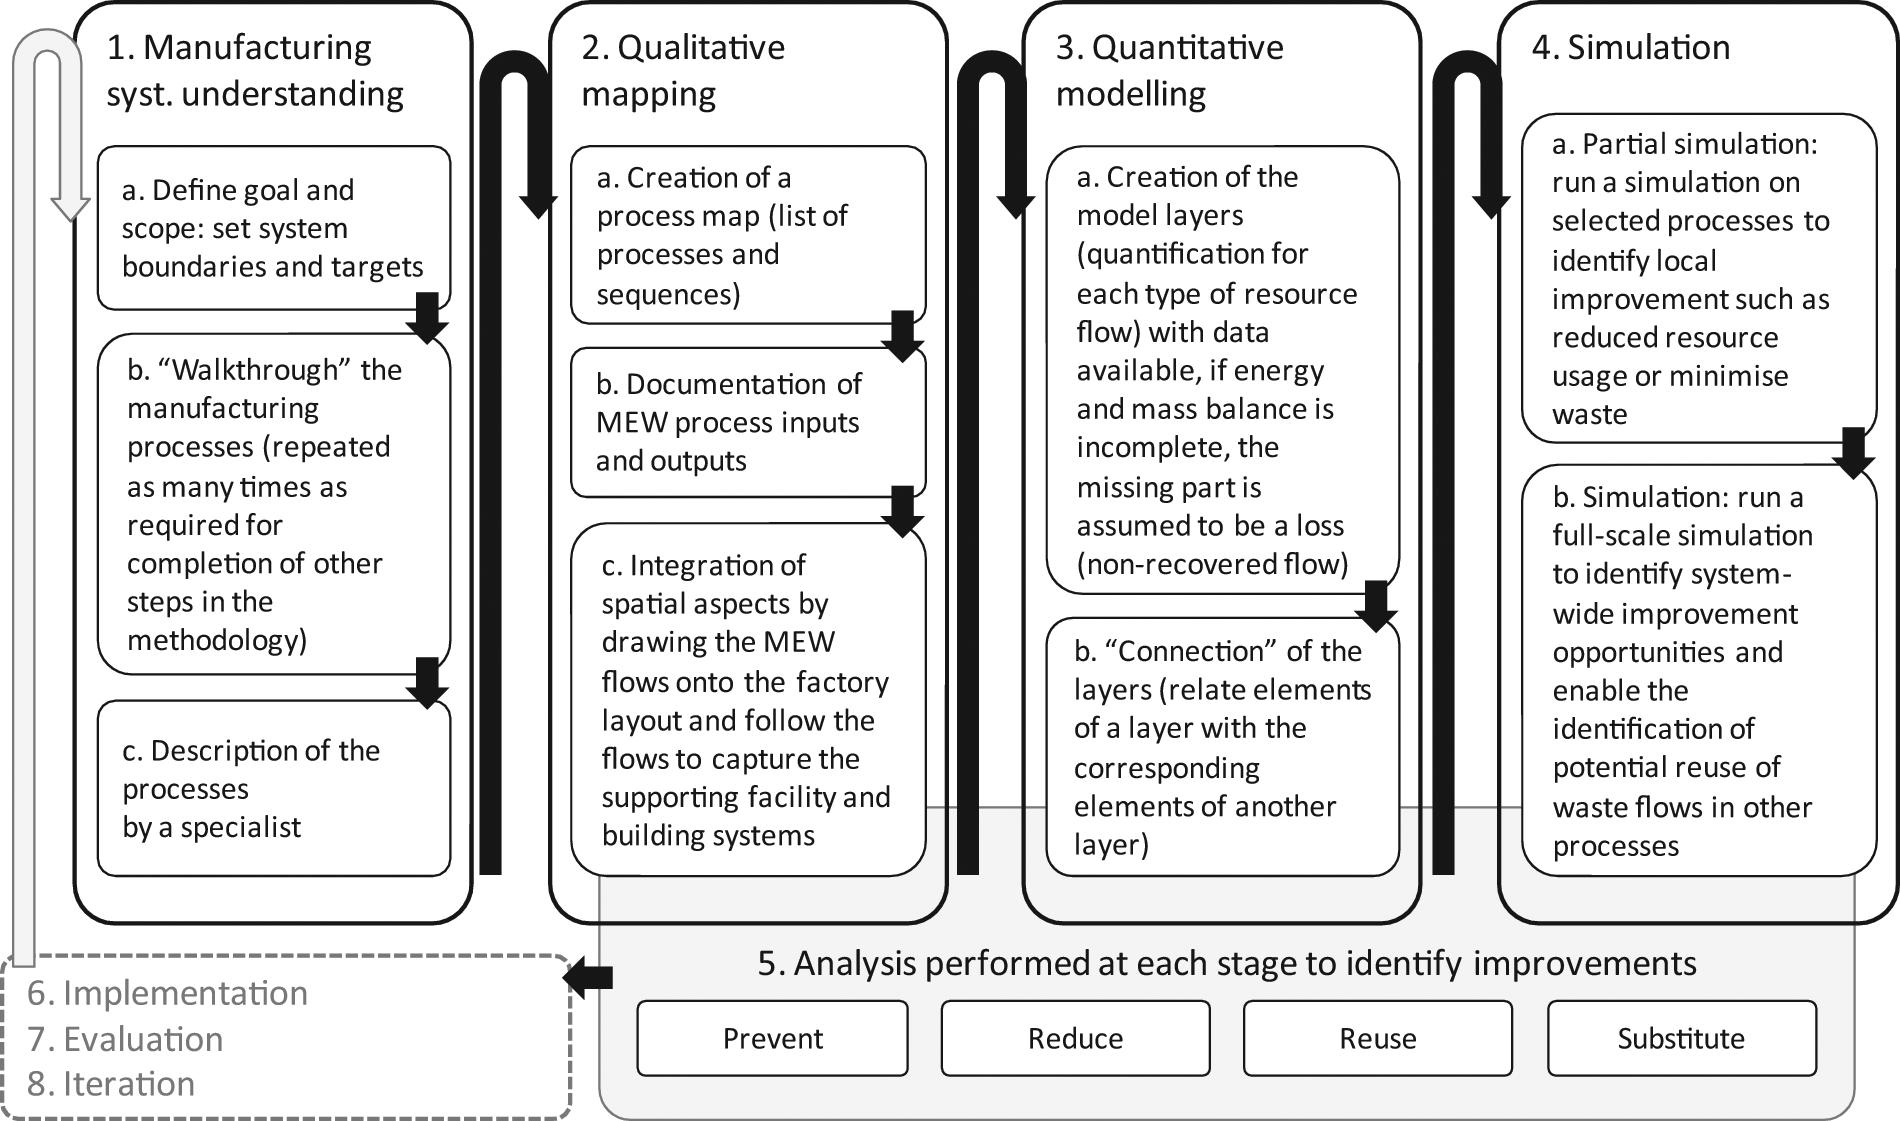
A prototype methodology to identify improvements using the modelling approach.
This process flow/energy analysis includes the waste streams, such as stack emissions, heat losses (unrecoverable) and heat waste (recoverable), solid waste and wastewater. It gives a ‘snap-shot’ picture of the manufacturing operations.
This methodology has been adapted to support the application of the modelling approach described in the previous section, and to incorporate an analysis that supports the identification of improvements derived from the ‘Rs’ strategies: the Brown and Shah 38 methodology has been modified to bring together the IE approach of closed-loop circulation of resources and the CP perspective on industrial systems (micro-level, gate-to-gate, or intra-enterprise).
The first step of the prototype methodology is to define the system and set targets. Examples of targets are CO2 reduction, energy savings, energy cost reduction, water preservation or waste reduction. In this first step, a ‘walkthrough’ and detailed description by a specialist are conducted to gain a deep understanding of the processes selected for the analysis (step 5), which is carried out in parallel to steps 2–4. Typical examples of a system boundary definition are delimited by a production line, a physical area of the factory, such as a single building, or a specific process with multiple pieces of equipment or machines. Ideally the system would correspond to the complete factory and the flow map would stop at the factory gate. This is achieved through iteration where subsystems are put together until a complete model of the factory is obtained.
The second step is qualitative mapping. It guides the manufacturer in mapping the system previously defined. In this step of the methodology, the technological components (i.e. processes and equipment) are mapped against the factory layout to integrate spatial aspects into the model. The list of processes and equipment, as well as their sequence for various flows, are also defined: the most common way of defining the process sequence is to follow the product flow, but other sequences must be defined to follow the utility flows, such as compressed air, steam and cooling water. Inputs and outputs are documented so that each flow clearly links to the processes it goes to or comes from. This particular focus on the flows is crucial as MEW flows are not simply inputs and outputs of processes, but entities themselves. This modelling approach brings to light the links and interactions between processes across functional boundaries and enables the user to adopt an ecosystem view of the system studied. In this second step, a coarse analysis (step 5) is carried out to check for improvement opportunities in removing unnecessary elements or replacing them for more efficient ones (based on best available technology and best practice).
In the third step, the quantitative model is created by inputting process data, i.e. metered data and characteristics of resource flows and technological components. The elements modelled are the buildings, the technology components placed in and near the buildings, and the resource flows linking all elements of the model (inputs: energy and material including water and chemical; outputs: product and wastes including physical waste accumulating in bins as well as energy waste mostly in the form of heat). All elements of the system must be characterised by process data. Table 1 shows the list of model process data and the corresponding sources (right-hand column). To enable the analysis and identification of improvement opportunities (step 5), some process data are defined as constraints to determine the minimum requirements (inputs quantity and quality) for the manufacturing processes to achieve their function correctly (product output quantity and quality): mainly production schedule and set points. Additional variables characterise the technology components: capacity or equipment rating, running load (including the minimum demand or base load, and maximum demand or peak load), the performance or efficiency curve (ratio output/input as function of running load), etc. Optional information can be added to increase the quality of the analysis, such as equipment age (depreciation time), operating cost, etc. This stage of the analysis mainly identifies local improvement opportunities to prevent and reduce the use of resources, increase efficiency and reduce waste.
List of process data for modelling and sources of data.
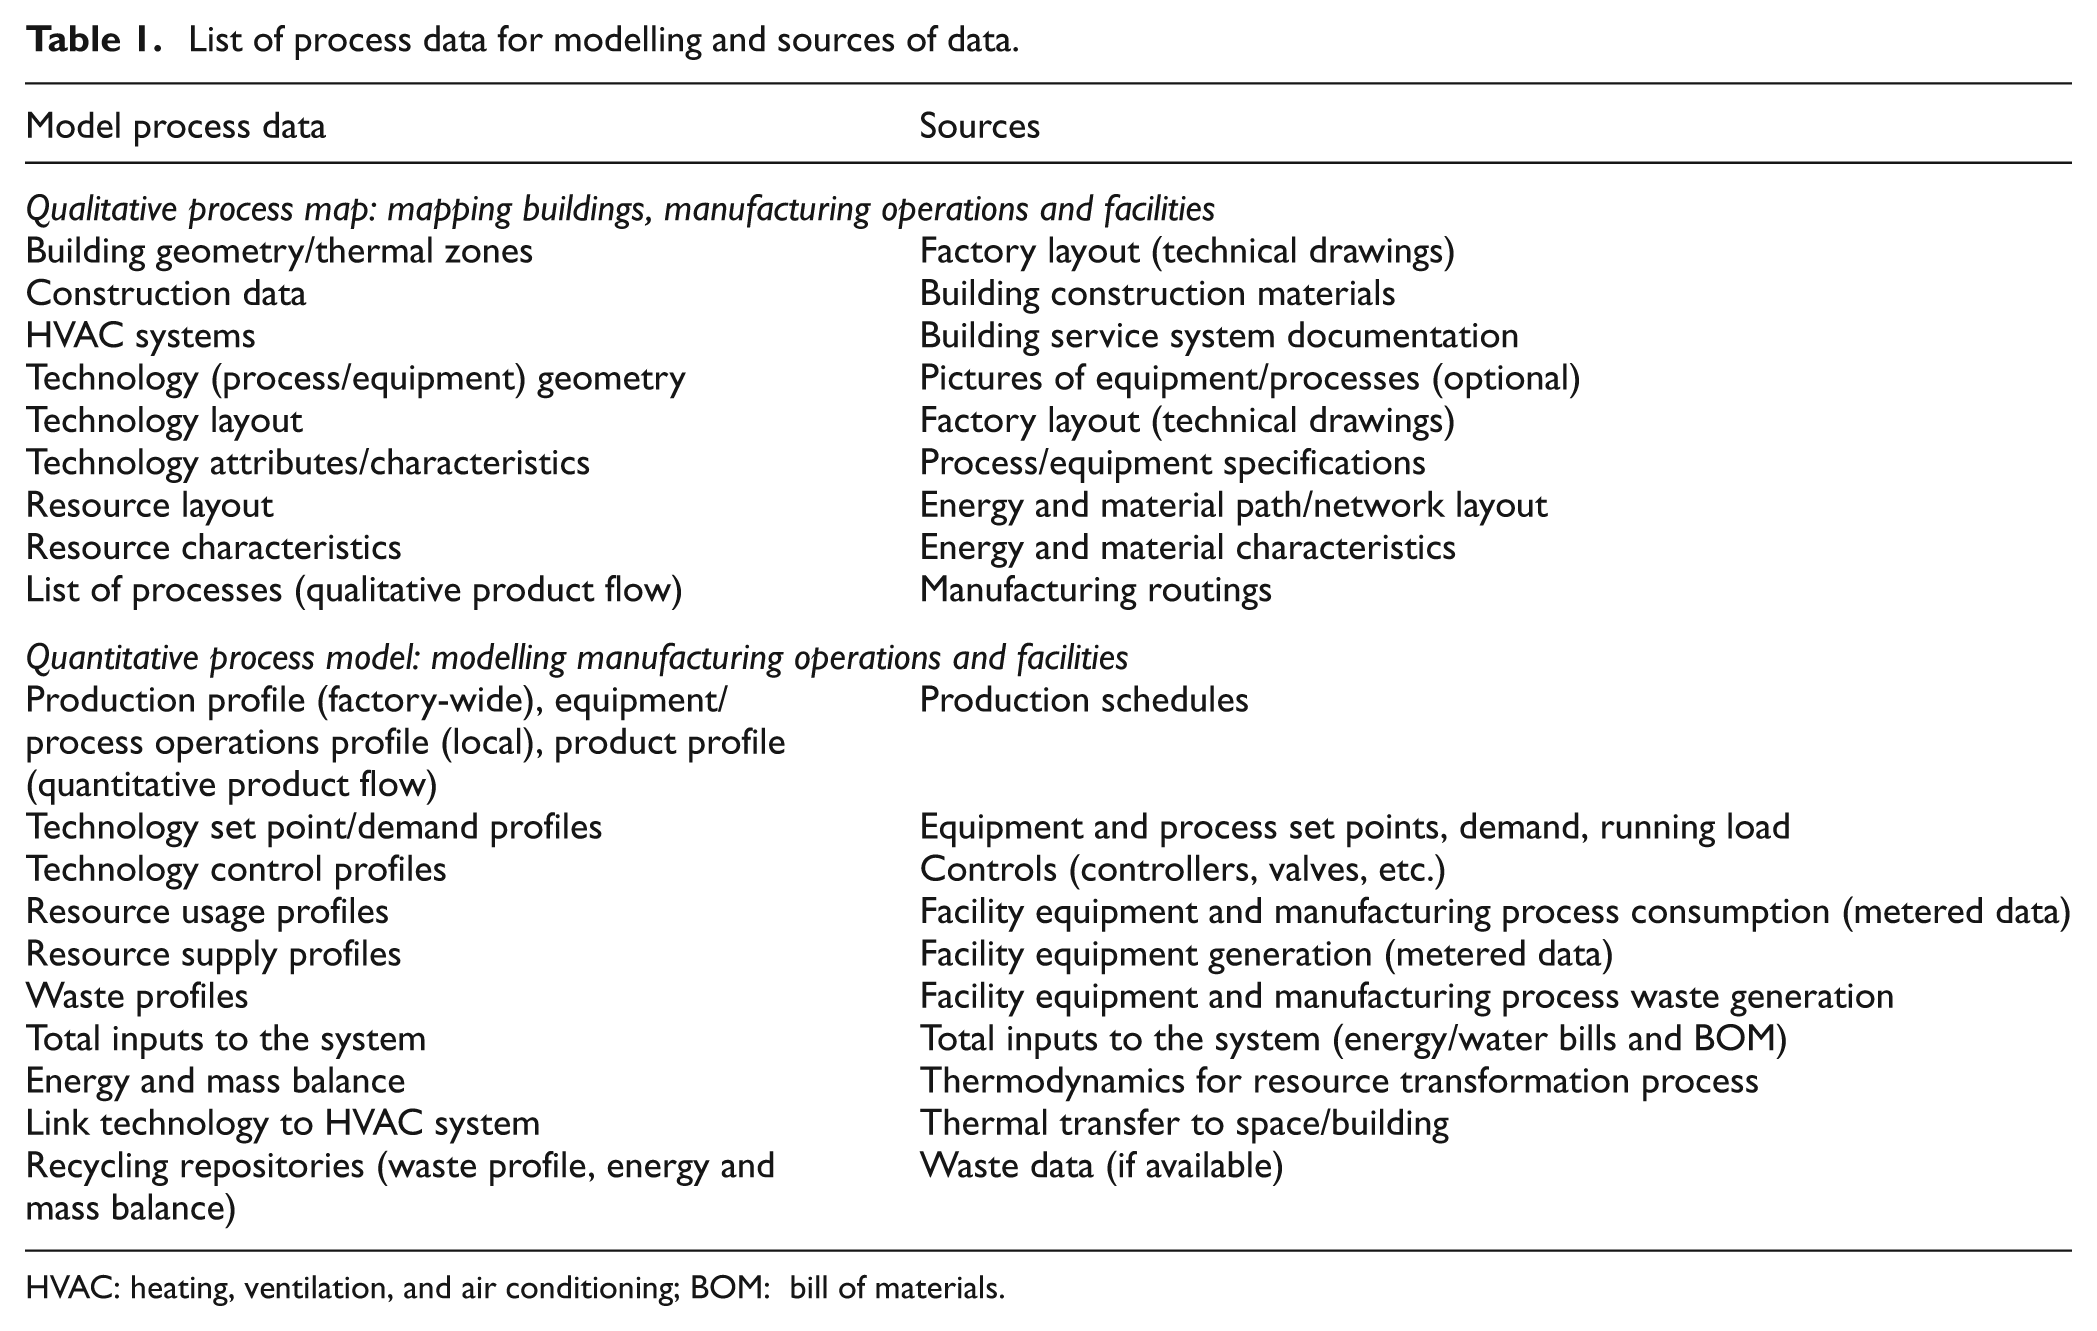
HVAC: heating, ventilation, and air conditioning; BOM: bill of materials
In the fourth step, the process data are used to simulate the system’s performance. The analysis (step 5) identifies factory-wide improvement opportunities with reduction in resource use by following a chain of constraints from process to process or potential reuse of waste output from one process elsewhere in the system.
This prototype methodology has been tested in case studies. Modelling techniques were reviewed and candidates selected based on fulfilment of requirements for a modelling tool (as stated in the next section) and their representational abilities. The analysis of the process data was also applied to test the capability of the methodology to identify improvement opportunities for various processes.
Techniques for MEW flow modelling
In this section the requirements for the tool to be developed from two different perspectives (user and developer) are first detailed. Then, available modelling techniques are reviewed and compared based on their suitability for the application of the manufacturing ecosystem model presented in Figure 3.
Requirements for a modelling tool
Candidate modelling techniques need to capture the MEW flows through the operations, facility and building systems to highlight wasteful output flows and potential for links to the inputs of another activity, thus promoting the understanding of a wider systems view rather than functional operations.
From a user perspective, the techniques must be flexible enough to allow access by non-experts. Generally, data collection is a costly activity, thus it is important that the techniques handle different levels of granularity in the data so that only data sufficient for analysis is collected rather than default detailed data required before starting the analysis. It is common that the consumption of different types of resources are measured at different levels. For instance, the total resource use (water, gas, electricity, chemicals, etc.) of a manufacturing plant may be known based on the consumption bills, but only gas and electricity is metered inside the manufacturing system, and again, electricity could be metered at a more detailed level than gas owing to supply to different facility networks. Another important characteristic required of the modelling techniques is their ease of use and understanding. Different people with different backgrounds (industrial engineers, energy managers, environmental specialists, etc.) must be able to work with these techniques without extensive training.
From a developer perspective, the techniques must be well-structured to enable software development using a set of simple rules, codes and languages. Should there be a combination of tools then compatibility and convertibility of constructs of some techniques need to be achieved. If two techniques take different perspectives, the models created might be difficult to combine by associating elements of one model with those of the other. For instance, the IDEF0 technique will map the functions of the system rather than the physical manufacturing operations and thus it might be unclear how its elements can be related to elements within manufacturing operations specific tools, such as value stream mapping (VSM).
Modelling techniques review
There are numerous techniques and tools for modelling manufacturing systems. Advances in IT over the last 30 years have enabled the development of more powerful and more complex computer tools. This section summarises the comparison analysis of groups of techniques to determine their strengths and weaknesses.
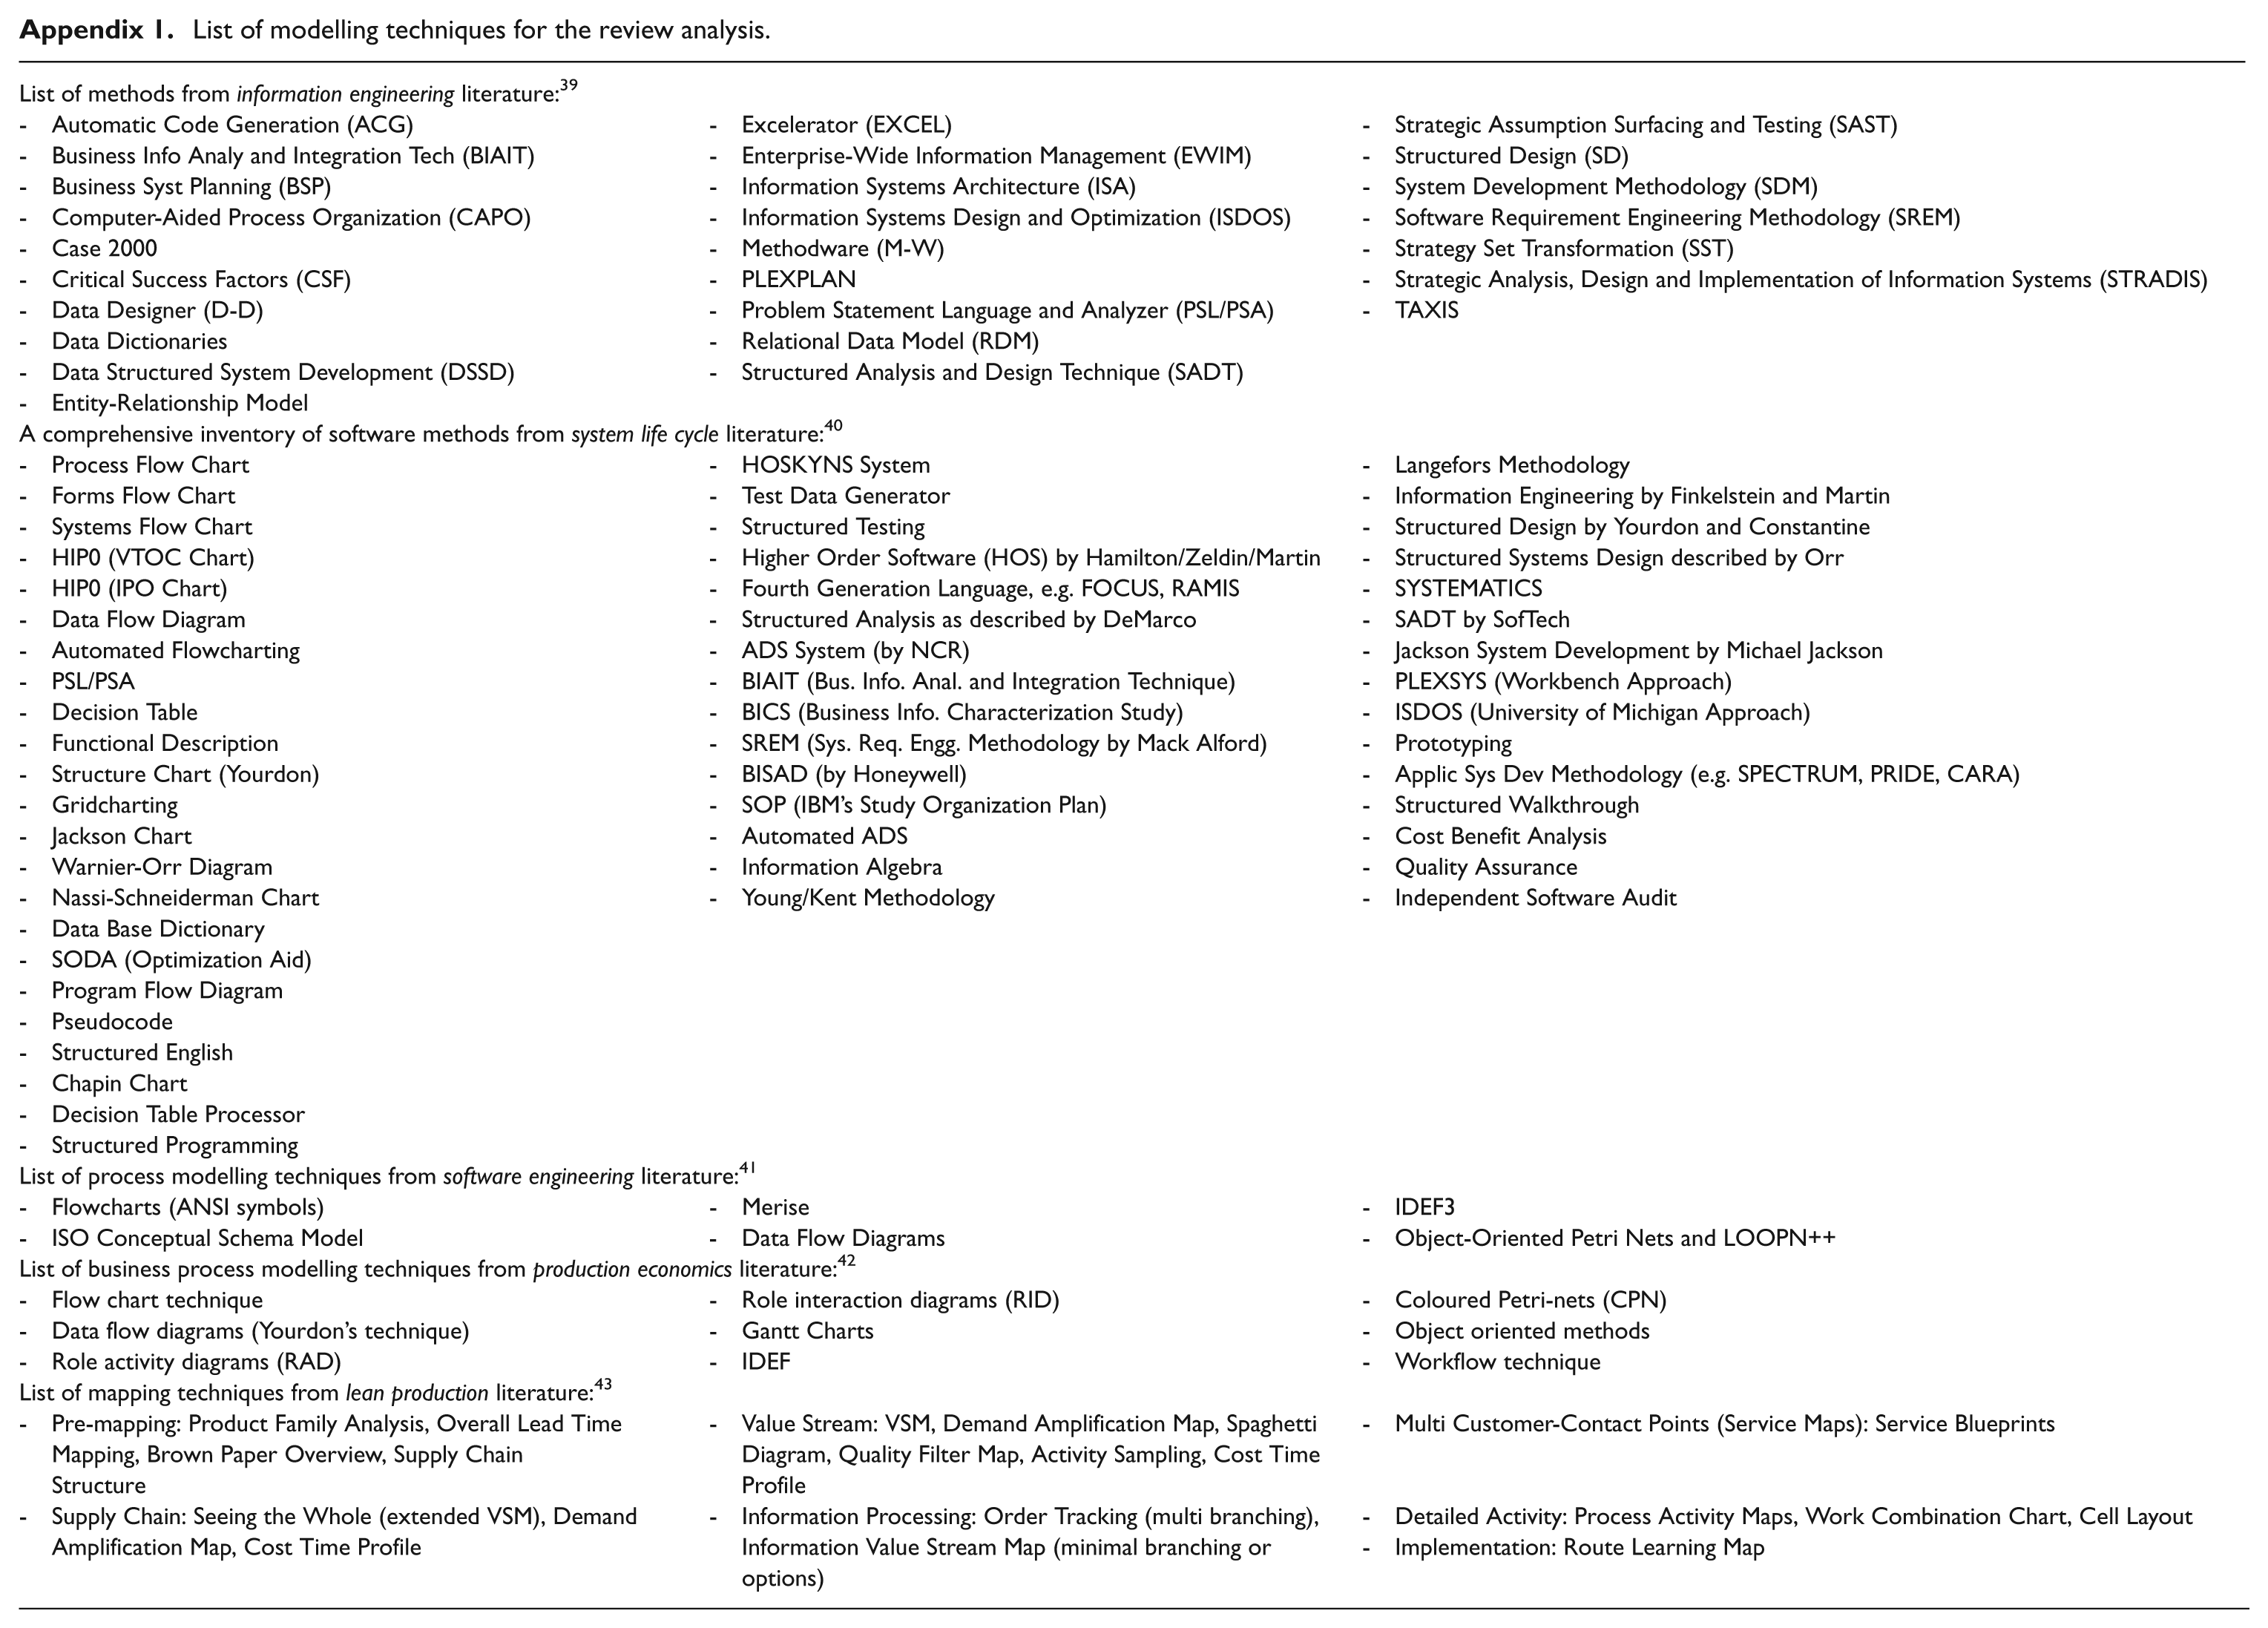
First, lists of tools and techniques were collected from the literature in various disciplines: information engineering, 39 system life cycle, 40 software engineering, 41 production economics, 42 and lean production literature. 43 These lists can be found in the Appendix. The authors did not try to modify or extend them. The lists have been taken as is from the literature, which explains the possible different wording interpretation for similar items. The objective was to show the range of tools and techniques currently available for complex system modelling.
After a preliminary analysis of these lists, tools and techniques were categorised into groups according to their representational characteristics (ability to represent certain elements and perspective taken).
Raw data exploitation.
Flowchart techniques.
Physical layout flowchart.
Quantitative flow map.
Planning and scheduling.
Information flowchart.
Functional flow diagram.
Architectural view.
The groups of modelling techniques were then compared based on their construct (formal code, structured language or free-form, flexible design), the possibility to adjust the level of detail, and the ease of use and compatibility with other techniques. The techniques were also assessed with respect to their capability to represent specific items, such as manufacturing processes, supporting facilities (boilers, compressors, chillers, storage), process characteristics (efficiency, duration, location, temperature/pressure/humidity set points) and input and output flow dynamics based on metered data (inputs: raw materials, electricity, gas, water, steam, compressed air, chemicals; ‘desired’ outputs: components or products; ‘unwanted’ outputs: waste heat, solid waste, wastewater, steam, compressed air). Other aspects were considered but not included in the comparison analysis.
Organisational units: company structure, responsibilities of individuals, authorities, department cells, work centres, etc.
Control mechanisms: events, triggers, decisions, controls, etc.
Information resources: knowledge, information, data, etc.
Human resource: behaviour, skills, physical/intellectual competencies, etc.
Environmental impact: toxicity, global warming potential, resource depletion, biodiversity loss, etc.
Economic performance and financial resources.
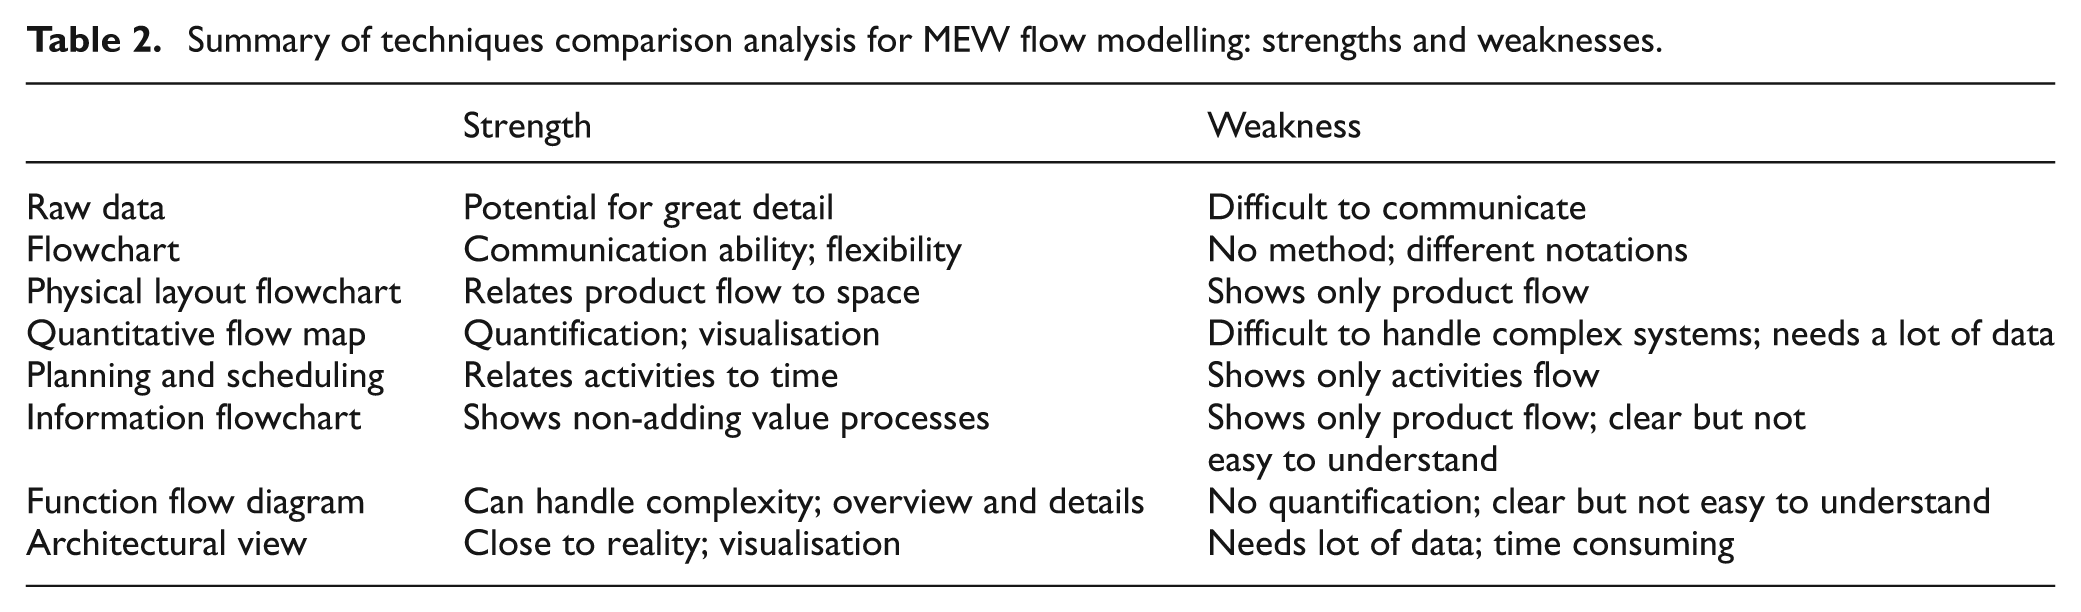
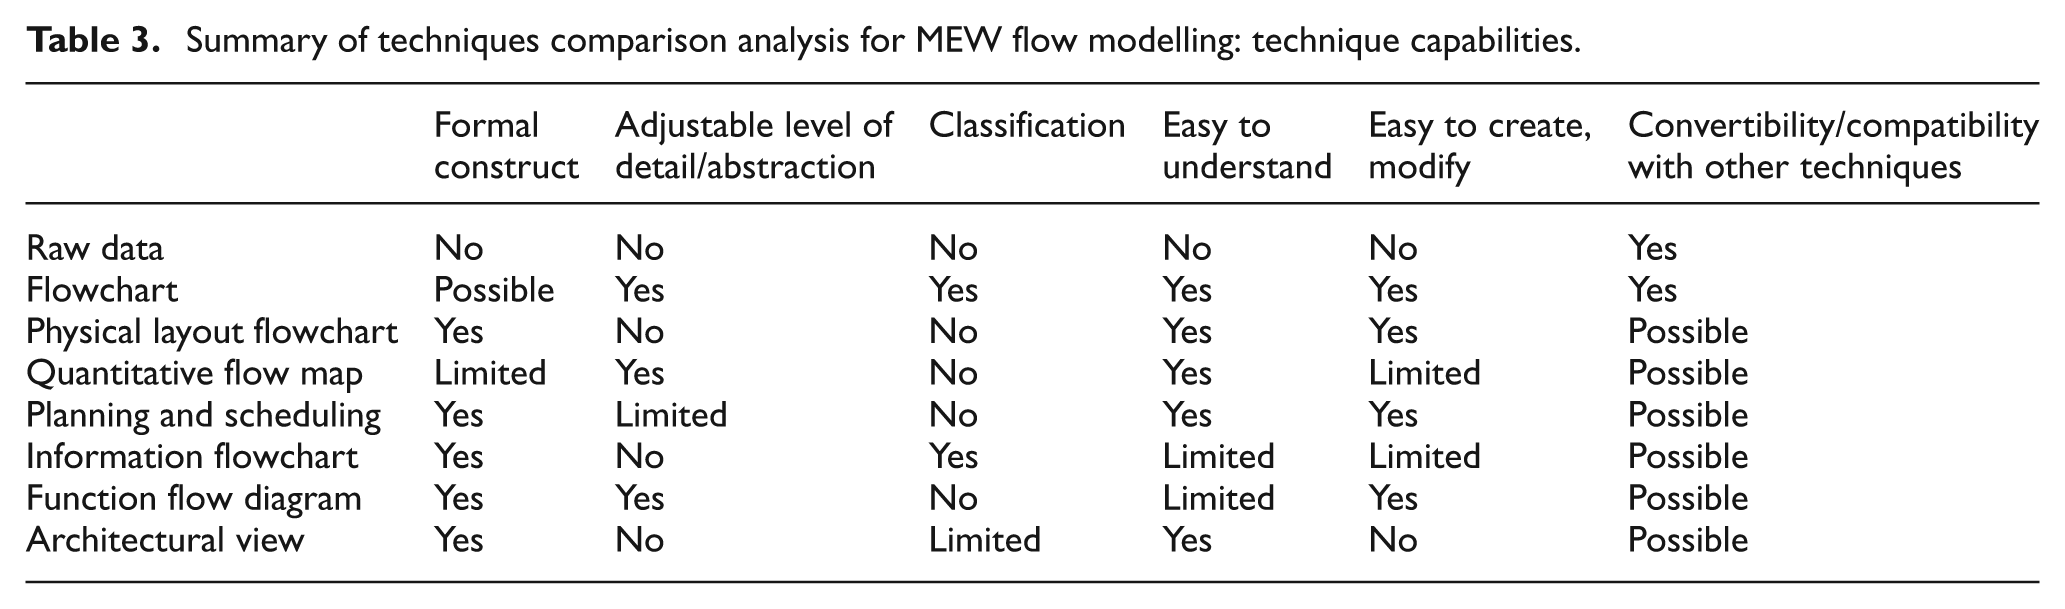
It is important to note that this analysis was done in the context of manufacturing system modelling. The results of this comparison analysis are summarised in Tables 2, 3 and 4.
Summary of techniques comparison analysis for MEW flow modelling: strengths and weaknesses.
Summary of techniques comparison analysis for MEW flow modelling: technique capabilities.
Summary of techniques comparison analysis for MEW flow modelling: represented items.
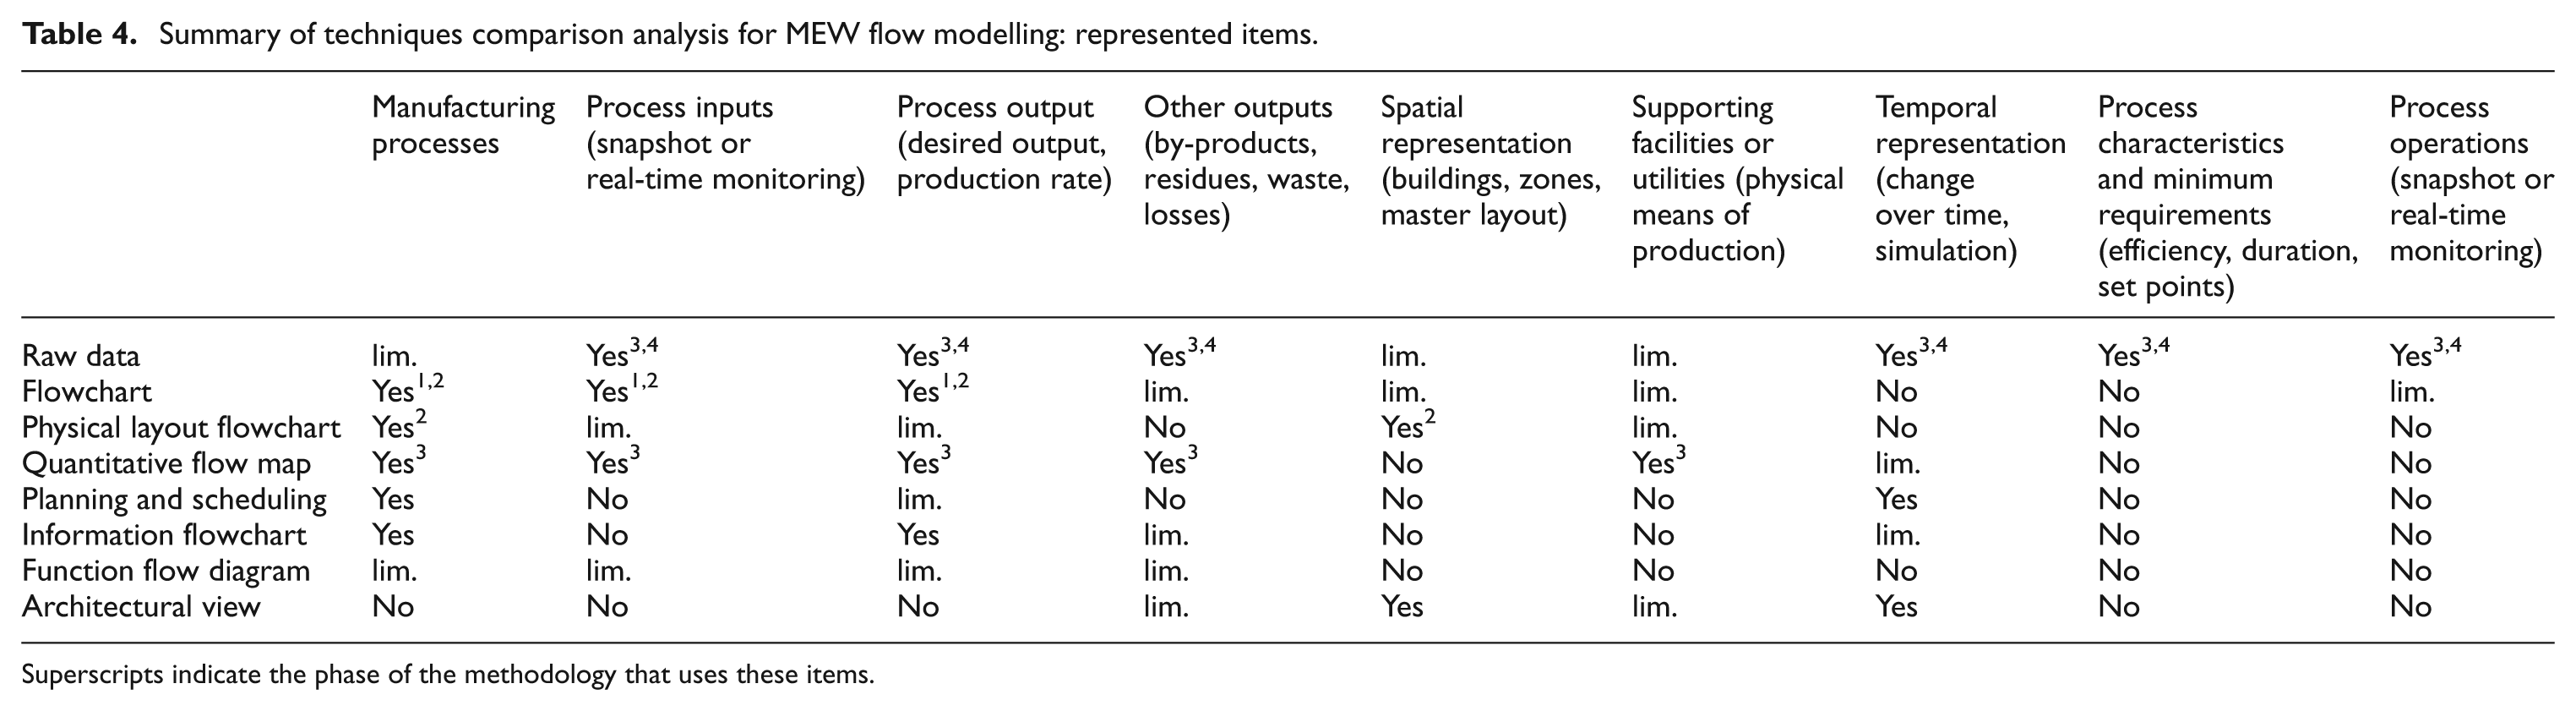
Superscripts indicate the phase of the methodology that uses these items.
The tables presented contain no single candidate technique, or obvious groups of candidate techniques, to support the modelling approach presented in ‘Modelling approach’. To form the modelling tool desired, qualitative then quantitative modelling of MEW resource flows over time is required. One potential cluster of techniques was the combination of raw data, basic flowchart, physical layout flowchart (spaghetti diagram) and quantitative flow map (Sankey diagram). An industrial case was used to test the modelling approach and associated methodology and to assess the suitability of these modelling techniques to perform the stages of mapping and analysis.
Industrial case studies
The modelling approach and prototype methodology were applied to manufacturing processes in an industrial system in order to test the steps of the methodology, as well as the applicability of various modelling techniques. This section shows that the use of a combination of techniques can represent all elements of interest to support the identification of improvement opportunities. The flowchart technique can represent the resource flows through the manufacturing system while Sankey diagrams highlight where losses or wastes are occurring. The simulation helps to capture the intermittency of demand and supply, the relationship between inputs and outputs at factory level, and enable the identification of improvement opportunities.
The five-step prototype methodology (Figure 4) was applied as follow on industrial cases.
Step 1. System understanding and definition was achieved with a ‘walkthrough’ and a description of the processes by a specialist to create a first brown paper diagram (simplified representation of the system using a free-form diagram). This step brings the production engineers and energy managers together to allow a preliminary description and understanding of the system.
Step 2. A qualitative map of the processes described in step 1 was created by completing the map of MEW flows through the manufacturing processes and the supporting facilities. This step integrates the MEW process flows and the spatial aspects. It enables the integration of buildings and facilities, as well as the scale of the processes. Buildings are rarely included in manufacturing analysis, but there are potential opportunities to reduce energy use by linking the operations and building systems. An initial analysis was conducted to identify opportunities to prevent resource use or to identify elements of the model that can be substituted (based on best practices).
Step 3. Flows are quantified (a Sankey diagram is an appropriate technique to represent flow magnitude) using the monitored data (process data) directly from the building management systems, the energy facilities and the manufacturing operations. If there is a significant variation in the level of detail for data corresponding to different types of resource, flows can be represented in different layers that are then connected using the process map. The analysis identifies opportunities to reduce resource use and improve efficiency using static comparison of data in magnitude.
Step 4. Dynamic simulation shows the evolution of the resource flows in time and space. This stage allows the analysis of MEW flows locally (a selection of processes involved), as well as system-wide, and enables the identification of improvements to prevent and reduce resource use, reduce waste and losses, reuse waste flows as a resource input and substitute elements of the model.
Step 5. The analysis is carried in parallel to steps 2–4 and supports the identification of improvement opportunities using process data.
The next sections show how process data was used by the authors to build models of a manufacturing process and the supporting facilities and demonstrate the use of the prototype methodology. The first four steps of the methodology were tested on an actual company’s process that provides heat and pressure treatment to components. A schematic of the process was created. The flows can be revealed but their magnitudes cannot for confidentiality reasons. The process transforms the material properties of components through a well-defined and concentrated use of energy with potential for reuse. There is no material removal, however, there is consumable waste. The waste from separate supporting equipment, not traditionally considered by production engineers, is significant. There is potential to reduce consumption at each point in the process, as well as potential to reuse wastes elsewhere using the mindset of keeping flows within the technosphere as per Figure 3. Finally a generic example of a cooling system was used to test the identification of improvement opportunities for each strategy (prevent, reduce, reuse and substitute).
Manufacturing system understanding
First, the process was described by an expert and a first drawing (Figure 5) was created in a free-form diagram, which allowed a clear visualisation of the supporting facilities providing the resources for the process. This drawing was used to explain the different elements of the process after a ‘walkthrough’ the factory to better understand the whole process of the product manufacture and assembly, and to take account of the scale of the activities.
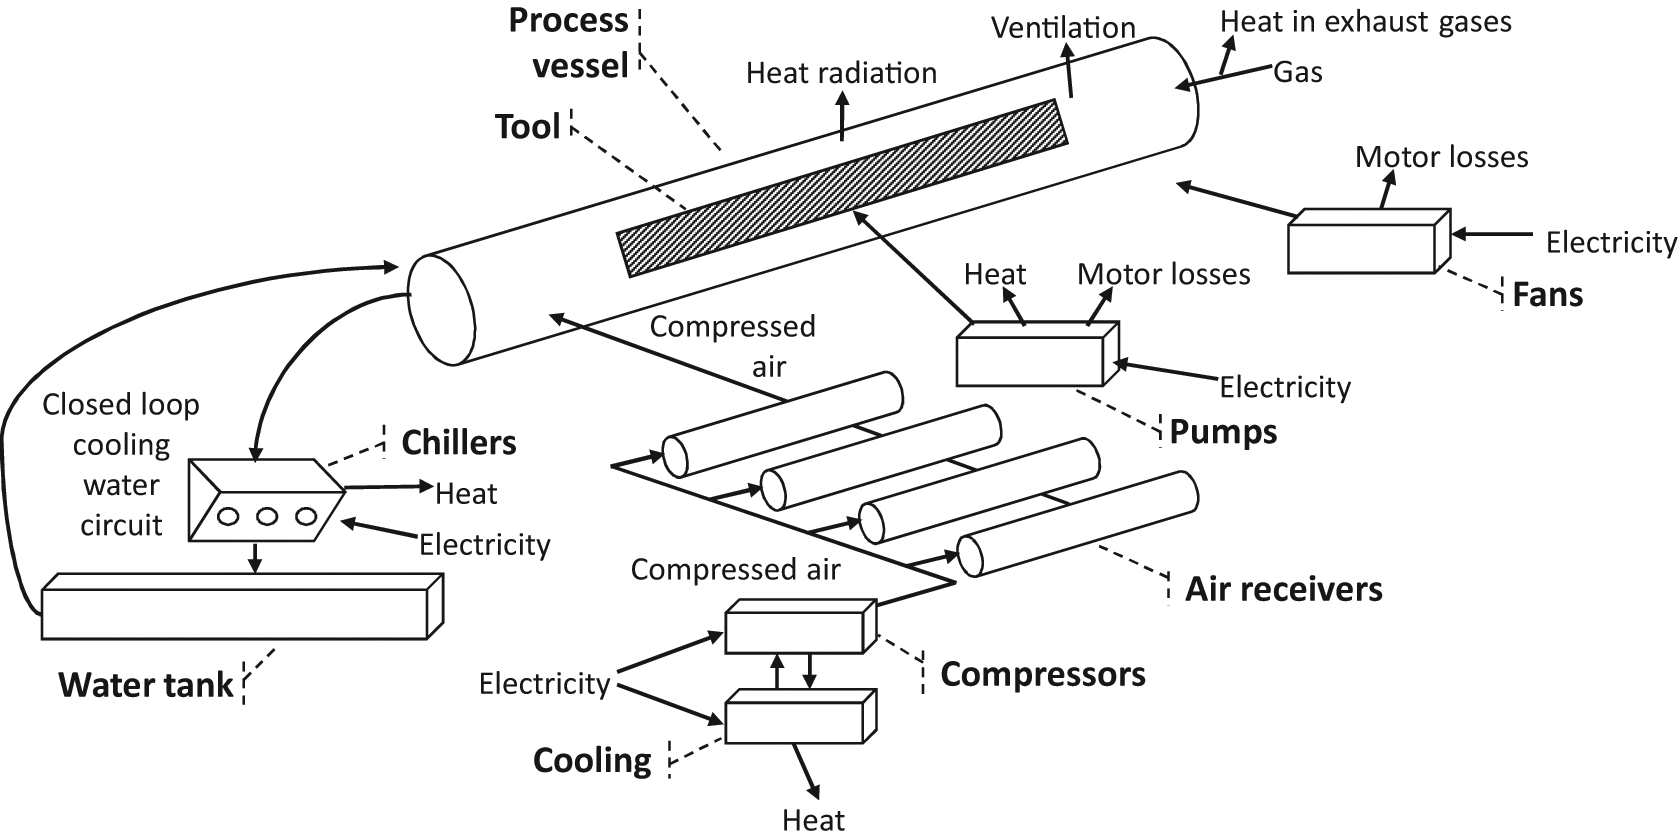
Pictorial representation of the manufacturing process (free-form diagram).
Qualitative mapping
From this first drawing (Figure 5), the process map in the form of a box–arrow diagram, as shown in Figure 6, was developed. This representation offers the advantage of a simple, standardised format, widely understood across various disciplines and by people with different backgrounds. Additionally, this format can easily be adapted for other techniques. For those highly familiar with the process, the walkthrough may be used to confirm the map rather than for initial understanding. For this application there was no obvious candidate from the modelling techniques comparison analysis (Tables 1 and 2), hence the technique used at this stage can be decided by the user.
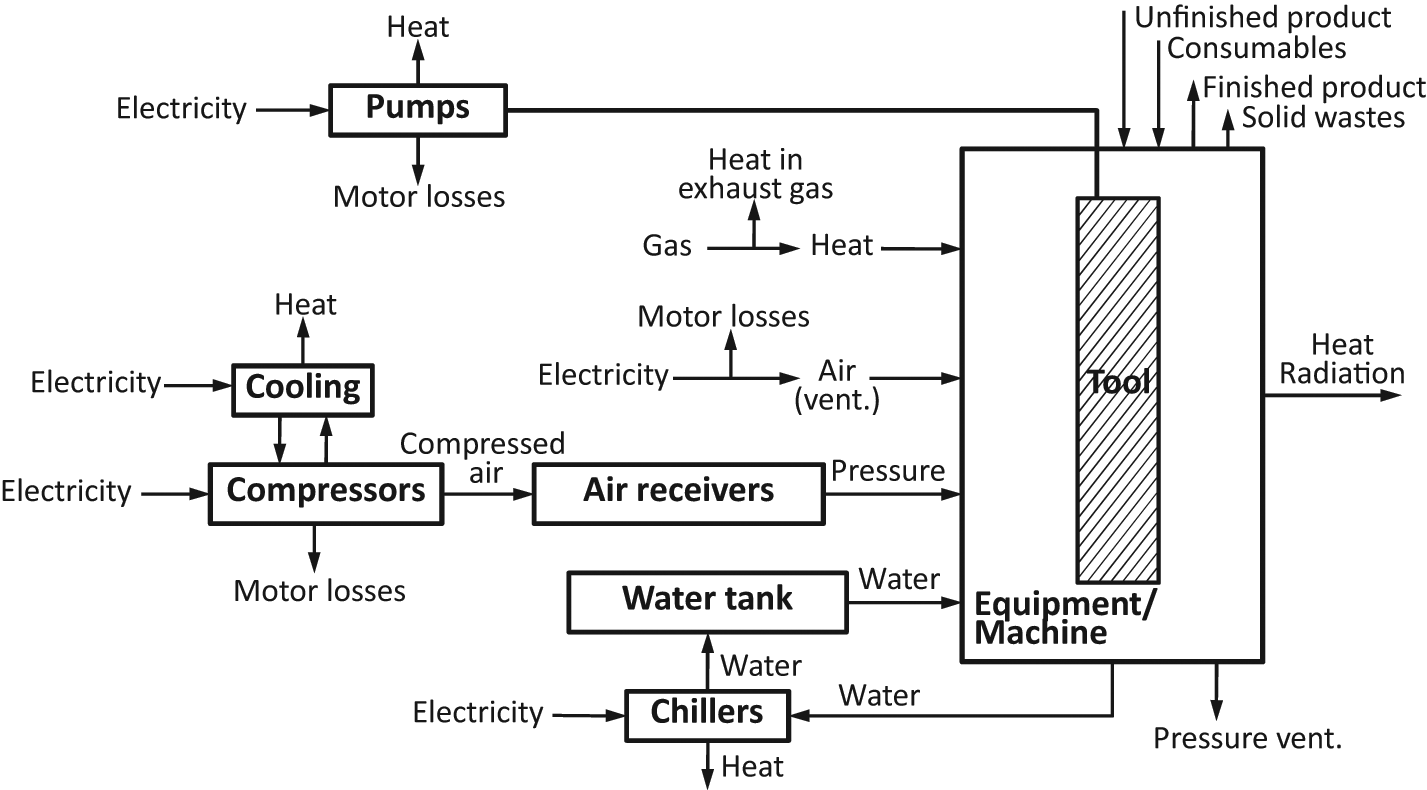
Mapping of the process by production and facilities engineers.
This representation treats individual technology as a ‘black box’ to highlight the MEW process flows between these ‘boxes’ (elements of the system). Table 5 gives an overview of the qualitative characteristics associated with the process flows.
Qualitative characteristics of process flows.
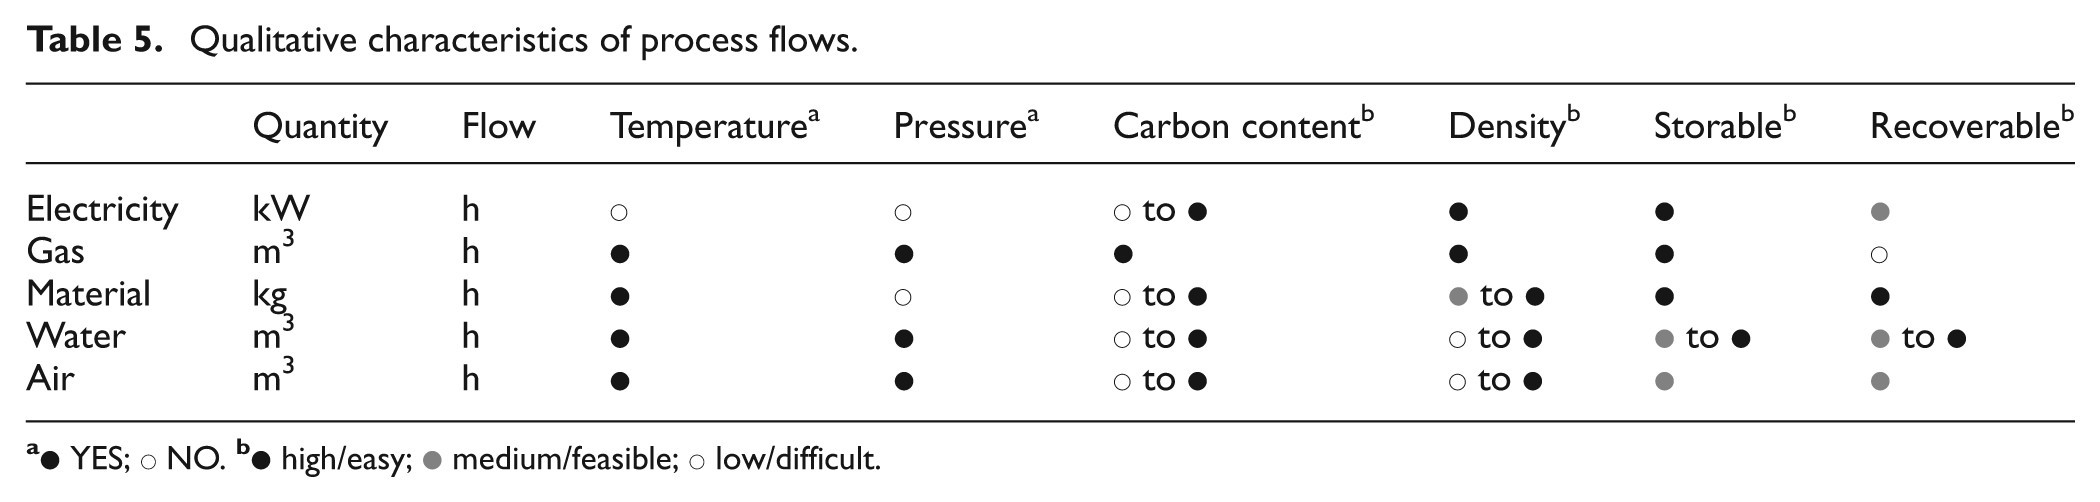
• YES; ○ NO
• high/easy;
Following the conceptual mapping of the processes and supporting facilities, the physical representation of the factory was integrated. While a two-dimensional (2D) model can be shown in this article, the three-dimensional (3D) model could not be disguised sufficiently to provide meaningful input. Figure 7 is a spaghetti diagram (or string diagram), which captures the physical dimensions of the system and the processes. This is an established tool for manufacturing generally; it helps here to identify movement waste by mapping the resource flows onto the factory layout.
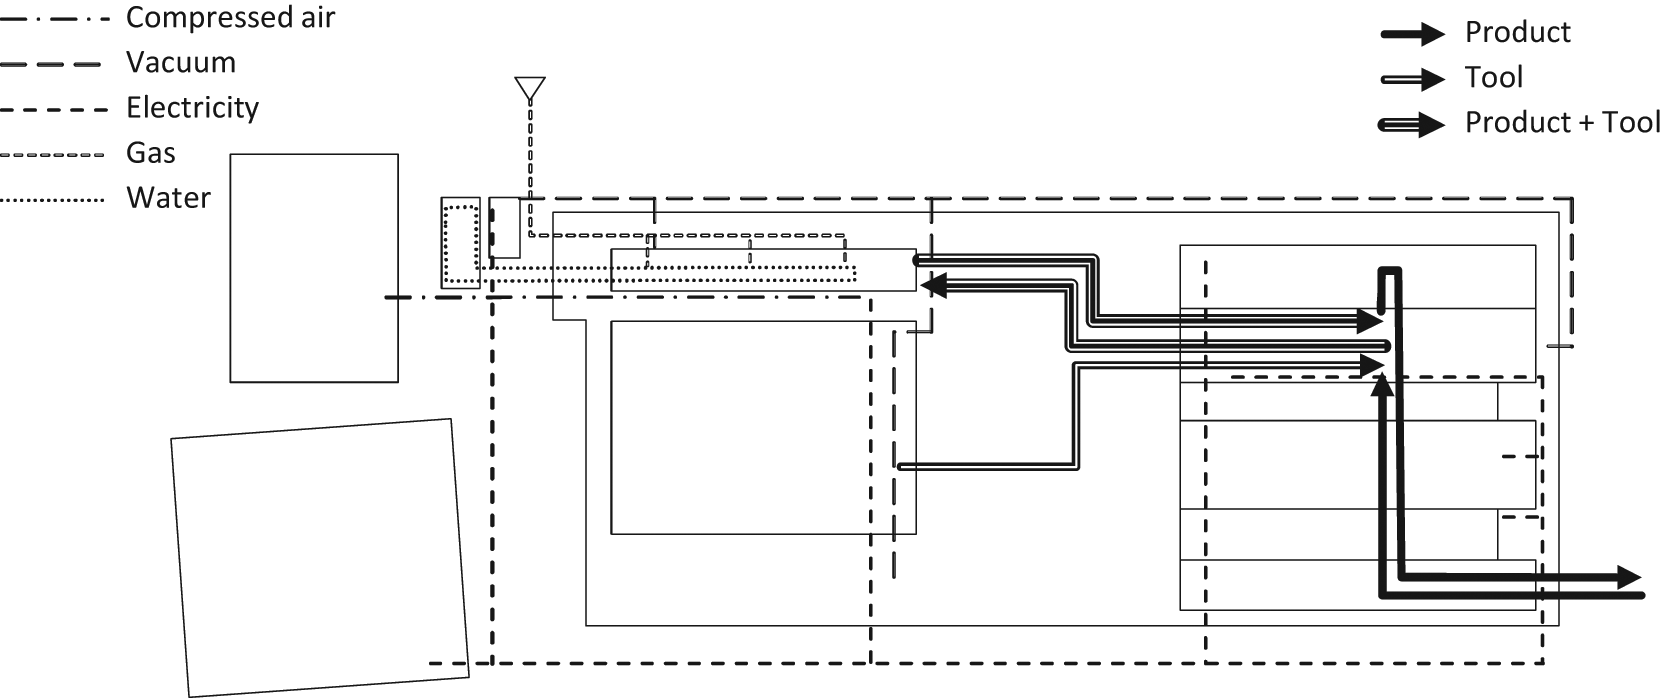
Spaghetti diagram: resource flows mapped onto the factory layout.
The benefits of this stage are integrating the local flows with the wider facility and, in turn, showing constraints as well as opportunities for change. An example is the use of waste heat from one process as a potential feed for another nearby process, thereby reducing net demand.
Quantitative modelling
Process data can be monitored for programming operations control, documentation and reporting. This data (temperature, pressure, electricity and gas consumption, water, steam or compressed air usage) captures the evolution of process parameters over time and their intermittency.
As there is no structured template for data recording (data can be stored in different formats: list, matrix, text, graphs, etc.), process data monitoring can support various modelling techniques and can be used for dynamic simulation: it is possible to associate process data time series with elements of the system, at varying levels of granularity (such as specific or groups of machines, processes, shop floor zones/areas, etc.).
The most commonly used technique for quantitative mapping is the Sankey diagram. It allows the visualisation of the amount of energy or material flowing through the system and the efficiency of conversion when resources (energy or material) are processed. This technique is based on energy and mass balance (laws of thermodynamics). Additionally, this technique is able to show supporting facilities, such as boilers or compressors. Quantitative flow maps are commonly used to visualise flow quantity for system understanding and as a communication tool or documentation support for techniques, such as material flow analysis (MFA). They can also be used for management and decision-making by mapping value flow at an operational level or for cost accounting.
Figure 8 is a Sankey diagram of the MEW flows in to and out of a production process. The diagram provides quantitative visualisation of flow and, consequently, the efficiency of conversion when resources (energy or material) are processed. It incorporates product and consumable material flow, energy flows in the form of gas and electricity, and waste flows in the form of consumables, heat and pressure release. The boundaries of the system studied have been drawn around the process and its supporting facilities. Some of the supporting facilities (chillers, compressed air and cooling water storage) are outside the building. The process being investigated is the only process taking place in a large facility with no heating, ventilation and air-conditioning (HVAC) system, therefore, the building system is not represented.
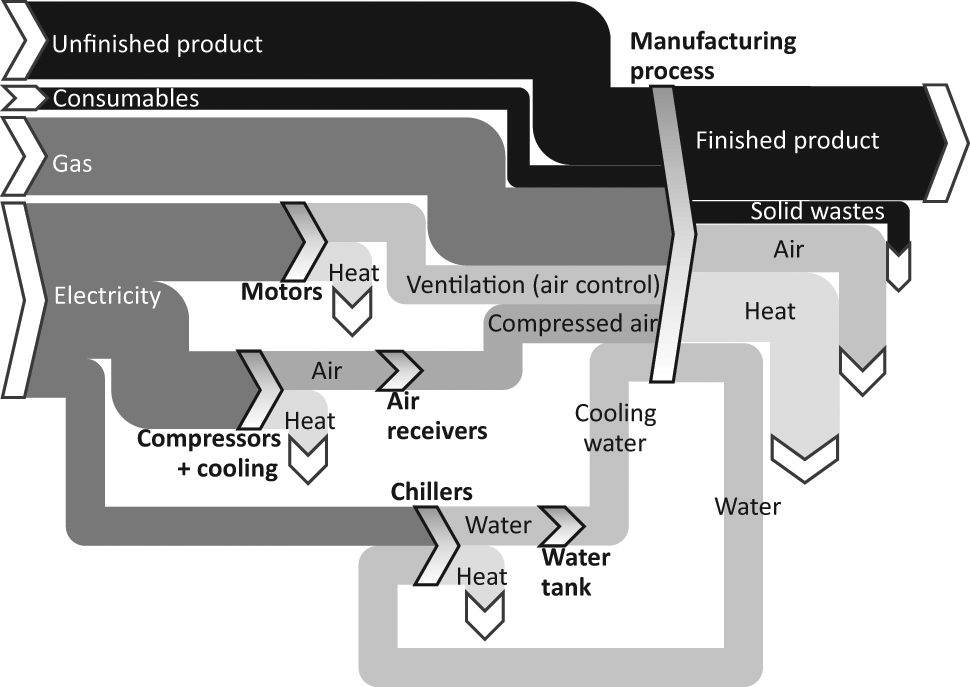
Sankey diagram: resource flow through the company’s manufacturing process.
Simulation
In the example given, serious consideration must be given to the timing of the flows as the process is intermittent. Figure 9 shows the temperature and pressure profiles, and the energy demand of the manufacturing process over a period of time (T). The magnitude of temperature and pressure set points cannot be shown, but the process is energy intensive and occurs a few times a week at most. There is potential for energy recovery from pressurised gas and significant heat loss from the manufacturing process over a period of hours with varying intensity (pressure and thermal rejections in Figure 9), but then the opportunity may not occur again for another day.
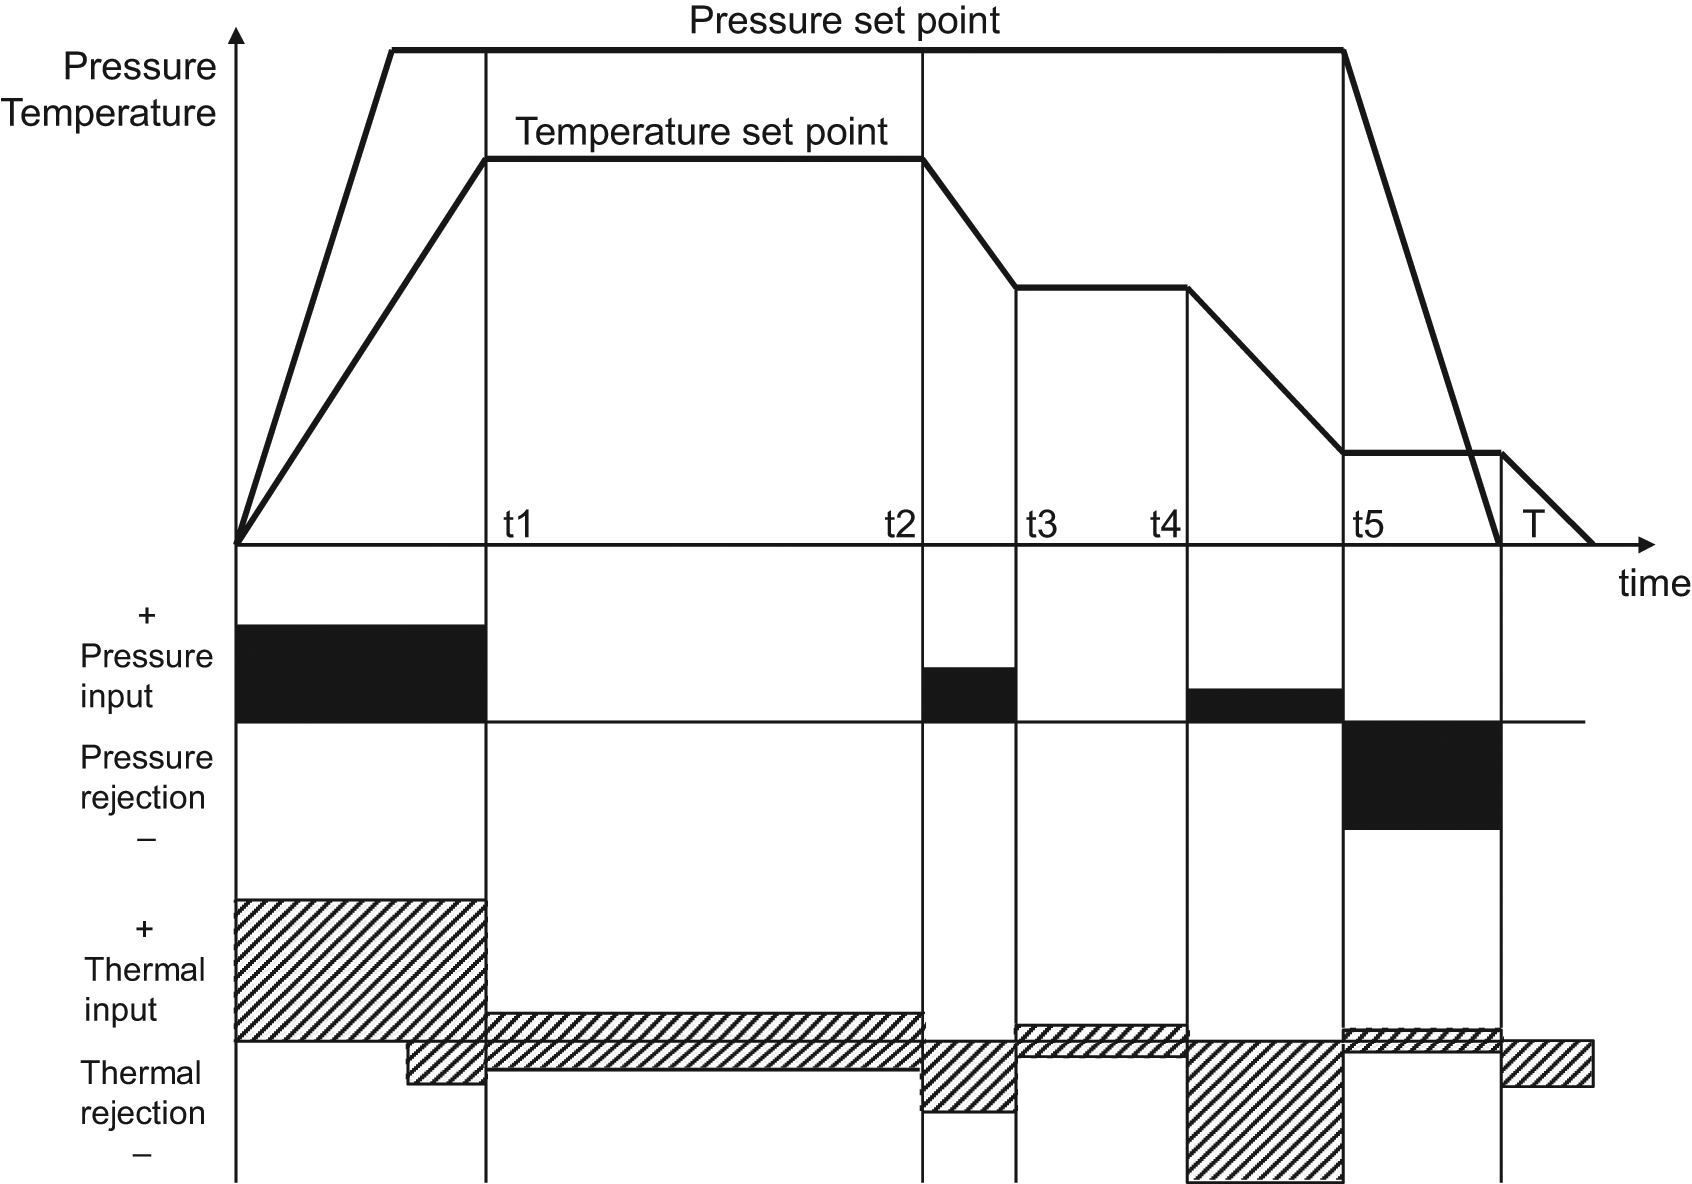
Process data profiles: set points and energy demand.
Analysis and identification of improvement opportunities
To test the identification of improvement opportunities, a generic cooling system with a closed-loop circulation of water (similar to the one used in the process modelled in steps 1–4) was used in this section to illustrate the use of each strategy (prevent, reduce, reuse and substitute).
It is important to clearly separate the desirable sequence for option prioritisation, or improvement implementation, which typically follows the hierarchy proposed by the ‘Rs’ strategies in the literature, and the sequence of improvement identification. The amount of data required to identify an improvement does not reflect the effort and capital required to implement it. On the contrary, in some cases, more effort in data collection is required to identify ‘low-hanging fruits’ (e.g. prevent resource use, reduce set points or repair leaks), whereas substitution of technology and resources at high cost can be identified quickly (e.g. black-listed resources or old inefficient equipment). In short, the implementation order does not necessarily correspond to the order in which improvements are identified in the analysis.
Figure 10 shows the cooling water system (a) before improvement, (b) after improvement. Depending on the data available – and therefore the process data used to characterise the system’s components – there are different ways to compare profiles, identify mismatch and inefficiencies, and suggest improvement options.
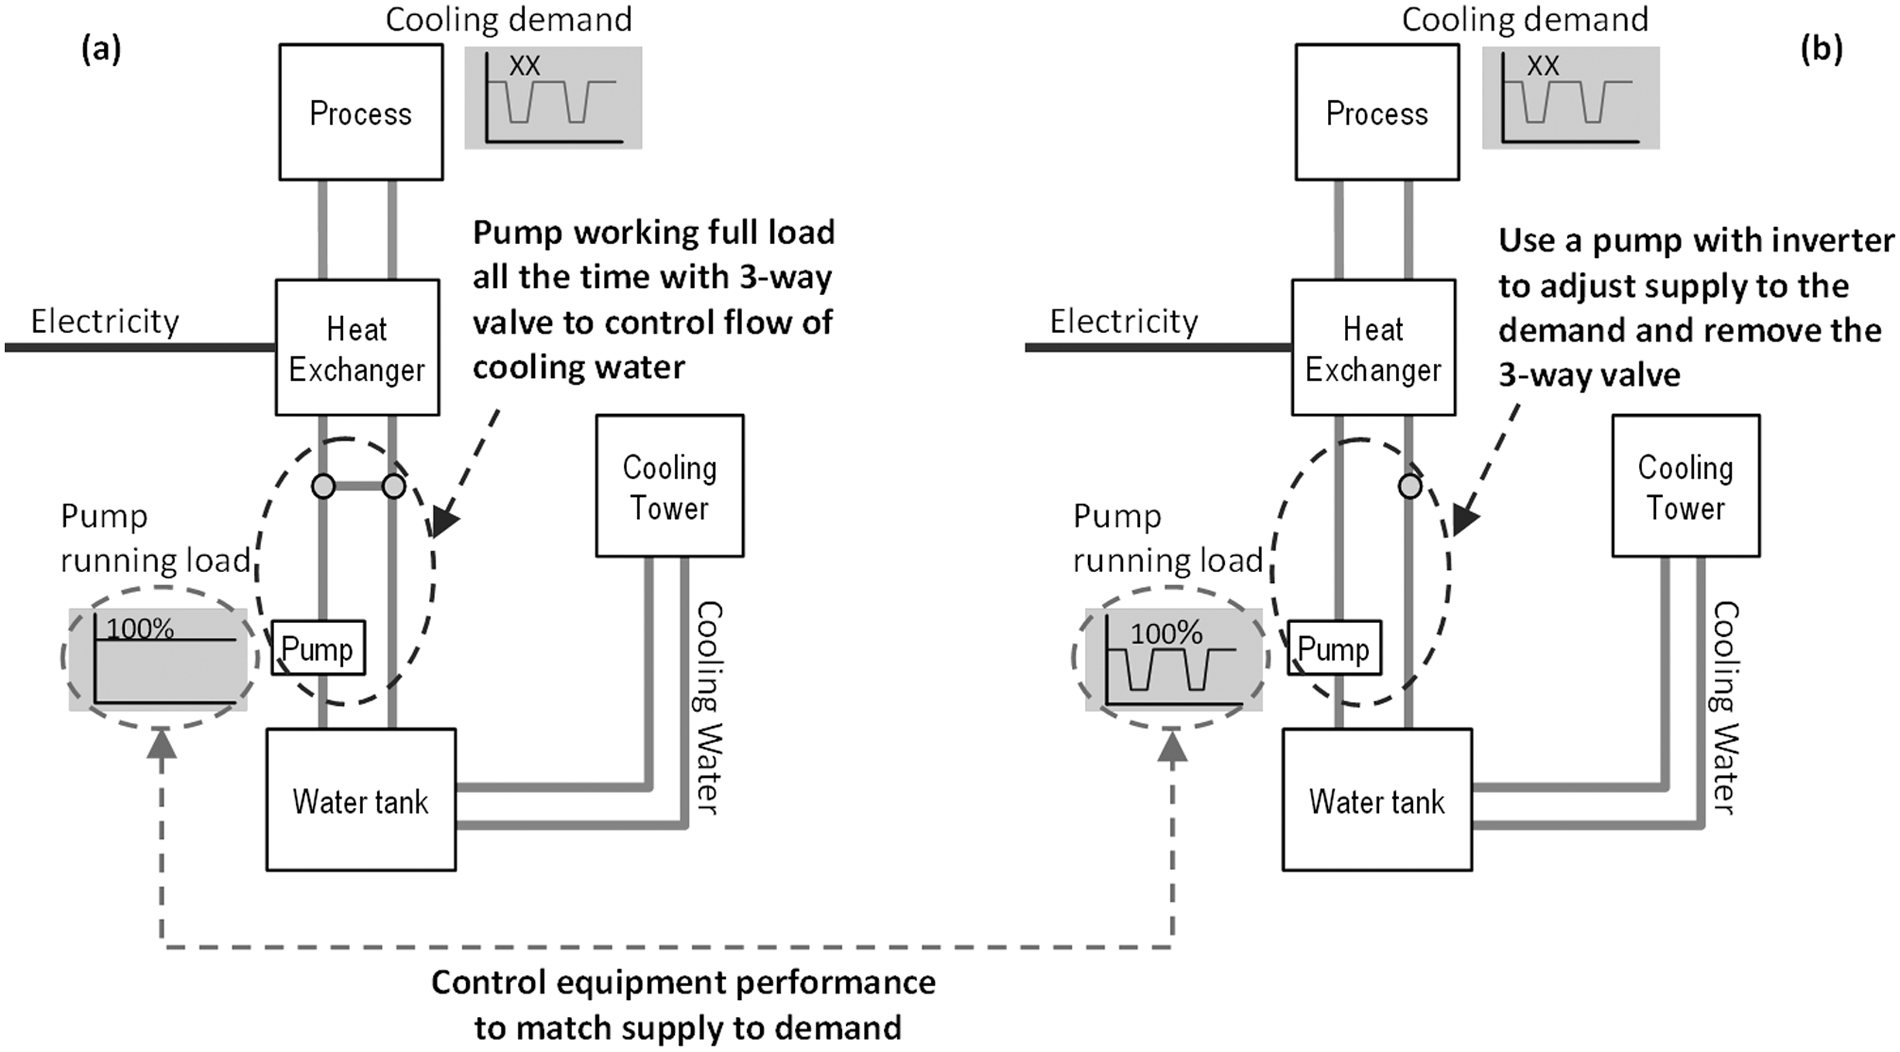
Cooling water system: (a) before improvement; (b) after improvement.
Following the sequence for improvement strategies as shown in step 5 of the prototype methodology (Figure 4), the prevention improvements identify mismatch between resource input and production schedule, i.e. check whether resources were consumed during non-production hours. Then the sum of all usage is compared with the total supply to check the completeness of the model and to identify excessive losses occurring between supply and usage. In this particular example, prevention and waste reduction can be done by identifying excessive thermal loss between the cooling water tank and the point of usage.
The next group of improvements in the sequence is the resource use reduction. Improvements are identified by comparing the cooling water system performance (water temperature and pump running load, and therefore, cooling water supply) with the cooling demand at the point of use. A first improvement opportunity can be identified by comparing the temperature of the cooling water input and the process set points (or cooling requirements). The water tank temperature can be increased after a performance assessment to evaluate the impact of this temperature change and the energy savings to maintain the cooling water temperature.
An energy and water reduction opportunity is also shown in Figure 10(b): equipment control can be improved to better match the supply to the demand. As illustrated in Figure 10(a), a pump is constantly running full load when the demand is significantly varying and the flow is adjusted by using a three-way valve. However, it is possible to use an inverter with the pump and allow the water supply to match the demand for cooling water by reducing from oversized and continuous supply flow to a variable adjusted supply level. A similar improvement can be made by assessing the pump characteristics (running capacity and performance curve) and identifying a substitution improvement where the pump would be replaced with a variable speed one. This should be adequately sized for the process demand, as the current one might be oversized in anticipation of production expansion, overlooking the energy savings accomplished over the years, which decreased the energy demand while increasing production level.
This application example demonstrates that it is possible to identify improvements using MEW flow modelling and improvement strategies. It helps connecting the manufacturing facilities and operations as the user gains better understanding of the interactions between. The prototype methodology can assist manufacturers in assessing the resource productivity with a systems perspective and help to manage resource flows more sustainably.
Summary of the industrial application
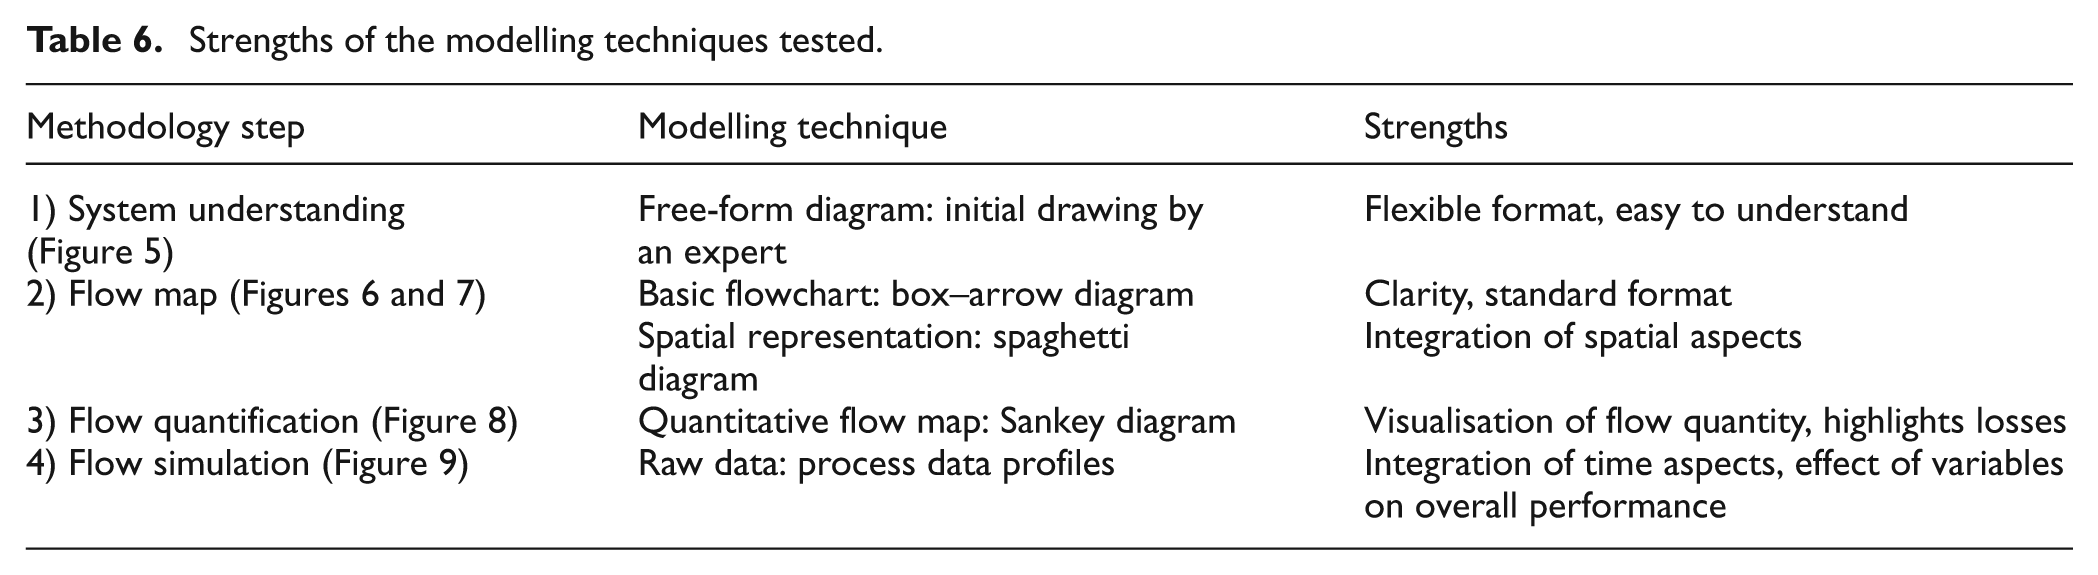
In the previous sections, a manufacturing process has been used to test the modelling approach and associated methodology using various techniques identified as appropriate. It was apparent that each technique can capture different elements of the system and that not one single technique, but a combination of techniques, can cover all the aspects of interest for the modelling tool. Table 6 summarises the strengths of the techniques as tested with the prototype methodology.
Strengths of the modelling techniques tested.
These modelling techniques can represent the resource flows through the manufacturing system and highlight where losses or wastes can be recovered and used as a resource elsewhere, as it spontaneously occurs in biological ecosystems. This demonstrates the possibility of adopting an integrated systems view of manufacturing activities by using modelling techniques.
In manufacturing modelling, the analysis usually focuses on product flow and rarely represents the supporting resource and waste flows. The novelty of this research is the adoption of a systems view of manufacturing (including operations, facility and building systems) by modelling the MEW flows linking all the system’s components and, therefore, supporting the creation of a manufacturing ecosystem.
The quantification shown using the Sankey diagram is static and the value is limited to steady state systems, whereby the process is continuous and the inputs and outputs are constant. For processes that are intermittent, like the example given, consideration must be given to the timing of the flows. Simulation that incorporates time progression using process data is, therefore, used to understand how intermittent demand or supply can be utilised by other parts of the factory.
Whether processes are intermittent or continuous, the steps thus far enable examination of the process flows according to the waste hierarchies of prevent, reduce, reuse, etc. For example, process tasks that become apparent during the mapping may be considered to be unnecessary or excessive, or the number of compressors used simultaneously to pressurise receivers could be reduced and the efficiency of motors could be challenged.
Discussion
A model is a simplified representation of reality. Therefore, simplifications, assumptions and approximations are made in order to obtain a representative model without the cost of developing a high-fidelity model. Thus, the challenge is to determine how detailed the analysis can (or must) be, and what dimensions of performance must be included. Typically the difficulty is to represent the system at a suitable level of abstraction, which is dictated by the available data, and any improvements a company has already made in its manufacturing processes: as improvement activities are carried out, the data quality tends to progress and identifying opportunities for further improvements requires a more detailed analysis.
Another critical assumption concerns the boundaries of the system. The prototype methodology is for use by manufacturers, and it is, therefore, crucial to consider their perspective on industrial activities. The control that some companies have on what is happening outside the factory is limited; this may include product design and supply chain. Thus, only on-site MEW resource flows are taken into account in the modelling, i.e. gate-to-gate rather than a product life cycle or supply chain perspective is used.
Data collection of actual inputs, or outputs, including emissions and waste streams is far from easy: the level of granularity of data can vary for different resource types. This granularity issue can affect the level at which the data is metered (e.g. electricity at equipment level versus at distribution bus duct level), as well as the time interval between two values (e.g. continuous recording versus 30-min readings versus 3-monthly readings), and the magnitude of the flow to be taken into account (small flows add complexity to the model, but they can also have a high impact on performance, e.g. toxic waste).
Finally, the system boundaries for modelling and performance assessment can differ, as the impact of improvements done on-site can have an influence on what happens outside the system boundaries. It is up to the user whether to prioritise best environmental or economic performance.
In the field of SM, general trends focus on the treatment of materials at their end-of-life rather than on the manufacturing system itself. The literature revealed extensive work on product design, design for X, technologies for disassembly and remanufacturing, the ‘Rs’ strategies, reverse logistics and supply chain management. Even though SM is strongly based on the IE concept of an industrial ecosystem, there has been little published on applying it at factory level.
The ever-increasing number of principles and tools for sustainability in business are not integrated 44 and in some cases can create confusion and lead to success being limited. 33 This research intends to complement and consolidate other researchers’ work in the field of SM.
The authors recognise the importance of a larger perspective on industrial systems and the need for a life cycle view on manufacturing activities in order to achieve environmental sustainability. This work focuses on a single manufacturing site in order to change the level of application of concepts, such as food–web, industrial metabolism or industrial ecosystem (closed-loop circulation of resource). These are traditionally applied at macro-level, involving various industrial entities and local communities. As the tool to be developed is for use by manufacturers, these concepts are applied at factory level. Thus the boundaries of the system are drawn around the manufacturing site and stop at the factory gates.
Conclusion
The move towards sustainability for the whole of society will require changes on many levels: not only must production methods be more respectful ethically and environmentally, but consumption patterns must also be changed. This research intends to reduce the environmental impact of manufacturing through the reduction of resource consumption, waste generation and pollutants emission by closing the flow of MEW at factory level.
The authors investigated how to adopt an integrated view of manufacturing systems through capturing process flows to shift towards a manufacturing ecosystem model. The literature revealed a gap in the application of IE at factory level and a lack of guidance for manufacturers to identify improvements in their MEW flows for more sustainable practices.
Currently there are no tools or techniques that effectively combine space, product flow, energy flow and time to enable complete modelling and, therefore, this work feeds the specification for such a tool. The main objective of the modelling tool to be developed in the context of a larger project is to improve the environmental performance of manufacturing systems. This can be achieved by a more efficient use of resources and through closed-loop resource flow, thereby reducing both resource inputs and waste outputs of the system. Thus, modelling of MEW process flows has been identified as an appropriate way to achieve resource flow improvement with existing manufacturing operations, facilities and buildings, or for the creation of new ones by assessing different scenarios. Ultimately the manufacturing system model, with its flows and their magnitudes, would be incorporated in simulation software to analyse the effects over time to identify opportunities for reduction and reuse.
The novelty of the modelling approach presented in this article is the application of a systems view of MEW flows at intra-enterprise level. In particular, it combines existing techniques into a methodology to achieve this. By tracking the MEW flows throughout the manufacturing system, the link between operations, facilities and buildings is made. In turn, this integrated view allows the identification of wasteful activities, where virgin inputs can be substituted with wasteful or unwanted output generated elsewhere in the system.
This research takes a manufacturer’s perspective on industrial systems to improve the environmental performance of their activities. To achieve the adoption of an ecosystems view by manufacturers, a methodology for the application of such a tool was proposed. The data collection treats processes or areas of the factory as ‘black boxes’ to focus on possible interactions where outputs of some activities could be used as inputs elsewhere in the system, rather than treated as losses or wastes leaving the system.
The research has demonstrated the use of the methodology for modelling the manufacturing system and identifying improvement opportunities, such as potential areas of significant wastes or losses in material or energy forms. The modelling techniques tested can highlight those areas for connecting output and input flows.
Footnotes
Appendix
List of modelling techniques for the review analysis
| List of methods from information engineering literature: 39 | ||
| - Automatic Code Generation (ACG) | - Excelerator (EXCEL) | - Strategic Assumption Surfacing and Testing (SAST) |
| - Business Info Analy and Integration Tech (BIAIT) | - Enterprise-Wide Information Management (EWIM) | - Structured Design (SD) |
| - Business Syst Planning (BSP) | - Information Systems Architecture (ISA) | - System Development Methodology (SDM) |
| - Computer-Aided Process Organization (CAPO) | - Information Systems Design and Optimization (ISDOS) | - Software Requirement Engineering Methodology (SREM) |
| - Case 2000 | - Methodware (M-W) | - Strategy Set Transformation (SST) |
| - Critical Success Factors (CSF) | - PLEXPLAN | - Strategic Analysis, Design and Implementation of Information Systems (STRADIS) |
| - Data Designer (D-D) | - Problem Statement Language and Analyzer (PSL/PSA) | - TAXIS |
| - Data Dictionaries | - Relational Data Model (RDM) | |
| - Data Structured System Development (DSSD) | - Structured Analysis and Design Technique (SADT) | |
| - Entity-Relationship Model | ||
| A comprehensive inventory of software methods from system life cycle literature: 40 | ||
| - Process Flow Chart | - HOSKYNS System | - Langefors Methodology |
| - Forms Flow Chart | - Test Data Generator | - Information Engineering by Finkelstein and Martin |
| - Systems Flow Chart | - Structured Testing | - Structured Design by Yourdon and Constantine |
| - HIP0 (VTOC Chart) | - Higher Order Software (HOS) by Hamilton/Zeldin/Martin | - Structured Systems Design described by Orr |
| - HIP0 (IPO Chart) | - Fourth Generation Language, e.g. FOCUS, RAMIS | - SYSTEMATICS |
| - Data Flow Diagram | - Structured Analysis as described by DeMarco | - SADT by SofTech |
| - Automated Flowcharting | - ADS System (by NCR) | - Jackson System Development by Michael Jackson |
| - PSL/PSA | - BIAIT (Bus. Info. Anal. and Integration Technique) | - PLEXSYS (Workbench Approach) |
| - Decision Table | - BICS (Business Info. Characterization Study) | - ISDOS (University of Michigan Approach) |
| - Functional Description | - SREM (Sys. Req. Engg. Methodology by Mack Alford) | - Prototyping |
| - Structure Chart (Yourdon) | - BISAD (by Honeywell) | - Applic Sys Dev Methodology (e.g. SPECTRUM, PRIDE, CARA) |
| - Gridcharting | - SOP (IBM’s Study Organization Plan) | - Structured Walkthrough |
| - Jackson Chart | - Automated ADS | - Cost Benefit Analysis |
| - Warnier-Orr Diagram | - Information Algebra | - Quality Assurance |
| - Nassi-Schneiderman Chart | - Young/Kent Methodology | - Independent Software Audit |
| - Data Base Dictionary | ||
| - SODA (Optimization Aid) | ||
| - Program Flow Diagram | ||
| - Pseudocode | ||
| - Structured English | ||
| - Chapin Chart | ||
| - Decision Table Processor | ||
| - Structured Programming | ||
| List of process modelling techniques from software engineering literature: 41 | ||
| - Flowcharts (ANSI symbols) | - Merise | - IDEF3 |
| - ISO Conceptual Schema Model | - Data Flow Diagrams | - Object-Oriented Petri Nets and LOOPN++ |
| List of business process modelling techniques from production economics literature: 42 | ||
| - Flow chart technique | - Role interaction diagrams (RID) | - Coloured Petri-nets (CPN) |
| - Data flow diagrams (Yourdon's technique) | - Gantt Charts | - Object oriented methods |
| - Role activity diagrams (RAD) | - IDEF | - Workflow technique |
| List of mapping techniques from lean production literature: 43 | ||
| - Pre-mapping: Product Family Analysis, Overall Lead Time Mapping, Brown Paper Overview, Supply Chain Structure | - Value Stream: VSM, Demand Amplification Map, Spaghetti Diagram, Quality Filter Map, Activity Sampling, Cost Time Profile | - Multi Customer-Contact Points (Service Maps): Service Blueprints |
| - Supply Chain: Seeing the Whole (extended VSM), Demand Amplification Map, Cost Time Profile | - Information Processing: Order Tracking (multi branching), Information Value Stream Map (minimal branching or options) | - Detailed Activity: Process Activity Maps, Work Combination Chart, Cell Layout- Implementation: Route Learning Map |
| List of process modelling techniques from software engineering literature: 41 | ||
| - Flowcharts (ANSI symbols) | - Merise | - IDEF3 |
| - ISO Conceptual Schema Model | - Data Flow Diagrams | - Object-Oriented Petri Nets and LOOPN++ |
| List of business process modelling techniques from production economics literature: 42 | ||
| - Flow chart technique | - Role interaction diagrams (RID) | - Coloured Petri-nets (CPN) |
| - Data flow diagrams (Yourdon's technique) | - Gantt Charts | - Object oriented methods |
| - Role activity diagrams (RAD) | - IDEF | - Workflow technique |
| List of mapping techniques from lean production literature: 43 | ||
| - Pre-mapping: Product Family Analysis, Overall Lead Time Mapping, Brown Paper Overview, Supply Chain Structure | - Value Stream: VSM, Demand Amplification Map, Spaghetti Diagram, Quality Filter Map, Activity Sampling, Cost Time Profile | - Multi Customer-Contact Points (Service Maps): Service Blueprints |
| - Supply Chain: Seeing the Whole (extended VSM), Demand Amplification Map, Cost Time Profile | - Information Processing: Order Tracking (multi branching), Information Value Stream Map (minimal branching or options) | - Detailed Activity: Process Activity Maps, Work Combination Chart, Cell Layout |
| - Implementation: Route Learning Map | ||
Funding
This research received no specific grant from any funding agency in the public, commercial, or not-for-profit sectors.