
Abstract
In this article, a mathematical algorithm is derived to accurately determine the critical load of indentation for the initiation of cracks on the surface of a hard coating on a soft substrate, based on the measurement of the diameter of circumferential cracks in micro-indentation impressions. The critical load required for the initiation of the first crack predicted using this technique is shown to be in good agreement with experimental results, indicating the feasibility of the technique proposed. The rationality of the approach proposed was further explored by investigating the fracture mechanism of the surface in a multilayer-coated surface using a finite element model, which was developed with the parameterised modelling approach, in combination with the cohesive-zone model.
Introduction
Hard coatings on relatively soft substrates have recently received more attention in industries such as manufacturing and automotive- and aerospace-engineering. Various kinds of coatings are demanded to meet the increased number of applications for hard-coated systems. TiN coatings, for example, are often used as protective layers for cutting tools. The coatings on the tools, however, are usually brittle and may undergo fracture development in the surface or delamination of the interface between layers. Load-bearing capacity becomes a demanding parameter for high strength engineering components, especially in machine elements. Quantifying the mechanical properties of coatings and predicting the critical loads related to coating damages are, therefore, of significance for both scientific and engineering communities concerned within the chain of design, manufacture, and use of coating products. Through experimental and finite element (FE) investigation into the cutting performance of coated tools, Bouzakis et al. 1 found that multi-layer coatings have better adhesive properties. Using scratch tests, Bull and Jones 2 investigated the effect of increase in the number of layers (Ti/TiN) on the coating’s adhesive and tribological performance and concluded that multi-layer coatings, in general, improve adhesion and toughness, which leads to better wear performance over that of single-layer TiN coatings. The greatest adhesion and lowest wear rates for multi-layer Cr/CrN coatings were observed by Gorishnyy et al. 3 These authors also found that the performance decreased with an increase in the thickness of the Cr layers.
Indentation has been widely used to investigate the mechanical properties of coatings or thin films, such as the elastic–plastic properties, yield stress or strain hardening.4–6 Significant effort has also been made to investigate the failure properties of coatings using indentation, such as local cracking in thermally sprayed coatings. 7 Based on the model of elastic coatings on an elastic–plastic substrate, Michler and Blank 8 investigated the effect of the ratio of the thickness of the coating layer to the indenter radius, on the onset of plastic deformation and the coating failure during indentation. Chen and Bull assessed the toughness of thin coatings using nano-indentation under displacement control. 4 However, to date, work to quantify the critical load inducing surface cracks in the coatings on tool steel has not been reported in literature.
Cracking of the coating in multi-layered systems is one of the common failure-forms observed in indentation tests. Under the pressure of an indenter, cracks may be initiated from the coating surface or from the coating side of the interface, and they may grow into through-thickness cracks. In this article, an innovative approach is proposed to determine the critical load inducing cracks in the coating surface by means of the determination of the diameter of circumferential cracks in the indentation impression. It is demonstrated that the critical load associated with the initiation of the first crack predicted with this method is in good agreement with experimental results, indicating the feasibility of the method proposed.
The underlying mechanism of this method was further explored through investigation of the fracture behaviour and failure mechanism in the coating surface using a FE model. The FE model is developed based on a new finite-element modelling procedure, which combines the parameterised FE modelling technique with the cohesive-zone model. With this modelling approach, parameterised modelling allows for variation of the parameters of the materials and the geometry and loading conditions to be considered in the analysis; while cohesive-zone modelling enables the simulation of the initiation and propagation of cracks in the coating layer.
In general, the new approach proposed in this article has been shown to provide a simple, feasible and accurate method to determine the critical load inducing cracking in the coating. The investigation of the failures of the coating surface by the FE modelling further demonstrates the rationality of the approach proposed.
An experimental investigation
Why this approach is proposed
In this study, the load-bearing capacities of two specimens of duplex coating surface systems were studied using a Rockwell indenter with a tip-radius of 100 µm on a commercially available Zwick hardness tester (Z2.5). Residual imprints were analysed using a Hitachi S4800 high-resolution scanning electron microscope (HRSEM). The two types of specimens, designated as PN1 and PN2, respectively, are TiN coatings of 2 µm thickness on H11 steel substrates, which were, prior to coating, subjected to active-screen plasma nitriding at 480 °C for 12 h for the first type and 30 h for the second type.
A series of experimental indentation tests were conducted with a wide range of loading level (20–60 N) in order to secure the accurate determination of the load-bearing capacity in terms of coating fracture. Two types of experimental results, including HRSEM images and force–displacement curves, were obtained. The objective of the approach proposed is to determine the critical load at which the crack was initially nucleated through the experimental results. Examples of HRSEM images for residual imprints after the 40 N and 60 N indentation loading are shown in Figure 1(a)–(d). Clear residual imprints and the multiple circumference surface cracks are observed in the HRSEM images at higher loads (e.g. PN2 at 60 N loading in Figure 1(a) and (c)), while at lower loads the image of the residual imprint is difficult to identify by eye (Figure 1(b)), although fine cracks were observed in a magnified image (e.g. PN2 at 40 N loading in Figure 1(d)). As we can see from this example, a series of indentation tests have been conducted with small intervals of loading steps in order to accurately judge at which level of loading the crack was nucleated, if the critical load related to a crack the coating surface was assessed through SEM images. The smooth loading/unloading force–displacement curves for PN1 and PN2 specimens with the maximum load at 60 N and 40 N (Figure 1(e) and (f)) displayed no sign of the initiation of cracks in the coating. Clearly, the critical load associated with the initiation of a crack could not be determined accurately from both the HRSEM images or the force–displacement curves.
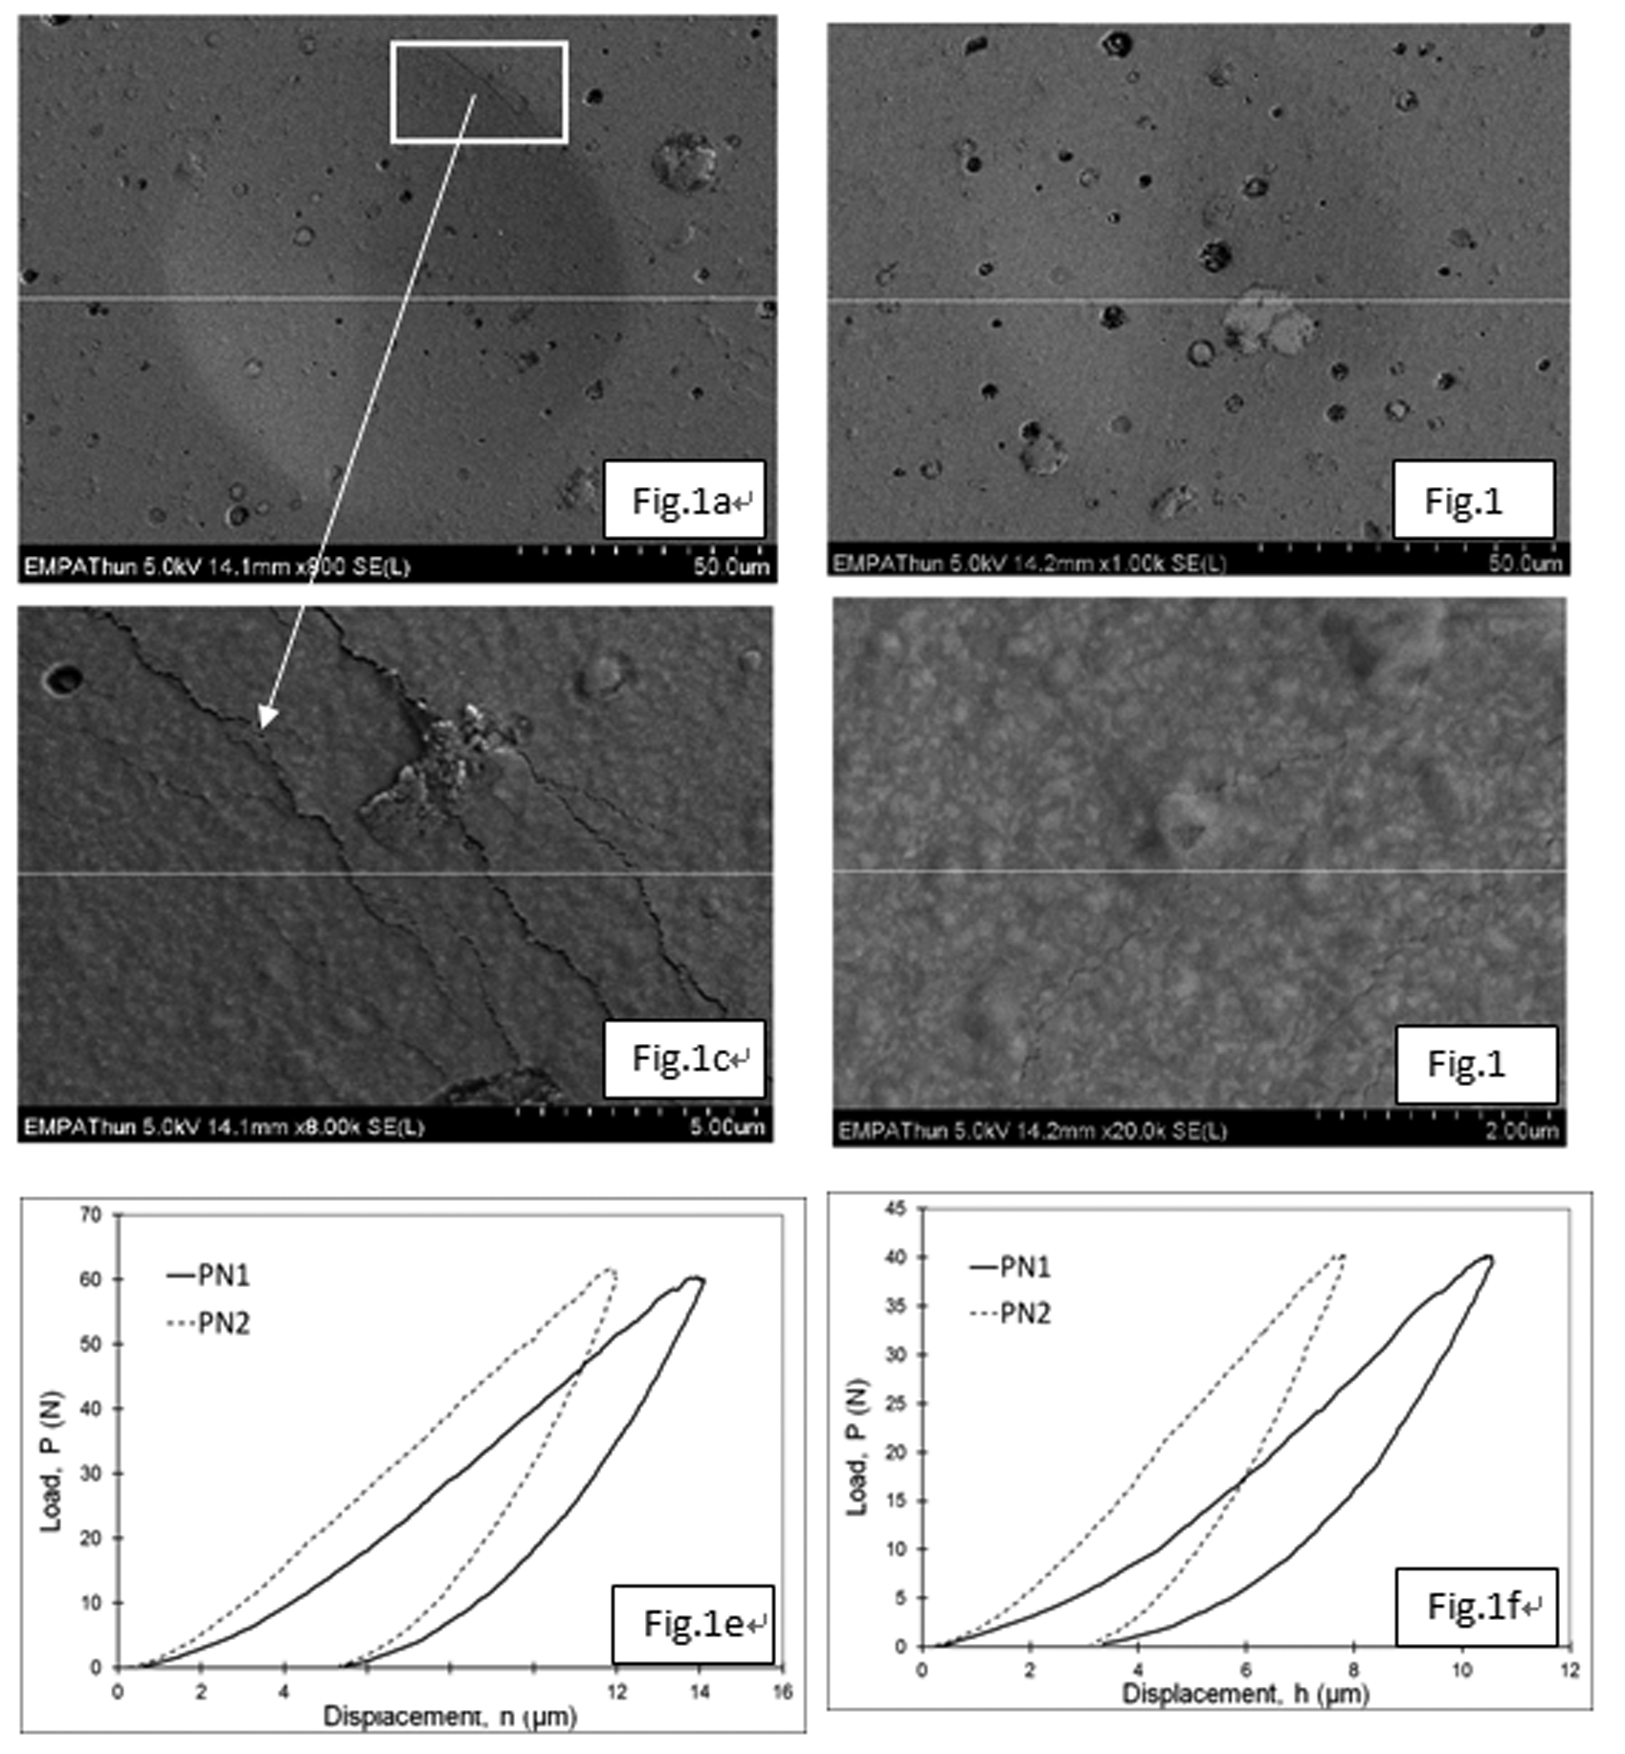
Indentation impression as seen by a HRSEM for PN2 ((a) and (c) loaded at 60 N; (b) and (d) loaded at 40 N) and force–displacement curves for PN1 and PN2 ((e) loaded at 60 N; (f) loaded at 40 N).
In order to accurately define the critical load inducing the cracking of the coating surface easily, an innovative approach that takes advantage of both types of experimental results (SEM images for residual impression and the recorded force–displacement curves) is proposed to determine the critical load associated with cracking of the coating surface by means of identifying the relationship between the diameter of circumferential cracks and the depth of indentation.
The mathematical algorithm
The experimental observations showed that the early cracks were often initiated at the coating surface, where the outer edge of the indenter contacts with the coating surface. 9 This is often seen as the start of the failure of the coating surface, therefore, the load corresponding to this point is treated as a ‘critical’ load. The purpose of the FE modelling and analysis was to identify this point numerically and the corresponding load applied.
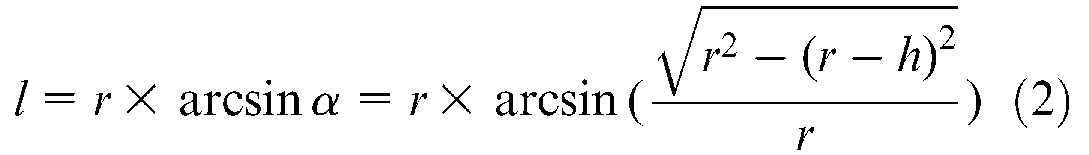
Figure 2 shows the geometric relationship of the tip radius of the indenter, r, the depth of indentation, h, the distance from the centre point to the contact edge, rc, the arc length under the contact area, l, and the arc angle, α. The depth of indention can be calculated by
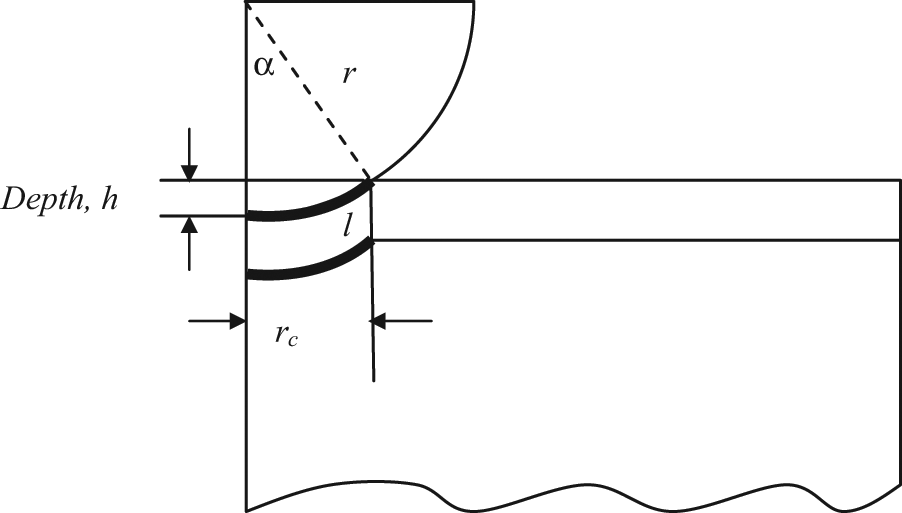
Geometrical relationship of arc length, arc angle, depth of indentation, tip radius of the indenter, and distance from the centre point to the contact edge.

The arc length under the contact-area can be expressed by
Based on the assumption that cracks occur at the contact edge of the indenter and the coating surface, the depth of indenter penetration into the coating surface when the crack is caused can be calculated from the measurement of the diameter/radius of the circumferential cracks using equation (1). The critical load associated with the initiation of the cracks can then be accessed from the loading force–displacement curve.
Case study
As shown in Figure 1(c), multi-circumferential cracks were also observed in the residual imprint when the load reached 60 N for a PN2 specimen. The diameter of the circumferential cracks was measured by using commercially available image processing software known as ImageJ. The software uses the micro-marker of the HRSEM image as a reference for measuring the diameter of the circle, which fits best to the diameter of the residual imprint. The diameter of the smallest circumferential crack in the PN2 HRSEM image was measured as 82 µm, giving rise to the depth of indenter associated with this crack being 7.9 µm using equation (1). Similarly, it can be observed that the first crack is induced as the indenter penetrated the PN1 specimen by approximately 5.95 µm, based on the measurement of 66 µm diameter for the smallest circumferential crack. The critical loads associated with these cracks can be determined from the loading force–displacement curve according to the depth of indentation calculated using equation (1). The critical loads inducing the first cracks for PN2 and PN1, for example, were obtained as 40 N and 20.5 N, respectively, from the loading force–displacement curves in Figure 3.
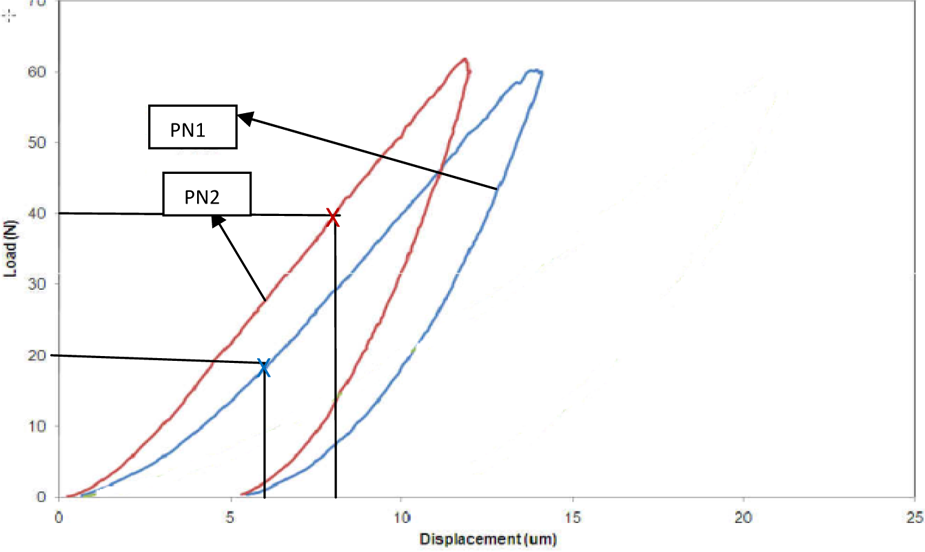
The critical load inducing the first crack for the PN1 specimen and the PN2 specimen, based on the depth of indentation in the loading force–displacement curve (marked with ‘x’).
We can see, from the aforementioned, that the critical load at which the first crack was nucleated can be determined by means of SEM images and force–displacement curves at highest loading. Apparently, critical loads related to nucleation of the cracks determined using this method enable the experimental investigation of load-bearing capacity to be simplified and the majority of indentation tests at different levels were avoided. The load-bearing capacity can be easily determined using this method owing to the clear image of residual imprint at high indentation loading conditions. There is no question that the algorithm proposed in this article provides a simple and concise way for the determination of load-bearing capacity on the coating by consideration of the crack within the coating surface.
Numerical analysis
In order to explore the rationality of the approach proposed in this study, the mechanism of the fracture in the coating surface was investigated using an FE model developed using the parameterise model integrated with the cohesive zone in the coating surface.
Modelling strategy
A continuum-mechanics FE model has been developed with a new modelling procedure, which combines the parameterised–modelling approach and cohesive-zone modelling technology.
Parameterised modelling
In this model, all possible factors associated with the failure behaviour of the coating, including material properties, geometry, and loading history, are defined with the corresponding parameters. The geometrical model, for example, can be defined by the parameters prescribed as the widths and thickness of the coating, the hardened case, and of the substrate, while the mesh scheme is controlled by the parameters concerning the density of the elements and the dimensions of the model. The element size of the central block of the coating in the x-direction, for instance, can be prescribed by dividing its width by the number of elements in the same direction in this part. Simultaneously, the coordinates and number of nodes are determined by these parameters in an Abaqus (Abaqus, Inc, Rising Sun Mills, RI, USA) input file. The tie constraint is defined in the contacting surfaces between the coating, the hardened case, and the substrate. A contact pair is defined for the contact between the indenter and the upper coating layer, which allows for a small amount of sliding in the tangential direction.
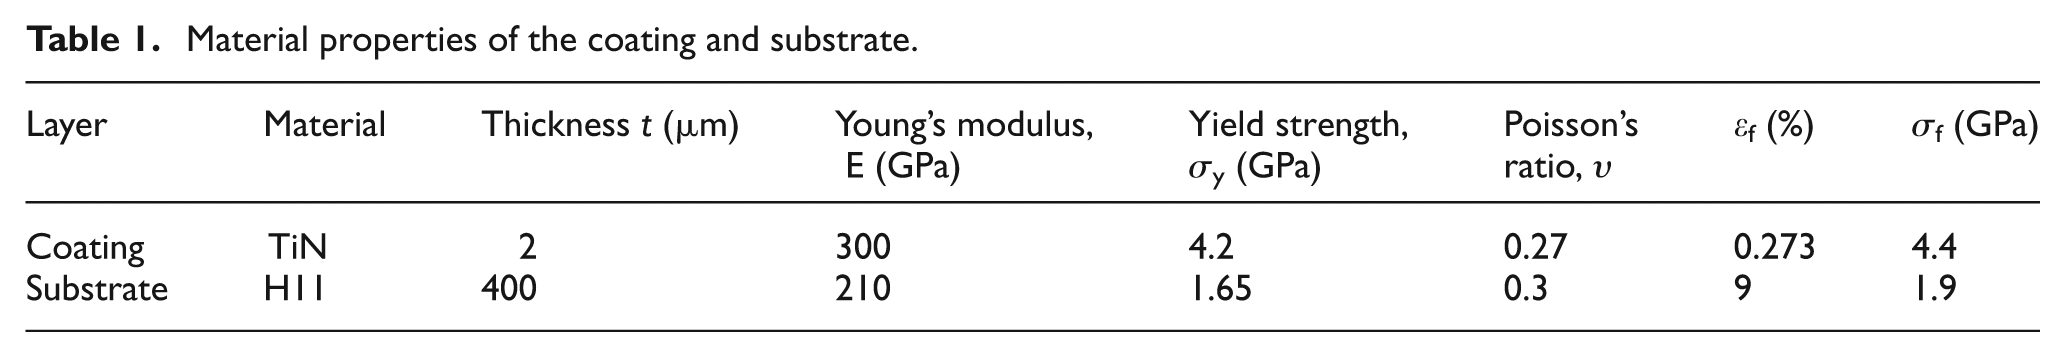
Figure 4 shows a typical example of the model, which is obtained simply by providing the values of corresponding parameters. This model is composed of three layers: the TiN coating, the diffusion zone or hardened case, and the H11 substrate steel. The model was indented by a micro-indenter of 100 µm radius. Both the coating and the substrate are characterised as being homogenous, with elastic properties followed by linearly hardening plastic behaviour. Prior to coating, the substrate is heat treated by plasma nitriding, and therefore, the material properties of the top layer of the substrate (the hardened case or diffusion zone) have been modified to enhance the load-bearing capacity of the coating/substrate system. The cross-sectional hardness of the hardened layer is converted into the corresponding yield strength. The mathematical function of yield strength versus the depth of the hardened case is obtained by the best-curve fitting technique and then implemented in the model with the field method (Figure 5). All of the material properties used in this model were provided by the Surface Engineering Group at Birmingham University and are presented in Table 1.
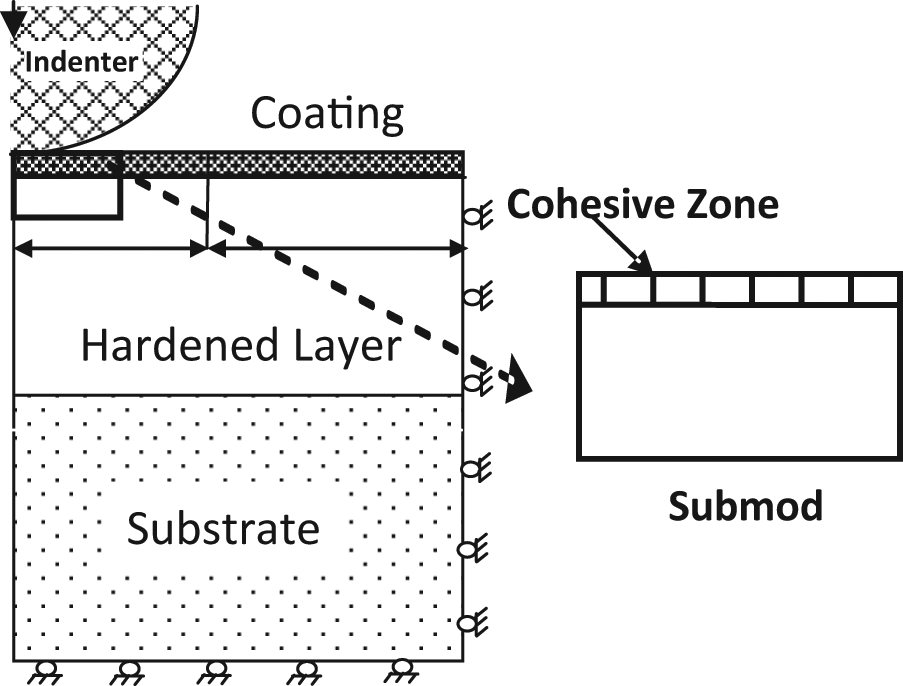
Scheme of the numerical model of coating/diffusion/substrate systems indented by a spherical indenter and the selected sub-model.
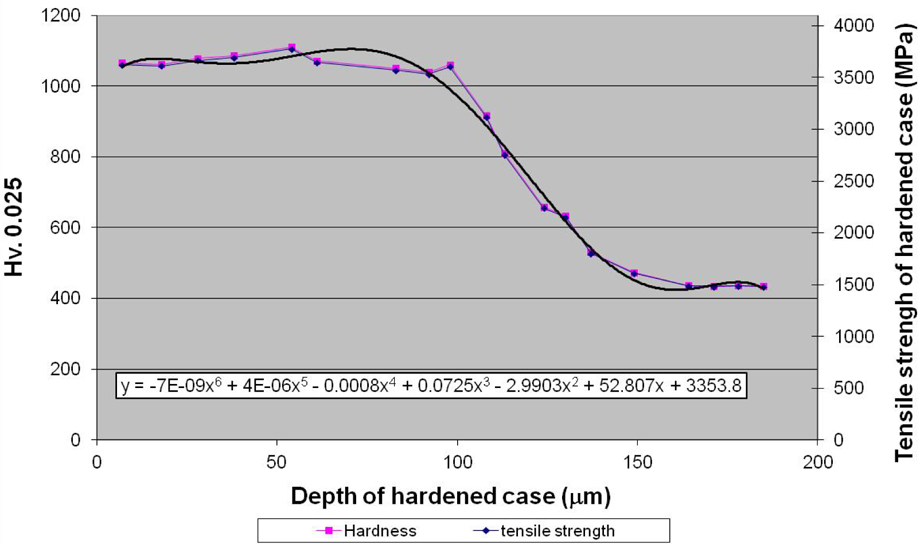
Vickers hardness of the hardened case of nitrided H11 for 30 h showing the converted tensile strength; and the function indicating yield strength versus the depth of the hardening, formulated through the curve fitting.
Material properties of the coating and substrate.
Cohesive-zone model
From the macroscopic point-of-view, the process of fracture in the coating surface and the delamination of the coating/substrate interface can be viewed as a progressive deterioration of material strength across two adjacent and opposite virtual-crack surfaces. At the atomic level, the cohesive tractions between the adjacent virtual-crack surfaces, which are originally produced owing to the inter-atomic forces, work as the resistance against the separation of two surfaces.
Under external loading conditions, the distance between the atom changes and the inter-atomic traction increases to a maximum, with subsequent decrease. The moment when the interfacial tractions start to decrease, the two adjacent and opposite surfaces separate from each other completely, defining the formation of a macroscopic crack in the coating. In this article, cohesive elements are placed between each pair of the continuum elements in the coating (Figure 4) and the irreversible bilinear cohesive-zone model 10 is employed to simulate the initiation and propagation of a crack within the coating. The bilinear cohesive-zone mode is described in Figure 6 and the cohesive constitutive law can be written as
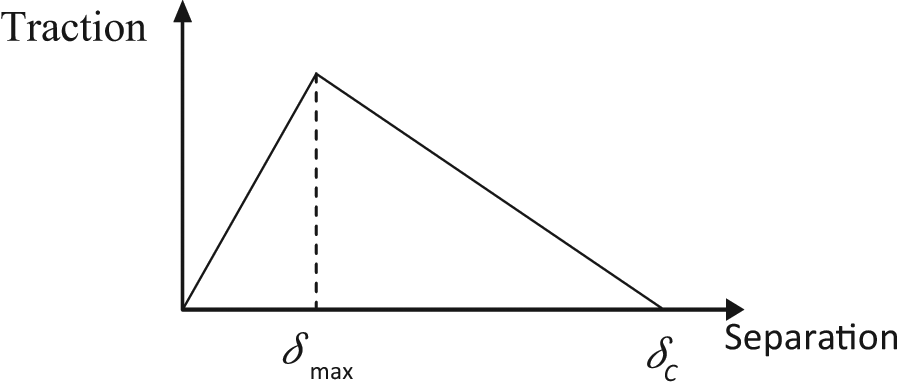
The bilinear cohesive-zone model.

where Gc is the critical energy-release rate, indicating the energy per metre square, governing the damage evolution; Tmax indicates the maximum traction, the unit of which is Newton per metre square; and δ c is the characteristic cohesive-zone length to which the separation reaches when the crack surfaces will be generated. A crack in the coating layer may be initiated when the separation reaches the critical value of δ max , at which point the traction achieves its maximum value, Tmax. More details of the modelling procedure are included in Feng et al. 11
Numerical results analysis
The critical loads inducing the first cracks were also investigated for PN1 and PN2 specimens, respectively, based on the methodology mentioned above.
FE results showed that the cracks were initiated as the loads from the indenter reached approximately 22 N for PN1 and 41 N for PN2. The force–displacement curves in Figure 7(c) and (d) show that the corresponding depths of the indenter related to the first cracks were about 5 µm for PN1 and 7.9 µm for PN2. As shown in Figure 7(a), the cracks were observed in numerical results when the load on the PN1 specimen reached 30 N and the minimum diameter of circumferential crack was 64 µm, which is very close to the measurement from the SEM image of 66 µm. For PN2 specimen, the crack was observed as the load reached 41 N and minimum diameter of circumferential crack was about 82 µm, which is slightly more than the observation from the SEM image of 80 µm. It is clear that the numerical results agree well those observed in the experimental results.
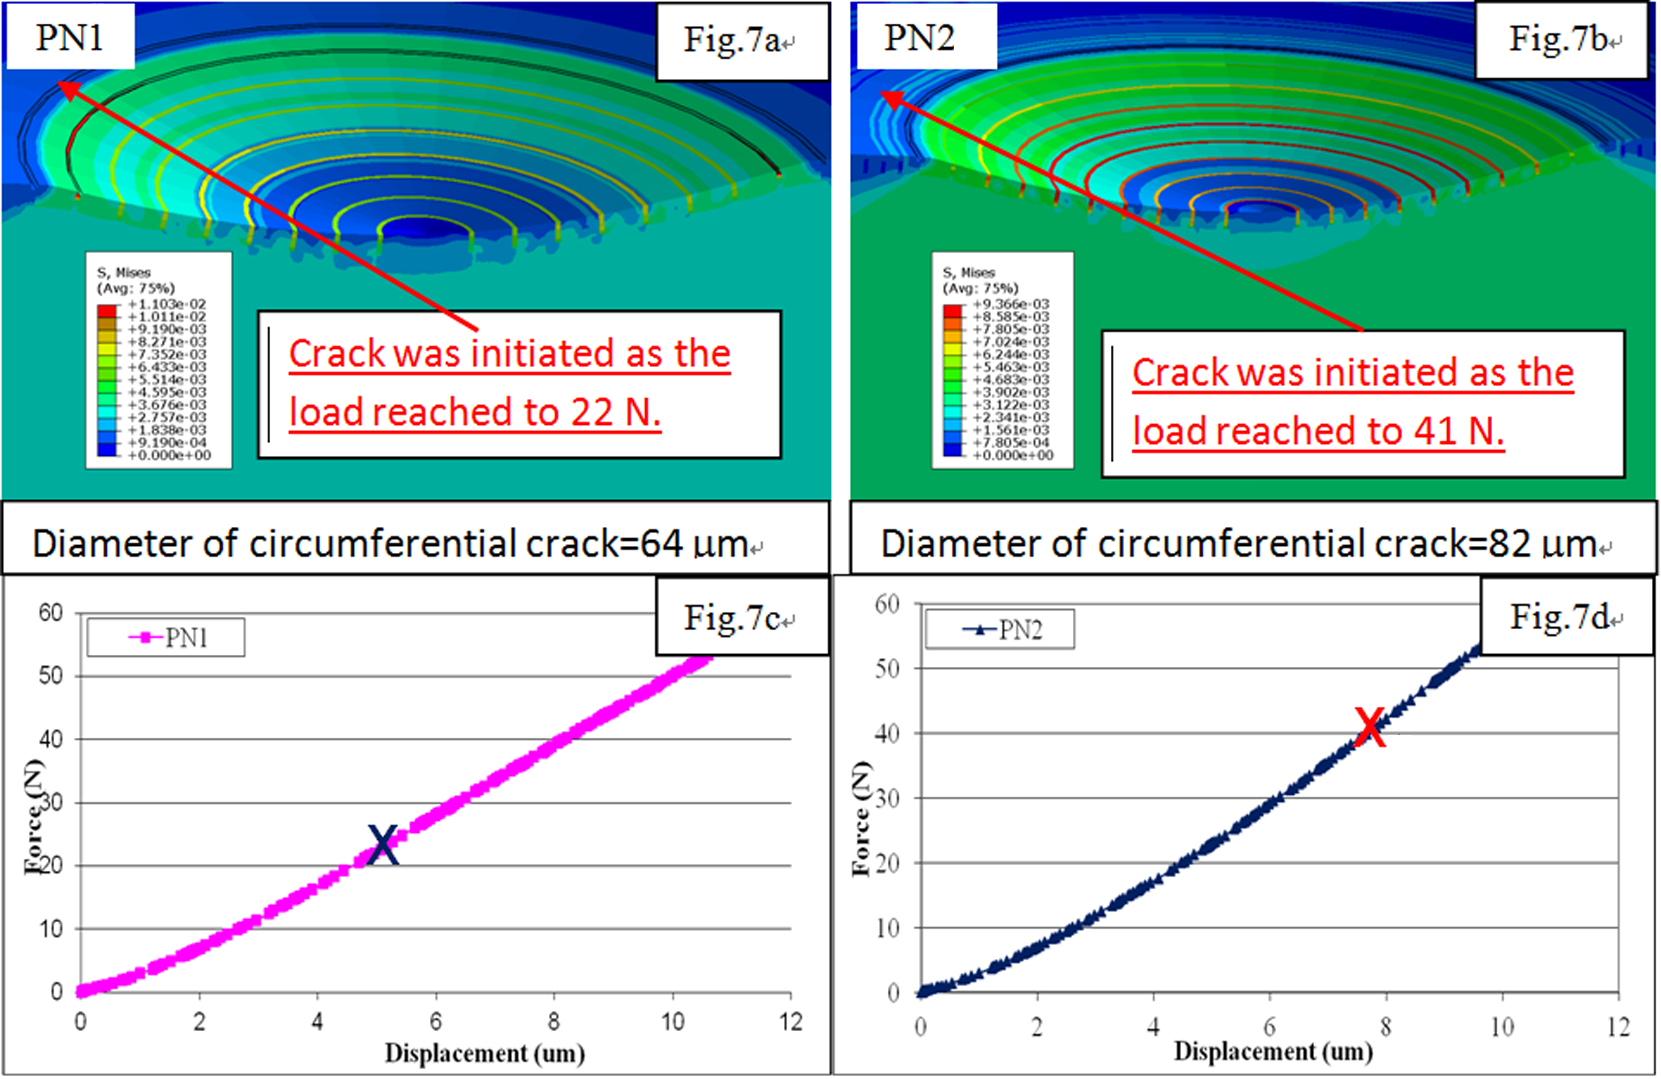
The numerical results of the critical loads, depths of indenter, and diameters of circumferential cracks for PN1 and PN2.
Discussion
As the film on the ductile substrate is subjected to the spherical indentation, the multiple circumferential cracks were generated at and near the contact edge, which is normally observed by SEM images of residual indentation impression. Figure 8 showed a SEM image for multiple circumferential cracks, which was observed in the surface of CrN coating on 42CrMo4 substrate when it is subjected to 80 N of spherical indentation. The multiple circumferential cracks were generated owing to the substantial bending near the edge of contact. The mechanisms for the pattern of cracks were complex, which are beyond the scope of the investigation of this article.
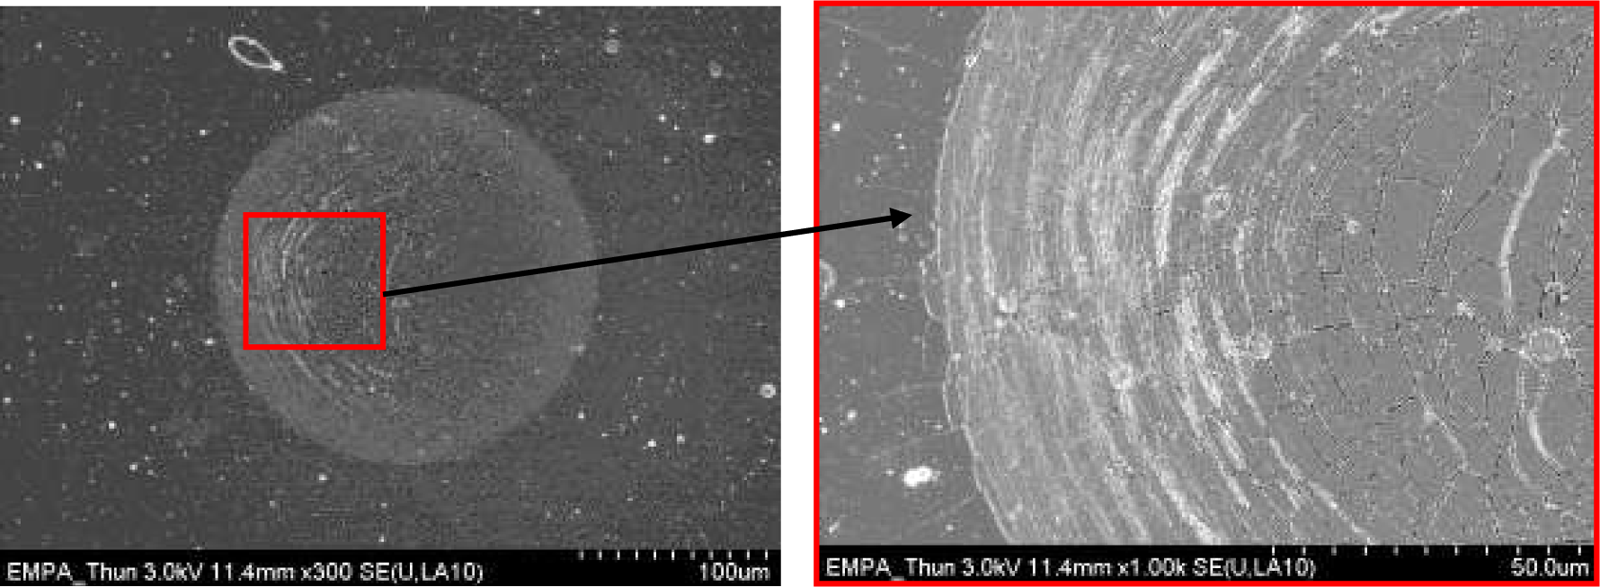
An example for the multiple circumferential cracks.
The critical loads inducing the first crack in the coating surfaces predicted using the diameter of circumferential cracks were compared with the results of the indentation tests. No crack was observed in the SEM image for both the PN1 and the PN2 specimens as the load of the indenter reached 20 N. As the indenter further advanced, cracks were observed for the PN1 specimen as the load reached 30 N, and for the PN2 specimen at 40 N. As the load increased to 60 N, the multiple circumferential cracks were clearly visible on both specimens. From a series of indentation tests, the critical load at which the crack was nucleated was speculated to be between 20 N–30 N for PN1 and 30 N–40 N for PN2. The critical loads related to the initiation of the crack determined using the method proposed in this article are 20.5 N for PN1 and 40 N for PN2, which are within the range of the indentation test results.
Furthermore, the results determined using the method proposed were approved by the FE simulation results. The differences between the FE and experiment results in this study are less than 1%, revealing that the predicted critical loads inducing the first crack are in accordance with the observations of indentation tests and simulation results, demonstrating the feasibility of the approach proposed.
Failure mechanism in the coating surface
The development of compressive and tensile stress in the TiN coating surface on the 42CrMo4 substrate at different depth of penetration of the indenter has been shown in Figure 9. As shown in the contour of radial stress along the coating surface (Figure 9(a)), compressive stresses prevail within the contact area owing to the loading from the indenter, and because at the edge of the contact area and beyond the contact area, tensile stresses will exist owing to the sinking of the substrate material (owing to plastic deformation) and bending of the coating layer. This figure also shows the crack occurred immediately outside the contact area (physical crack behaviour is visible in the magnified rectangular image). The propagation of radial stresses along the coating surface as the indenter advances to 1.52 µm, 1.86 µm, and 2.36 µm is shown in Figure 9(c). Three vertical lines indicate the contact-edge between the indenter and the coating surface as the indenter advances to these three positions. It is clear in both figures that the radial stresses are compressive within the contact area and that tensile stresses are applied beyond the contact area. The maximum radial stress increases with the increasing depth of penetration of the indenter until it reaches its critical value of tensile strength. As the indenter advanced to 2.36 µm, the energy release rate reached the critical value, 45 J/m2, at which time a crack occurred in the coating surface at approximately 20 µm radial distance from the centre point. Figure 9(b) and (d) shows the distribution and propagation of von Mises stresses as the indenter advances. It can be seen that the further away from the centre point, the greater are the Mises stresses.
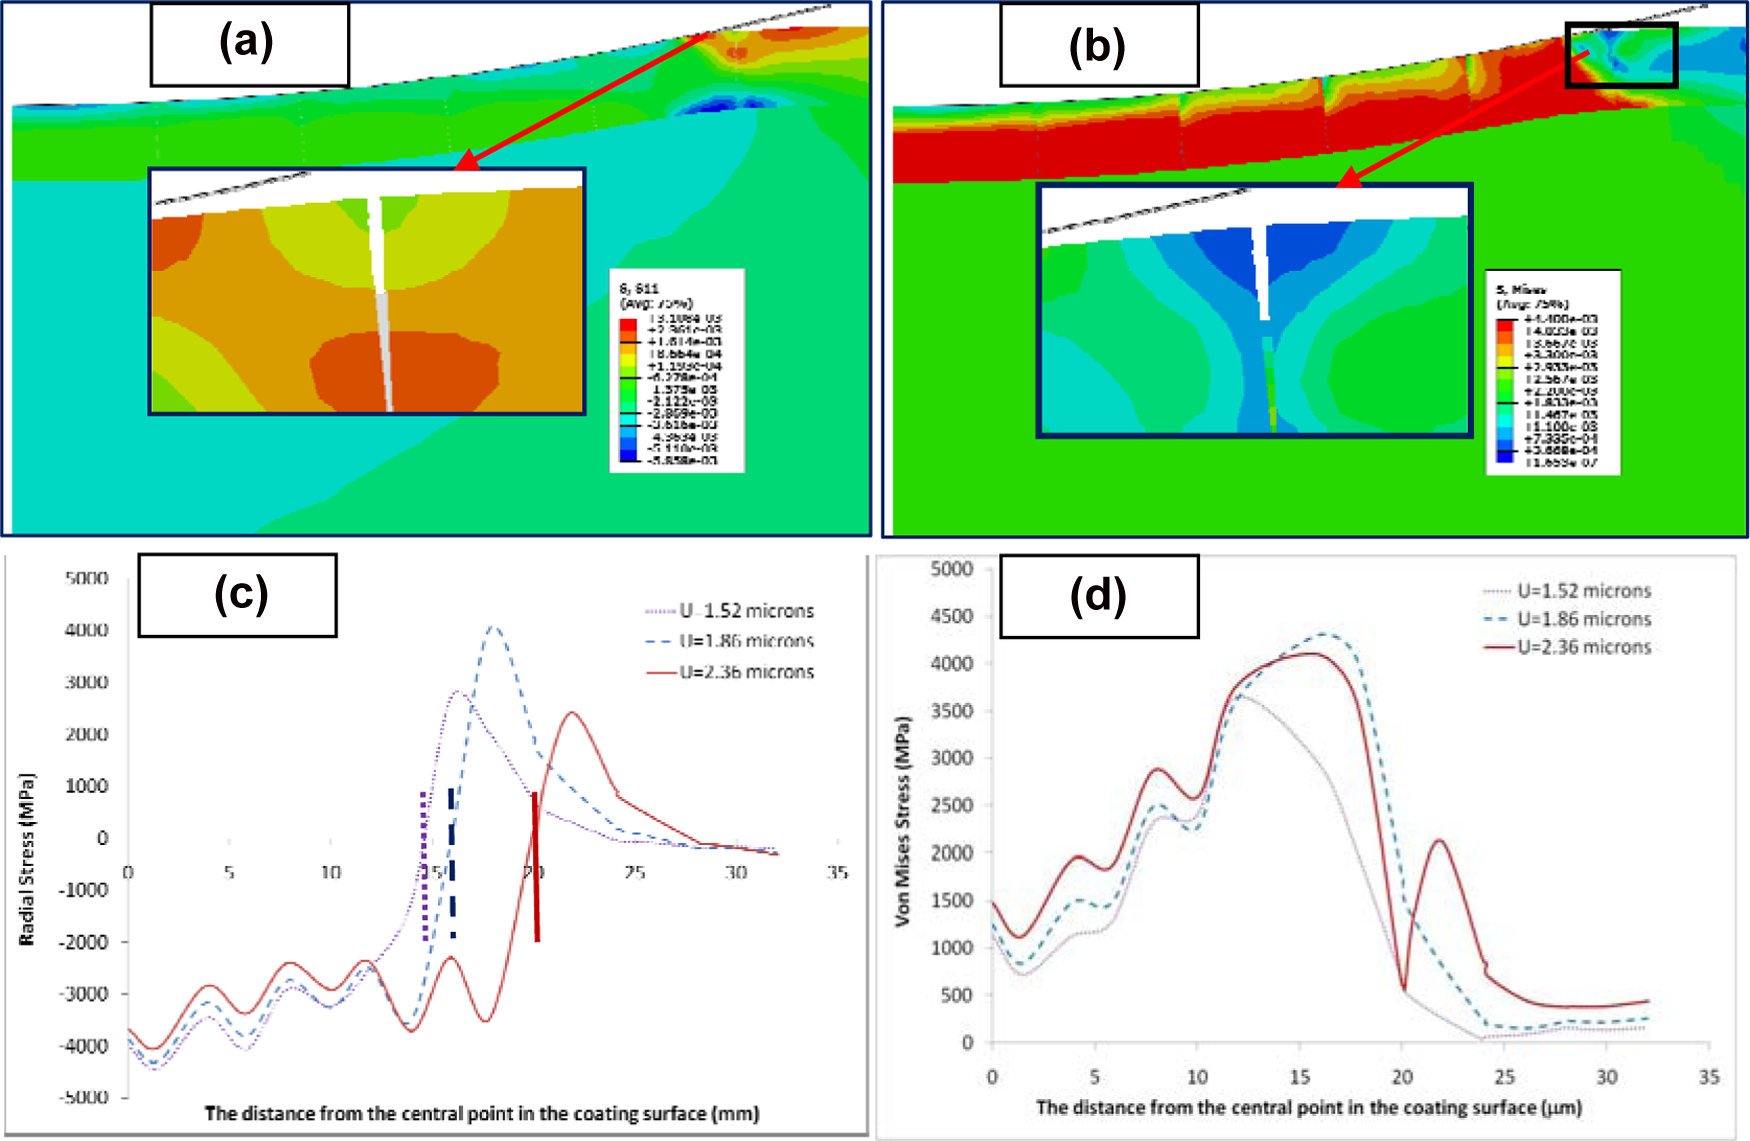
Radial stress (a) and von Mises stress (b) contours when the first crack occurs; the crack is shown in the magnified image. Radial stress (c) and von Mises stress (d) as indenter advanced to the three depths; vertical lines indicate the contact-edges associated with the three depths of indenter.
Actually, it has been pointed out previously that the residual imprint, after a spherical indentation, usually reveals a typically circumferential crack pattern in nature, which is caused by the tensile stretching of the film. 12 The mechanical and failure behaviours analysed above also revealed the coating surface cracks were caused by tensile stresses resulting from the bending of the coating layer owing to sinking of substrate materials. The fact of the crack occurring at the edge of the contact region between the spherical indenter and coating surface revealed the rationality of the approach proposed.
The critical loads predicted by means of the method proposed in this study showed good agreement with those determined through indentation tests, which demonstrated the accuracy and feasibility of the proposed approach. Inaccuracy may be caused by visible error for identification of circumferential cracks, but it will not affect the applicability of this method.
Conclusion
Accurately predicting the failure of multi-layered surface systems is of significance for both scientific and engineering communities concerned with the chain of design, manufacturing, and use of coating products. The prediction of load-bearing capacity in terms of fracture in the coating surface is of particular importance for tools/products. In this article, an algorithm is derived to determine the critical load inducing cracks through identifying the relationship of the diameter of the circumferential cracks and the associated depth of the indenter, which allows the critical load to be assessed from the recorded SEM image and force–displacement curve at the higher loading level of the indentation test.
It has been confirmed by two case studies that the approach proposed in this article provides a simple, efficient, and feasible way to determine the critical load inducing the cracks. The deformation mechanism and fracture behaviour investigated using an FE modelling procedure demonstrated that the cracks usually occur at the contact-edge between the indenter and the coating surface owing to the bending of the coating layer caused by the load of the indenter and the consequent sinking of the substrate. Fracture behaviour investigated using FE modelling procedures have further confirmed the applicability of the approach proposed.
Footnotes
Acknowledgements
This research was support by the FP7 project ‘Multiscale Modelling for Multilayered Surface Systems (M3-2S)’, Grant No. CP-FP213600-2 M3-2S.