
Abstract
An isotropic weld nugget is generally assumed in modelling spot weld behaviour. The present investigation is aimed at understanding the influence of anisotropy of base metal in the characteristics of the spot weld. The spot welding experiments were carried out on specimens along three different orientations with respect to rolling direction. The spot weld section is analysed and the influence of the base metal anisotropy on the microstructure and hardness profile was established. Lap-shear tensile testing was carried out to establish the influence of anisotropy in the weld failure strength. It has been inferred that the base metal anisotropy has considerable influence on the width and hardness of the heat affected zone. The base metal anisotropy also influences the weld failure strength. The variation of weld strength with orientation correlates well with the base metal monotonic strength. An anisotropic constitutive equation is used to predict the variation of weld strength with orientation. The theoretical prediction correlates with the experimental data.
Introduction
Resistance spot welding is widely used to join sheet metal components in automotive applications, where the material resistance to current flow offers the required heat input for welding. Research has been carried out to understand the influence of weld parameters, viz current density, 1 electrode force 2 and weld time 3 on the characteristics of the spot weld. The spot weld characteristics and failure modes can be related to the weld parameters, 4 hardness distribution, microstructure and material. 5 Advanced high-strength steels (AHSS) are increasingly being used in automotive industry towards lightweighting. 6 Several works have been carried out to study the weld behaviour of steels like dual phase (DP) steels 7 and transformation induced plasticity (TRIP) steels, 8 as the conventional input parameters and quality criteria cannot be adopted for high-strength steels. Marya and Gayden 9 studied the influence of different weld parameters on the weld fracture behaviour of DP steels. They observed that the weld microstructure and fracture behaviour are less sensitive to minor variation in chemical composition or galvanization, however are highly sensitive to the sheet thickness. Ma et al. 10 correlated the weld parameters and microstructure to the fatigue behaviour of the spot welded DP steels and observed that improper choice of process parameters can lead to interfacial failure during fatigue. In recent years, much attention is given to understanding spot weld behaviour of joining dissimilar metals 11 and different thicknesses. Sun et al. 12 joined aluminium and steel using a cold-clad transition insert at the spot weld interface. Joining dissimilar metals is challenging owing to the difference in chemical and mechanical properties of the base metal. 13 Marashi et al. 14 noted that the spot weld joining of dissimilar spot welds results in asymmetric nugget hardness and the hardness at the fusion zone is dependent upon the dilution (volume ratio of base metals in the nugget) between the two base metals.
Modelling the spot weld behaviour is essential for realistic estimation of sheet metal assembly behaviour. Several analytical models have been developed to understand the influence of weld variables in the prediction of spot weld behaviour; for instance Kim and Eagar 4 studied the influence of weld parameters on the weld lobe shape using a heat balance model. Wei and Ho 15 investigated the influence of weld parameters in the three-dimensional nugget growth during the spot weld process using an unsteady axisymmetric heat conduction model accounting for phase change during heating. Khan et al. 16 used a coupled electro-thermo mechanical analysis to study the spot weld process, where, in addition to the weld parameters, the effect of friction coefficient at the work piece interface is also studied. Feulvarch et al. 17 proposed a general electro-thermal model for the spot weld process to accurately account for the relative displacement between the contact surfaces, as most of the finite element models neglect the relative displacement between contact surfaces. Nodeh et al. 18 used an electro-thermo-mechanical modelling of the spot weld process and the predicted residual stresses were in agreement with the measured residual stress.
Chao 19 proposed analytical solutions for an interfacial and pullout failure mode of the spot weld based on fracture mechanics and plastic instability. Based on experimental observation, a stress distribution was assumed to derive the analytical expression for failure load. Mukhopadhyaya et al. 20 studied the spot weld strength using the Chao 19 model. They suggested that stress at failure is independent of weld input parameters and, hence, failure stress can be used to assess the spot weld strength instead of peak load at failure.
Most of the above research assumes an axisymmetrical nugget for modelling. 21 The axisymmetric nugget is suitable for isotropic weld properties. In general, the sheet metals used for automotive components are cold rolled sheet metals, where cold rolling and subsequent annealing induces anisotropy of mechanical properties. 22 Consideration of anisotropy of metals being joined on the behaviour of spot welds is scarce. In a typical automotive application, components such as floor panel, roof, pillars, etc., are joined along both the rolling and transverse directions to other components in the assembly. Accounting for the anisotropic effects in the determination of joint strength can improve the effectiveness of design for failure. The weld nugget formed during spot welding undergoes melting and solidification and, hence, cannot be expected to exhibit an anisotropy effect. However, the temperature in the heat affected zone (HAZ) is much less for melting, which induces thermal stresses. These thermal stresses are opposed by base metal surrounding the HAZ zone. The reaction force offered by a base metal against the thermal load is expected to exhibit an anisotropy effect, resulting in a difference of the spot weld characteristics with orientation.
In the present work, the influence of anisotropy of low-carbon steel on the spot weld characteristics is evaluated. The anisotropy behaviour is observed to influence the hardness distribution and spot weld strength.
Experimental work
The present study is carried out performed in 1.2 mm thick, commercially available, interstitial free (IF) sheets (weld parameters: 12.5 kA current, 0.2 s weld time and 360 kgf electrode force). The chemical composition of the base metal used for the study (from material supplier’s technical data sheet) is shown in Table 1.
Chemical composition of IF steel base metal used for study.
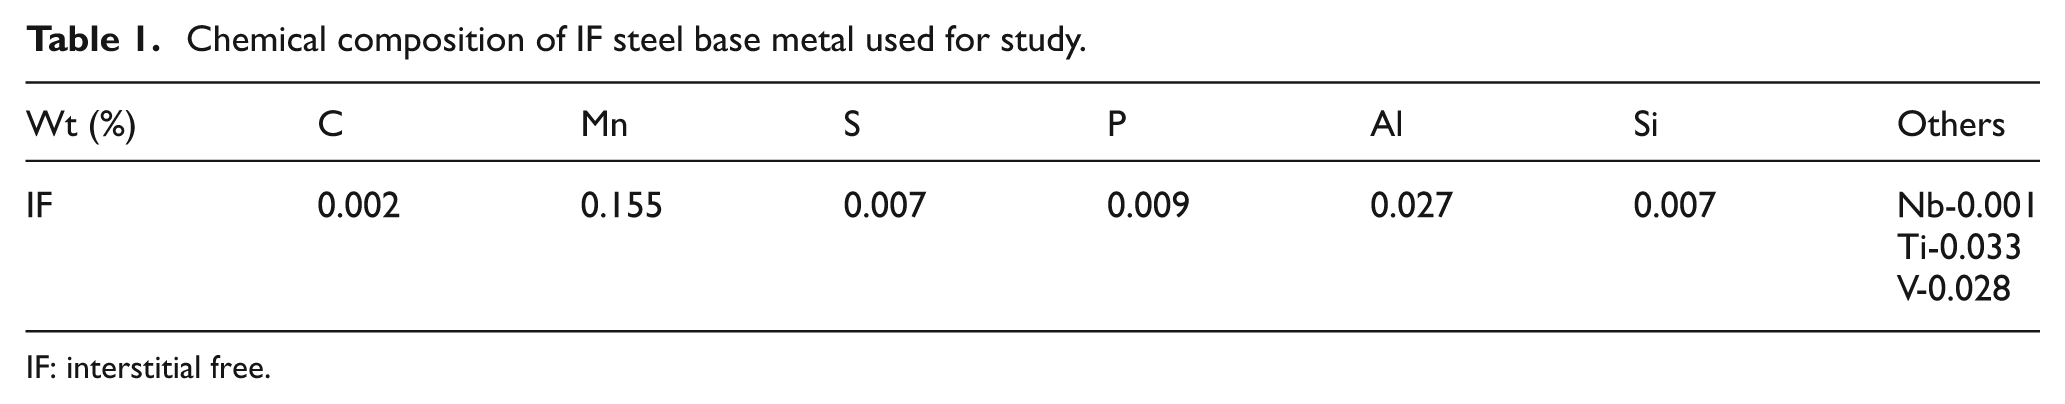
IF: interstitial free.
Tensile testing of base metal
Tensile testing of IF base metal samples was performed on the specimens prepared as per the ASTM E8 standard. The base metal specimens were prepared along three directions; rolling (0°), diagonal (45°) and perpendicular (90°) to the rolling direction. All the specimens were prepared from same sheet metal blank for consistency. Testing was carried out at a constant cross-head speed of 0.5 mm/min. Extensometer of gauge length 25 mm was used for a precise measurement of the yield point. Anisotropy is characterized by plastic strain ratio, R. 23 Plastic strain ratio tests on IF base metal specimens were carried out as per ASTM E517 along the three directions mentioned above for tensile testing. A uniform cross-head speed of 2 mm/min was employed for carrying our plastic strain ratio tests. The specimens were elongated to 20% longitudinal strain. Value R is calculated using the formula

where ε w and ε t refers to the width and thickness strain; wf and wo refers to the final and initial widths of the specimen; and lf and lo refers to the final and initial lengths of the specimen. The mechanical properties were estimated from an average of three samples.
Microstructure
The metallographic samples were prepared along transverse section of welds. The polished metallographic samples were etched using a 3% Nital solution and the microstructure was studied using an optical microscope. The hardness profile across the weld section was determined using Vicker’s hardness machine (Zwick/Roell ) at a load of 1000 g. Owing to symmetry, hardness measurements are plotted from the centre of the fusion zone towards base metal.
Lap shear tests of spot welds
Lap shear specimens along three directions (0°, 45° and 90° to the rolling direction) were prepared to determine the strength of the spot weld. The lap shear testing was carried out in a servo-hydraulic universal testing machine at a constant cross-head speed of 5 mm/min. The load–displacement curve was recorded. The lap shear testing was repeated three times along each direction and the average value of peak load is noted as the failure load.
Results and discussion
A typical stress–strain curve of base metal along the three directions is shown in Figure 1. The variation in stress–strain behaviour with direction is owing to the texture induced anisotropy in IF steel. The mechanical properties estimated from an average of three samples along the three directions are given in Table 2.
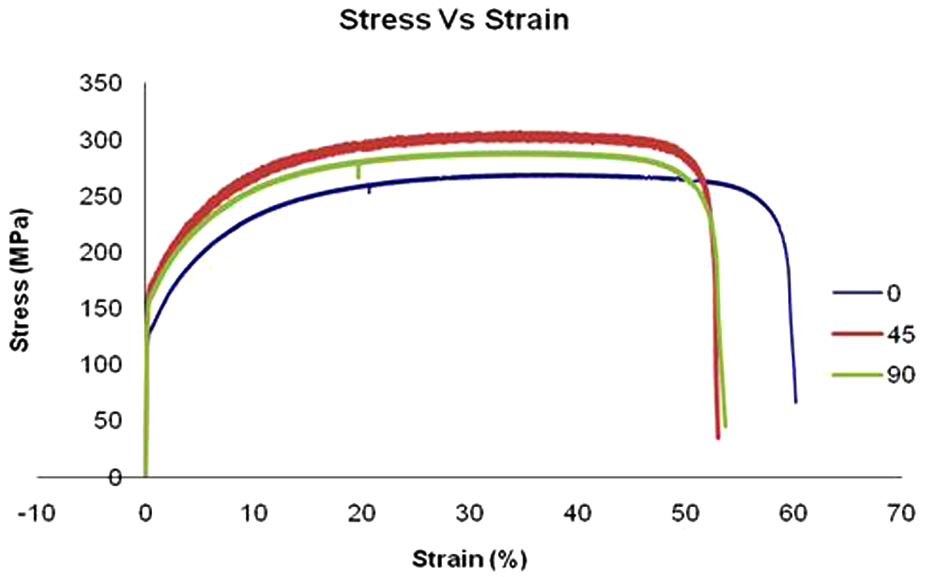
Stress–strain curve of base metal along different orientations.
Mechanical properties of base metal
YS: yield strength; UTS: ultimate tensile strength
Microstructure and hardness distribution
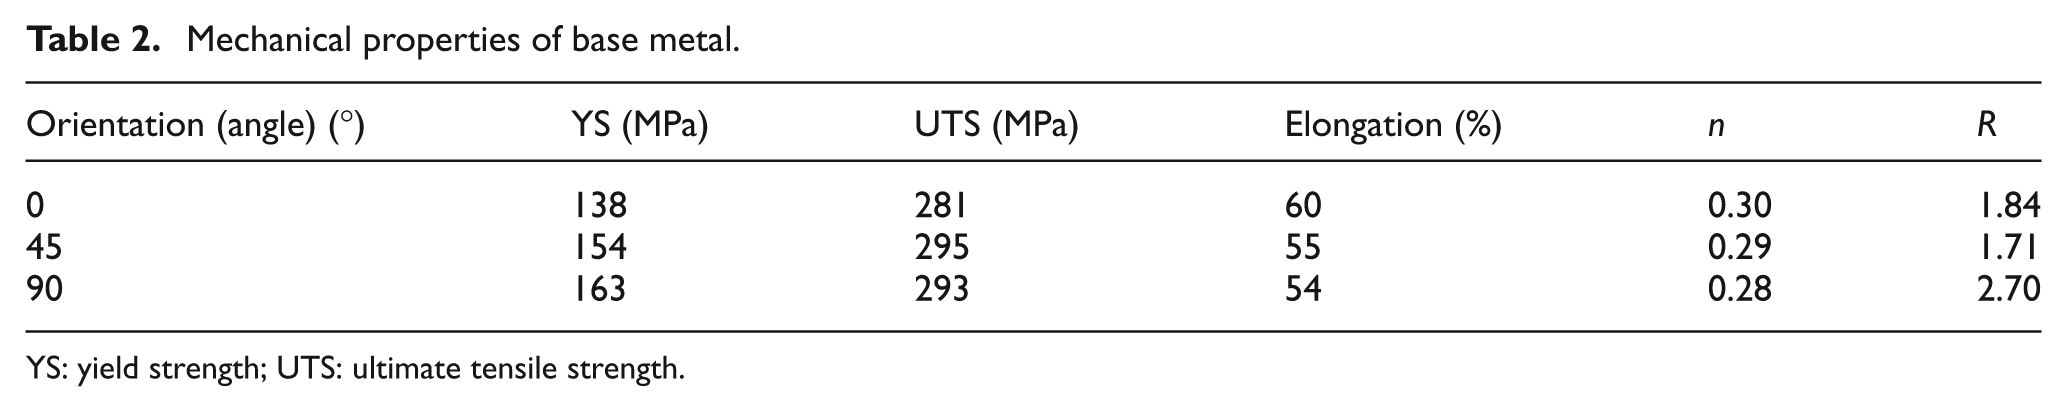
The macrostructure of the weld was influenced by anisotropy. The nugget width was almost constant, however the HAZ width exhibited considerable difference with orientation (Figure 2). The variation of HAZ width was inversely related to the variation of base metal yield strength.
Variation of HAZ width with orientation.
The microstructure (Figure 3) consisted of Widmanstatten ferrite 24 along with allotriomorphic ferrite. The fusion zone (Figure 4) is characterized with columnar grains grown opposite to the direction of heat flow. The surface in contact with the electrode exhibited equiaxed grains (Figure 5) owing to rapid cooling at the electrode–sheet interface. The HAZ displayed coarser ferrite grains elongated along the direction of heat flow. Bayraktar et al. 25 studied the grain growth mechanism of IF steels and attributed the excessive grain growth to a higher value of local thermal gradient when compared to the displacement rate of isotherm in the vicinity of austenite to ferrite transformation. The excessive grain growth observed in the HAZ zone could be owing to higher amplitude of thermal gradient, which increases from the fusion zone towards the base metal. Appreciable difference in microstructure was not observed between the spot weld sections along 0°, 45° and 90° to the rolling direction.
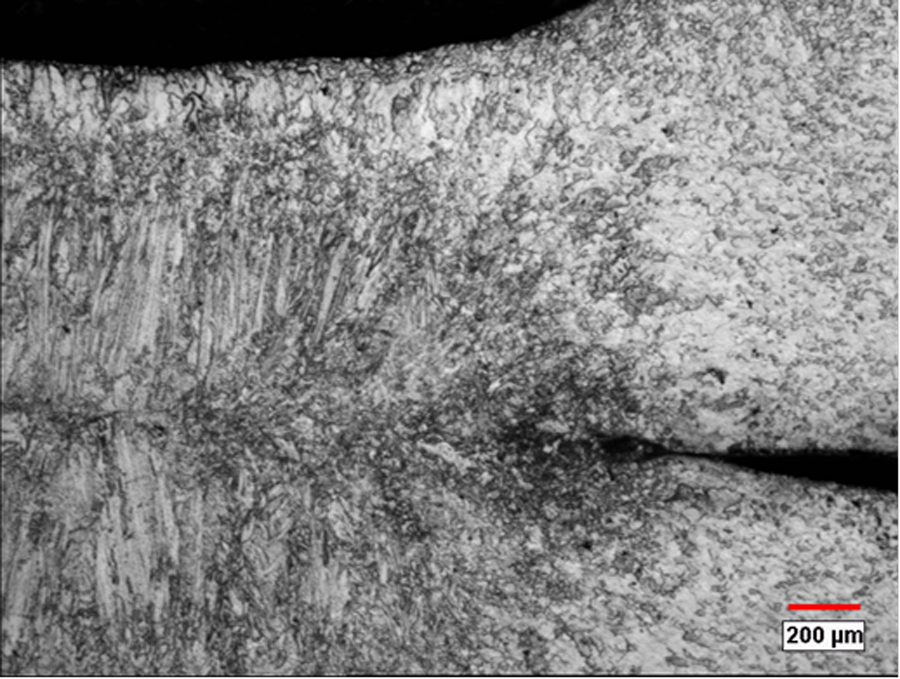
Microstructure of weld section displaying fusion zone, HAZ and base metal.
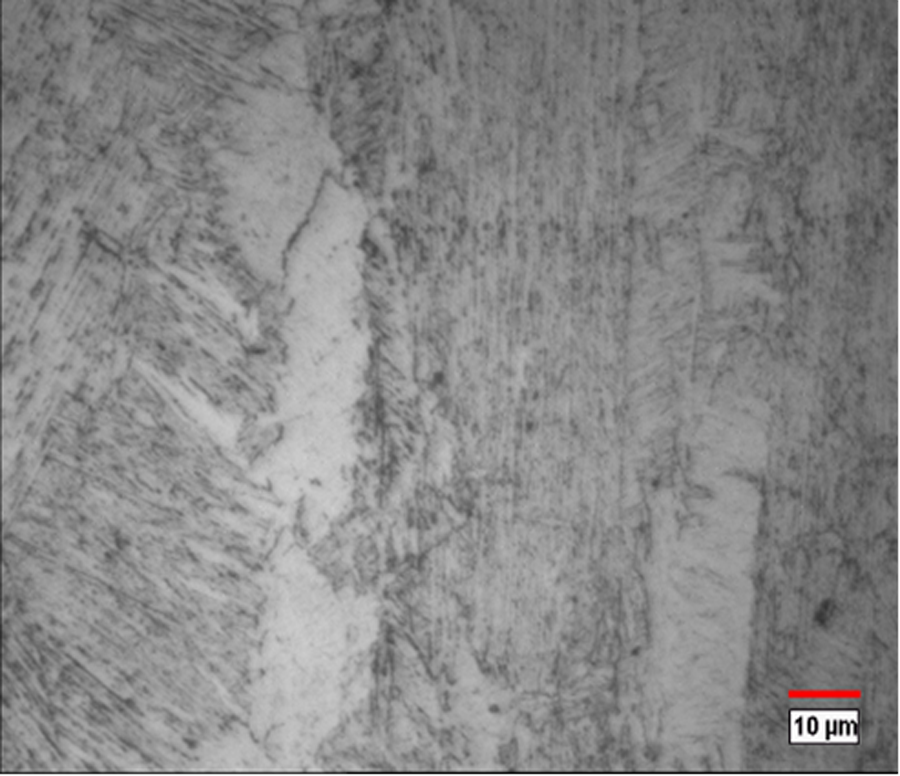
Fusion zone displaying allotriomorphic and Widmanstatten ferrite.
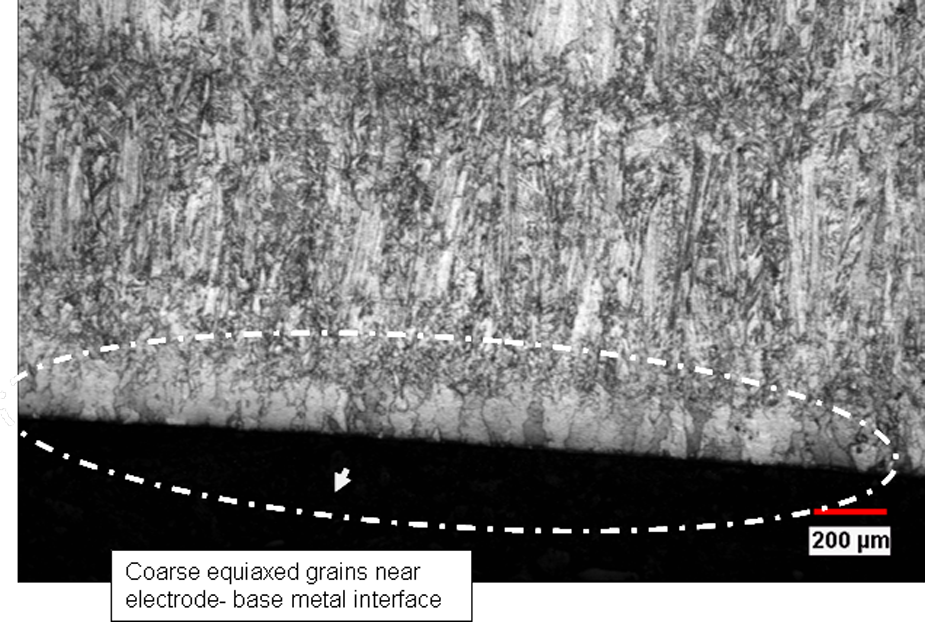
Equiaxed grains at electrode-base metal interface, below fusion zone.
The hardness profile of the spot weld section along three directions is displayed in Figure 6. The different regions along which the hardness measurements were taken are shown in Figure 6(b). Owing to the symmetry in microstructure of the spot weld, only one half of the weld section is characterized.
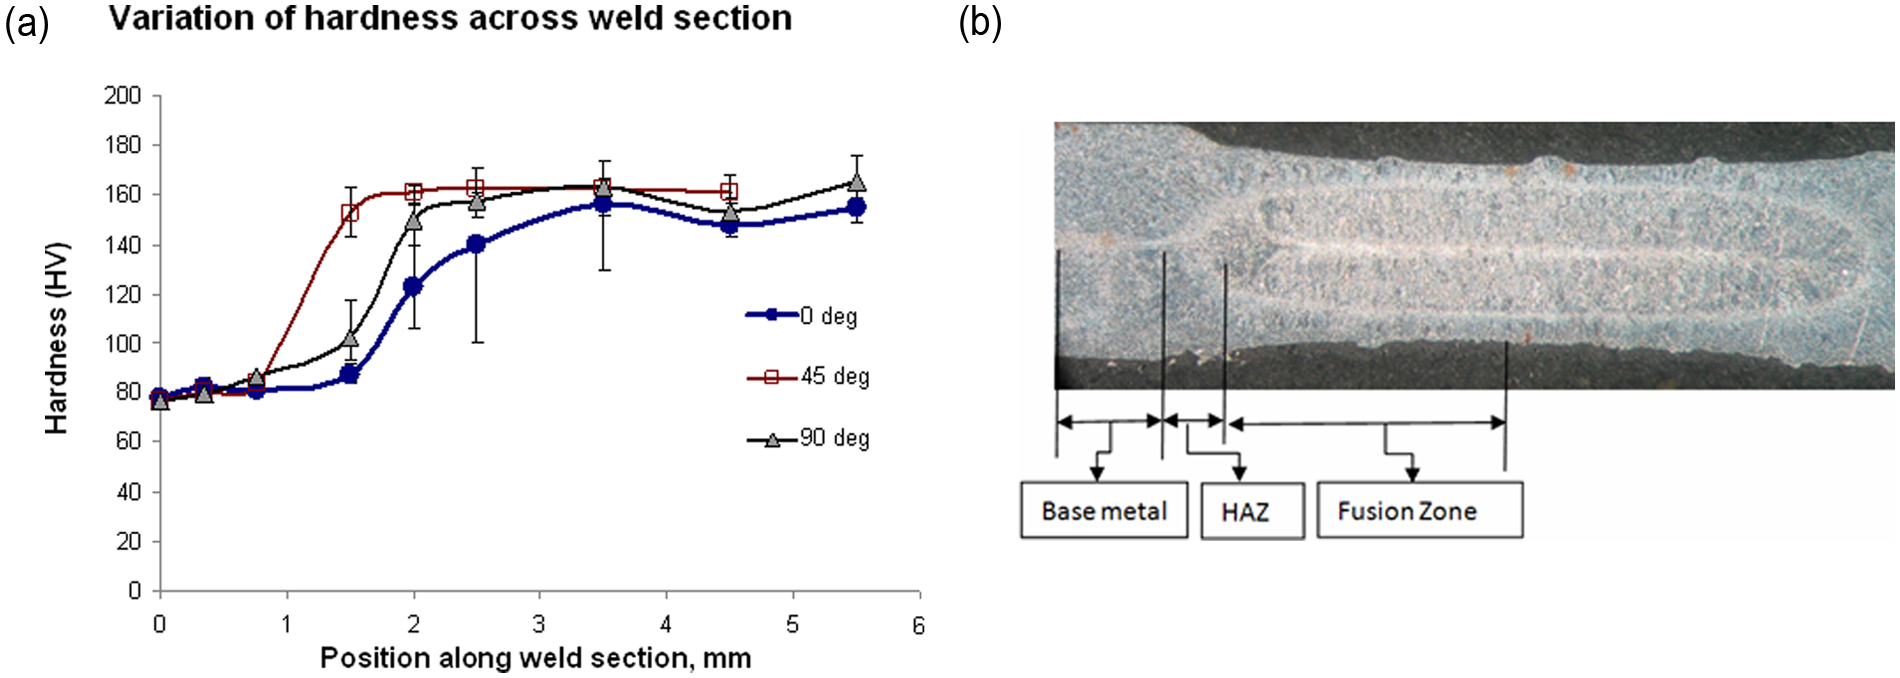
(a) Variation of hardness along a weld cross section; the hardness profile exhibits a difference with orientations in HAZs. (b) The locations along which the hardness measurements were taken in the spot weld section.
It is observed from the hardness profile that there is a significant variation of hardness from base metal to fusion zone. As discussed, the weld nugget is formed by melting and solidification owing to a high heat input. At a very high temperature, melting and subsequent recrystallization removes the texture present in a base metal. However, it is observed that the hardness profile exhibits appreciable difference owing to base metal anisotropy as it moves away from the fusion zone. The difference increases with distance from the fusion zone with maximum difference near the HAZ close to the base metal, indicating the influence of anisotropy at relatively lower temperature zones. The HAZ is subjected to a temperature insufficient for recrystallization. This temperature induces thermal stresses on the surrounding material. The resistance offered by the surrounding material to the thermal stress depends on its strength. This is indicated by the variation of HAZ (Figure 2) dimension where the HAZ width is maximum along the rolling direction when minimum base metal yield strength is minimum and vice versa along the transverse direction. For a constant thermal load, the resistance to the thermal stress offered by a stronger metal will be more than that of the softer metal. The hardness distribution is an indicator of the resistance to thermal stress. It is observed that the hardness of the HAZ zone is lowest for the rolling direction and highest for the transverse direction. This indicates that the rolling direction offers least and transverse direction offers maximum resistance to the thermal load. This is in agreement with the mechanical properties (Table 2) with minimum yield strength along the rolling direction and maximum yield strength along the transverse direction.
Spot weld strength from lap shear tests
The peak load to failure of the spot weld is determined from lap shear tests. All the samples failed by nugget pull-out mode and failure occurred near the HAZ. Anisotropy of sheet metals had a distinct effect on the peak load of failure as indicated by Figure 7. The peak load of failure follows the trend of anisotropic monotonic yield strength (least along the rolling direction and maximum along the transverse direction).
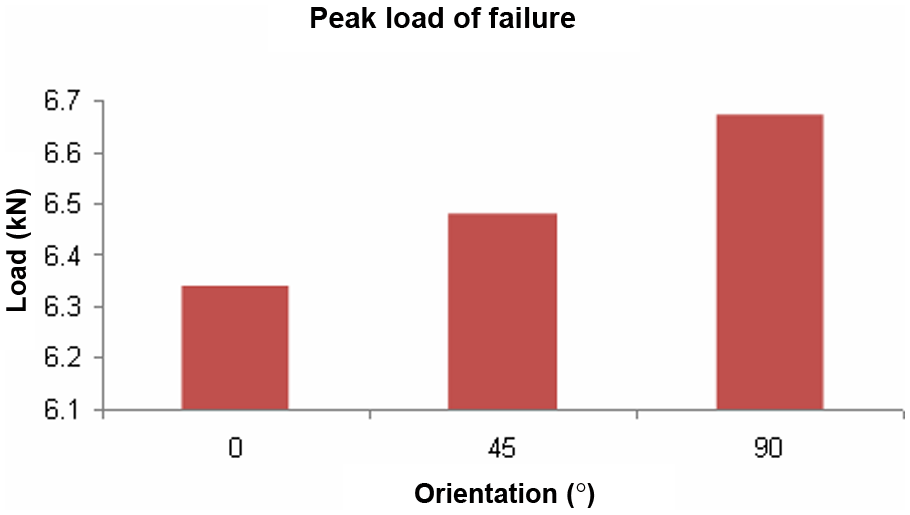
Variation of peak load of failure with orientation.
Mukhopadhyaya et al. 20 proposed to use the stress at failure rather than peak load to failure, as unlike load, failure stress is independent of weld processing and material parameters. Chao 19 analytically modelled the stress distribution in the spot weld that can be used to determine the failure stress of the spot weld from the nugget dimensions and peak load of failure. Accordingly, the failure stress of the spot weld is given as

where σ f refers to the stress at failure, Pf refers to the peak load to failure, d refers to the nugget diameter and t refers to the thickness.
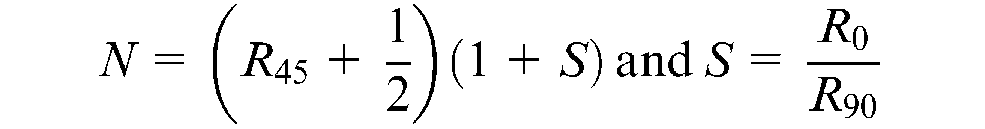
The variation of the spot weld strength with orientation can be modelled using an anisotropic yield criterion. Several anisotropic yield criteria have been proposed in the past. Banabic 23 has reviewed in detail the developments of phenomenological anisotropic yield criteria. In the present work, Hill48 criterion is used to predict the variation of failure stress. The variation of uniaxial stress using Hill48 criterion 26 is given as
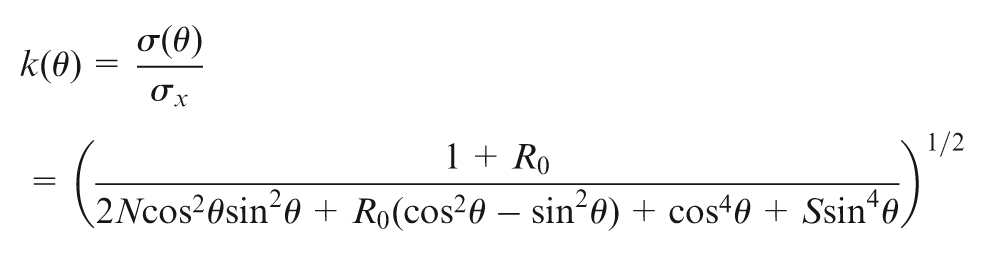
where
The variation of experimental monotonic yield strength and failure stress of the spot welded joint normalized with their respective values along the rolling direction is compared with the theoretical prediction. It is observed (Figure 8) that the variation of weld strength matches closely to the variation of yield strength of the base metal. However, the theoretical prediction does not correlate well with the experiment along the transverse direction. The accuracy of theoretical prediction is highly dependent on the choice of yield criterion. 27 Appropriate choice of anisotropic yield criterion will enable a more accurate prediction of variation of weld strength with orientation.
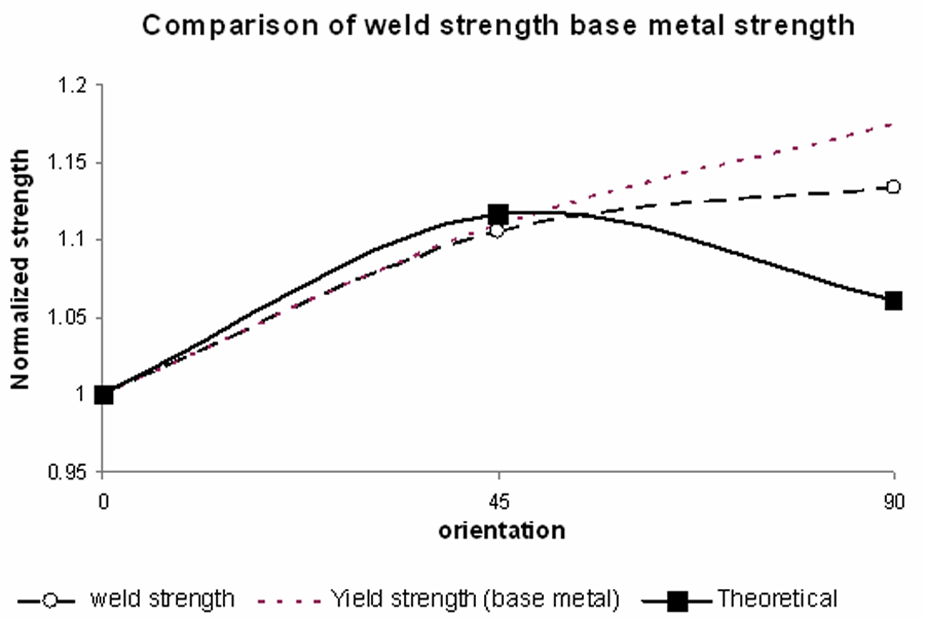
Variation of normalized stress with orientation.
The influence of anisotropy in the spot weld is not considered in most of the structural analysis, such as the determination of weld strength, stress intensity factor, etc. The variation of the spot weld strength with orientation can be used in the sheet metal assembly design. Similarly, the stress intensity factor determination can use a varying nugget diameter to model the sensitivity of orientation to crack propagation during field failures.
Conclusion
Based on the present study, the following conclusions are made.
The base metal anisotropy of the sheets being welded influences the spot weld characteristics.
The HAZ width is influenced by the anisotropy of the base metal and is inversely proportional to the yield strength of the corresponding orientation. The hardness profile of the HAZ close to the base metal exhibited considerable difference between orientations of sheet metal, though the nugget hardness is not influenced by anisotropy effect owing to melting and solidification.
The weld strength varies with orientation and closely follows the trend of monotonic yield strength. Hill48 criterion was able to predict the variation of weld strength with orientation, except in the transverse direction. Advanced anisotropic yield criteria can be employed for a more accurate prediction.
The variation of the spot weld characteristics can be incorporated into the spot weld modelling, which may result in a more accurate prediction of structural analysis with spot welds.
Footnotes
Acknowledgements
Authors would like to thank Ms Kalaivani, Advanced Engineering, Mr Pari, CPPS, Ashok Leyland and Mr Balasubramoni, student, IIT Madras for their support in testing.
This research received no specific grant from any funding agency in the public, commercial, or not-for-profit sectors