
Abstract
Centres of Excellence (CEs) are thought to provide better quality services for their speciality than Generic Services (GS). However, clinical test theory suggests this may arise from differences in the prevalence of these specialities’ conditions in their referral populations, which affects the services’ ability to detect diagnoses accurately, even with similar diagnostic sensitivities and specificities. Furthermore, GS’ insensitivity to rarer diagnoses is necessary to avoid serious overdiagnosis despite using skills equivalent to CEs. Good GS can perform as well as CEs for disorders of 15% to 20% or greater prevalence in their referral populations, depending on the Minimal Clinically Important Difference (MCID) decided for their diagnoses’ positive predictive values or degree of bias. CEs are necessary for rare disorders and have a role in determining MCIDs and the sensitivity and specificity of new measures. Sensitivity, specificity, positive & negative predictive values, and true diagnostic prevalence should be routine outcome measures.
Centres of excellence may be defined as …a program within a healthcare institution which is assembled to supply an exceptionally high concentration of expertise and related resources centered on a particular area of medicine, delivering associated care in a comprehensive, interdisciplinary fashion to afford the best patient outcomes possible.
1
It is received wisdom that such centres are better than more general ones, and medical policy is usually biased towards their expansion via centralisation2,3 despite the risk that remote areas may lose out. 4 Centres of excellence (henceforth CEs) are essential for the “hub and spoke” model of service delivery, which includes medical training.5–7 However, populations served by “hubs” and “spokes” may differ. 8 While “spokes” can improve reach, especially using telemedicine,7,9 more in-depth training takes place in the “hub” with both “push” and “pull” factors working to orientate students hubwards 10 as a source of excellence, so tailoring their skills to those most relevant for the hub. They seem expensive if the costs of teaching centres are treated as a proxy measure for them. In neurosurgery, costs in teaching hospitals are 21% greater than non-teaching ones, 11 and in orthopaedics, 33% or more than eight times the upper limit for cost-effective care when improvement in outcomes is considered. 12 Empirical research on CEs is limited by a paucity of studies 3 and domain, which has tended to concentrate on acute medicine and surgery.1,13,14 In the developing world, the picture is confusing regarding their use, e.g., depending on setting & role, substituting nurses for physicians, or the reverse, may be more effective. 15 Two broad themes seem to be emerging. Promising results at the local level do not generate the same benefit nationally,2,16 and CEs’ benefits are less detectable in more common conditions. 17 Both these trends resemble what has been called the “scale-up penalty”, which is the tendency for interventions’ effects to attenuate as they come to be delivered at scale. This is presumed to reflect a loss of fidelity, investment, and policy inefficiencies, i.e., like the claims regarding CEs versus Generic Services (GS). It is said to be prevalent in, for example, early years interventions, 18 but variation in research approaches have made it impossible to quantify an overall effect, 19 and empirical studies have not always detected it. 20
This literature suggests the development of CEs and their associated hub-and-spoke models should be conditional rather than universal, but there is currently no clinical basis for making these choices. However, with some assumptions, clinical testing theory (discussed below) can be used to set choice criteria.
Centres of excellence as diagnostic decision-makers
In psychiatry, there is a long tradition of understanding diagnosis as a disguised indication for treatment. 21 From this perspective, with optimal treatment pathways established, a centre of excellence will be no better than the diagnoses it confirms.
This is equivalent to saying that a diagnosis can be considered a test for a treatment: with the diagnosis obtained, optimal treatment can begin.
Determinants of effective testing in clinical test theory
Clinical Test Theory may be defined as the application of probability theory to clinical testing, deriving a set of parameters, listed below, that enables estimation of a test’s utility in clinical practice. • Reliability is the likelihood of two measures of the same thing giving the same result, either in the hands of different observers (inter-rater reliability) or at other times (repeat reliability). It is really the amount of random error associated with the measure. Because such error is inescapable, it sets a ceiling on how much a measure can be trusted. No measure can be more valid than it is reliable. • Validity is the extent to which the measure reflects what it is supposed to. As reliability captures random error, it is also the bias a clinical test might show, so it injects systematic error. So, adjusting validity can never compensate for unreliability. Bias can arise for many reasons, so there are many forms of validity, with various means of detection. • Sensitivity is the likelihood of a measure being able to detect what it is supposed to. Both reliability and validity contribute to sensitivity. • Specificity is the likelihood of a measure • Positive Predictive Value (PPV) is the likelihood of a measure identifying a case correctly in a population. It depends on the measure’s sensitivity, specificity and prevalence of cases. • Negative Predictive Value (NPV) is the likelihood of diagnosing a non-case (i.e., a case without the diagnosis of interest) correctly in a population. A diagnosis should have • Accuracy is the proportion of cases that have been correctly classified. Without bias, it should equal reliability, as the mean error rate should be constant and normally distributed. • Bias is the tendency of the test to over- or under-identify cases, so it measures validity, as discussed above. An unbiased test’s proportion of positive diagnoses should be equal to its population’s prevalence. • Minimal Clinically Important Difference (MCID) is the least difference in values for a measurement that identifies a clinically meaningful difference. It can never be below the limit set by a measure’s reliability and includes any bias.
Estimating the difference between centres of excellence and generic services
CEs for any diagnosis will see more of it than services offering generic care. It follows that, for any diagnosis, there will be a difference in prevalence between its CEs and GS. From the perspective of clinical decision-making, what will matter is the PPV and NPV of the diagnoses made, as these will determine the clinical intervention implemented. We want services to apply diagnostic-related interventions to patients with the diagnoses and other interventions to those who don’t. The PPV and NPV may be estimated from diagnostic sensitivity, specificity and true prevalence as follows


It follows that even if CEs have similar levels of skill to GS (i.e., their diagnoses have similar sensitivities and specificities), they will seem to perform better because they will have a higher prevalence of their specialist conditions.
Some MCID related to prevalence that distinguishes between CEs and GS could be used to determine whether developing a CE and its spokes is worthwhile if we assume all factors other than prevalence are captured in services’ diagnostic sensitivity and specificity. I shall return to this assumption below.
Estimation
As the use of clinical test theory is novel in this context, its parameters must be assumed a priori or derived from plausible findings in the literature.
Diagnostic sensitivity & specificity
Services diagnose, so these are their properties. Assume, as suggested above, that they are like share prices, i.e., summary statistics which capture all relevant service information. The 6-month mortality data in orthopaedic outcomes between major teaching and non-teaching hospitals for hip fractures, a common condition, suggests a 1% difference in performance between CEs and GS. 12 As discussed, outcome differences are less in more common conditions, when prevalence differences between service types reduce. Assuming that treatment is broadly equivalent contingent upon diagnosis (discussed below), the 1% difference in outcomes found is less than the 5% margin of uncertainty used in the estimations, so CEs and GS were not paramaterised separately.
Studies of sensitivity and specificity show wide variation. The only study to examine the relationship between sensitivity, specificity and prevalence 22 across diagnoses in an epidemiological sample reported strong correlations between true prevalence, sensitivity and specificity (.55 and -.85, respectively, for all billing physicians in Quebec; see Figure 3 below). The direction of the correlations suggests an expectancy effect, with the physicians considering rare diagnoses less frequently, avoiding false positives but at the price of reduced sensitivity. Two sets of sensitivities and specificities were modelled. Plausible estimates of sensitivity and specificity were derived from population studies of common conditions, as CEs should concentrate rare conditions in their referral populations. A range of 0.5 to 0.8 for sensitivity, and 0.6 to 0.95 for specificity, were consistent with findings for common disorders in general medicine,22,23 surgery 24 and psychiatry.25,26 Then, the floor prevalence, sensitivity, and specificity from 22 were used to estimate plausible effects of the postulated expectancy effects.
The changes in positive and negative predictive values, accuracy and bias at different sensitivities and specificities across prevalence were plotted using the “riskyr” package in R. 27
Results
Figure 1 below reports PPVs, NPVs, accuracy and proportion of positive diagnoses on a logarithmic prevalence scale, to allow examination of these under conditions of rarity. For ease of interpretation, only the lower and upper bounds of the estimated sensitivity and specificity range are reported. 95% confidence bands are also shown. Positive & negative predictive values, accuracy & proportion of positive values for rare diagnoses with 5% uncertainty.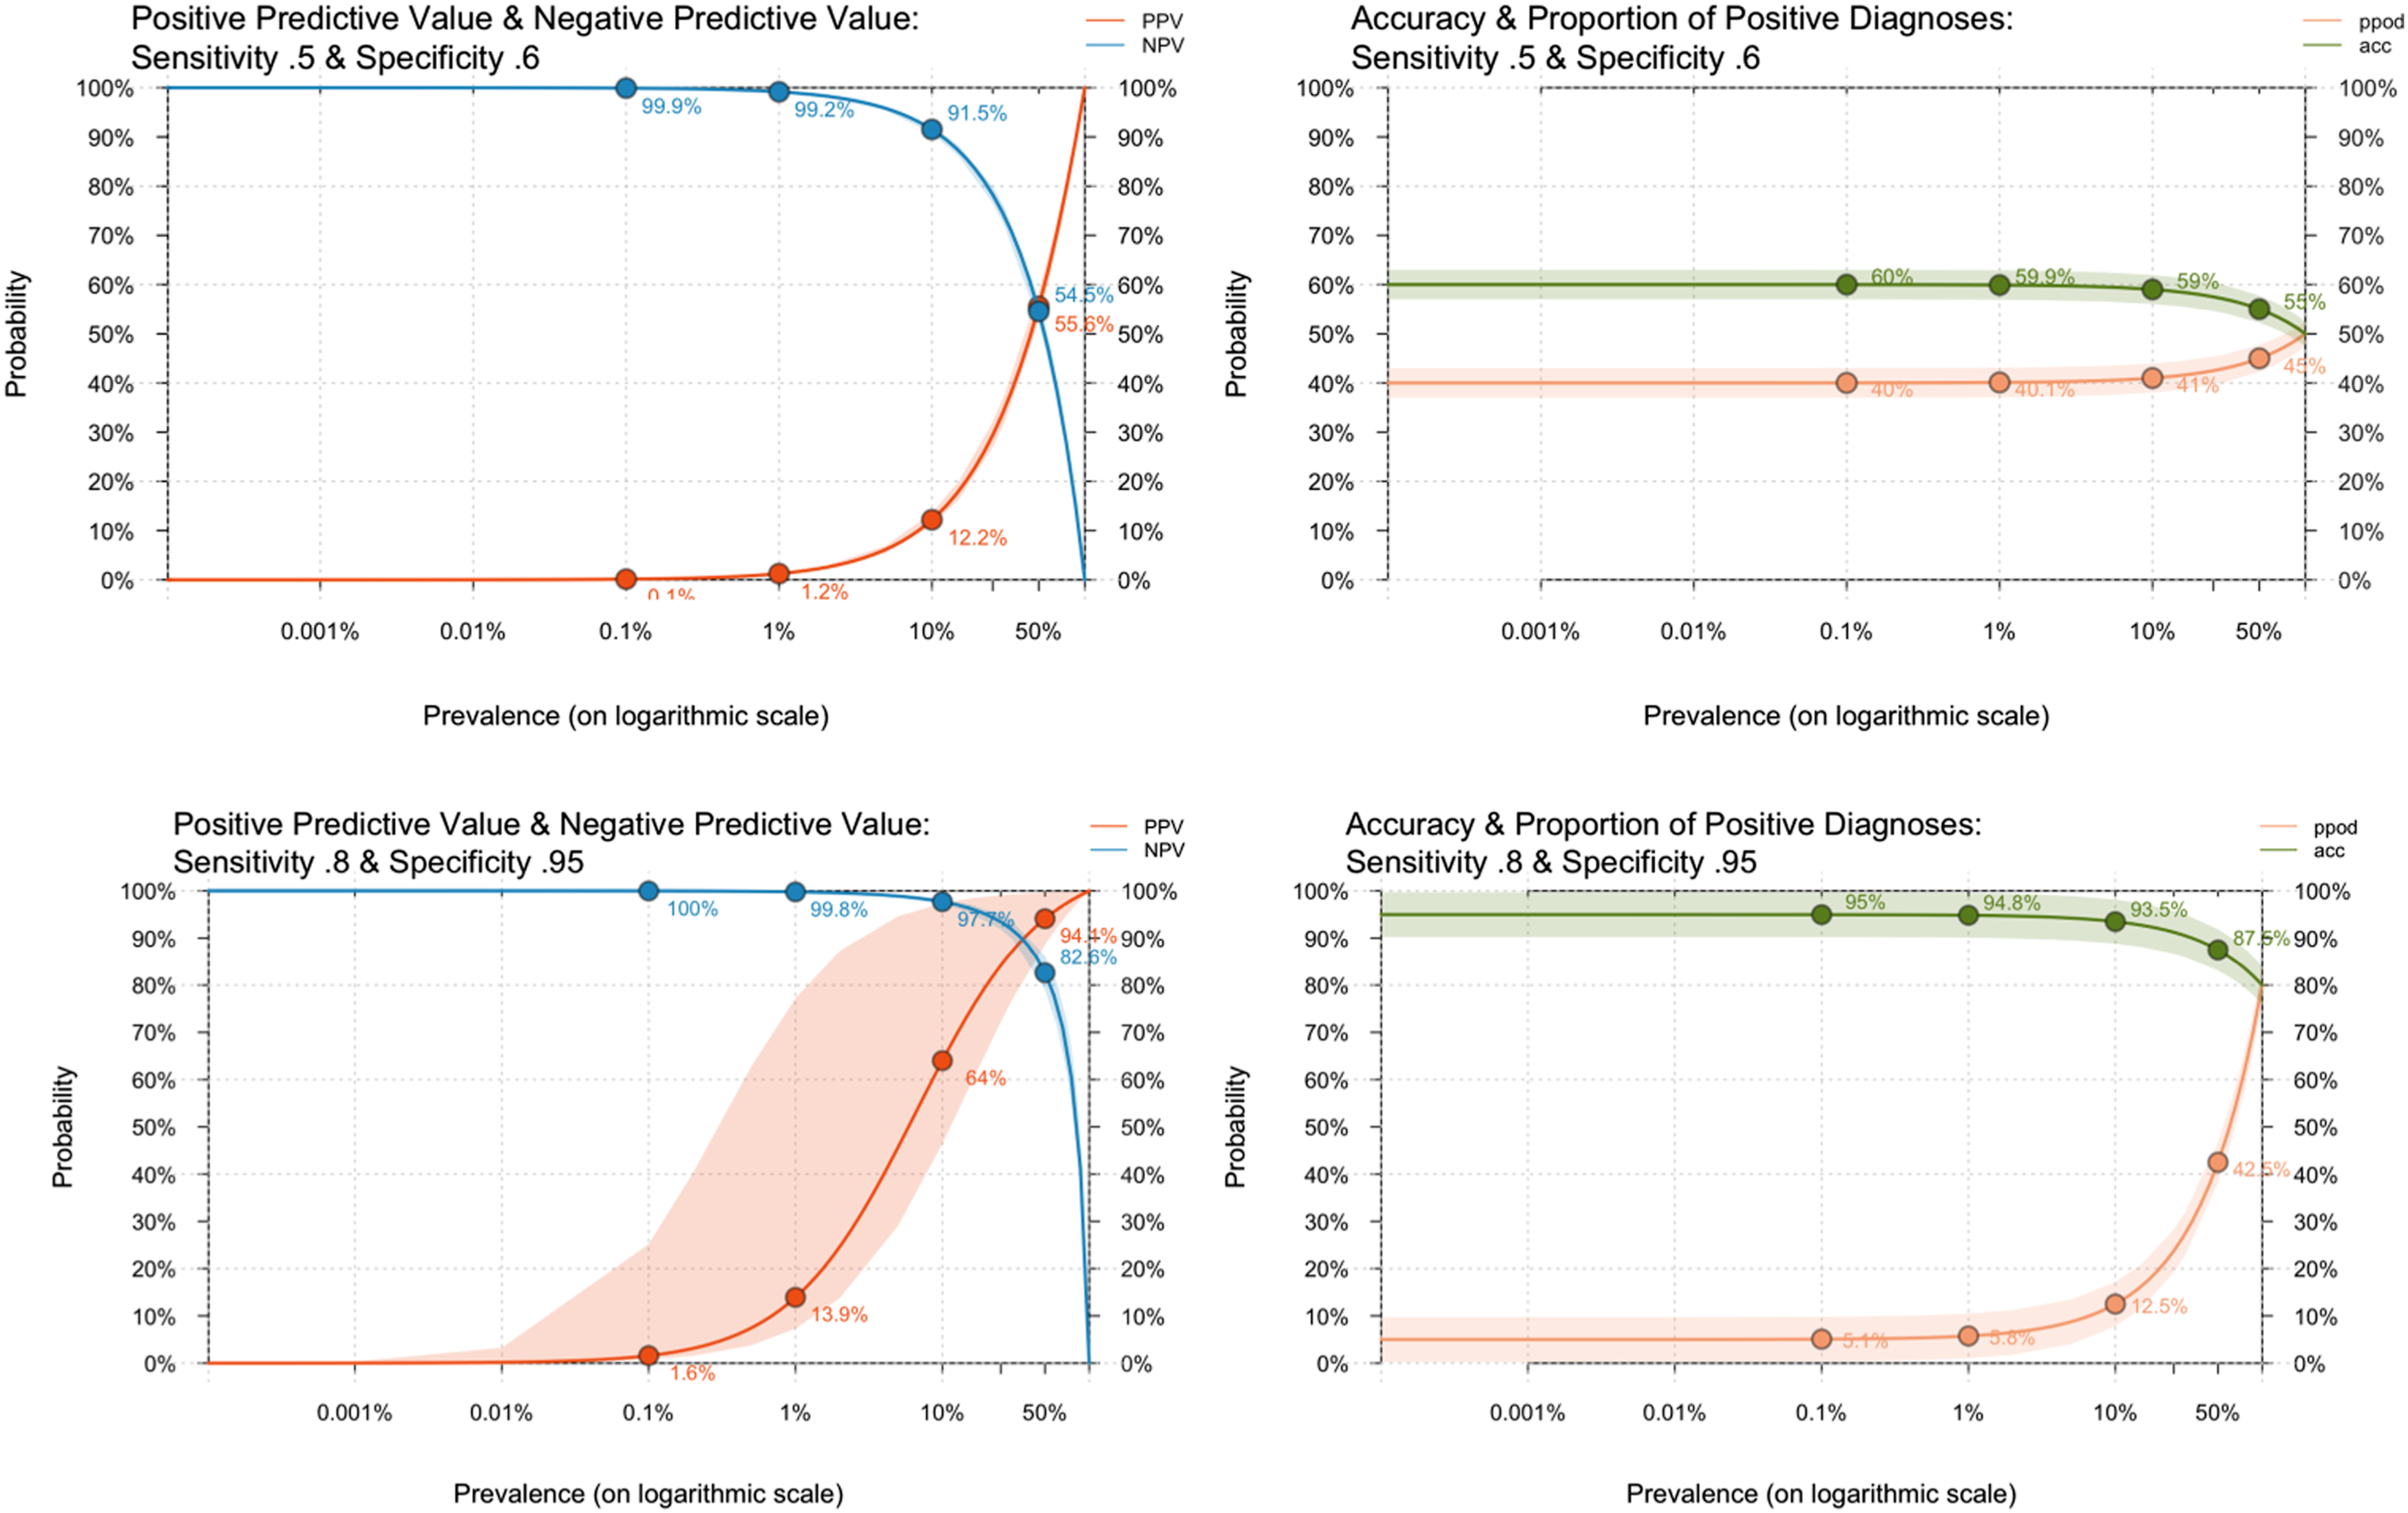
The lower bounds of sensitivity (0.5) and specificity (0.6) performed, unsurprisingly, very badly, with enormous positive bias apparent from the very low PPV percentages, even in the presence of apparently high NPV. A hundred-fold increase in true prevalence between .1% and 10% was associated with only a 1% increase in the number of true positive cases, and because so many cases are false positives (more than four times at 10%), a decrease in overall accuracy.
At the upper bounds (sensitivity of 0.8 and specificity of .95), things had improved, but the impact of prevalence could still be seen, most obviously in the much wider uncertainty around PPV between .01% and 50%. While positive bias was still high at very low levels, it dropped from a 50-fold positive bias at 0.1% prevalence to around 5-fold at 1% and a quarter at 10% prevalence, with decreasing uncertainty. Accuracy remained high, though the increasing proportion of positive but uncertain cases reduced it as the proportion of positive cases increased.
Figure 2 below shows the same metrics but across the full prevalence range. The very high positive biases for rare disorders are no longer visible due to the change of scale from logarithmic to linear. The NPV of a test must be greater or equal to Positive & negative predictive values, accuracy & proportion of positive values for all diagnostic prevalences with 5% uncertainty.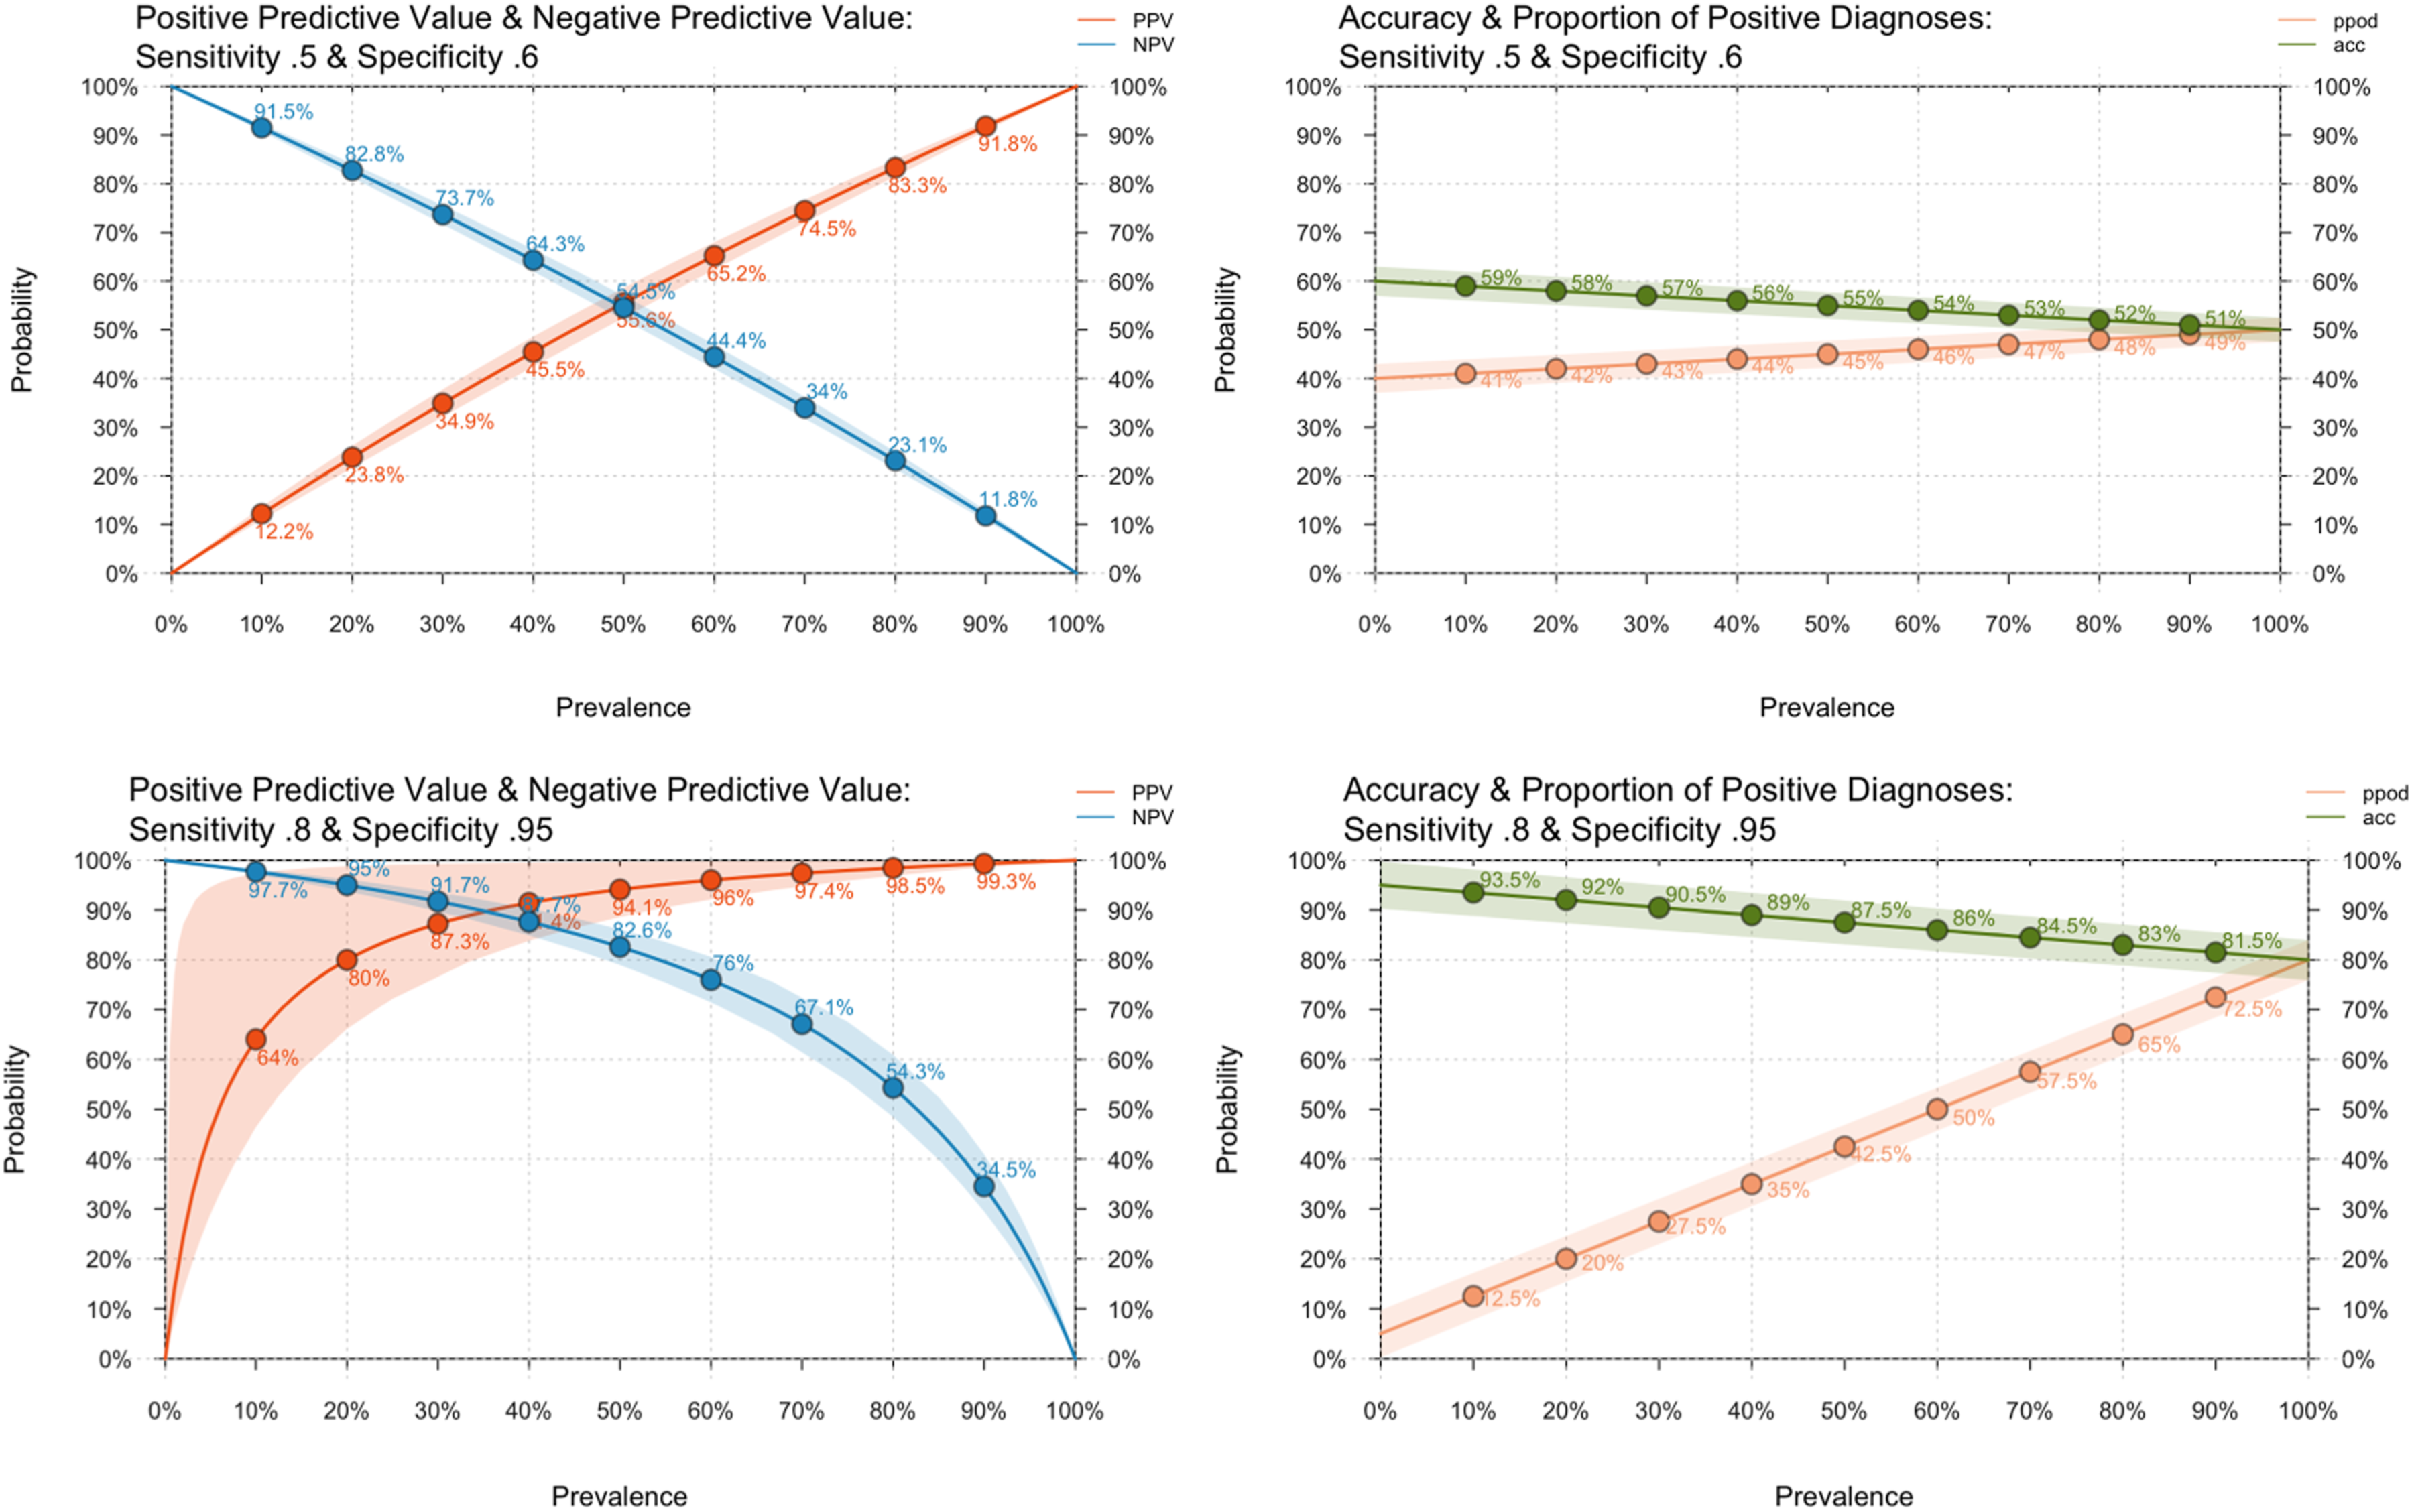
For high sensitivity and specificity, the figures show variable but small degrees of bias across the full prevalence range, with excellent overall accuracy. Positive predictive detection rose rapidly with increasing prevalence, reaching 64% at 10% and 80% at 20%. With 5% uncertainty allowed, an upper bound PPV of nearly 100% was achieved above 5% prevalence.
Figure 3 below explores the effect of physicians’ expectations. Association between Condition Prevalence, Physician Sensitivity and Specificity (upper row) Positive & Negative Predictive Values, Accuracy & Proportion of Positive Diagnoses under Maximally Reduced Diagnostic Expectancy with 5% Uncertainty (lower row).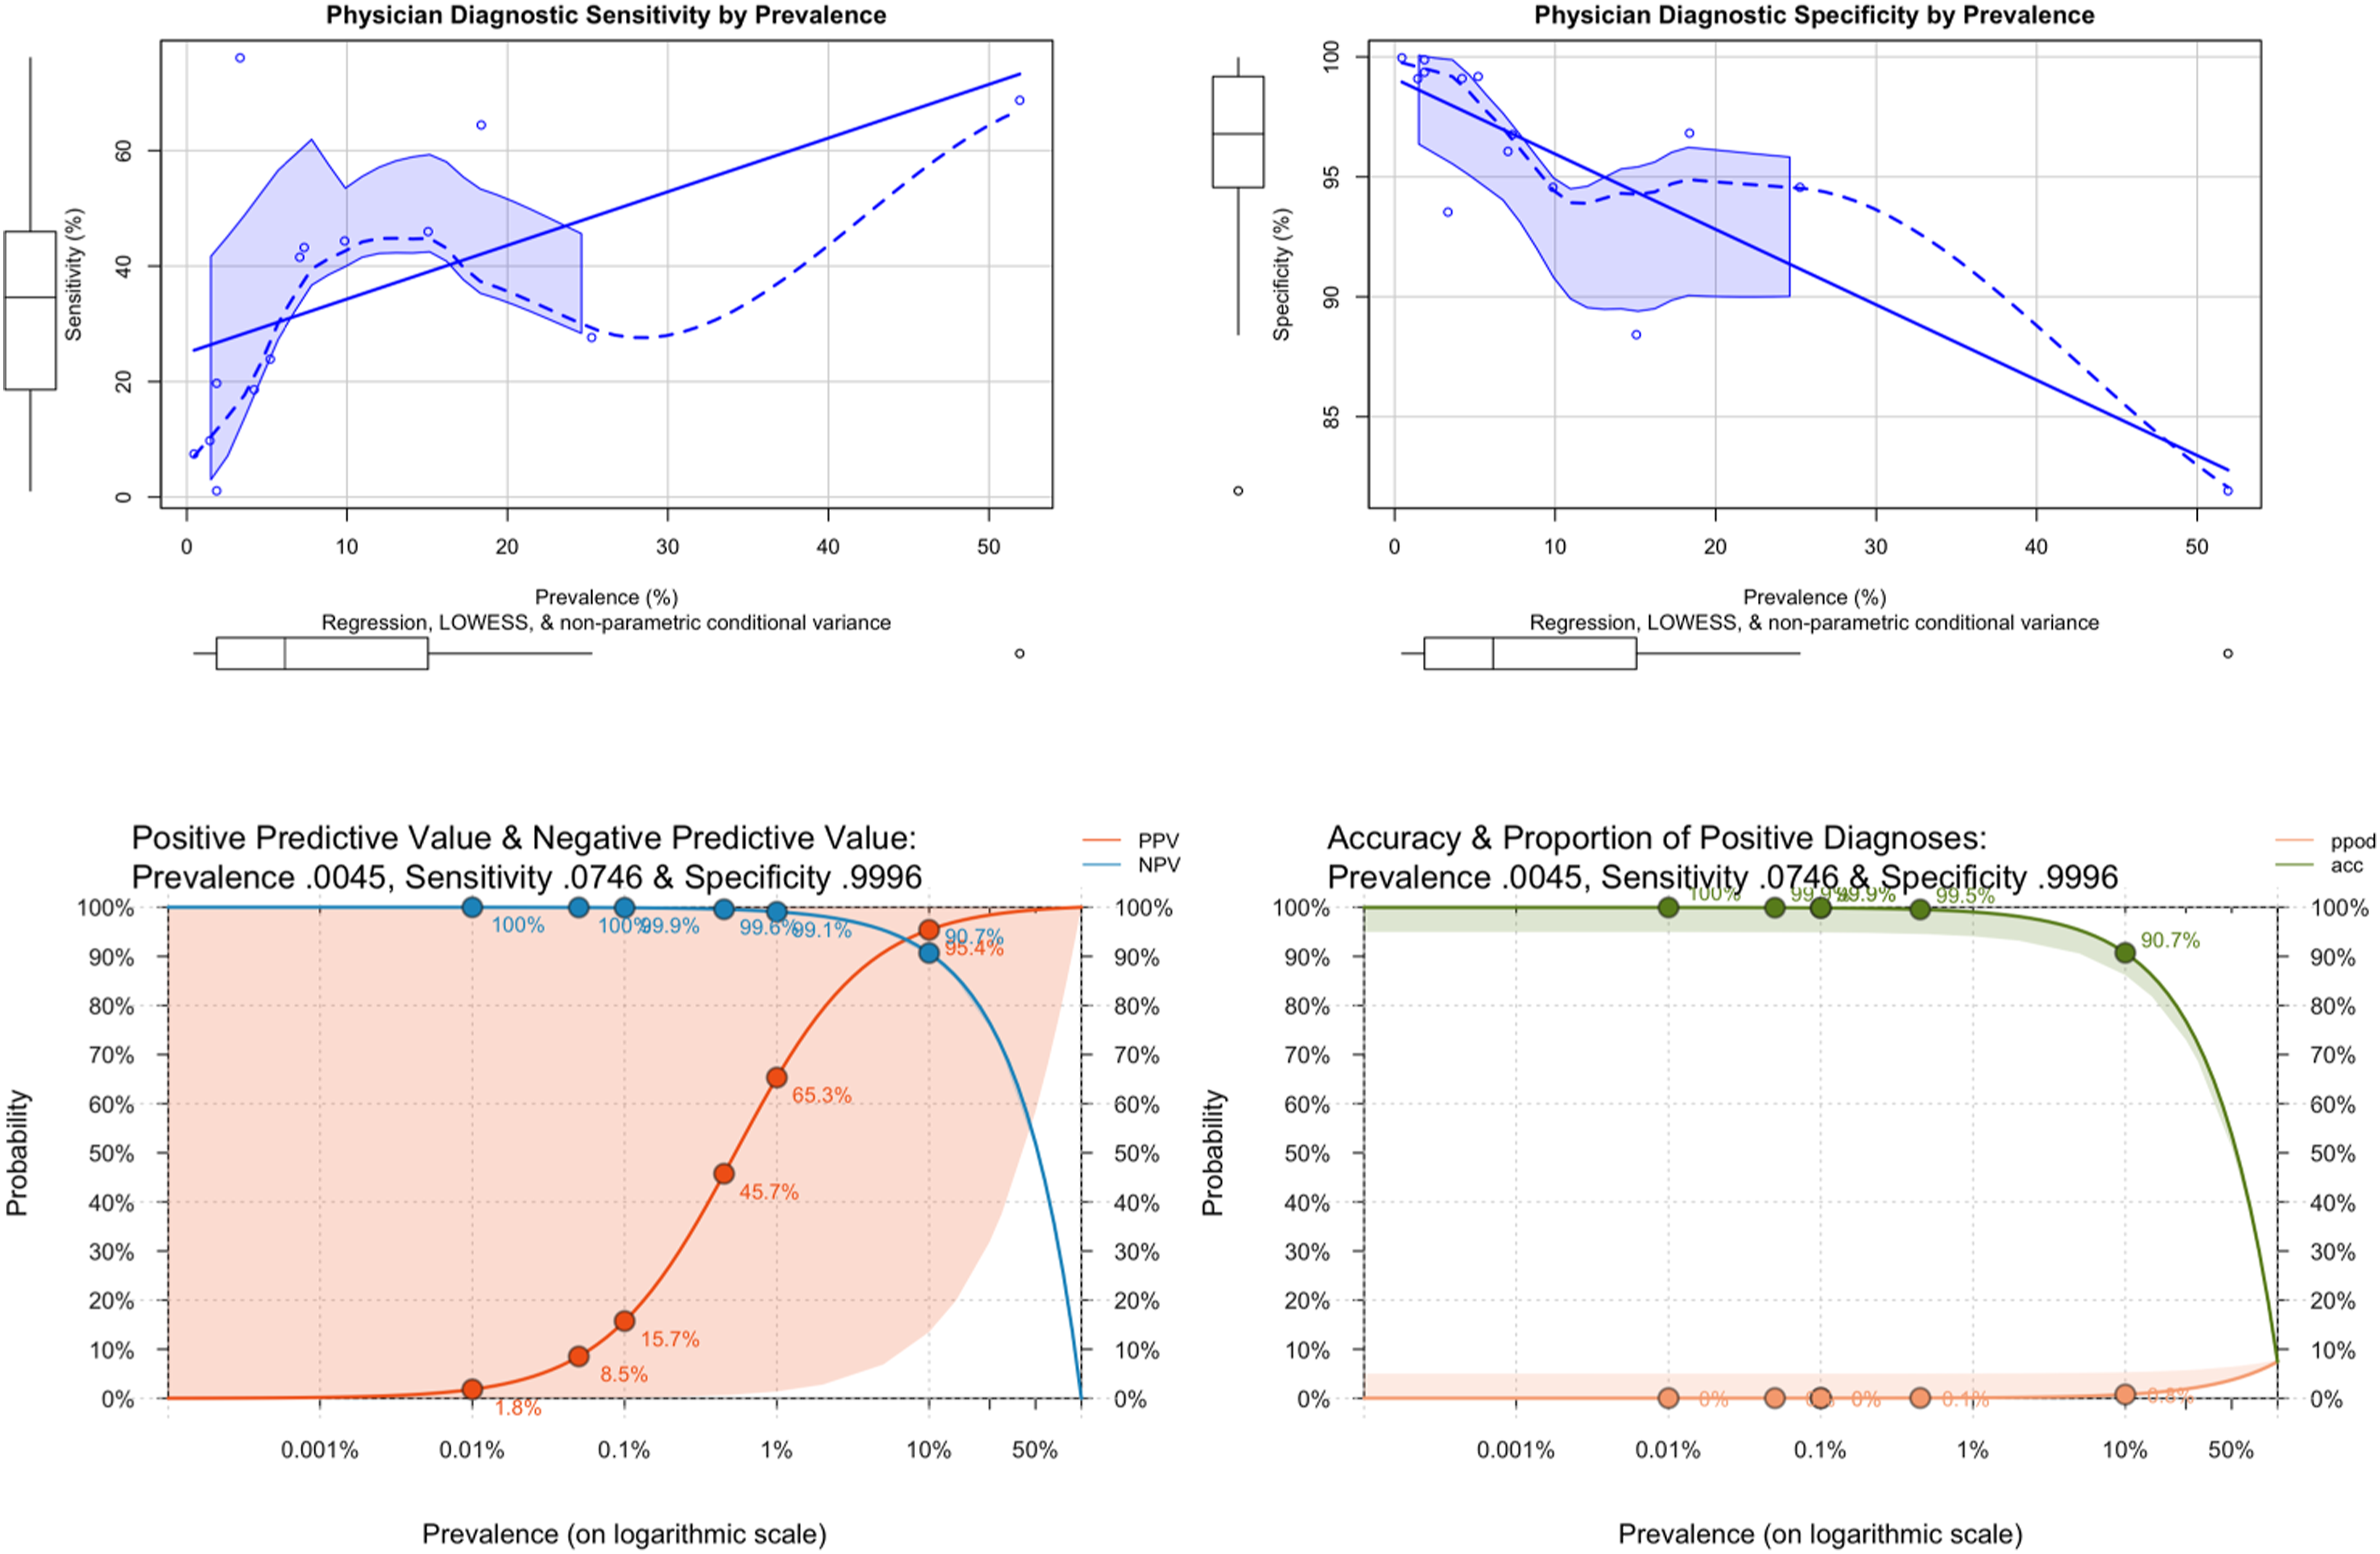
The upper two charts report the association between prevalence, sensitivity and specificity from the diagnoses reported in 22. Overall, the shapes of the curves are complex, and the data is sparse and noisy. However, the increase in specificity and reduction in sensitivity are both steep and approximately linear below 10% prevalence, which is when case overidentification starts to increase. The lower two charts report PPV, NPV, accuracy and proportion of positive diagnoses for sensitivity and specificity at the floor prevalence from 22 ; i.e., the prevalence of the rarest disorder reported, and therefore displaying the highest measured impact of the hypothesised expectancy effect. As can be seen, accuracy was maintained, and bias minimised at a prevalence as low as 0.07%. However, the price paid was huge uncertainty about any diagnosis made: the 95% confidence intervals cover the entire probability range.
Discussion
Recall that, in this context, the prevalence refers to the diagnosis rate in a service’s referral population. With the presumption that the sensitivity and specificity differences between CEs and GS are small, it becomes possible to use such graphs to decide an appropriate prevalence threshold for a CE hub-and-spoke approach. The most clinically relevant MCID will be derived from the PPV, which determines the correct treatment for the diagnosis. For example, consider an absolute MCID of
For rare disorders, the picture is different. Even at the highest reasonable expectations for sensitivity and specificity, positive bias balloons below 20% prevalence. At 10%, it has increased to around 25%, and nearly 500% by 1% prevalence. In practice, the expectancy effect mitigates the risk of many false positives at low prevalence, effectively operating as a low-frequency filter for disorders too rare to detect accurately. Removal of this filter may account for disasters such as the excess diagnosis of anal abuse of young children in Cleveland 29 when anal examination was used proactively to detect a rare event without knowledge of its prevalence or the sensitivity and specificity of the test. Applying a similar MCID of 20% to bias (i.e., an upper limit to overdiagnosis of 20%) suggests a minimum referral prevalence of around 15% for community management, should that MCID be an acceptable margin of error.
Three arguments support the admittedly unproven assumption that diagnosis can substitute for outcome when comparing CEs and GS: evidence-based practice, training practices and supportive empirical evidence. First, using the best treatment for a condition is equivalent to ensuring the best chance of success, conditionally independent of the correct diagnosis: knowing the diagnosis sets the best treatment, determining the outcome. Second, as discussed in the introduction, best practice is taught by CEs, at both undergraduate and postgraduate levels. Clinicians typically work in both settings during their careers, and both CEs & GS organise a range of meetings where best practice is demonstrated and updated, attended by staff from both. It is hard to argue that clinicians in CEs will be better practitioners than those in GS without claiming a failure in medical education. Third, the introductory review found largely supportive findings. Hip fracture in over 65 s is common in the referral population to orthopaedic clinics, and only minimal differences in outcome were found between CEs and GS. 12 Similarly, the triple P program described in 20 is for common problems and can be applied transdiagnostically so that the diagnostic population would have collectively had a high prevalence. Under these conditions, no waning effects were detected between CEs and GS. The only divergence involved the postulated expectancy effect, which is, nonetheless, a predictable necessity arising from the high risk of false positives at low prevalence.
It is clear from the charts above that diagnostic prediction at the lower reasonable bounds of sensitivity and specificity is insufficient for good practice. However, as Figure 3 shows, these lower bounds, which summarise many studies, should be interpreted in the light of any prevalence associated with them, which is unknown. It seems unlikely that such low levels of sensitivity and specificity co-occur in clinic practice, as both CEs and GS perform much better than the lower bounds suggest, and they instead reflect the unmeasured consequence of the expectancy effect at different prevalence levels.
Routine estimation of these parameters would also enable bias quantification between referral strata (e.g., 8) assisting local detection and action, e.g., by appropriate referral templates. 30
Finally, this paper considered CEs and GS from the perspective of the direct delivery of patient care. CEs also add value through teaching and research. Furthermore, this analysis of value for money was considered from the perspective of the service provider. When considered from the perspective of the local communities they serve, hospitals are major contributors to their local economies, 31 and these benefits are not captured in comparisons between types of service delivery. When deciding whether the higher costs of a CE are worthwhile, the value of such indirect contributions should also be included. However, patients should know that a well-delivered GS can provide care every bit as good as that from the equivalent CE provided the prevalence of cases in the former’s referral population is sufficiently high, and differences between CEs and GS that are not accounted for by differences in prevalence should not be tolerated. Excellence is not the sole prerogative of specialist teaching and research centres.
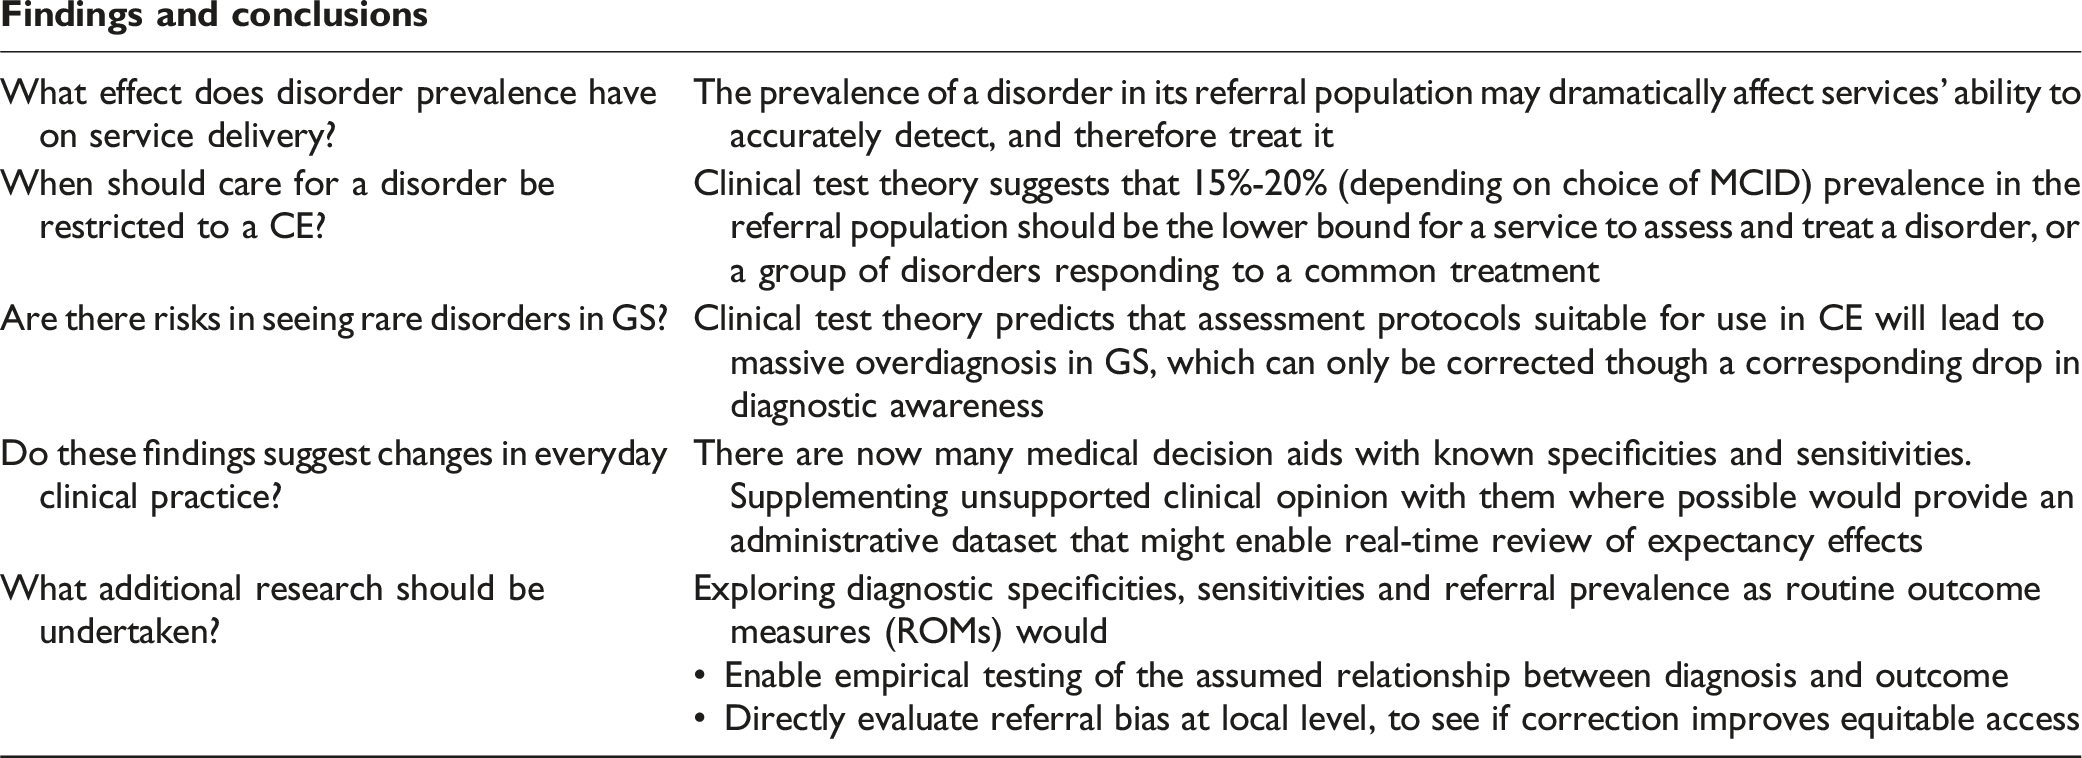
Findings and conclusions
Footnotes
Declaration of conflicting interests
The author(s) declared no potential conflicts of interest with respect to the research, authorship, and/or publication of this article.
Funding
The author(s) received no financial support for the research, authorship, and/or publication of this article.