
Abstract
Some emergency admissions can be avoided if acute exacerbations of health problems are managed by emergency and urgent care services without resorting to admission to a hospital bed. In England, these services include hospitals, emergency ambulance, and a range of primary and community services. The aim was to identify whether characteristics of hospitals affect potentially avoidable emergency admission rates. An age-sex adjusted rate of admission for 14 conditions rich in avoidable emergency admissions was calculated for 129 hospitals in England for 2008–2011. Twenty-two per cent (3,273,395/14,998,773) of emergency admissions were classed as potentially avoidable, with threefold variation between hospitals. Explanatory factors of this variation included those which hospital managers could not control (demand for hospital emergency departments) and those which they could control (supply in terms of numbers of acute beds in the hospital, and management of non-emergency and emergency patients within the hospital). Avoidable admission rates were higher for hospitals with higher emergency department attendance rates, higher numbers of acute beds per 1000 catchment population and higher conversion rates from emergency department attendance to admission. Hospital managers may be able to reduce avoidable emergency admissions by reducing supply of acute beds and conversion rates from emergency department attendance.
Introduction
The recent increase in the numbers of emergency admissions 1 raises concern about whether all such admissions are necessary. Unnecessary admissions place pressures on hospitals and inconvenience patients and their families. Identifying unnecessary admissions is challenging and different definitions exist. One definition is based on preventability, identifying ambulatory and primary care-sensitive conditions where emergency admissions can be prevented through intervention in primary care.2,3 For example, primary care specialist diabetes nurses monitor and educate diabetes patients to prevent exacerbations which might lead to emergency admissions. An alternative definition is based on avoidability. This is where a person has an acute health problem, or an exacerbation of an existing health problem, which can be dealt with by services in the emergency and urgent care system without resort to emergency admission. For example, a hypoglycaemic episode is dealt with at a patient’s home by the ambulance service so that an emergency admission is not required. The responsibility for avoiding emergency admissions can lie beyond primary care, with the range of services in the wider system of emergency and urgent care that respond to patients suffering an acute health problem.4,5 In England currently, these services include emergency ambulances, emergency departments, general practice out of hours services, same day appointments in general practice, walk-in centres and community services such as district nursing. Hospitals are part of this emergency and urgent care system and how they are managed may affect rates of avoidable emergency admissions.
Only some admissions can potentially be avoided through intervention from services in an emergency and urgent care system. Fourteen clinical conditions have been identified as rich in avoidable emergency admissions through consensus methods with 48 clinicians and researchers with a special interest in emergency and urgent care. 6 These conditions include non-specific chest pain, non-specific abdominal pain, chronic obstructive pulmonary disease, minor head injuries, falls and urinary tract infections. There is considerable overlap between our 14 conditions and ambulatory and primary care-sensitive conditions – diabetes complications, chronic obstructive pulmonary disease, angina, cellulitis and epileptic fits 3 – while our 14 conditions also include injuries such as minor head injuries and falls as well as illnesses. In a related study, we used admissions from these 14 conditions to calculate an age-sex adjusted avoidable admission rate for 150 emergency and urgent care systems in England defined by geographically based populations served by health care commissioning bodies called ‘primary care trusts’. 7 We found more than 3-fold variation in age-sex standardised avoidable admission rates for these 150 emergency and urgent care systems. We used routinely available data on population, geography and quality of care of different services to test which characteristics of emergency and urgent care systems affected age-sex adjusted avoidable admission rates. We found that population and geographical factors explained 75% of variation in age-sex adjusted avoidable admission rates between systems, with areas of high unemployment and major urban status having higher avoidable admission rates. High unemployment was correlated with prevalence of some of the 14 conditions. A study of preventable admissions in the United States found that a similarly large amount of variation was explained by the prevalence of disease and low income. 3 We also found that characteristics of hospitals (including their emergency departments), emergency ambulance services and general practice explained further variation. Areas with high attendance rates at emergency departments, high conversion rates of attendances to admissions, high percentages of emergency admissions staying less than a day, low percentages of emergency ambulance calls not transported to hospital and high percentages of perceived access to general practice within 48 h had high avoidable admissions rates. 7
Hospitals are often the focus for efforts to address avoidable admissions. However, in our previous study, we found routine data on a limited number of hospital characteristics for the ‘primary care trust’ populations we were studying. We found that most of the hospital characteristics we tested were important for explaining variation in potentially avoidable admission rates: the conversion rate of emergency department attendances to admission, and the proportion of all emergency admissions with length of stay of less than one day but not the waiting time for planned admissions. 7 These characteristics related to how attendances were managed within the emergency department and other referral routes to a hospital bed. We were aware of data available for hospitals which were not routinely available for ‘primary care trusts’, for example, data on the number of acute beds. We were also aware that researchers have tended to explore the factors affecting emergency admission rates overall, or for specific conditions, through studying variation between general practices or health care commissioning organisations8–13 rather than between hospitals. Researchers exploring hospital characteristics have found some of them to be important. The amount of floor space in hospitals but not the numbers of acute beds explained variation in ambulatory care-sensitive conditions in the United States, 3 while bed availability explained variation in overall admission rates after adjusting for socio-economic status and disease burden. 14
Our aim was to calculate age-sex adjusted avoidable admission rates for hospitals in England and to test the effect of a wider range of hospital characteristics on variation in these rates than tested in previous studies. We aimed to distinguish between factors which are and are not in the control of hospital managers to allow hospital managers to consider any actions they can take to reduce avoidable admissions.
Methods
Calculation of the age-sex adjusted avoidable admission rate
The age-sex adjusted avoidable admission rate is based on 14 health conditions which are rich in avoidable emergency admissions. 6 Twenty-nine per cent of these admissions occurred in over 75 year olds. 7 Numbers of admissions to each hospital for the set of 14 conditions were calculated using Hospital Episode Statistics for the three financial years April 2008 to March 2011.
Catchment populations for hospitals were needed to calculate admission rates for these 14 conditions. There are different ways of calculating catchment populations for hospitals, with debates about which approach is best.15,16 We used estimates of hospital catchment populations for emergency admissions in 2009 calculated by Public Health Observatories in England. 17 These catchment areas were defined as the number of people in each sex and age group who live in the catchment of the hospital. They were calculated using Hospital Episode Statistics data between April 2006 and March 2009 to count the number of emergency admissions in each age and sex group from small areas called Middle Super Output Areas. These areas have a minimum population of 5000, with an overall mean of 7200. The Office for National Statistics supplied the 2009 mid-year population estimates. Within each five-year age and sex group, the proportion of emergency admissions that went to each hospital as a proportion of those who used any hospital was calculated. For each small area, this proportion was multiplied by the resident population in that age-sex group to give the small area catchment population for each hospital. Then, the small area catchment populations for each hospital were summed to give the total catchment population for each hospital.
We calculated the directly age-sex standardised admission rates per 100,000 per year for each hospital for the three-year period April 2008 to March 2011 using seven age groups (0–4, 5–14, 15–44, 45–64, 65–74, 75–84, 85+) standardised to the whole population for England in 2009. A three-year period was selected to ensure that the effect of annual variability in emergency admission rates was minimised. We call this the ‘potentially avoidable admission rate’ in recognition that some of these admissions would need a hospital bed even with the best of management by all services in the emergency and urgent care system.
Inclusion criteria for hospitals
In England, hospitals are known as Trusts and can include a number of buildings based at separate sites, with some of these buildings known as hospitals by their local communities. The Trust manages all the hospitals within it, operating as a single organisation, and this is the unit of analysis in this paper. We use the term ‘hospital’ rather than ‘Trust’ throughout the paper to facilitate international relevance. Some specialist hospitals offer care to specific age, sex or condition groups only. We wanted to compare similar types of hospitals and focused on general hospitals which admit all types of patients. Therefore, we included any hospitals where the estimated population in each age-sex group was >1000. This was an arbitrary cut-off point which successfully excluded children’s hospitals, women’s hospitals and condition-specific hospitals. It also excluded some general hospitals located near children’s hospitals because they did not admit children.
Characteristics of hospitals
Description of factors and explanatory power in univariate linear regression.

Foundation Trusts were created to devolve decision making from central government and make hospitals more responsive to local needs; this status gives hospitals managerial and financial freedom.
Analysis
We undertook linear regression in IBM SPSS Statistics version 21 weighted for hospital catchment population to account for larger uncertainty of estimates for smaller populations. The dependent variable was the age-sex adjusted emergency admission rate for conditions rich in avoidable admissions per 100,000 population per year between 2008 and 2011. The independent variables were tested in a hierarchical multiple regression in two blocks, using forward stepwise regression within each block. Variables were included if the p-value for the t-test was <0.05. These blocks were determined by the extent to which the factors tested were modifiable by hospital managers. In Block 1, we tested factors not modifiable by hospital managers: percentage of household poverty in the area in which the hospital was located, and demand for the emergency department in terms of attendance rate. We then used the residuals from Block 1 as the dependent variable in Block 2 and tested the additional effect of hospital characteristics within the control of hospital managers.
Results
Variation in age-sex adjusted avoidable admission rate by hospital
There were a total of 15 million emergency admissions in the three-year period 2008–2011, 22% (3,273,395/14,998,773) of which met our definition of potentially avoidable as determined by our 14 clinical conditions.
7
There were 131 hospitals in our analysis after excluding specialist hospitals. Two hospitals had missing data for admissions in 2010/2011 and were removed from the analysis at this stage because of concerns about data quality, leaving 129 hospitals. The median age-sex adjusted avoidable admission rate was 1939 (interquartile range 1676, 2331) per 100,000 population, with threefold variation between hospitals ranging from 1194 to 3601, and a 1.8-fold variation between the 10 and 90 percentiles (Figure 1).
Age-sex adjusted avoidable admission rates by hospital.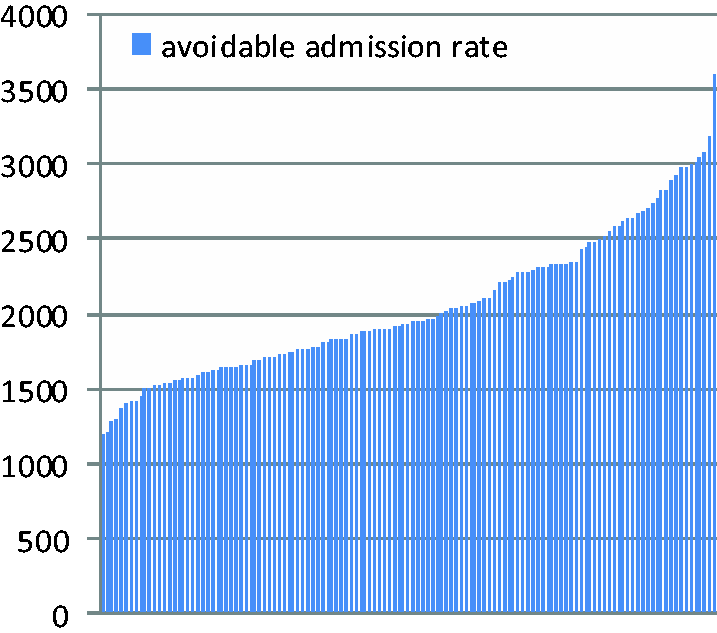
Factors affecting potentially avoidable admission rates
We found routine data on 11 hospital characteristics related to the location, demand, supply, quality, accessibility and management of processes at the hospital (Table 1). In the univariate linear regression, the factors that explained the largest amounts of variation in the age-sex adjusted avoidable admission rate were those not modifiable by hospital managers: demand for the emergency department (R2 = 27%) and poverty levels of the households living near the hospital (R2 = 13%). Hospital managers could modify other factors explaining large amounts of variation, for example, numbers of acute beds per 1000 population (R2 = 16%) and percentage of admissions staying for less than one day (9%).
Final multiple regression.
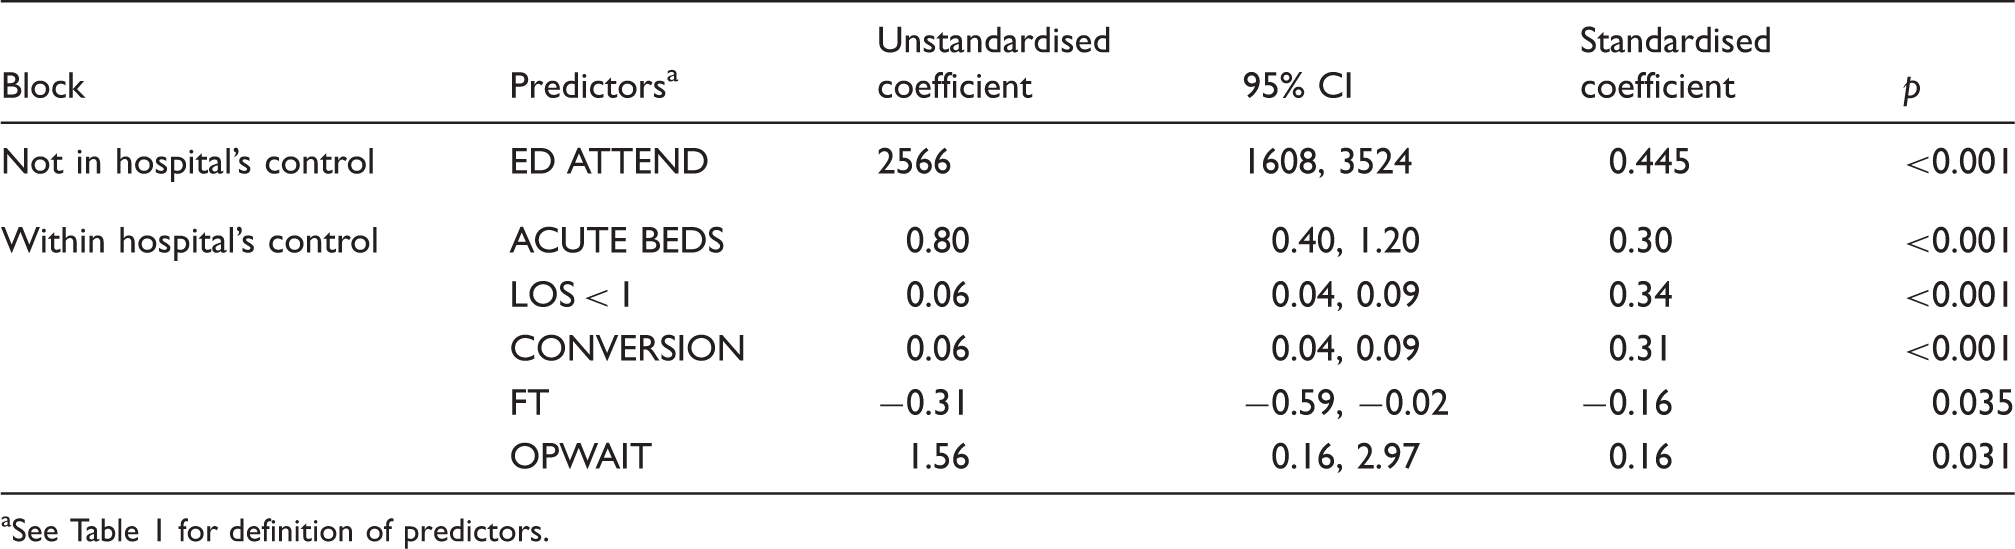
See Table 1 for definition of predictors.
Discussion
Summary of findings
There was 3-fold variation in the age-sex standardised avoidable admission rates for different hospitals, 53% of which we could explain using routinely available data on hospital characteristics. High avoidable admission rates occurred in hospitals with high demand for emergency departments, which was correlated with population deprivation, and which was not under the control of hospital managers. After adjusting for this, there was evidence that supply-induced demand, how hospitals managed short stay patients, how emergency departments managed attendances, the management approach of hospitals and access to outpatient care affected avoidable admission rates. The direction of effect of access to outpatients was counterintuitive: the shorter the wait for outpatient care, the higher the potentially avoidable admission rate.
Strengths and weaknesses
The strengths of the study were that few researchers have considered the effect of a wide range of hospital characteristics on emergency admissions, and few researchers have focused on those which are potentially avoidable. There were four potential limitations. First, the analysis relied on the calculation of hospital catchment areas for emergency admissions. There is debate about the best way to calculate catchment areas. The type of proportional flow model used here has been shown to work well 16 but can give smaller catchment areas than more sophisticated approaches. 15 This should not have been a problem because any underestimate would affect all the estimated catchment populations. Second, even though we found 11 variables to test, there could be other hospital characteristics affecting emergency admissions that we were unable to include, such as staffing levels and financial situation. Third, deprivation is associated with emergency admission rates3,7,8,10,18–21 and our deprivation variable may not have captured the full effect of deprivation within the hospital catchment population. Finally, regressions can overestimate correlation between variables if the dependent and independent variables share the same denominator. 22 We took the natural log of variables and undertook a linear regression on the logged values to eliminate this problem. This made no difference to the findings.
Comparison with other studies
We found that hospital characteristics are important in determining avoidable emergency admission rates. This is supported by other research. For example, when researching variation in emergency admissions between general practices, the hospital that patients were admitted to explained 10% of variation in emergency admission rates. 19 We found considerable variation in potentially avoidable admission rates between hospitals in England which is within the control of hospital managers. This level of variation has also been found for admissions for ambulatory care-sensitive conditions in the United States. 3
The factors which explained variation in avoidable admission rates between hospitals in our study were similar to factors we found in our related study of variation between primary care trusts. 7 In that study, we also found that emergency department attendance rates, short length of stay and the conversion rate from emergency department attendance to admission explained variation. One difference was that deprivation levels explained a large amount of variation between primary care trusts but a much lower amount of variation between hospitals. As stated earlier, this may have been due to the limitations of the deprivation variable we used. Other differences were related to the availability of data for different entities. For hospitals, we were able to test the new factor of the number of acute beds per 1000 population and this explained some variation: the higher the number of beds, the higher the admission rate. The supply of acute beds has been shown to be related to admissions overall 14 and for terminally ill people, 23 although numbers of beds were considerably higher than in our study, varying between 2.1 and 4.3 to per 1000 population 23 compared with our variation of 1 to 2.9 beds per 1000 population. This relationship between supply and demand has not been found consistently. A study of admissions for ambulatory care-sensitive conditions in the United States found that bed supply did not explain variation. 3 Our finding may be explained as supply-induced demand but may also be demand-induced supply in that beds are kept open because they are needed. It may be more likely to be supply-induced demand in our study because the conditions which these admissions had were considered not to be in need of a hospital admission by experts. It is also the case that supply-induced demand may affect evaluations of interventions to reduce emergency admissions. 24
The percentage of all emergency admissions staying less than a day explained variation in both our univariate and multiple regressions. In the UK, these short stay admissions have been shown to be responsible for some of the increase in emergency admission rates. 1 Others have found that ill-defined hospital admissions of older people were more likely to be short length of stay. 25 It is unclear what this factor represents in terms of hospital management. It may be that different hospitals code some types of hospital attendances differently – an issue within the control of hospital management – or it may be that some hospitals find it more difficult to discharge emergency admission attendances because they are unable to ensure the engagement of appropriate community services – an issue which they share control of with those providing community services.
It is interesting that the conversion rate from emergency department attendance to admission did not explain variation in the univariate regression but did so in the multiple regression. This is likely to be due to the negative correlation between demand for emergency departments and the conversion rate, both of which were included in the multiple regression. The counterintuitive relationship between quick access to outpatient appointments and high avoidable admission rates is hard to explain. This factor was not consistently statistically significant throughout the forward stepwise regression and may be best ignored unless other researchers find a similar relationship. Hospitals with Foundation Trust status had higher rates of emergency admissions, again a counterintuitive finding which is hard to explain. This was not statistically significant in the univariate linear regression, and its inclusion in the multiple regression was dependent on the inclusion of demand for emergency departments.
Implications for policy makers and service providers
Hospital characteristics are associated with potentially avoidable admission rates and some of these are within the control of hospital managers. A key finding is that the more acute beds per 1000 catchment population, the higher the rate of avoidable admissions. One could argue from this that a key way of reducing avoidable admissions is to reduce bed supply. This would only be a sensible approach to take if support services were available for patients within the community that allowed for easy and safe discharge from the emergency department. Conversion rates from emergency department attendance to admission vary by hospital and account for variation in avoidable admissions rates once demand for emergency departments has been adjusted for. Service providers could consider ways of reducing conversion rates by ensuring that support services are available to allow for discharge or by evaluating clinical decision making within their emergency departments to ensure it is optimal.
Conclusions
Avoidable admission rates were higher for hospitals with higher emergency department attendance rates, higher numbers of acute beds per 1000 catchment population and higher conversion rates from emergency department attendance to admission. Hospital managers may be able to reduce avoidable emergency admissions by reducing supply of acute beds and by reducing conversion rates from emergency department attendance.
Footnotes
Declaration of conflicting interests
The authors declare that there is no conflict of interest.
Funding
This project was funded by the National Institute for Health Research Health Services and Delivery Research Programme (project number 10/1010/08). The views and opinions expressed therein are those of the authors and do not necessarily reflect those of the HS&DR Programme, NIHR, NHS or the Department of Health.
Contributorship
AOC, JN, SG and JT designed the study. RM and TP calculated the avoidable emergency admissions rates. EK identified variables for testing. All authors contributed to analysis and interpretation. AOC wrote the first draft of the article and all authors contributed to the final article. AOC acts as guarantor.