
Abstract
This study examines the attention-seeking strategies of sexual assault organizations on Twitter in Canada, exploring the factors influencing the level of attention received. Drawing on the foundation work of Guo and Saxon’s four-factor explanatory model, the research extends and refines the model by incorporating new factors, including Covid-related content, network size, intended audience, direct services, donations, and visual content. The study’s methodology involved sampling 124 sexual assault and rape crisis centers in Canada, collecting Twitter data (n = 320,836 Tweets up to April 2023), and employing ordinary least squares and fixed effect regression analysis. Results showed significant relationships between these factors and attention received, providing insights for both theoretical understanding and practical guidance.
Introduction
Social media platforms play a vital role in facilitating web-based social initiatives, organizing communities, and forming social movements (S. J. Jackson et al., 2020; McNutt, 2018; Storer et al., 2021). In recent years, high-profile cases of sexual assault and misconduct involving prominent figures and celebrities have garnered significant media attention. These cases have sparked widespread discussion about sexual abuse and harassment, leading to the emergence of social media campaigns, such as MeToo, which have had an international impact, including in Canada (Rotenberg & Cotter, 2018).
Social media platforms offer a crucial avenue for organizations advocating against sexual assault to shape public opinion, influence policy decisions, and address the challenges faced by women in online spaces where the risk of sexual harassment and violence is prevalent (Buni & Chemaly, 2014; Locke et al., 2018; Pinto, 2017; Stabile et al., 2021; United Nations, 2018). These platforms also serve as spaces for organizing activism and educating the public about sexual violence, prevention strategies, and support services, with the aim of driving social and policy change.
Advocacy plays a pivotal role in democracy by striving to improve the lives of constituents while achieving the objectives of organizations. Attracting public attention is essential for enacting the sought-after transformations (Guo & Saxton, 2014). Social media usage serves as a measure of an organization’s effectiveness in garnering attention for its cause. Nonprofit advocacy organizations, including those addressing sexual violence, often turn to social media as an efficient way to connect with their target audiences (Guo & Saxton, 2018; Svensson et al., 2015). However, sexual assault service agencies often face resource limitations, hindering their ability to provide services in the most accessible manner (Finn, 2000). According to the Canadian Association of Sexual Assault Centres and the Sexual Assault Centres, Crisis Lines, and Support Services directory, there are approximately 350 sexual assault centers across 10 provinces and 3 territories in Canada. These organizations, with their long-standing histories and online presence, play vital roles in addressing sexual assault, violence against women, and related social issues in Canada. For example, three of the earliest-established sexual assault centers all have an early Twitter presence. The YWCA Lethbridge, with a 72-year history, emerged from the recognition of a need for housing for female students and working women in 1951. It has since evolved into a comprehensive institution addressing diverse needs in Southern Alberta, including housing, poverty, domestic and sexual violence, health, youth empowerment, and leadership, actively supported by the local community. The Durham Rape Crisis Centre, established in 1974, is a feminist organization unwavering in its commitment to equality, working to end violence against women and children through holistic approaches encompassing healing, counseling, awareness, advocacy, and empowerment. The Sexual Assault Centre of Edmonton (SACE), dating back to 1975, stands as one of the Canada’s pioneering organizations dedicated to assisting sexual assault survivors and raising awareness. With services for individuals of all backgrounds, SACE is committed to prevention through public education and advisory consultation, contributing to a professional perspective on the matter. These organizations, deeply rooted in Canada’s history, continue to play vital roles in addressing sexual assault and violence against women.
In Canada, the COVID-19 pandemic witnessed a significant surge in calls to domestic violence and sexual assault hotlines, compelling health care providers to swiftly transition to virtual service provision as a preventive measure against the virus’s spread. This abrupt shift, occurring without adequate planning time, posed substantial challenges for sexual violence service provider organizations, hindering both their service delivery and clients’ access to essential support. Research illuminates the intricate and diverse obstacles faced by organizations and service providers within this sector during their adaptation to virtual services and interventions (Montesanti et al., 2022; Xue et al., 2020). Furthermore, it underscores the multifaceted barriers encountered by clients in their pursuit of virtual services and online programs. Therefore, a thorough evaluation and enhancement of communication strategies are essential for sexual assault organizations to mitigate these challenges experienced by both clients and service providers.
Enhancing communication strategies not only aids in overcoming these obstacles but also empowers sexual assault organizations to shape public opinion effectively and create a safer online environment for women. As elucidated in the work by Stabile et al. (2021), social media platforms serve as crucial tools for advocacy organizations dedicated to combatting sexual assault to influence public sentiment and drive policy outcomes. However, it is crucial to acknowledge that the online environment can be hostile for women, fraught with numerous threats related to sexual assault and violence, as demonstrated in previous studies (Locke et al., 2018; Pinto, 2017; United Nations, 2018). Social media platforms also serve as vital spaces for coordinating activities and advocacy efforts by diverse groups aiming to raise awareness about sexual assault, disseminate information regarding preventive measures and support services for survivors, and catalyze societal and policy transformations.
Understanding the primary intended audience and services provided by agencies serving victims of violence is crucial. These agencies typically cater to victims, donors, prospective employees, educators, scholars, advocates for change, decision-makers, and potential perpetrators (Sorenson et al., 2014). Considering that social media is used by 90% of young adults aged 18–29 years, with both women and men engaging in similar levels, it stands as a potent medium for organizations focused on sexual violence to reach out to their core audience, who are significantly affected by interpersonal violence, whether as victims, offenders, or bystanders (Perrin, 2015).
Although prior research has examined the use of social media by organizations, there is limited understanding of the effectiveness of their engagement strategies (Guo & Saxton, 2018). Furthermore, there is a dearth of literature on how sexual assault organizations specifically use social media to promote their missions, although emerging evidence suggests an increased adoption of new technologies by these organizations during the COVID-19 pandemic (Voth Schrag et al., 2022). Enhancing communication strategies not only aids in overcoming these obstacles but also empowers sexual assault organizations to shape public opinion effectively and foster a safer online space for women. Building on the works of Guo and Saxton (2018) and Merry (2014), Stabile et al. (2021) examined how effectively sexual assault organizations leverage social media for advocacy purposes. Their study contributes to the literature by investigating the relationship between an organization’s use of Twitter and the attention it receives, bridging theoretical and practical perspectives. They found that the number of tweets has a significant impact on promoting the interests of small nonprofit and sexual assault organizations in combating gender-based violence in societies where this issue continues to be prevalent. This suggests that active engagement and frequent communication on Twitter can help these organizations gain attention. However, it is crucial to acknowledge that the online environment can be hostile for women, fraught with numerous threats related to sexual assault and violence, as demonstrated in previous studies (Buni & Chemaly, 2014; Locke et al., 2018; United Nations, 2018). Social media platforms are vital spaces for coordinating activities and advocacy efforts by diverse groups aiming to raise awareness about gender-based violence, disseminate information regarding preventive measures and support services for survivors, and catalyze societal and policy transformations.
This study aims to investigate the communication strategies employed by sexual assault organizations on Twitter in Canada, expanding on the four-factor theoretical model proposed in the work by Guo and Saxton (2020). Based on this conceptual framework, we present a set of hypotheses that will be examined and tested in the context of this study. The findings of this study provide practical insights for organizations aiming to enhance their social media visibility and engage more effectively with their target audience, and for researchers and practitioners interested in understanding the dynamics between social media usage and advocacy efforts.
Literature Review
Attention
In this study, attention proxies were measured by the number of retweets and the number of favorites. The number of retweets by other users indicates how often an account’s original tweets are shared again by others. Retweeting stands as a fundamental function through which individuals participate in a public discourse on Twitter. Retweets are an example of user-driven conventions becoming official objects (Twitter, 2023a). Retweeting emerged as a way of “forwarding” content to others. A retweet involves re-sharing a post. The retweet function allows both users and others to easily share a post with all their followers. Users have the ability to retweet their own posts or those from someone else (Twitter, 2023b). Favoriting an organization’s tweets is another key way individuals engage in public discussions on Twitter. Likes, symbolized by a small heart, are used to express appreciation for a post. Users can access posts they have liked by visiting their profile page and selecting the Likes tab (Twitter, 2023c).
E. W. J. Lee and colleagues’ (2024) study underscores the importance of retweets and favorites as tools for understanding how public perceptions and concerns evolve during a crisis. It provides critical perspectives on the dynamics of information distribution in the digital era. Retweets are found to be instrumental in early-stage amplification of health impact information, reflecting the initial focus on COVID-19’s health implications, while favorites play a crucial role in amplifying later-stage topics, such as economic impact and government support, indicating the evolving concerns of the public as the pandemic unfolds. Another study (Son et al., 2020) underscores the vital role of retweets on Twitter in the context of disaster communication by revealing their strong connection to the level of uncertainty in tweets. It is observed that as the uncertainty of a disaster tweet increases, its retweet count tends to decrease. This highlights the importance of clear and informative messaging during disasters, as tweets with higher uncertainty are less likely to be effectively communicated and may not provide sufficient information to the audience.
J. Lee and Xu (2018) emphasize the significant role of Twitter as an agenda-setting tool, especially in the context of political campaigns. The study sheds light on the intriguing observation that attack tweets, despite their negative tone, garnered more favorites and retweets compared to positive or neutral messages. Their study underscores the importance of retweets and favorites as tools that facilitate engagement and agenda-setting effects.
Another study (Bhattacharya et al., 2014) underscored the importance of retweets and favorites for public health agencies on Twitter, serving as key indicators of engagement and message reach. It highlights the challenge agencies face in achieving high engagement, with a majority of their tweets receiving a relatively low number of retweets. However, the research reveals a strong positive relationship between follower count and the number of retweets, emphasizing the significance of building a substantial Twitter following. Tweets with a higher favorite count are also more likely to be retweeted, indicating the value of both metrics for evaluating an agency’s Twitter presence. Interestingly, tweet count does not necessarily correlate with more retweets, suggesting the prioritization of quality over quantity in posting tweets. The study further provides insights into enhancement strategies, including the use of hashtags, uniform resource locators (URLs), or user mentions, to increase the perceived usefulness of information and encourage retweets. However, these elements may have varying effects on retweet behavior. In addition, the research explores the role of betweenness-centrality in retweeting activity, indicating its limited impact on retweet rates and lifespans among agencies. In summary, retweets and favorites are essential for public health agencies on Twitter, and various factors, including follower count, tweet quality, and strategic content elements, can shape engagement, while factors such as sentiment have a more nuanced role in determining message reach.
Network Characteristics
In the context of social media platforms, such as Twitter, users rely on their social media network ties to gain audience attention. Hutto et al. (2013) state that building a following on Twitter can provide users with access to social ties, resources, and influence. The number of followers a user has is a crucial factor in determining their influence, leading to greater brand awareness and higher-quality communication (Essaidi et al., 2020; Han et al., 2019). It is a representation of their social media network ties and significantly predicts retweetability as an indicator of audience attention (Petrovic et al., 2011; Suh et al., 2010). Therefore, for sexual assault centers using Twitter, the number of followers is an essential characteristic that can affect their level of audience attention.
Guo and Saxton’s (2018) research indicates a positive correlation between the attention an organization garners and its tweet frequency. Similarly, Stabile et al. (2021) discovered a direct relationship between the follower count of organizations fighting gender-based violence and the level of attention these organizations receive.
Twitter allows users to follow other users as “friends,” facilitating the formation of social media network ties. Petrovic et al.’s (2011) research found that the number of friends a user has is a key indicator of audience attention in terms of retweetability. Stvilia and Gibradze’s (2014) study further supports this finding by demonstrating a positive association between the number of users an account follows and the quantity of favorites that an account receives. In addition, Neppalli et al.’s (2016) research suggests that tweets receiving a high number of retweets are likely to come from users with a high average number of friends.
Twitter users have the ability to create lists of accounts to streamline viewing tweets from these curated groups and have the option to follow a list rather than individual profiles. Research by Howoldt et al. (2023) explored how factors such as research output, the caliber of research, participation in academic gatherings, and engagement with Twitter in terms of adoption, activity, and popularity correlate. Their findings highlighted a notably strong correlation between the recognition on Twitter and the quality of research, as determined by citation counts, across both public list appearances and the number of followers. This body of research leads us to propose the following hypotheses:
Volume
User activity plays an important role in attracting attention on social media platforms. Research has consistently shown that the frequency of content posting is positively associated with audience interest (Kurniawan et al., 2021). The overall quantity of posts a user makes is a strong indicator of their success as a social publisher (Park et al., 2013). Influencers, such as market mavens, who actively gather and disseminate information to others, tend to post more frequently than non-mavens (Harrigan et al., 2021). Therefore, for sexual assault centers using Twitter, the total volume of tweets can be seen as a representation of their level of activity and engagement with their audience.
Guo and Saxton (2018) suggest that an organization’s visibility, or its ability to be “heard,” is directly linked to how often and how much it communicates. This is supported by findings in the domain of medical research advocacy, which demonstrate a clear positive correlation between the quantity of an organization’s tweets and its visibility, as evidenced by the number of retweets and favorites it receives. Stabile et al. (2021) report similar findings, indicating a significant positive relationship between an organization’s total tweet volume and the attention it garners. Notably, the correlation might differ between retweets and favorites, with total tweet volume having a stronger link to attention metrics than the specific association between retweets and tweet volume. This observation forms the basis for the proposed hypothesis:
Targeting and Connecting Strategy
Effective communication strategies on social media platforms such as Twitter have been shown to enhance audience attention. Targeted communication fosters reciprocity and creates a sense of personal connection (Guo & Saxton, 2018). Framed within the context of social exchange theory (Homans, 1958, 2013), targeted communication cultivates a feeling of mutual exchange and induces a sense of obligation to reciprocate within a social interaction, as highlighted in the work by Guo and Saxton (2018). Twitter’s public reply messages, indicated by the “@USERNAME” convention, play a significant role in capturing audience attention. These messages fulfill a community function and are closely associated with fostering dialogue (Guo and Saxton, 2018; Lovejoy & Saxton, 2012). Stabile et al. (2021) indicate that there is a positive relationship between the number of public replies an organization sends and the likelihood of its tweets being retweeted and liked, suggesting that the amount of attention an organization receives is linked to its activity in sending public reply messages.
In addition to targeting specific users, Twitter offers various features for connecting with other entities on the platform to attract their attention. (1) User mentions: Organizations can mention specific individuals using “@USERNAME” in their tweets. Teoh et al. (2020) found that an increase in the number of mentions leads to more likes and retweets.
(2) Hashtags: Organizations can use hashtags (#) to index topics, making them more discoverable to users interested in those topics. Guo and Saxton (2014) note that hashtags serve as both a communication and community-building instrument, enabling organizations that share similar interests to effortlessly forge connections among themselves. Hutto et al. (2013) found that hashtag usage significantly predicts audience growth, and Suh et al. (2010) found a strong relationship between hashtags and retweetability. Han et al. (2019) demonstrated that including hashtags in tweets positively affects customer engagement for 28.57% of companies. Guo and Saxton (2018) show that there is a positive and significant correlation between the level of attention an organization attracts and the quantity of hashtags it uses. In line with the Uses and Gratifications (U&G, Katz, 1959) theory, a sense of belonging serves as a catalyst for social interactions on social media platforms.
(3) URLs: Organizations can include URLs within their tweets to connect to external sources or link to their own content. A. M. Jackson et al. (2018) found that URL links increase retweet frequency, and Han et al. (2019) observed a positive influence of the number of URLs on customer engagement. Suh et al. (2010) identified a strong relationship between the number of URLs and retweetability. Zhang and Zhu’s (2022) research found that tweets with URLs linking to images or news reports contributed to more favorites and retweets.
(4) Retweets from others’ tweets: Organizations can retweet content posted by other Twitter users to share it with their own followers. By retweeting others’ content, an organization can quickly expand the reach of the original tweet and potentially attract more attention. This act of retweeting also serves as an implicit endorsement of the original content. According to the work by Essaidi et al. (2020), the ability to retweet information is a crucial factor in determining influence on the platform. When organizations retweet high-quality content aligned with their mission and values, they are more likely to attract and retain followers with similar interests:
In a previous study, researchers conducted a comprehensive analysis of the websites of 261 agencies serving women survivors (Sorenson et al., 2014). They aimed to assess whether the information provided addressed key aspects of the Health Belief Model (Rosenstock, 1974a; Rosenstock, 1974b). The results indicated that “intended audience,” “Services,” and “Donating” were the primary features consistently found on the web pages of sexual assault agencies. These results provide important guidance for creating successful promotional tactics for these centers. Notably, mentioning the audience, services, and donations on an organization’s Twitter homepage represents a subtler form of targeting, different from public reply messages and user mentions. This indirect targeting strategy can be seen as a way to convey the organization’s values, mission, and commitment to its audience without the explicit act of targeting individuals. These insights from the literature contribute to the formulation of the following hypotheses:
Content Strategy
The content strategy in the model highlights the significance of content in determining an organization’s level of visibility. This study focuses on the use of visual cues and the inclusion of COVID-related keywords in tweets posted by sexual assault organizations on Twitter in Canada. Drawing from Katz’s introduction of the Uses and Gratifications (U&G) theory in 1959, which is widely employed by media researchers to understand participation in brand communities and motivations for engaging with various types of content on social media (Pletikosa Cvijikj & Michahelles, 2013), we adopt a content gratification perspective. This perspective examines the content factors that encourage the public or other organizations to interact with different types of content within Twitter’s messages.
Visual Content
Visual content, such as images, plays a critical role in attracting the attention of consumers in print advertising (Pieters & Wedel, 2004). The use of images and videos in communication, including social media marketing, has become increasingly prevalent (Burnett, 2015). Twitter allows users to incorporate visual cues such as videos, images, and GIFs in their tweets. Previous research suggests that using these visual cues can effectively attract audience attention and engagement. For example, studies by Kurniawan et al. (2021) and Teoh et al. (2020) indicate that compelling visuals and appropriate language increase audience interaction and the likelihood of likes and retweets. Carboni and Maxwell (2015) found that multimedia posts with photos generate significantly higher engagement than text-only posts, and A. M. Jackson et al. (2018) emphasized that attaching visual content to tweets improves retweet frequency. Guo and Saxton (2018) found a positive association between the presence of photos and the number of favorites for organizations’ tweets. Statistics show that press releases with photos or videos receive 45% more views than those relying solely on text (James, 2012). Research has pinpointed the types of media and content that spark greater engagement among Twitter users, with images and videos leading to the most favorites and retweets (Bonsón et al., 2019). Furthermore, tweets that include videos and animated GIFs tend to garner more interest, as reflected in higher rates of favorites and retweets, compared to tweets without such elements (Auxier et al., 2019). These media components act as triggers that enhance viewer involvement and perception (Byrum, 2014). From this body of research, we derive the following hypotheses:
COVID-Related Tweets
A study explored how transit agencies used Twitter for communication during the COVID-19 pandemic, examining the impact of their content and engagement levels on interaction with riders and the popularity of their Twitter accounts. Results showed that tweets related to COVID-19 attracted more favorites, retweets, and replies on average than those unrelated to the pandemic. In particular, a 1% uptick in tweets about COVID-19 was associated with a nearly equivalent 0.96% rise in the average number of favorites each tweet received (Zhang et al., 2023). The literature suggests a hypothesis as follows:
Aim of the Study
This study aims to investigate the communication strategies employed by sexual assault organizations on Twitter in Canada. To achieve this, we expand on the existing four-factor theoretical model proposed by Guo and Saxton (2018) by incorporating new influencing factors.
We also assess the validity of the model in the context of the COVID-19 pandemic. By doing so, we seek to gain insights into how these organizations use Twitter for communication during a time of heightened global attention to the pandemic. Figure 1 presents the model being tested.
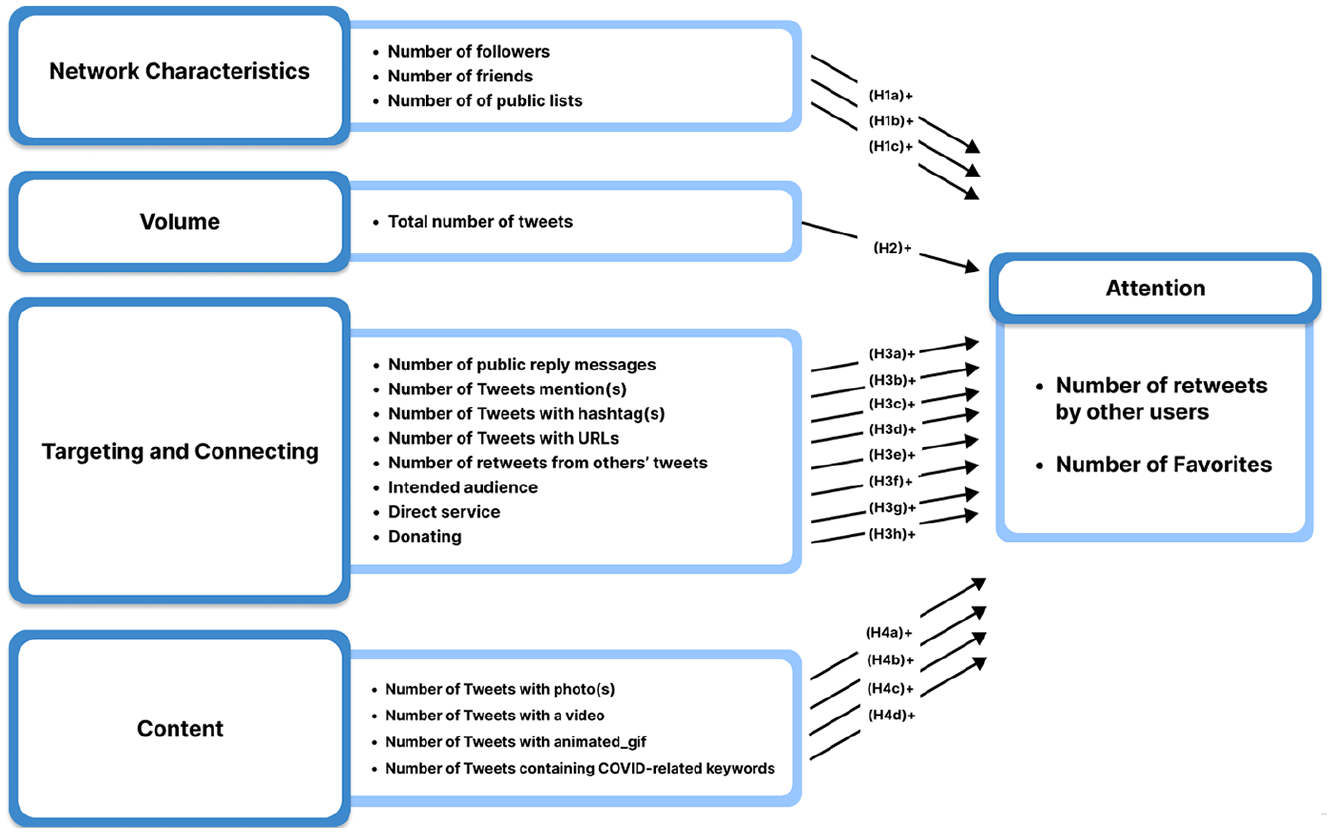
Model Being Tested.
Method
Sampling
In this study, we aimed to comprehensively analyze the communication strategies of all sexual assault and rape crisis centers in Canada. Therefore, we used an exhaustive approach rather than a purposive sampling method to select sexual assault and rape crisis centers in Canada. We meticulously compiled data from various sources to develop the sampling frame by combining the Canadian Association of Sexual Assault Centres website and the Sexual Assault Centres, Crisis Lines, and Support Services directory, which listed sexual assault centers by province and territory. After eliminating duplicates, we obtained a sample frame of 350 sexual assault centers across 10 provinces and 3 territories, providing basic information, such as center name, phone number, email, and website. To be included in our study, a sexual assault center must have a Twitter account and posted at least one tweet. To confirm eligibility, the research assistant (Q.Z.) manually searched the homepage of these centers, Twitter pages, and conducted Google searches. We identified 127 organizations with Twitter accounts, but three of them had never tweeted anything. These accounts were excluded from our final sample, resulting in 124 Twitter accounts belonging to sexual assault centers across nine provinces, Yukon, and the Northwest Territories. It should be noted that there are no sexual assault centers in Prince Edward Island that use Twitter.
Data Collection
For Twitter handle acquisition, we collected the Twitter account name, location, and Twitter handle for each sexual assault center’s Twitter account. We found 22 duplicate Twitter handles among the sampled centers, resulting in a final sampling list of 113 unique Twitter handles from 124 centers (more details in Author’s paper, Xue et al., 2024). To obtain the necessary data for this study, we converted each Twitter handle to its corresponding Twitter ID and used the 113 Twitter IDs to collect their corresponding Tweets using Twitter’s academic search API full archive endpoint and timeline endpoint. We downloaded all Tweets posted by the sampled centers from the date of each account’s establishment up to April 3, 2023, resulting in a dataset of 320,836 Tweets from 124 sexual assault centers. Our data collection process was done on April 3, 2023, and we obtained between 79.08% and 93.62% of the total number of tweets published by each Twitter ID. Our data included 310,661 tweets in English and 10,175 tweets in French.
Creating Two Dictionaries of COVID-Related Keywords
A COVID-19 keyword dictionary in English was developed by two research assistants (RAs; Q.Z. and H.S.) who randomly selected 500 tweets from the dataset after the declaration of COVID pandemic. The RAs manually identified if the tweet was COVID-related and subsequently extracted pertinent keywords. Additional COVID-19 related keywords were extracted from published articles to expand the existing keyword list and built a comprehensive dictionary.
The COVID-19 keyword dictionary was translated into French by one RA (Q.Z.) and validated by another RA (H.S.) using the official French website (e.g., Agence de la santé publique du Canada). Some keywords were translated into multiple French keywords to ensure accuracy. For example, “social distance” was translated into “distance sociale” and “distanciation sociale,” which had the same meaning.
To determine if a tweet was related to COVID, the pre-processed tweet text was checked against the stemmed COVID keyword list by language. If any of the stemmed COVID-related keywords were found in the text, the tweet was considered to be COVID-related. To provide examples of COVID-related tweets sent by the sexual assault centers, 3% of the identified COVID-related tweets (71 tweets in total) were randomly sampled after the outbreak of COVID-19 in March 2020. From these tweets, a selection of tweets (n = 2) sent by different organizations was chosen, and their Twitter IDs were obtained to retrieve the original screenshots from the website.
Operationalization
Dependent Variables
This study operationalizes the dependent variable attention proxies by measuring the number of retweets and the number of favorites. (1) Number of Retweets by other users, refers to the number of retweets of an account’s original tweets. The tweets being counted are the retweets of the organization’s original tweets by other users. To identify these tweets, we collect the value of “Retweet_count” in the “public_metrics” dictionary for each tweet from the Twitter API. However, if a tweet itself is a retweet of another original tweet, the numeric value only records how many times the original tweet has been retweeted at the time of capture, not how many times the tweet that is a retweet is being distributed. Therefore, we exclude the value of “Retweet_count” for all tweets that are the retweets themselves. To do this, we filter out retweets from other accounts by identifying the “RT @” keyword at the beginning of the “text.” For each organization ID per month and year, we compute the number of retweets that an account’s original tweet received from other users.
(2) Number of Favorites. The organization’s tweets’ favorites are recorded by collecting the “Favorite_count” value in the “public_metrics” dictionary of each tweet. To ensure accuracy, retweets from other accounts must be excluded from the count. This can be accomplished by checking the “text” field of the tweet’s API response for the keyword “RT @” at the beginning. By filtering out retweets from other accounts, we can determine the number of favorites received by the organization’s original tweets each month and year for each organization ID.
Number of Followers (Network Size)
The “followers_count” value in the “public_metrics” dictionary was obtained from the Twitter API. To maintain consistency, we treated “followers” as a constant value and extracted the highest value of “followers_count” for each ID by the time when the data collection finished (April 3, 2023) as the total number of followers for that account.
Number of Friends (Network Size)
We gathered the “friends_count” value in the “public_metrics” dictionary and selected the highest value of “following_count” for each ID by the time when the data collection finished (April 3, 2023) as the total number of friends for that account.
Number of Public Lists (Network Size)
We gathered the “listed_count” value in the “public_metrics” dictionary and selected the highest value of “listed_count” for each ID by the time when the data collection finished (April 3, 2023) as the total number of public lists for that account.
Total Number of Tweets (Volume)
We used the “texts” data for each account ID and counted the “texts” per account ID per month and year to determine the overall number of tweets posted by that account, including both original tweets and retweets of other users’ tweets.
Number of Public Reply Messages (Targeting and Connecting Strategy)
We used the “in_reply_to_user_id_str” to document the overall count of replies to other accounts made by a specific account. Therefore, we tallied the number of “in_reply_to_user_id_str” values (not empty) for each account ID and determined the cumulative number of replies by summing up the total count of replies made to other accounts by each account ID per month and year.
Number of Retweets From Others’ Tweets (Targeting and Connecting Strategy)
This variable recorded the number of retweets made by each organization from other organizations’ original tweets. These tweets are retweets from others’ tweets. To identify these tweets, the “text” collected by the API contained the keyword “RT@” at the beginning of the text.
Number of URLs in Original Tweets (Targeting and Connecting Strategy)
We used the “url” value to document the number of tweets containing one or more URLs posted by a specific account. We filtered out retweets with “url” and calculated the cumulative number of original tweets containing URLs posted by each organization ID each month and year.
Number of Hashtags in Tweets (Targeting and Connecting Strategy)
We identified the tweets that contained hashtags by tallying the count of entity dictionaries where the “hashtag” value was not empty. Then, we count the number of unique hashtags entities. We filtered out retweets and calculated the total count of original tweets containing hashtags posted by each organization ID per month and year.
Number of Mentions in Original Tweets (Targeting and Connecting Strategy)
We referred to the number of “‘id’”: in the “user_mentions” to identify the tweets that contained mentions. We filtered out retweets and tweets with non-empty “in_reply_to_user_id_str” values. Finally, we calculated the total count of original tweets containing mentions posted by each organization ID per month and year.
Intended Audience, Direct Service, and Donating (Targeting and Connecting Strategy)
The intended audience refers to the specific individuals or groups for whom a health program is designed. Direct service refers to the provision of specific interventions, treatments, or support to individuals or groups to address their needs. Donating refers to the act of providing financial or material resources to support organizations or initiatives. We examined the bios of the sampled organizations on their Twitter homepage and recorded whether they included information about their intended audiences. A code of 1 was assigned if the information was present and 0 if it was not. For instance, if a bio stated, “. . .provides support, counseling, and advocacy to women and girls abused by their intimate partner,” it was coded as yes (1). For example, if a sample organization included a hotline number in their bio on the homepage for potential audiences to access, it was coded as yes (1). For instance, if a bio mentioned supporting the organization by donating online at specific URLs, it was coded as yes (1).
Number of Photos in Original Tweets (Content)
We referred to the “type” value within the “Attaching media” to determine the type of media used with the tweet. We filtered out retweets and calculated the total count of photo entities per organization ID in the original tweets sent each month and year, taking into account that the maximum number of photos allowed in a tweet is four.
Number of Videos in Original Tweets (With a Maximum of One Video per Tweet) (Content)
We referred to the “Attaching media,” and the “Type” value to identify the tweets that contained videos. We filtered out retweets and calculated the total count of video entities per organization ID in the original tweets sent each month and year, considering that the maximum number of videos allowed in a tweet is one.
Number of Animated_Gif in Original Tweets (With a Maximum of One Gif per Tweet) (Content)
We referred to the “Attaching media” value and the “Type” to identify the tweets that contained animated GIFs. We filtered out retweets and calculated the total count of animated GIF entities per organization ID in the original tweets sent each month and year.
Number of Original Tweets Containing COVID-Related Keywords (Content)
We used the “text” information collected from the Twitter API. We created a dictionary including COVID-19-related terms, and used the natural language processing (NLP) approach to search for keywords, such as “covid,” “pandemic,” “lockdown,” and their corresponding French equivalents, such as “pandémie” and “confinement.” We tallied the count of original tweets with COVID-related information posted by each organization ID per month and year.
This study has one control variable—
Data Analysis
Our data analysis involved two regression models to examine the relationship between the attention received by sexual assault centers and various features of these centers and their posted tweets. Descriptive analysis was conducted to present the descriptive statistics of the sample and variables, including the number of retweets by other users, the number of tweets posted by the center, the number of followers of the center, and the number of public reply messages.
The first regression model was ordinary least squares (OLS), which is a commonly used statistical technique in the social sciences to assess the relationship between a continuous dependent variable and one or more independent variables. The second regression model employed was fixed effect regression, which is particularly suitable for variables that vary across individual observations but remain constant over time. This approach addressed a potential limitation of the Twitter API, as certain variables, such as the number of followers and number of friends associated with each sexual assault center’s Twitter account, were constant at the time of data collection. Using fixed effect regression, we were able to account for these time-invariant organizational characteristics and mitigate potential biases. Furthermore, the fixed effect regression also considered within-subject correlations that could exist across each sexual assault center’s account. This helped to control for account-specific attributes that do not vary over time, such as user age, intended audience, direct service, and donating.
Data Transformation
We transformed the heavily skewed dependent and independent variables in our proposed OLS and fixed effect models to meet the models’ normality assumptions because of the skewness of the dependent variables and the independent variables. The “bestNormalize” R package was used to determine the optimal data transformation method for normalizing the heavily skewed dependent and independent variables (Peterson, 2021). We considered data transformation methods, such as natural log, square root, ArcSinh, Lambert W, and Yeo–Johnson transformation. To ensure the robustness of the test statistics for normality, we employed 10-fold cross-validation. The Lambert W transformation was ultimately selected as the optimal transformation method for all continuous variables in the models, as it achieved the best normality statistics for the data (Goerg, 2011, 2022).
Results
Descriptive Statistics
Attention
The study examined the level of attention received by sexual assault organizations in terms of retweets and favorites. As indicated in Table 1, the average number of retweets and favorites per month received by a sexual assault center was 33.1 and 319.8, respectively. The range of retweets and favorites varied widely, ranging from 1 to 1,396 and 1 to 136,350, respectively. The data’s distribution did not adhere to a normal “bell curve” pattern but rather conformed to a power law distribution. This type of distribution is common in social network–based phenomena, as described in the work by Barabási and Albert (1999), as evidenced by the significant difference between the mean and median values, along with a broad span of data points (Guo & Saxton, 2018).
Monthly Descriptive Statistics of 124 sexual assault Organizations in Canada From Mar 2009 to Apr 2023.
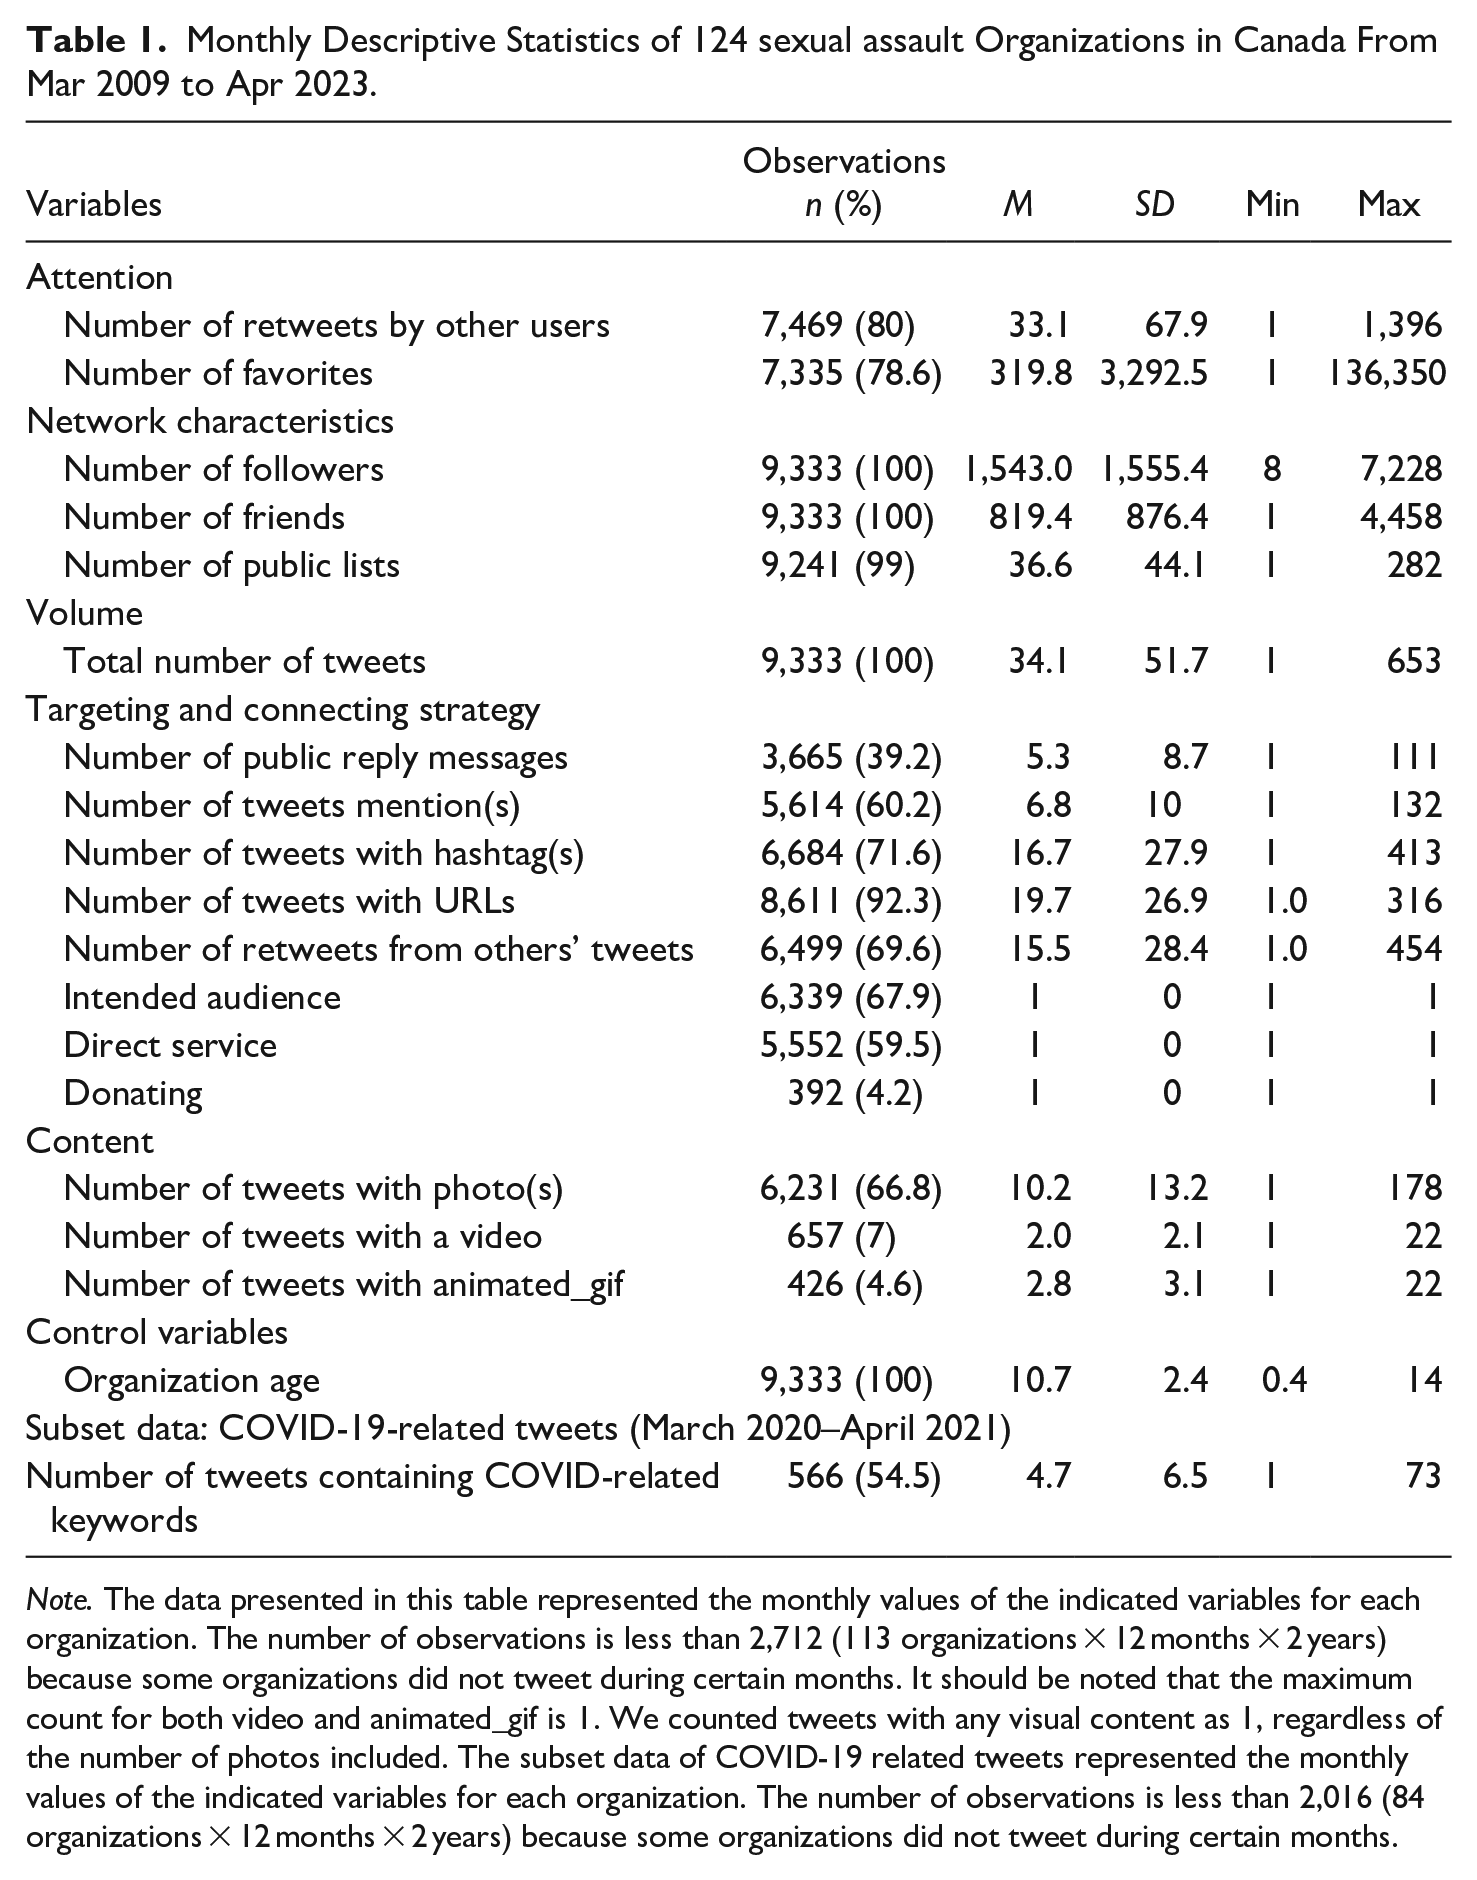
Note. The data presented in this table represented the monthly values of the indicated variables for each organization. The number of observations is less than 2,712 (113 organizations × 12 months × 2 years) because some organizations did not tweet during certain months. It should be noted that the maximum count for both video and animated_gif is 1. We counted tweets with any visual content as 1, regardless of the number of photos included. The subset data of COVID-19 related tweets represented the monthly values of the indicated variables for each organization. The number of observations is less than 2,016 (84 organizations × 12 months × 2 years) because some organizations did not tweet during certain months.
Network Size
On average, the sexual assault organizations in this study had 1,543.0 followers and 819.4 friends. The number of followers ranged from 8.0 followers (i.e., La Gîtée) to 7,228.0 followers (i.e., Adsum House [Shelter for homeless women and children]), and the number of friends ranged from 1.0 (e.g., SAGE Transition House) to 4,458.0 (e.g., Battered Women’s Support Services).
Volume
We collected the total number of tweets, containing 140 characters (up to 2017) and 280 characters (up to 2023). Our sample of 124 organizations with Twitter accounts sent a total of 320,836 tweets from March 2009 to April 2023. Table 1 showed that the average number of tweets sent by each organization in the sample was 34.1 per month during the period under study. There was a wide range of variability in the number of tweets sent, with some organizations sending as many as 653.0 tweets, while others sent only 1.
Targeting and Connecting Strategy
Several features on Twitter were measured as the targeting and connecting strategy, including the number of public reply messages, retweets, hyperlinks, hashtags, and user mentions. Findings showed that n = 3,665 (39.2%) of all tweets were public reply messages, n = 6,499 (69.6%) were retweets, n = 8,611 (92.3%) tweets contained URLs, n = 6,684 (71.6%) tweets contained at least one hashtag, and n = 5,614 (0.2%) tweets contained mentions. These findings are presented in Table 1.
Content
We included visual contents and COVID-19-related contents in the measurement. Sexual assault organizations can use various types of media in their tweets, such as photo, video, and animated gif. Findings showed that 6,231 (66.8%) tweets contained at least one photo in their tweets, with an average of 10.2, and 657 (7.0%) tweets contained a video, and 426 (4.6%) tweets used the animated GIF. These findings are presented in Table 1.
Multivariate Analysis
Zero-Order Correlations
Figure 2 showed the zero-order correlations for all the continuous variables in the model. To check for multicollinearity between independent variables, we assessed and found minimal issues except for the total number of tweets. In addition, the variance inflation factors (VIFs) of these variables also showed no significant multicollinearity. As each variable is essential for testing one of our proposed hypotheses, we did not remove any operationalized variable from the regression analysis based on the results of the multicollinearity tests.
Zero-Order Correlation Matrix for All Variables.
OLS Regression
We used the OLS regression models to evaluate the impact of independent variables on audience attention, as shown in Table 2. Model 1 focused on retweets by other users, while Model 2 examined the influence on favorites.
OLS Regression and Fixed Effect Regression Results for Audience Attention (Retweet and Favorite).
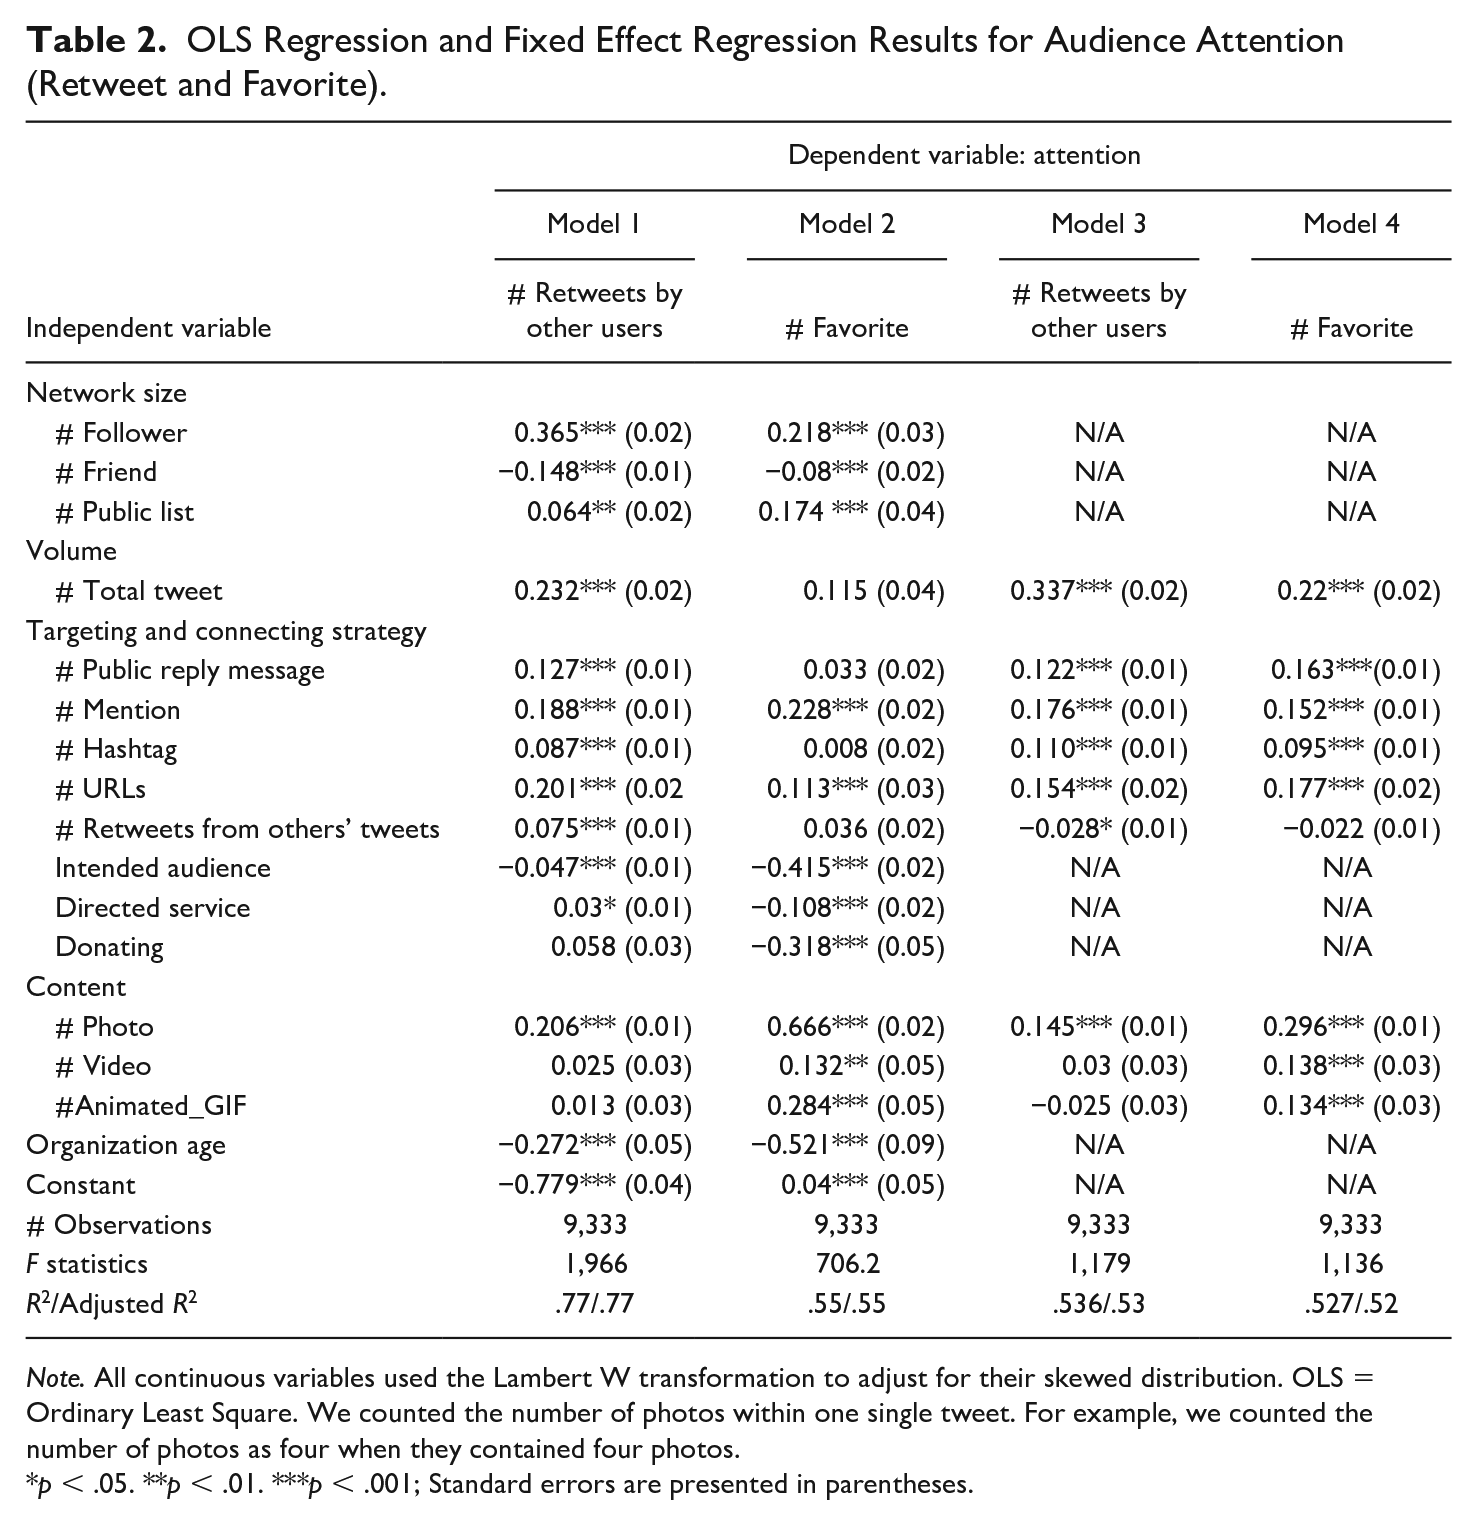
Note. All continuous variables used the Lambert W transformation to adjust for their skewed distribution. OLS = Ordinary Least Square. We counted the number of photos within one single tweet. For example, we counted the number of photos as four when they contained four photos.
p < .05. **p < .01. ***p < .001; Standard errors are presented in parentheses.
Network Size
There is a significant positive relationship between the number of followers and both retweets (0.365, p < .001) and favorites (0.218, p < .001). The number of friends exhibited significant negative relationship with retweets (−0.148, p < .001) and favorites (−0.08, p < .001). There were significant positive relationships between the number of public lists and both retweets (0.064, p < .01) and favorites (0.174, p < .001).
Volume
The total number of tweets demonstrates a significant positive impact on retweets (0.232, p < .001).
Targeting and Connecting Strategy
Public reply messages (0.127, p < .001), mentions (0.188, p < .001), hashtags (0.087, p < .001), URLs (0.201, p < .001), and retweets of others’ tweets (0.075, p < .001) all positively influence retweets. However, only mentions (0.228, p < .001) and URLs (0.113, p < .001) display positive relationships with favorites.
Intended Audience
Intended audience demonstrates a significant negative relationship with both retweets (−0.047, p < .001) and favorites (−0.415, p < .001).
Directed Service
Directed service shows a significant positive relationship with retweets (0.03, p < .05) and negative relationship with favorites (−0.108, p < .001).
Donating
Donating exhibits a significant negative relationship with favorites (−0.318, p < .001).
Content
Photos have a significant positive impact on both retweets (0.206, p < .001) and favorites (0.666, p < .001). Videos (0.132, p < .01) and animated GIFs (0.284, p < .001) show significant positive relationship with favorites. There is a significant negative relationship between the age of the organization and retweet and favorites.
Fixed Effect Regression
To account for user-based independent variables that remain constant over time, such as the number of followers and friends, we employed the fixed effect regression model. These variables were expected to gradually increase during the data collection period. It is important to note that the fixed effect model does not assess certain proposed hypotheses related to network characteristics and targeting and connecting strategy. Models 3 and 4, presented in Table 2, used the fixed effect regression model to examine the impact of independent variables on audience attention.
Volume
The variable “Total Tweet” demonstrates a significant positive relationship with both retweets (0.337, p < .001) and favorites (0.220, p < .001).
Targeting and Connecting Strategy
There are significant positive relationships between the following variables and audience attention: Public reply message: Both retweets (0.122, p < .001) and favorites (0.163, p < .001). Mentions: Both retweets (0.176, p < .001) and favorites (0.152, p < .001). Hashtags: Both retweets (0.110, p < .001) and favorites (0.095, p < .001). URLs: Both retweets (0.154, p < .001) and favorites (0.177, p < .001). Retweets from others’ tweets: There is a significant negative relationship with retweets (−0.028, p < .05), but no significant relationship with favorites.
Content
The presence of photos exhibits a significant positive relationship with both retweets (0.145, p < .001) and favorites (0.296, p < .001). Videos show a significant positive relationship with favorites only (0.138, p < .001). Animated GIFs demonstrate a significant positive relationship with favorites (0.134, p < .001).
Subset COVID-19 Data Results
Models 5, 6, 7, and 8 focused on a specific subset of data, spanning from March 1, 2020, to April 31, 2021, which corresponds to a period of significant global attention to the COVID-19 pandemic. These models explored the effects of organizational strategies on audience attention, incorporating COVID-related tweets as an independent variable. This time period was selected due to its high prevalence of COVID-related content, which accounted for more than 10% of the total number of monthly tweets.
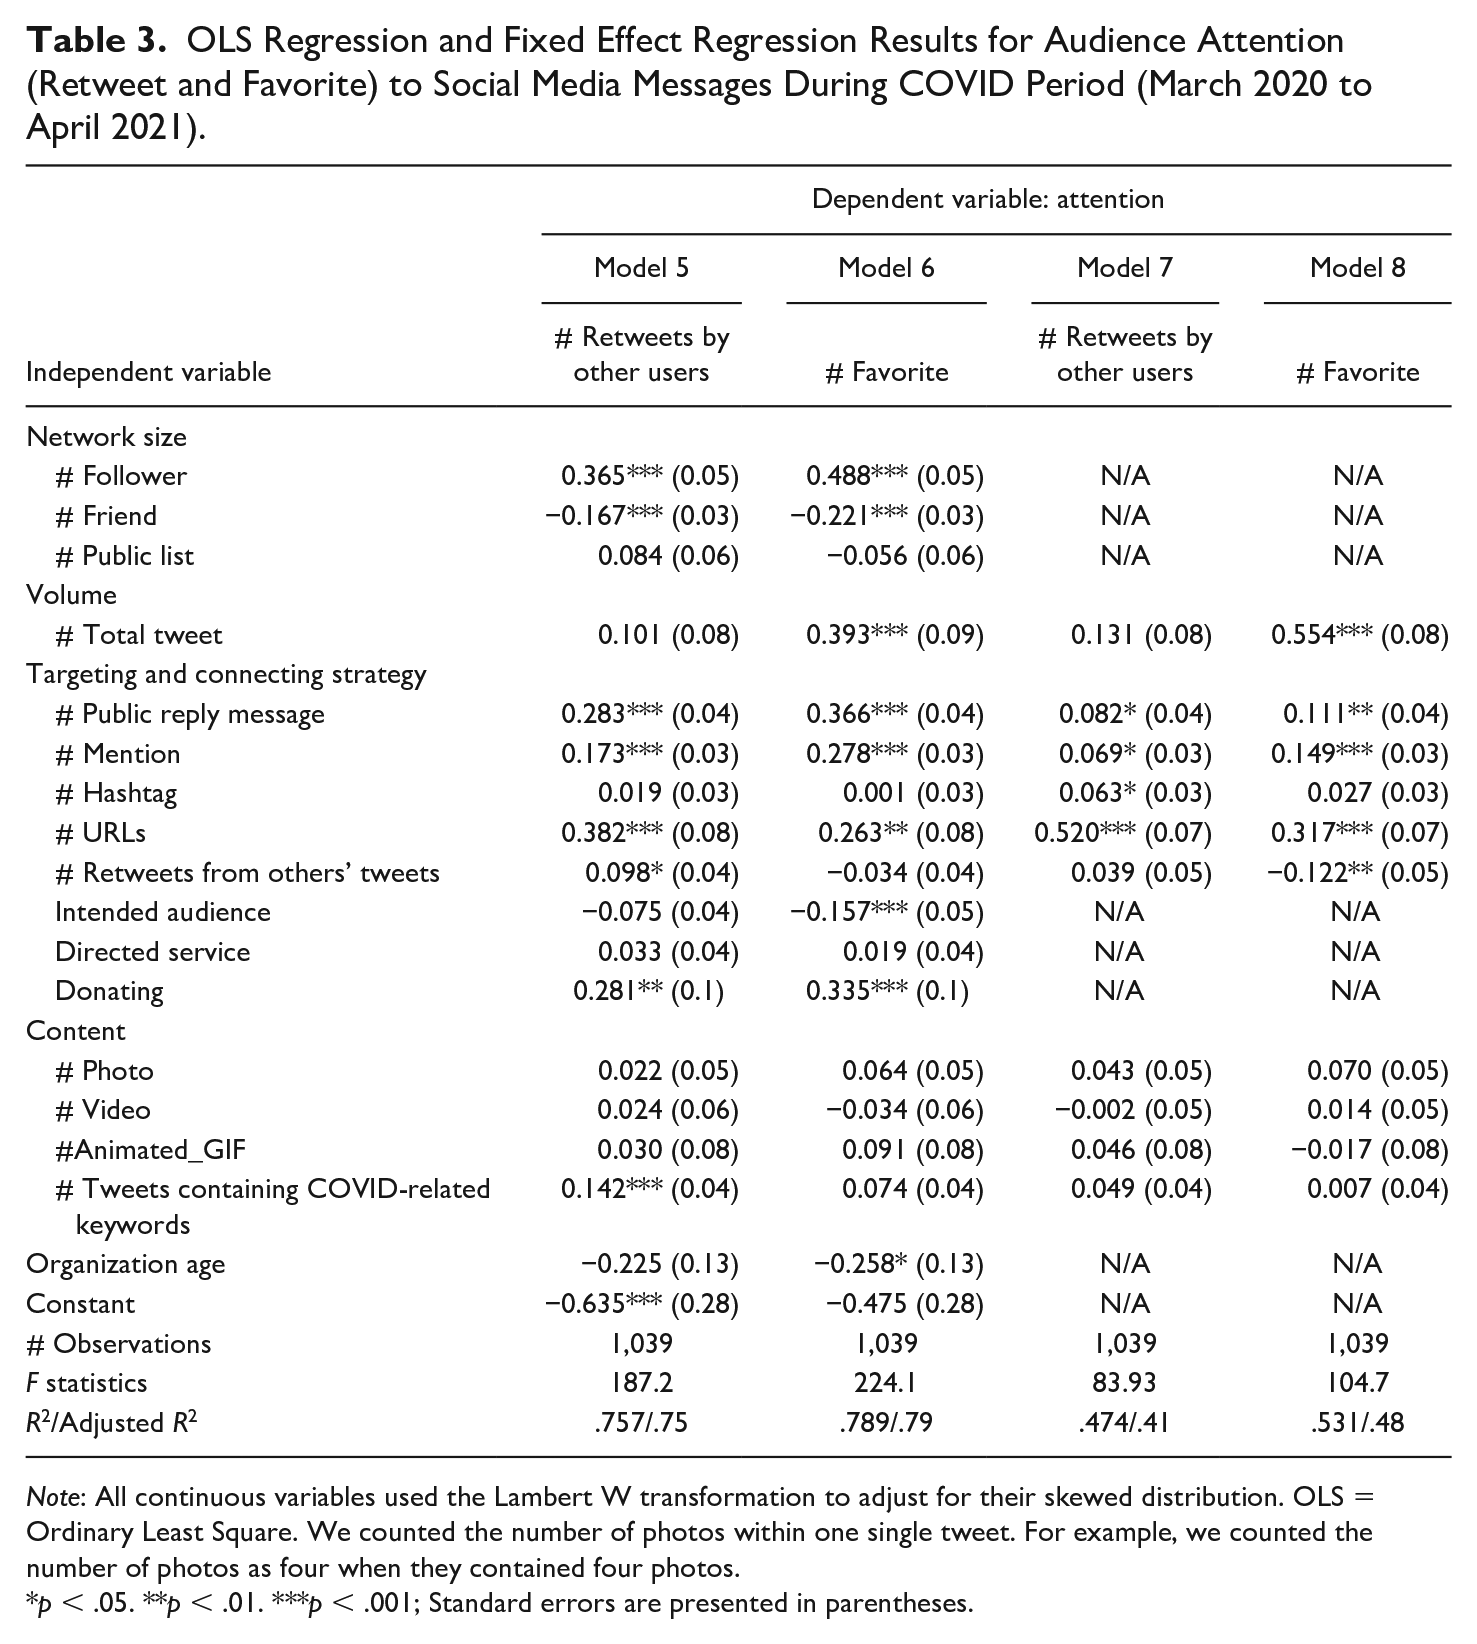
The OLS regression models were employed to assess the impact of independent variables on audience attention (retweet and favorite) during the COVID period (March 2020 to April 2021), as presented in Table 3.
OLS Regression and Fixed Effect Regression Results for Audience Attention (Retweet and Favorite) to Social Media Messages During COVID Period (March 2020 to April 2021).
Note: All continuous variables used the Lambert W transformation to adjust for their skewed distribution. OLS = Ordinary Least Square. We counted the number of photos within one single tweet. For example, we counted the number of photos as four when they contained four photos.
p < .05. **p < .01. ***p < .001; Standard errors are presented in parentheses.
Network Size
There is a significant positive relationship between the number of followers and both retweets (0.365, p < .001) and favorites (0.488, p < .001). There is a significant negative relationship between the number of friends and both retweets (−0.167, p < .001) and favorites (−0.221, p < .001). Total tweets exhibit a significant positive relationship with favorites (0.393, p < .001).
Targeting and Connecting Strategy
Public reply message has a significant positive relationship with both retweets (0.283, p < .001) and favorites (0.366, p < .001). Mention has a significant positive relationship with both retweets (0.173, p < .001) and favorites (0.278, p < .001). URLs have a significant positive relationship with both retweets (0.382, p < .001) and favorites (0.263, p < .01). Retweets from others’ tweets have a significant positive relationship with retweets (0.098, p < .05), but no significant relationship with favorites.
Content
Only the variable of COVID-related tweets has a significant positive relationship with retweets (0.142, p < .001), but no significant relationship with favorites.
Models 7 and 8, presented in Table 3, focused on the fixed effect regression results for audience attention (retweet and favorite) to social media messages during the COVID period (March 2020 to April 2021).
Total tweets exhibit a significant positive relationship with favorites (0.554, p < .001). In the targeting and connecting strategy category, public reply message has a significant positive relationship with both retweets (0.082, p < .05) and favorites (0.111, p < .01). Mention has a significant positive relationship with both retweets (0.069, p < .05) and favorites (0.149, p < .001). Hashtag has a significant positive relationship with retweets (0.063, p < .05). URLs have a significant positive relationship with both retweets (0.520, p < .001) and favorites (0.317, p < .001). Retweets from others’ tweets have a significant negative relationship with favorites (−0.122, p < .01). No variables in the content category exhibit a significant relationship with audience attention.
Discussion
Network Characteristics
The results revealed that network characteristics, such as the number of followers, friends, and public lists, significantly influenced the level of attention sexual assault organizations received on Twitter. Regarding the dimension of network characteristics, our findings related to the impact of the number of followers, friends, and listed on message attention on Twitter, as framed by Social Influence Theory (Kelman, 1961, 1974, 2006), align with prior research (Hutto et al., 2013; Petrovic et al., 2011; Stvilia & Gibradze, 2014). These studies emphasized the importance of social media network connections in attracting audience attention. Specifically, the number of followers was found to be positively associated with retweets and favorites, indicating that a larger follower base enhances the reach and impact of organizations’ communication efforts. This aligns with studies that highlighted the role of follower count in determining influence and brand awareness (Essaidi et al., 2020; Han et al., 2019). However, the number of friends displayed a negative relationship with retweets and favorites, suggesting that organizations with a more balanced follower-to-friend ratio tend to attract greater attention. Furthermore, the presence of public lists was positively associated with both retweets and favorites, indicating that organizations included in public lists are more likely to receive attention and engagement. These findings support the notion that network characteristics play a vital role in shaping the attention-seeking strategies of sexual assault organizations on Twitter.
An important implication of the study is the significance of sexual assault organizations strengthening and expanding their social media network connections. The research emphasizes the positive influence of having a larger number of followers, maintaining a balanced ratio of followers to friends, and being included in public lists on attracting audience attention. It is crucial for organizations to dedicate resources to increasing their follower count, cultivating meaningful relationships with other users, and fostering active engagement within their network.
Volume
The study found that the total volume of tweets sent by sexual assault organizations was positively associated with the level of attention received in terms of retweets. This aligns with previous research that highlighted the positive association between content posting frequency and audience interest (Kurniawan et al., 2021; Park et al., 2013). These findings suggest that organizations with a higher level of activity and engagement, as indicated by a greater number of tweets, are more successful in attracting attention from their audience. It is worth noting that Tafesse and Wood (2021) reported contrasting results, showing that posting content in high volumes on Instagram could potentially reduce follower engagement due to a decreased sense of content uniqueness. This viewpoint indicates that prioritizing the number of messages may detract from the creativity of the content (cited in Audrezet et al., 2020; Colliander and Marder, 2018). However, our study highlights that while the relationship between the total volume of tweets and favorites was not as strong, it was more pronounced concerning retweets. This underscores that retweets may serve as a more prominent indicator of attention in the context of sexual assault organizations’ communication on Twitter. Given the nature of the message content shared by sexual assault centers on social media, which may have lower expectations for creativity and originality, our study highlights the importance of maintaining an active and consistent presence on Twitter. A higher number of tweets were associated with a greater likelihood of retweets, indicating the level of an influencer’s active participation on social media. This finding provides objective metrics that contribute to our understanding of the mechanisms outlined in social influence theory (Homans, 1958, 2013).
Targeting and Connecting Strategy
The study examined various targeting and connecting strategies employed by sexual assault organizations on Twitter, including public reply messages, user mentions, hashtags, URLs, and retweets of others’ tweets. The results indicated that these strategies had a significant impact on attracting attention. Public reply messages, user mentions, hashtags, and URLs were all positively associated with retweets, indicating that these communication tactics contribute to audience engagement and interaction. The findings are consistent with previous research that emphasized the importance of targeted communication and fostering personal connections on social media platforms (Guo & Saxton, 2018; Lovejoy & Saxton, 2012). It is noteworthy that retweets of others’ tweets showed a positive relationship with retweets but did not exhibit a significant association with favorites. This suggests that retweeting others’ content is effective in expanding the reach of organizations’ messages but may not directly influence the level of attention received in terms of favorites. Organizations should employ these strategies strategically to foster engagement, initiate dialogue, and attract the attention of their target audience.
Our hypotheses proposed that the attention sexual assault centers receive on Twitter would be positively associated with mentioning the intended audience, directed services, and donations on their Twitter homepages. However, the results revealed some interesting patterns. Regarding the intended audience, the findings indicated a significant negative relationship with both retweets and favorites, suggesting that explicitly mentioning the intended audience on the organizations’ Twitter homepages may not necessarily lead to increased attention from users. By specifically addressing a particular group of individuals, the organization may inadvertently exclude or alienate other Twitter users who do not fall within that intended audience. Users who do not identify as part of the intended audience may perceive the organization’s content as irrelevant, potentially diminishing their overall interest in engaging with the organization’s tweets. This could result in reduced engagement from users who do not feel directly addressed or represented by the organization’s content.
In terms of directed services (i.e., providing information about their specific interventions, treatments, or support on their Twitter homepages), results suggest that while mentioning directed services may attract attention and engagement in terms of retweets, it may not have the same impact on the favoriting behavior of Twitter users. It would be valuable to investigate the reasons behind this divergence in user engagement across different types of interactions.
Findings from the subset data during the pandemic reveal a significant positive relationship between mentioning donation opportunities on organizations’ Twitter homepages and both retweets and favorites. This indicates that during times of crisis, such as the COVID-19 pandemic, explicitly highlighting donation information on Twitter can serve as an effective attention-seeking strategy, resulting in increased user engagement. In contrast, organizations that mentioned accepting donations on their Twitter homepages received lower levels of favoriting activity from users in non-pandemic periods. It is possible that people are often more inclined to support and contribute to causes and initiatives aimed at addressing the pressing needs and challenges arising from the pandemic. Explicitly mentioning donation opportunities signals to users that the organization is actively involved in addressing these critical issues and evokes a sense of urgency, empathy, and collective responsibility among users.
Content Strategy
The study explored the impact of visual content and COVID-related tweets on the attention received by sexual assault organizations on Twitter. The findings revealed that the inclusion of photos, videos, and GIFs in tweets positively influenced the level of attention in terms of favorites. These results align with previous research emphasizing the significance of visual cues in capturing audience attention and enhancing engagement (Carboni & Maxwell, 2015; A. M. Jackson et al., 2018). The use of multimedia content, such as photos and videos, has been shown to generate higher levels of interaction and audience response compared to text-only posts (Burnett, 2015; Carboni & Maxwell, 2015). This suggests that sexual assault organizations can effectively use visual content to enhance the reach and influence of their messages on Twitter. Sexual assault organizations should leverage these visual cues to capture audience attention, enhance engagement, and increase the likelihood of retweets and favorites.
Based on the results obtained from the subset COVID-19 data, which focused on a specific period corresponding to the global attention to the COVID-19 pandemic, key findings emerged. Notably, the variable of COVID-related tweets showed a significant positive relationship with retweets but did not exhibit a significant relationship with favorites. This indicates that tweeting about COVID-19 topics specifically may attract more retweets, reflecting users’ interest and engagement in pandemic-related content. This finding is consistent with previous research that highlighted the heightened attention and interest surrounding COVID-related topics on social media platforms (Zhang et al., 2023).
Contributions to Theory and Practice
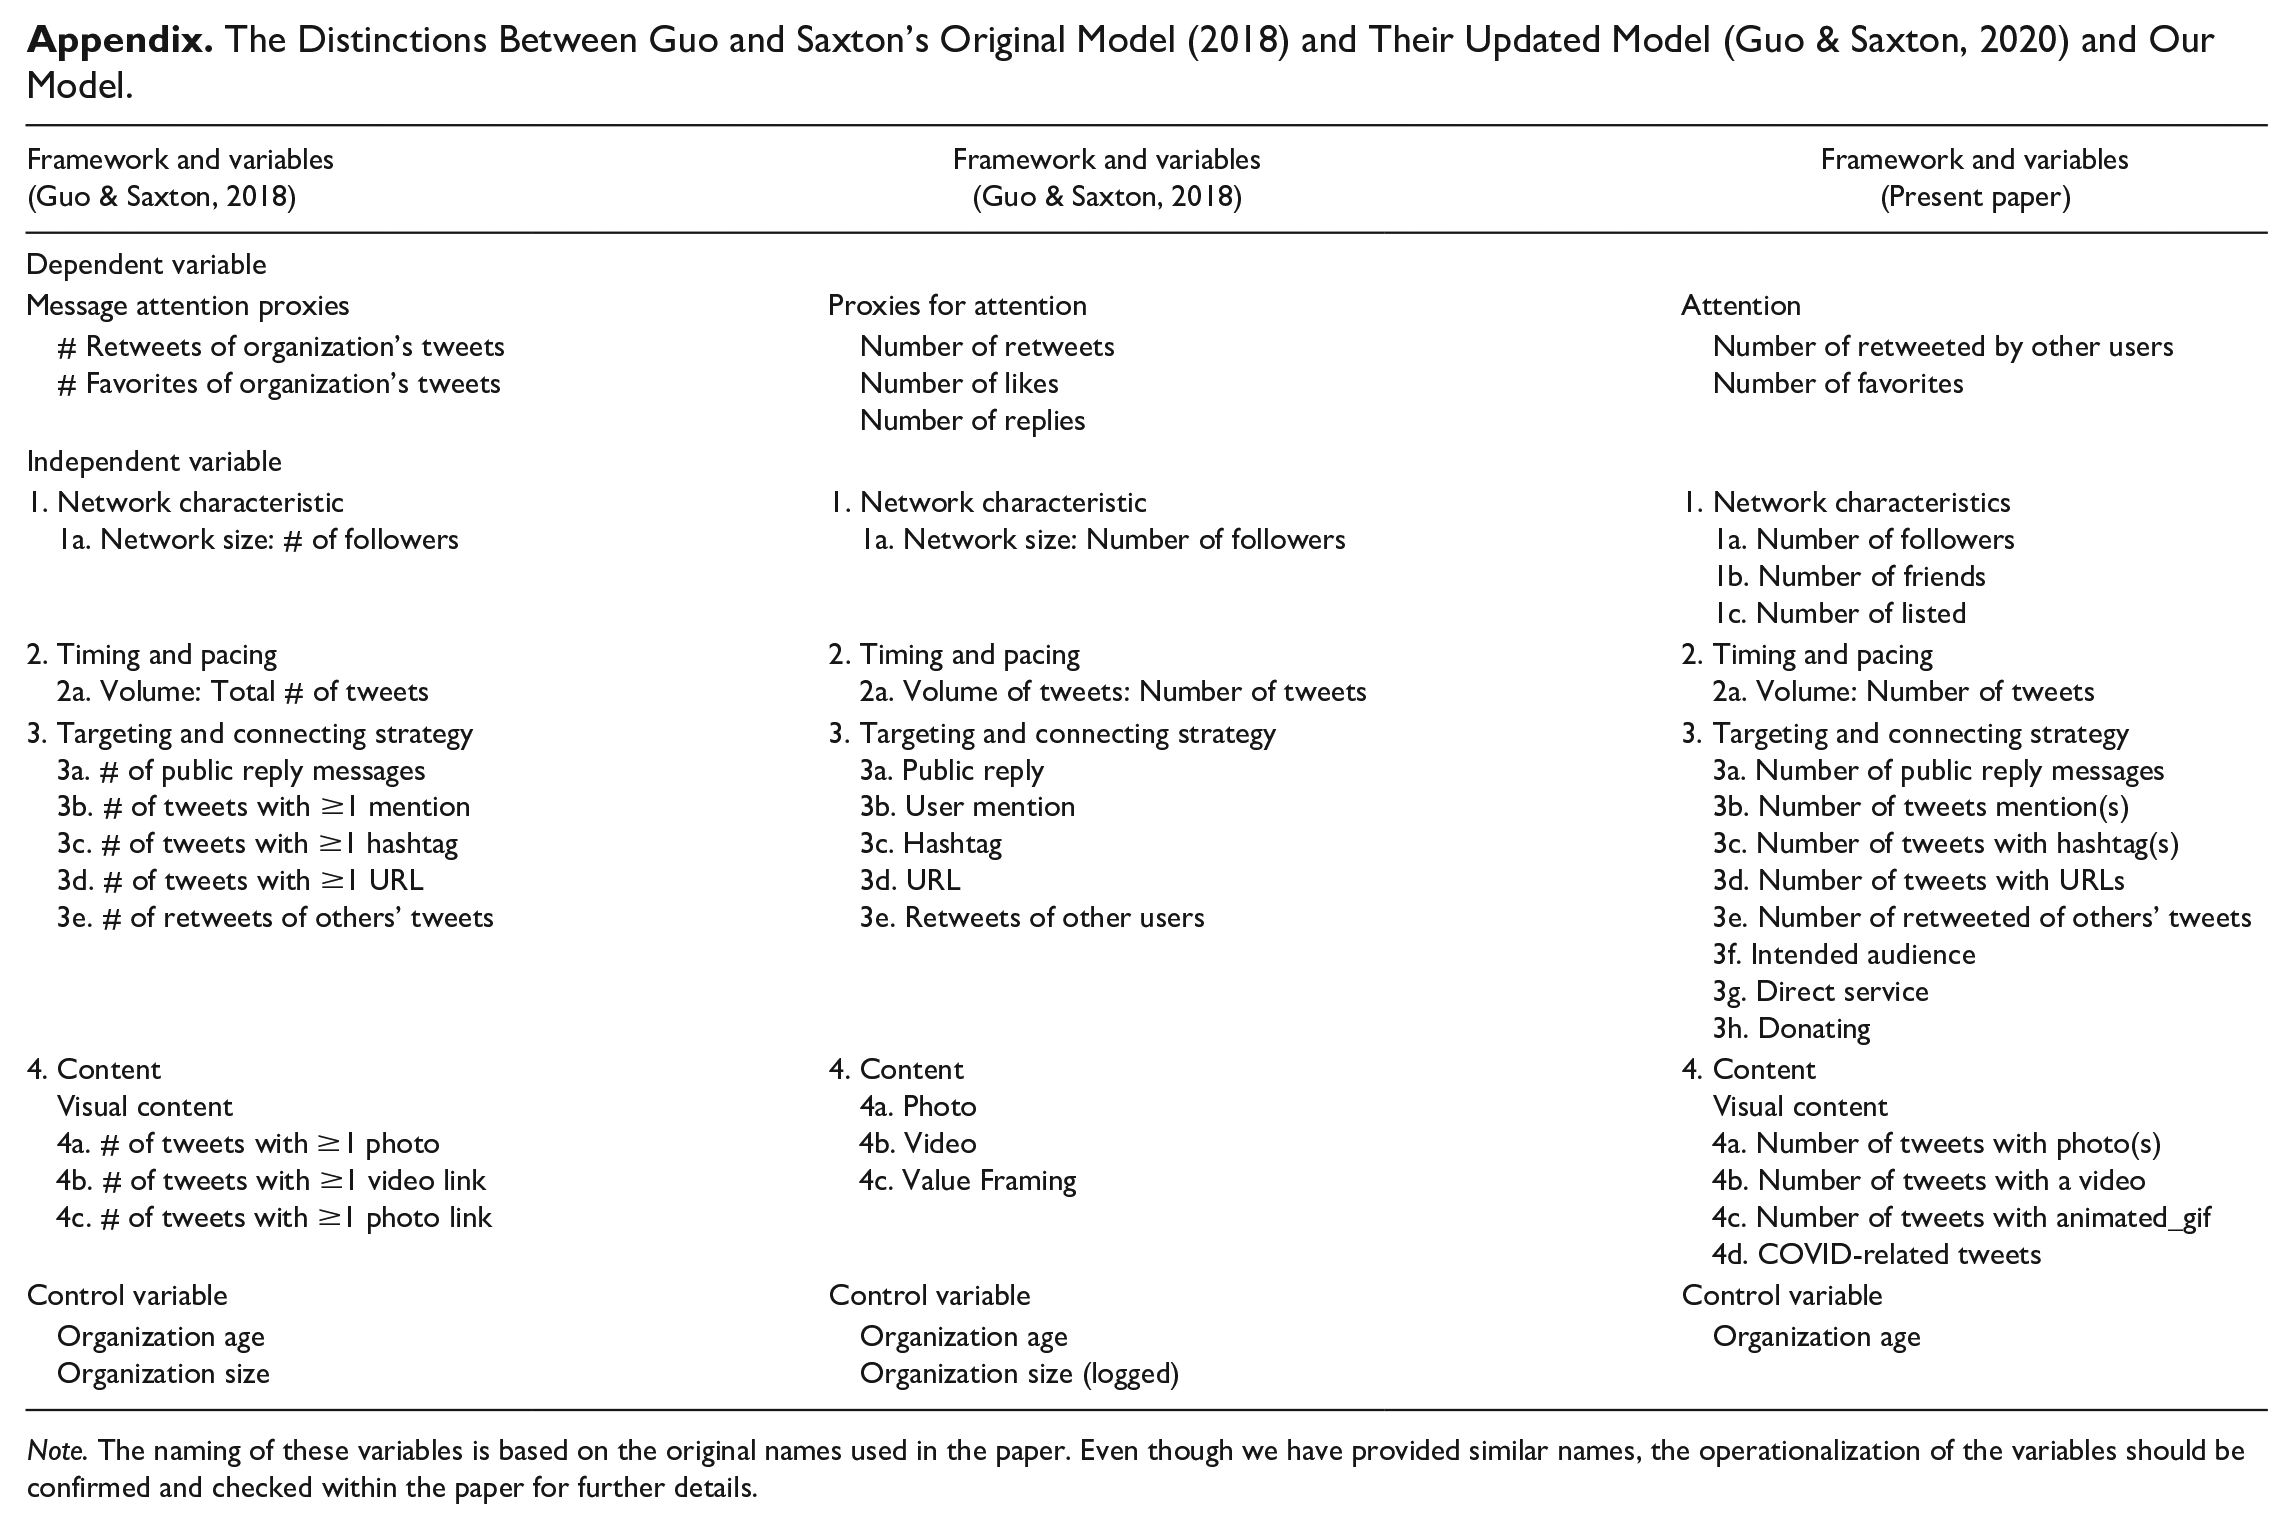
In this study, our theoretical contributions extend and build on the foundational work of Guo and Saxton, as outlined in the four-factor explanatory model (Guo and Saxton, 2018, 2020). Their original model (Guo & Saxton, 2018) introduced a four-factor explanatory framework, which posits that attention on social media is influenced by four key factors: Audience/network-level Characteristics, Targeting and Connecting Strategies, Timing and Pacing, and Content-level Characteristics.
Subsequently, Guo and Saxton expanded this framework (Guo & Saxton, 2020) to include two overarching categories: audience/network-level characteristics and the organization’s communication strategy (i.e., timing and pacing, targeting and connecting, and content). In our current work, we have taken their model a step further by conducting a more in-depth exploration of network size variables, specifically focusing on the number of followers, friends, and those listed (Appendix 1). These additions contribute to a more comprehensive understanding of an organization’s reach and influence on social media.
Furthermore, we have broadened the model by incorporating additional variables in the Targeting and Connecting Strategy dimension, such as the intended audience, direct service, and donations. Mentioning the audience, services, and donations on an organization’s Twitter homepages represents a subtler form of targeting, different from public reply messages and user mentions. This indirect targeting strategy can be seen as a way to convey the organization’s values, mission, and commitment to its audience without the explicit act of targeting individuals.
Our contribution is further extended by the inclusion of content variables, specifically, the quantification of “animated GIFs” and “COVID-related tweets.” Although Guo and Saxton’s model (2018, 2020) primarily focuses on visual content within the content dimension, these two additions facilitate a deeper and more nuanced exploration of the content strategies employed by organizations, particularly during the ongoing pandemic in recent years. This comprehensive approach sheds significant light on the critical aspects of organizational communication and engagement strategies throughout the pandemic period. Through the expansion and refinement of our model, we not only build on the foundational framework established by Guo and Saxton (2018, 2020) but also provide a more robust and inclusive framework for the comprehensive analysis of organizational communication strategies in the digital age.
Limitations
It is important to acknowledge the limitations of this study. The findings are based on a specific context and may not be generalizable to other types of nonprofit organizations or other industries. Future research could explore attention-seeking strategies employed by organizations in different areas or geographical locations to gain a more comprehensive understanding of effective communication on social media platforms (such as other human service organization sectors, community sport organizations, membership and umbrella organizations.). Second, the study focused on quantitative measures of attention, such as retweets and favorites, without considering the qualitative aspects of engagement and impact. Future research could incorporate qualitative methods to gain a deeper understanding of audience responses and the effectiveness of communication strategies. Third, one limitation of our study is the unavailability of organizational size data for the sexual assault and rape crisis centers included in our dataset. Consequently, we were unable to incorporate organizational size as a control variable in our analysis. As an important factor that may influence an organization’s social media presence and strategies (Wallace & Rutherford, 2021), future studies could collect organizational size data as a potential control variable.
Furthermore, we opted not to incorporate “value-based language” into our analysis because of the unique focus of our dataset, which primarily centers around textual content related to sexual assault and rape crisis matters. This specificity posed limitations when it came to investigating the concept of “value framing” within our study. Future research exploring different types of organizational social media messages can consider including this textual content using the Harvard IV/RcEthic dictionary (suggested by Guo and Saxton, 2020).
In addition, we did not include “value-based language” which indicated to reflect a positive relationship with attention proxy, due to the specific nature of our dataset which revolves around sexual assault and rape crisis textual contents, and faced limitations in terms of exploring value framing in our study. Future study can add this hypothesis to examine the value-based language textual content’s impact on attention using the Harvard IV RcEthic dictionary when they explore other types of organizational social media messages (Guo & Saxton, 2020).
Finally, exploring the role of other social media platforms and considering the interplay between different platforms could provide a more comprehensive understanding of attention-seeking strategies in the digital realm.
Conclusion
Although this study is centered on a single country, its findings hold valuable practical relevance, providing insights for practitioners and nonprofit organizations seeking to optimize their communication strategies on social media platforms, with a particular emphasis on audience attention and engagement, especially in the context of a global pandemic. The study posits several key recommendations: (1) Augmentation of network characteristics: Organizations are encouraged to adopt a proactive approach to augmenting their network characteristics on Twitter. This includes endeavors to bolster their follower count, maintain a balanced follower-to-friend ratio, and actively seek inclusion in public lists. Such strategic enhancements in network attributes have been demonstrated to substantially augment audience attention. (2) Sustained and active presence: The research suggests a consistent and active presence on Twitter. An association exists between such sustained engagement and an increased likelihood of retweets, which signifies the important role of regular posting and audience engagement in sustaining organizational visibility. (3) Strategic utilization of targeting and connecting strategies: The study reveals the efficacy of employing diverse targeting and connecting strategies, such as public reply messages, user mentions, hashtags, and URLs. These tactical endeavors facilitate audience engagement and interaction by fostering dialogue, nurturing interpersonal connections, and eliciting audience attention. (4) Strategic mentioning of donation opportunities (Elvira-Lorilla et al., 2023): Organizations are advised to strategically incorporate mentions of donation opportunities within their Twitter communications. This proven approach serves as an effective mechanism for capturing audience attention and amplifying engagement, particularly in addressing pressing challenges and immediate needs. (5) Leveraging visual content: The study underscores the potential of integrating visual elements into tweets as a catalyst to enhance audience engagement. (6) Pandemic-related themes: During the COVID-19 pandemic, tweets centering on pandemic-related themes have demonstrated a propensity to attract more retweets, reflecting users’ heightened interest in such content. These practical implications contribute to the advancement of nonprofit communication strategies, with a specific focus on sexual assault organizations. By incorporating these strategic recommendations into their communication endeavors, organizations can not only enhance their digital presence but also effectively engage with their target audience, champion their cause, and adeptly navigate the challenges presented by evolving societal contexts, such as the complexities engendered by the COVID-19 pandemic.
Footnotes
Appendix
The Distinctions Between Guo and Saxton’s Original Model (2018) and Their Updated Model (Guo & Saxton, 2020) and Our Model.
| Framework and variables |
Framework and variables |
Framework and variables |
|---|---|---|
| Dependent variable | ||
| Message attention proxies | Proxies for attention | Attention |
| # Retweets of organization’s tweets # Favorites of organization’s tweets |
Number of retweets Number of likes Number of replies |
Number of retweeted by other users Number of favorites |
| Independent variable | ||
| 1. Network characteristic 1a. Network size: # of followers |
1. Network characteristic 1a. Network size: Number of followers |
1. Network characteristics 1a. Number of followers 1b. Number of friends 1c. Number of listed |
| 2. Timing and pacing 2a. Volume: Total # of tweets |
2. Timing and pacing 2a. Volume of tweets: Number of tweets |
2. Timing and pacing 2a. Volume: Number of tweets |
| 3. Targeting and connecting strategy 3a. # of public reply messages 3b. # of tweets with ≥1 mention 3c. # of tweets with ≥1 hashtag 3d. # of tweets with ≥1 URL 3e. # of retweets of others’ tweets |
3. Targeting and connecting strategy 3a. Public reply 3b. User mention 3c. Hashtag 3d. URL 3e. Retweets of other users |
3. Targeting and connecting strategy 3a. Number of public reply messages 3b. Number of tweets mention(s) 3c. Number of tweets with hashtag(s) 3d. Number of tweets with URLs 3e. Number of retweeted of others’ tweets 3f. Intended audience 3g. Direct service 3h. Donating |
| 4. Content Visual content 4a. # of tweets with ≥1 photo 4b. # of tweets with ≥1 video link 4c. # of tweets with ≥1 photo link |
4. Content 4a. Photo 4b. Video 4c. Value Framing |
4. Content Visual content 4a. Number of tweets with photo(s) 4b. Number of tweets with a video 4c. Number of tweets with animated_gif 4d. COVID-related tweets |
| Control variable | Control variable | Control variable |
| Organization age Organization size |
Organization age Organization size (logged) |
Organization age |
Note. The naming of these variables is based on the original names used in the paper. Even though we have provided similar names, the operationalization of the variables should be confirmed and checked within the paper for further details.
Data Availability
The data are not publicly available due to ethical, legal, or other concerns.
Declaration of Conflicting Interests
The author(s) declared no potential conflicts of interest with respect to the research, authorship, and/or publication of this article.
Funding
The author(s) disclosed receipt of the following financial support for the research, authorship, and/or publication of this article: “Mining big data: how sexual assault nonprofit organization in Canada use Twitter to achieve organizational outcomes,” Insight Development Grants, Social Sciences Humanities Research Council (SSHRC).