
Abstract
Current evidence suggests that nonprofits’ use of Twitter is not strongly related to organizational size, unlike other technological developments. However, this evidence is primarily based on studies of large nonprofit organizations. This study uses a random sample of charities, stratified by size, to present evidence that organization size is a significant factor in multiple dimensions of social media use: the percentage of charities owning a Twitter handle, activity on the site, and popularity within the charities’ network. Many charities are using Twitter, but larger charities are making more effective use of the platform to connect to other organizations. The very largest charities exhibit an overwhelming popularity effect in the network, whereas small charities are notably less active than their larger counterparts. Besides the substantive findings, we further demonstrate the methodological potential of using exponential random graph modeling to gain a deeper understanding of the characteristics of nonprofits’ social media networks.
The rise of digital media, and its importance as a communication channel for organizations, is inescapable. Nonprofit organizations rely on relationships: with donors, with government, and with other nonprofit organizations; social media platforms are widely used in building and maintaining relationships. In particular, Twitter facilitates links between organizations and is popular with nonprofits (Guo & Saxton, 2014).
Twitter is a microblogging site which allows the sharing of short messages to a wide audience. Previous studies have demonstrated the benefits of voluntary sector use of social media, such as organizational visibility and stakeholder engagement (Xu & Saxton, 2019).
While charities have been shown to be innovative in the adoption of new technologies (Jaskyte & Dressler, 2005), there may be barriers in both the resources and the skills required to engage with these technologies. In this article, we ask the following: Is Twitter being used effectively by small nonprofits, or is it just the preserve of large, well-resourced organizations?
With debate over the role of size in the adoption of technology unsettled, and very little evidence directly relevant to social media, we take a random sample of 160 U.K. charities, stratified across a broad range of incomes, and show that there is a significant size effect on both the breadth and depth of usage, with larger organizations predominating. We analyzed data drawn from Twitter by examining usage metrics, network mapping, and network modeling. Twitter usage metrics answer the first, and most basic, question of this research: Are charities of different sizes using Twitter differently? The network mapping and networking metrics help answer a more direct question: Are U.K. charities linked to each other on Twitter and to what extent does organizational size mediate these links? Finally, exponential random graph modeling (ERGM) answers the most complex question: What is the structure of the charities’ Twitter networks and to what extent does organizational size affect and contribute to explaining these structures?
Our article contributes to the literature by providing an international comparison in the way that Twitter is used by nonprofit organizations, showing that there is a significant size gradient in both the scale and quality of social media use. This suggests that the barriers to its use are not significantly lower for smaller organizations as had been suggested. We argue that while the barrier to entry in creating a social media presence might be low, the effort and resources required to maintain and operate it effectively are more significant.
Literature
Much of the existing work on nonprofit use of social media is drawn from communication literature. Unrelated to charities, several papers have investigated social media sites as platforms for organizing protests and large social movements, as they are easily accessible and difficult for governments to suppress (Bastos et al., 2015). Auger (2013) argued that for nonprofits, this democratic function of social media manifests as advocacy. Li et al. (2018) argued that this advocacy function of nonprofits not only involves direct promotion of their cause on social media but also mobilizes their followers and engages with other organizations to amplify their message. Studies from other fields have argued that social media is important for fundraising activities (Hou & Lampe, 2015; Hu & Shi, 2017), but it is clearly also imperative in helping nonprofits advocate for change, which is a key part of their democratic function in society (Auger, 2013; Sun & Asencio, 2018). Engaging with social media is clearly an important activity for modern nonprofits. A strongly positive size effect could mean that smaller nonprofits are missing out on participating in a form of communication which is increasingly important in the sector and wider society.
The Use of Social Media by Nonprofits
The research literature studying nonprofit use of social media is currently in its second distinct phase of development. The first phase comprised research which was primarily interested in determining levels of adoption of social media, simply owning a social media account or not (Campbell et al., 2014). Several authors reacted to this first phase by stressing the importance of understanding how charitable organizations were using social media rather than simply owning an account (Guo & Saxton, 2014; Jung & Valero, 2016; Lai et al., 2017). This led to studies employing content analysis methods to ascertain deeper understanding of interaction and use. For example Gálvez-Rodríguez et al. (2016) found that charities were engaging in more two-way conversations than expected; previous research, such as the paper by Waters and Jamal (2011), has suggested the platform is mostly used for broadcasting information rather than conversation. Guo and Saxton (2014) carried out a content analysis specifically on nonprofit advocacy organizations and concluded that they send different types of tweets to affect different outcomes; some tweets aim at providing information, some at building a community, and others at calling that community to action. These content analyses have provided a crucial piece of the puzzle for understanding nonprofit use of Twitter, but Jung and Valero (2016) noted that social network analysis (SNA) methods had been largely neglected within this literature. SNA is a complementary method to content analysis which focuses on measuring the interaction between actors quantitatively. This leads to insights into network structure and broad patterns among actors where content analysis focuses on contextualizing the information which is actually exchanged in the network. With authors such as Xu and Saxton (2019) and Lai et al. (2017) beginning to publish papers employing SNA methods to examine nonprofit social media use, we argue that this is the next methodological shift in the literature and this is where our research seeks to contribute.
The Influence of Organization Size on Technology Adoption
Previous studies on voluntary sector adoption of information technology have failed to come to a consensus on the effect of organizational size and budget. Several older papers, notably Corder (2001) and Finn et al. (2006), argued that smaller organizations can be more agile in adopting new information technologies. Corder (2001) suggests that this may be due the tendency for smaller charities to adopt technology incrementally rather than making fewer large investments. However, early work on nonprofit IT investments showed that budget size was a significant predictor for the adoption of technology (Hackler & Saxton, 2007). Building on this, Zorn et al. (2011) carried out a survey and analysis which found that larger budgets were strongly associated with website adoption. These findings epitomize the more typical view, that larger and wealthier organizations are likely to have a greater capacity to adopt new technologies. There seem to be competing influences of organizational size on technology adoption: Large nonprofits have greater resources to invest, whereas smaller organizations have the agility to experiment and adapt new technologies.
The Influence of Organization Size on Social Media Use
Social media could be different from previous technologies, such as websites, because the costs and skill requirements are relatively low. This may level the playing field for all sizes of charity or could even see smaller more agile organizations take the lead. Supporting this theory, Nah and Saxton (2013) found no effect of organization size on social media use in a study of the 150 largest charitable organizations in the United States. Social media, therefore, has the potential to be a democratizing technology, facilitating the participation of even small groups in discussion and debate. However, there may still be significant barriers to small nonprofits in making effective use of even these low-cost technologies, and this would have implications for the support and strategy that is likely to be needed by smaller nonprofits participating in an increasingly digital society.
Random sampling brings general benefits in terms of increased generalizability and hypothesis testing, but Nah and Saxton (2013) called for it specifically to address the underrepresentation of small- and medium-sized organizations which is an obvious result of using top-100-style sampling. They made this recommendation after finding no effect of size in their paper, but noted their targeted sample. Their findings were later reiterated by Guo and Saxton (2014), with similar caution, but then further corroborated by Svensson et al. (2015) and Gálvez-Rodríguez et al. (2016). The Svensson study used a nonrandom sample of organizations who were nominated for a community award. Similarly to Nah and Saxton (2013), this paper found no significant size effect and argued that Twitter may “level the playing field” for smaller charities (Svensson et al., 2015: 1101). The latter study obtained its sample by selecting charities with the most popular websites, resulting in a sample of 60 large charities. This study found a significant but negative effect for organizational size and Twitter use, suggesting smaller organizations are making more use of Twitter and going on to argue that smaller charities are “most aware” of the advantages of social media (Gálvez-Rodríguez et al., 2016: 1066). Both these studies referred back to Nah and Saxton (2013) or Guo and Saxton (2014) when discussing their insignificant or negative findings for charity size, but neither acknowledge how their samples might affect these findings as the Saxton papers were careful to stress (2014; 2013). A nonexistent or negative size effect would also fit with a hypothesis found in several papers which suggests that the low cost of social media has provided an opportunity for smaller organizations in terms of their use of Twitter (Guo & Saxton, 2018; Jung & Valero, 2016; Zhou & Pan, 2016). However, with no study to date utilizing both SNA methods and a random sample, this hypothesis is unconfirmed and Guo and Saxton (2014) and Nah and Saxton’s (2013) call for more robust research into the effect of size has so far gone unanswered.
Nonprofit-to-Nonprofit Interactions on Social Media
Alongside this shift in focus, there are two other trends in the current literature from which our research deviates. First, most of the current literature concerns how charities use social media to interact with their publics or other stakeholders (Guo & Saxton, 2018; Lai et al., 2017; Lovejoy et al., 2012). There is less research which focuses specifically on charity-to-charity interactions on social media: One such paper by Jung and Valero (2016) studied how a preexisting network of organizations interacted with each other and external stakeholders on a Facebook page. Although tangentially related to our article in terms of the first trend, Jung and Valero’s (2016) research used a sampling strategy characteristic of the second trend in the existing literature. In the second trend, articles in the extant literature tend to either sample from a list of large organizations such as the “NonProfit Times 100” (Gálvez-Rodríguez et al., 2016; Lovejoy et al., 2012; Nah & Saxton, 2013; Quinton & Fennemore, 2013) or focus on a particular subsection of the third sector with existing networks or groups of organizations such as advocacy (Guo & Saxton, 2014), disaster relief (Lai et al., 2017), or homelessness (Jung and Valero, 2016). Although Nah and Saxton (2013) called for future work to utilize random sampling strategies, this has largely not manifested.
Method
We use a random sample of nonprofits to answer the following research questions:
Sampling and Data Collection
Our data are drawn from a random sample of U.K. charities. Nah and Saxton (2013) noted the opportunities of random sampling for charity social media research over 5 years ago, and this allows our results to be generalizable to the population of charities. Our sample was stratified by size, measured by income. We chose income as a measure of size because it is complete and robust in the data set we use. Other measures such as staff numbers or volunteers are often missing in our data set because the question used to collect them was optional and only answered by a small number of respondents. As part of our robustness checking, we also use a measure of total assets as an alternative proxy for size, the analysis of which can be found in the corresponding author’s GitHub (https://github.com/tomwallace1990/Big_bird).
Our sampling frame was a data set collected by Alcock and Mohan (2017) which contains 8,495 unique organizations in the period we chose to sample (2012–2013, which is a single period in the data). The original data were collected by randomly sampling from administrative regulatory records within income bands. The vast majority of larger organizations were included, whereas a lesser proportions of smaller organizations were collected. These data were sampled from the entire population of charities in England and Wales. We coded the charities in these data into one of the four annual income strata for sampling, defined by the National Council for Voluntary Organisations (NCVO): small (£10,000–£99,999), medium (£100,000–£999,999), large (£1,000,000–£9,999,999), and major (£10,000,000 and over; NCVO, 2014). The smallest of these strata in the Alcock and Mohan data contained 799 organizations, the other three exceeded 1000. The data contained no organizations with an income of less than £10,000, and so these organizations are not included in this study. We provide an analysis using linear income to robustness check our size groupings, which can be found on the GitHub.
Several organizations which are not conventionally considered to be part of the voluntary sector but which do have charitable status in law were excluded from the sampling frame. These are charities which are not registered with The Charity Commission (2015) because they are regulated by another body and include churches, universities, and private schools. As not every charity sampled had a Twitter handle, the sample was overdrawn using a random number generator to ensure 40 handles could be collected from each size group. Handle collection was performed with the organizations’ full names, as listed in the data, manually through a Google web search which proved more reliable than Twitter’s search. If there was any doubt, the result was cross-checked on the charity’s website to ensure the final list of 160 handles was accurate. No organization in the sample had more than one handle. The size of our sample was determined, primarily, by how many Twitter handles could feasibly be collected by hand. We wanted to ensure a high level of accuracy in the handle collection process and had to balance this requirement against attaining a larger sample.
Follower links and metrics for each handle were collected in October 2017 with software NodeXL which interfaces with the Twitter application programming interface (API). The data consist of the 160 charities, which are known as nodes and the follower/following links between them, known as ties (Knoke & Yang, 2008). The data collected are nonsymmetrical; it is possible to follow someone on Twitter without them following you back. The ties are binary and nonduplicated as it is only possible to follow an account or be followed by an account once. An anonymised version of these data, along with analysis code files and further technical details on how the analysis was carried out, are available on the GitHub.
Methods of Analysis
Handle ownership and Twitter usage metrics
The rate of handle ownership is calculated by counting how many charities had to be randomly sampled for each group to obtain the target sample size of 40 with valid Twitter handles; the more the charities which had to be sampled, the lower the rate of ownership by a size group. For example, 88 medium charities had to be sampled for 40 of them to be collected with a valid Twitter handle, giving that group an ownership rate of 45%. Reviewing usage metrics involves comparing numbers of followers, following, tweets, and length of time on Twitter for the four size groups. This is similar to the “communication tools” which Guo and Saxton (2014) used to set the context for their paper. Handle ownership, and subsequently network connectedness, is assessed with Goodman and Kruskal’s gamma which is appropriate as the size groupings are ranked (Sirkin, 2005).
Network connectedness, mapping, and group connections
We utilize network mapping to visualize the differences between the size groups. Sociograms show each organization as a disk and links between them as arrow-headed lines. These network maps are laid out in accordance with an algorithm, and this article makes exclusive use of the Harel-Koren fast multiscale method which is good at identifying clusters (Harel & Koren, 2000). Group connections are presented in a table which disaggregates the connections between the groups by showing where tweets sent by each group were received.
Network modeling
Modeling of networks, or network metrics, with conventional methods would violate the assumption of independence of observations (Berry, 1993). Dealing with this issue involves the use of exponential random graph modeling (ERGMs) which are a class of models designed to model networks through the use of Markov chain Monte Carlo maximum likelihood estimation (MCMCMLE). This class of model generates random networks with the same number of nodes and density as the observed network and from this determines the probability of drawing the characteristics of the observed network; effectively it determines how significantly different from random specified features of the observed network are (Robins et al., 2007). Despite having been in active use for more than 10 years, ERGM is still a niche method with only a handful of applications to charity data. Atouba and Shumate (2015) used the method to study the role of homophily in international nongovernmental organization (NGO) networking. More recently, Shumate and several colleagues used it to study business-to-nonprofit partnerships (Shumate et al., 2018). Both these studies used networks drawn from traditional data sources, but there has been a trend toward applying ERGM to online sources of networking information. Shields (2016) and Lai et al. (2017) analyzed Twitter networking data with ERGM to study universities and disaster relief NGOs, respectively. We use software PNet to estimate these models (Wang et al., 2009). For an introduction to ERGM in PNet, see Shumate and Palazzolo (2010).
Results
Twitter Usage Metrics
Handle ownership
The overall rate of Twitter handle ownership was 46%. This is disaggregated into the four size groups in Table 1.
Handle Ownership and Median Time on Twitter.
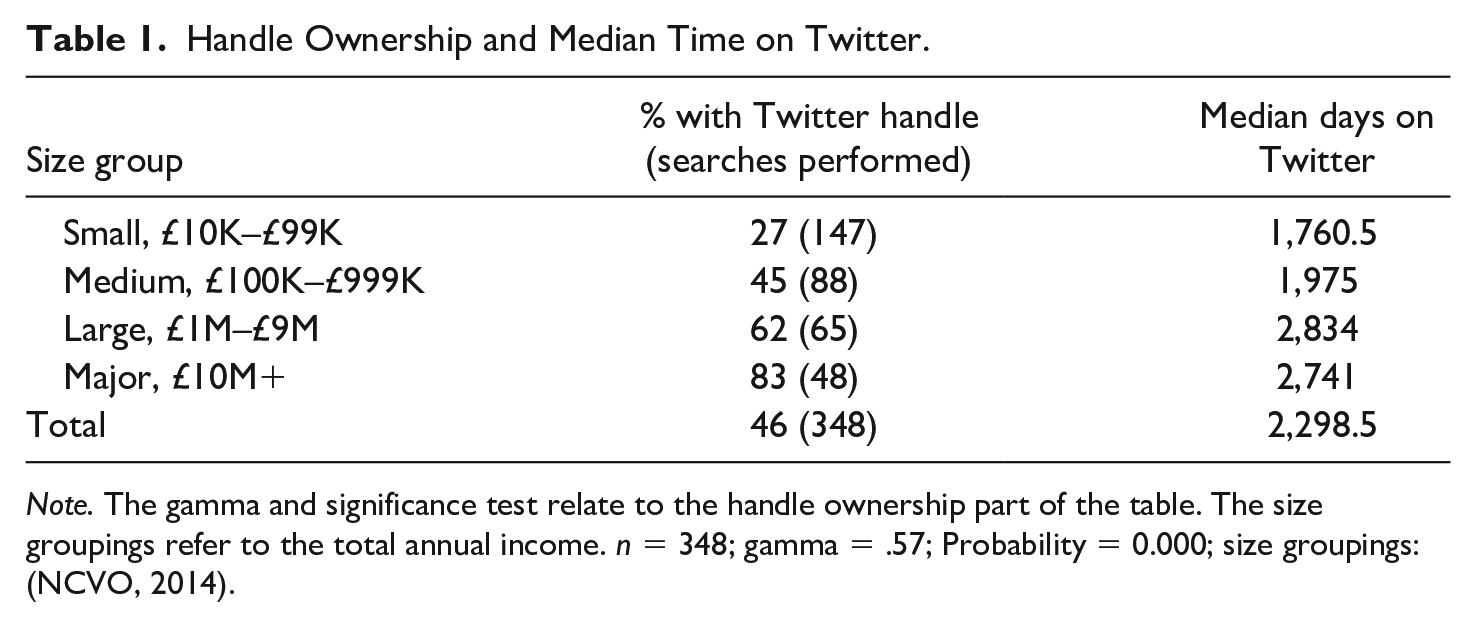
Note. The gamma and significance test relate to the handle ownership part of the table. The size groupings refer to the total annual income. n = 348; gamma = .57; Probability = 0.000; size groupings: (NCVO, 2014).
There is a strong, and statistically significant, relationship (γ = .57, p < .01) between charity size and having an organizational Twitter account. Larger charities are much more likely to own a handle; the result for major charities (with income >£10M) is similar to the 80% reported by Guo and Saxton (2014) who sampled larger charities. Table 1 also shows the median number of days each of the groups has been using the platform for; generally larger organizations have been using Twitter longer.
Usage metrics
Handle ownership does not consider differences in the actual usage of Twitter such as the number of followers, following, and tweets each account has. The median of each of these usage metrics is displayed for each group in Graph 1. Medians are used to control the highly skewed distributions of these metrics.
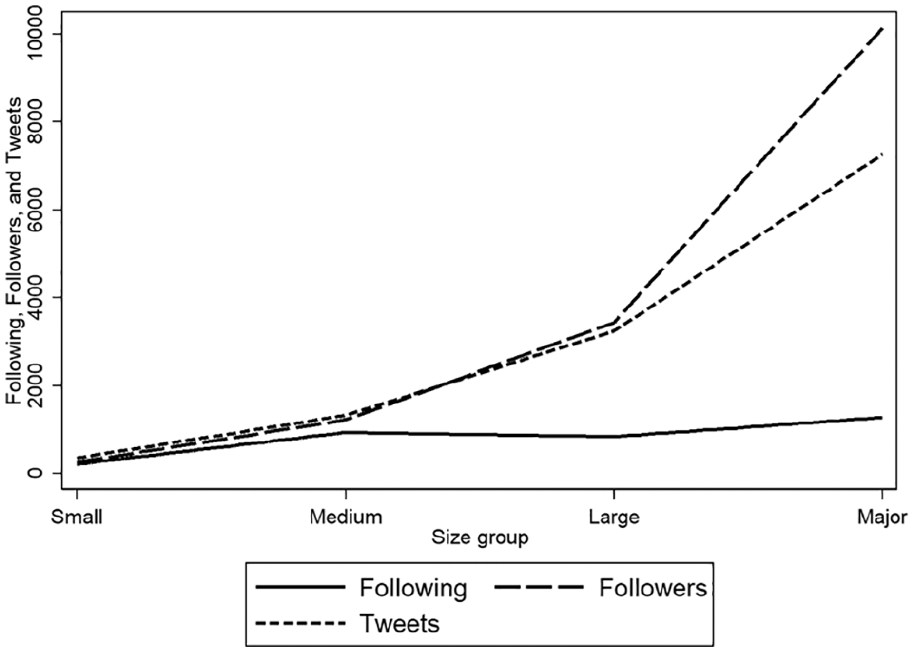
Median Twitter use metrics.
Network sociogram.
Followers, which reflects popularity, is the most striking result from this graph with each size group having an exponentially increasing followers count. Major organizations, therefore, are the most followed accounts, and despite some uncertainty around the point estimates shown on the graph, there is still a clear size effect. The total number of tweets scaled similarly to followers, while the results for following are less dramatic. Overall, these descriptive metrics suggest that certain aspects of Twitter use, notably followers and the number of tweets, are heavily determined by charity size.
Network Mapping and Metrics
Network connectedness
One hundred one of our 160 charities are connected to each other on Twitter via following. The 59 absent organizations have a Twitter account but are not following or being followed by any of the other charities in the sample. Being in the absent group is heavily determined by size as shown in Table 2 below.
Network Connectedness.
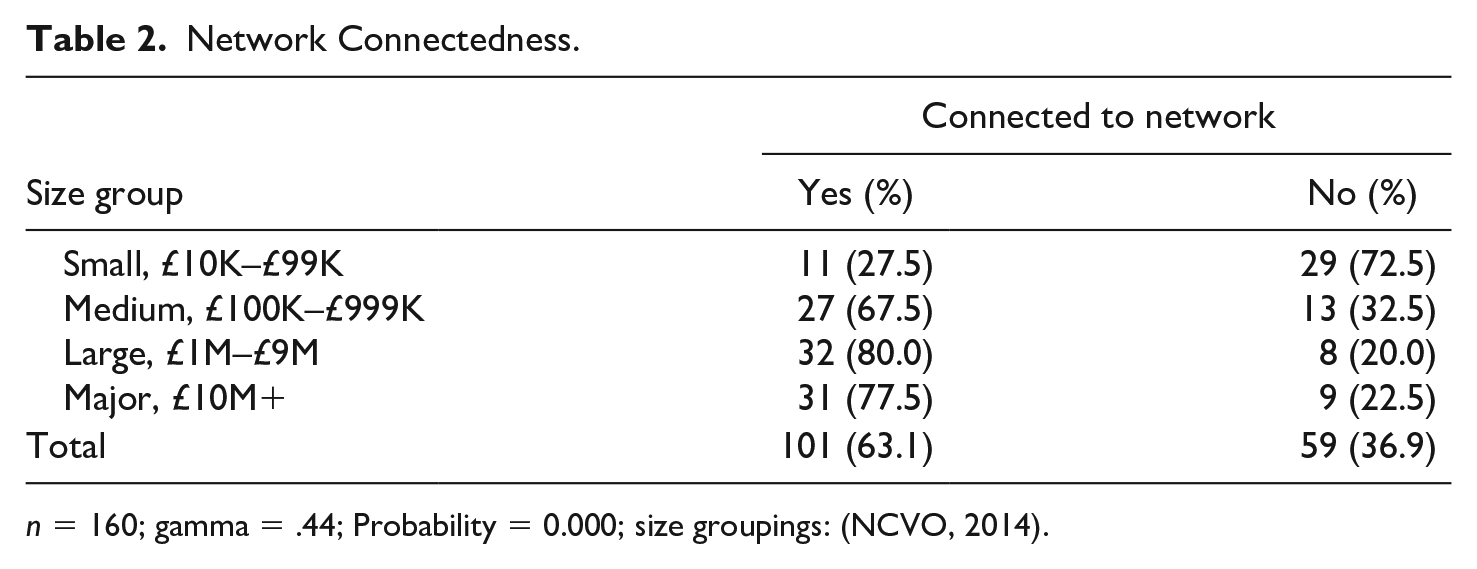
n = 160; gamma = .44; Probability = 0.000; size groupings: (NCVO, 2014).
Group Connections.
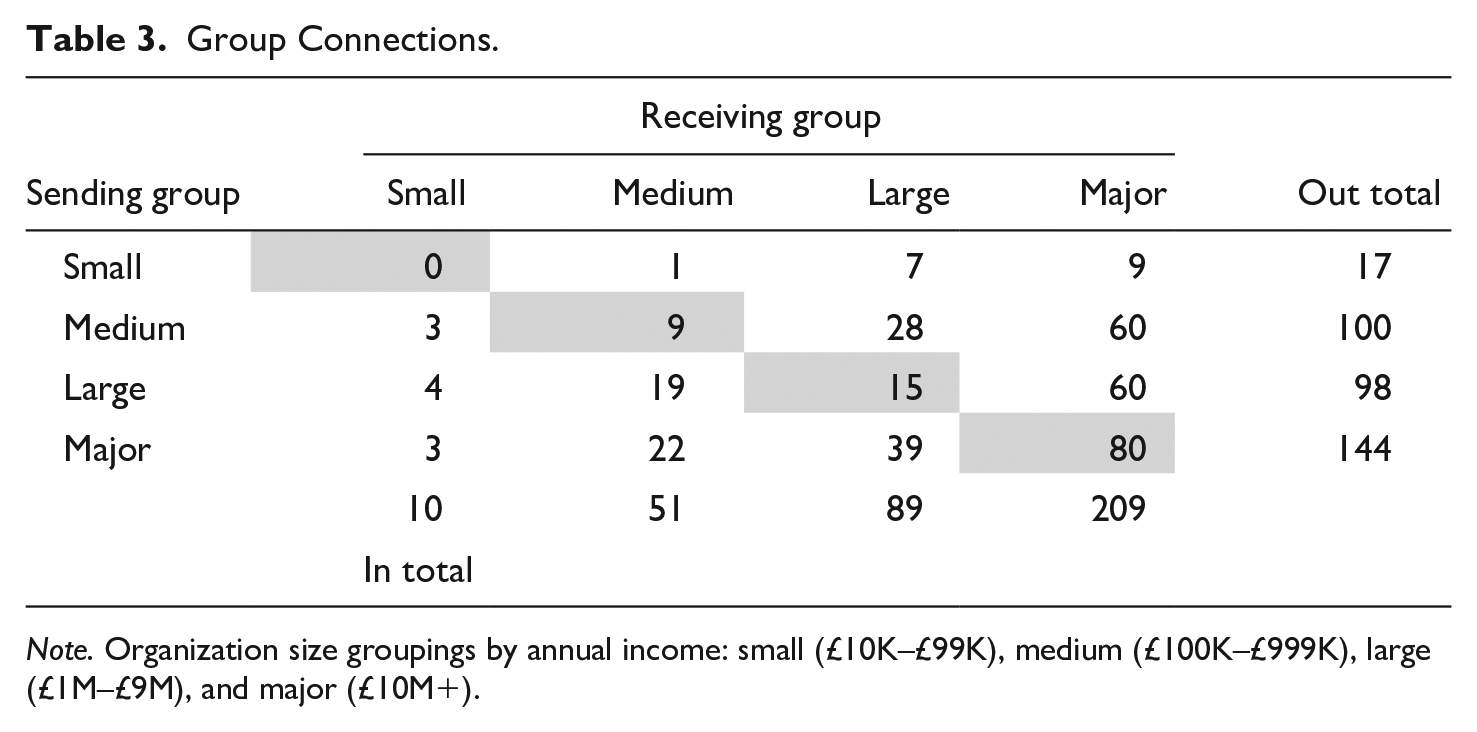
Note. Organization size groupings by annual income: small (£10K–£99K), medium (£100K–£999K), large (£1M–£9M), and major (£10M+).
Clearly small charities are the notable outliers, and this group is largely responsible for the strong and significant Goodman and Kruskal’s gamma (γ = .44, p < .01) reported for the association between being connected and group. For all the other groups, if they have an account, they have a greater than 50% chance of being connected to our randomly sampled network.
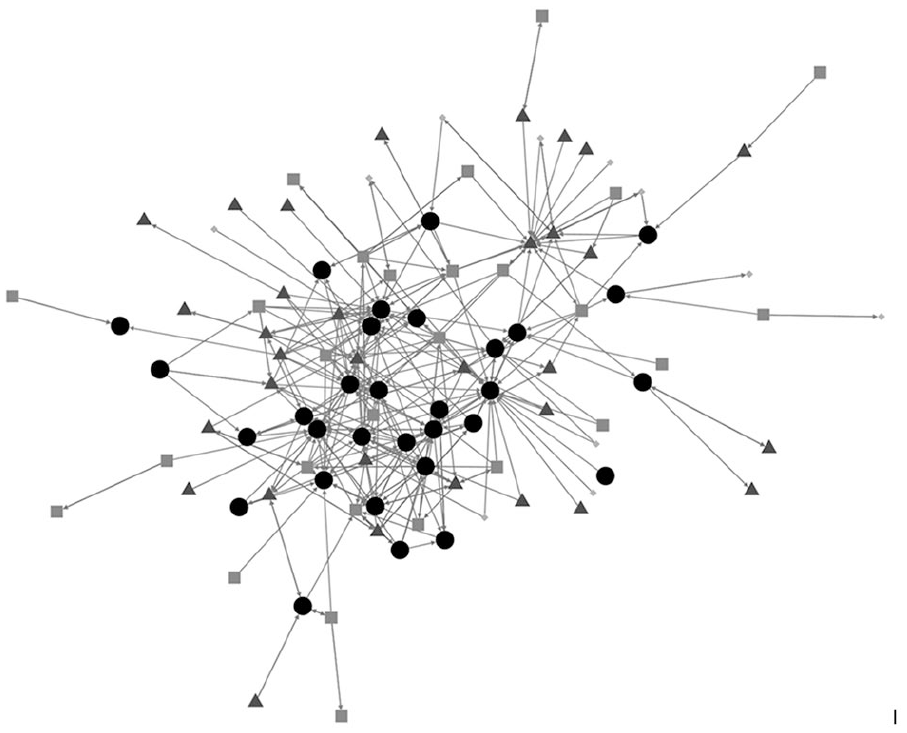
Network mapping
Network mapping involves the generation of sociograms which are visual representations of the observed network as shown in Graph 2 below.
The network has a clearly visible core and outer cloud. Among the nodes which are connected, there are 359 ties giving the network a density of 0.03. There is only a single connected component in the network, and all the 59 charities not present were isolates and not connected to one another.
With reference to the groups, there are clearly a large number of major charities (black disks) in the core of the network and small charities (light gray diamonds) lay exclusively in the outer cloud. The distinction between large (dark gray triangles) and medium (medium gray squares) sized charities is less clear.
Group connections
The group connections shown in table 3 above track how following behavior varies by group. All the size groupings tend to connect to larger charities over smaller ones, particularly to the major charities. This is likely an attempt by smaller organizations to access the networks and many followers of the major organization, and this would suggest that popularity is the dominant feature of the charities’ Twitter network. Activity also seems to be a feature, with major organizations sending out the most ties and small charities by far the least.
Network Modeling
ERGM, as discussed in the methodology, is a form of modeling which allows for the features of the network to be assessed in terms of how different they are from random. The first model presented in this section is a basic model not including any exogenous covariates. The other two models both include a measure of charity size: one, the log of income, and the other, categorical size groupings. We use the log of income to control for its skew.
ERGM Models.
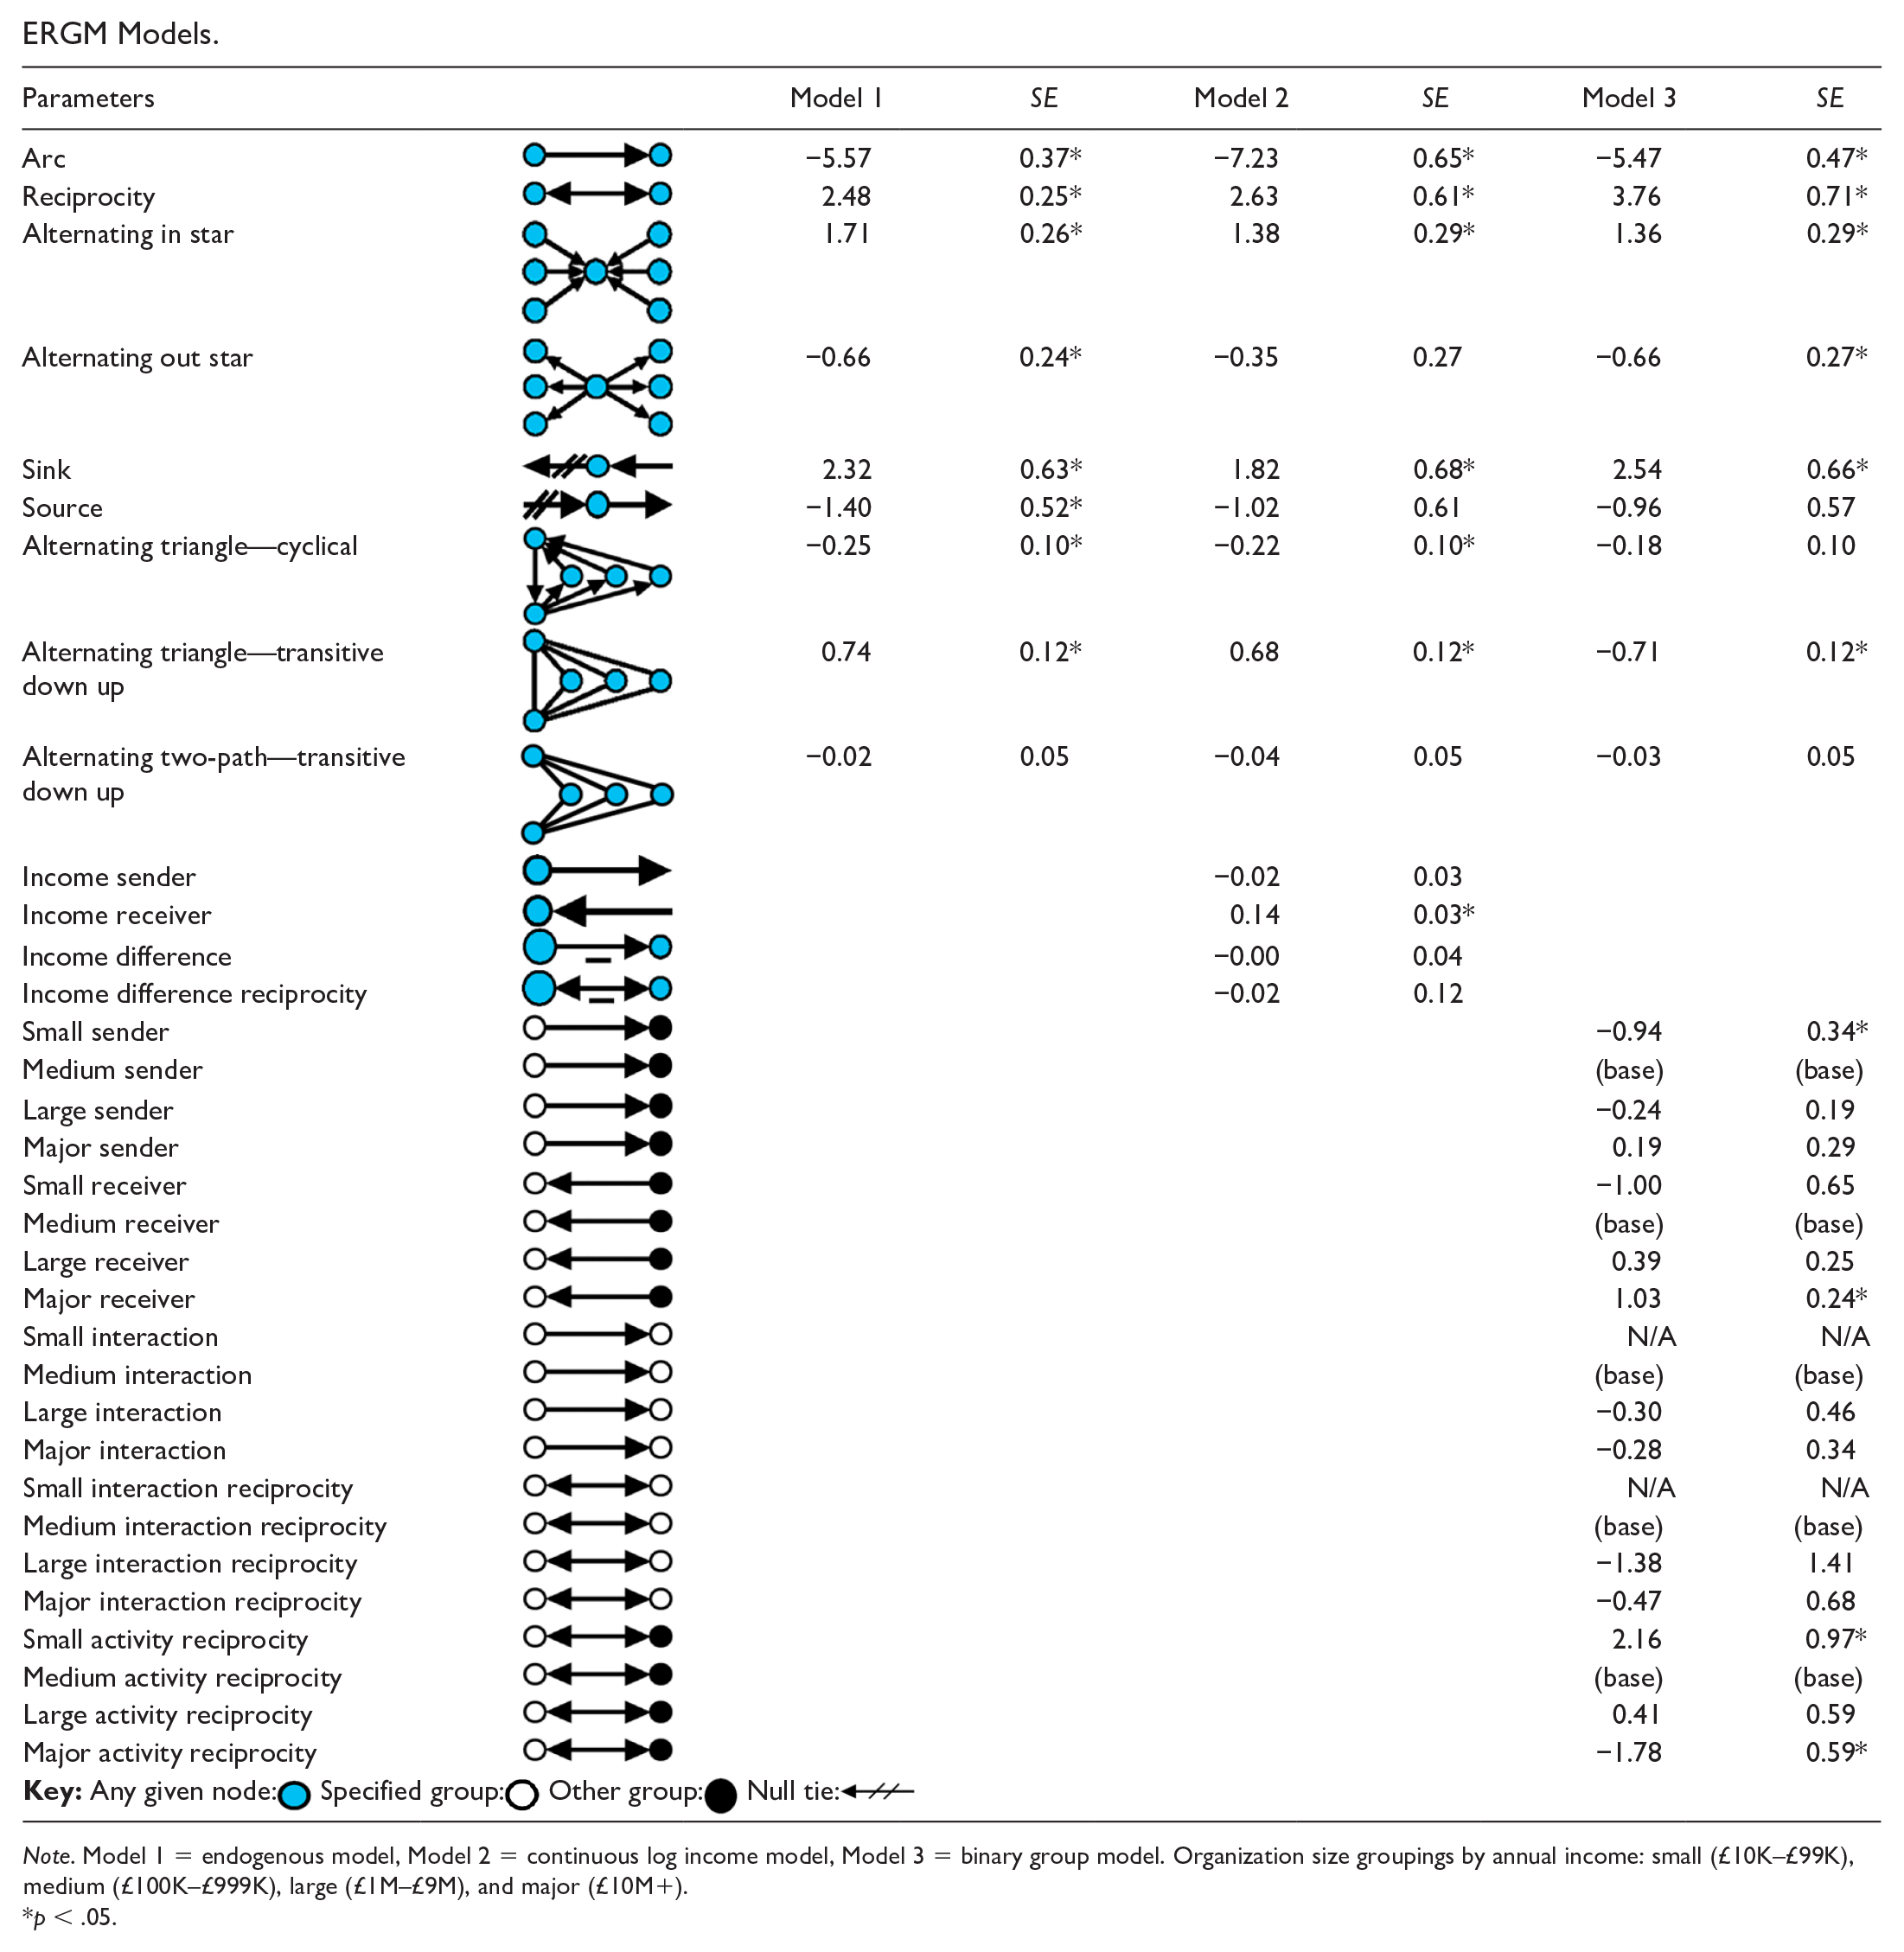
Note. Model 1 = endogenous model, Model 2 = continuous log income model, Model 3 = binary group model. Organization size groupings by annual income: small (£10K–£99K), medium (£100K–£999K), large (£1M–£9M), and major (£10M+).
p < .05.
Endogenous model
The first meaningful result, reciprocity, refers to pairs of nodes who follow each other, forming a tighter bond than having a one-way tie. In this model, reciprocity is strongly positive and significant, suggesting that there is a higher chance of a tie forming if another tie already exists in the opposing direction; there are more reciprocal ties in the network that we would expect given the density.
The next two results are alternating star effects, in and out; they track highly popular and highly active nodes, respectively (Robins et al., 2009). Here, both effects are significant with the in star being strongly positive and the out star being moderately negative. These are supported by the next two results: sink and source, which are more extreme versions of the star effects. These results together suggest that popularity and inactivity, negative activity, are both important factors in this network. The result for sink suggests that this popularity effect is so strong that there are nodes which receive ties in while sending none out. In this case, it seems plausible that the sinks are major charities which receive many ties on the basis of their brand recognition and large audiences. This is the same effect observed in the intergroup connections table. The inactivity effect may be caused by smaller charities that tend to be less active or it could be the popular large charities who receive in ties but are inactive in terms of sending; none of these results are conclusive without controlling for size, as in the forthcoming models.
The next two effects are triadic variables, measuring triangles in the network. The combined results from these effects suggest a small amount of hierarchical clustering, which is the norm for most social networks (Lusher & Robins, 2013). The final two-path effect measures unclosed triads which can have several implications, but in this case, it is insignificant. To summarize this model overall, popularity is the key effect with reciprocity also being influential.
Continuous size model
This model uses the log of income as a continuous exogenous covariate. This is a general size effect. The intention is not only to measure the net impact which the model predicts charity size has on connections within the network—a key outcome of this research—but the extent to which size “scrubs out” internal effects can reveal more about the true effect of size (Robins & Daraganova, 2013).
The continuous size effect is included as four separate variables in the model. The first two effects are sender and receiver which are the contribution of size to activity and popularity. The third is difference, which is positive if one-way ties tend to form between organizations of different sizes (heterophily) and negative if the alternative is true (homophily). The final effect is the same as difference but for reciprocal ties.
Examining the four exogenous effects first, only one of them is significant, receiver, which suggests that larger charities (those with a higher income) tend to receive more ties; they are more popular to follow than smaller charities. While the other covariate effects are insignificant, they still act as controls and more insights can be gained from assessing the impact they have on the endogenous effects, compared with Model 1. The in star, out star, sink, and source effects all decrease in magnitude when size is controlled for. Size, therefore, explains a moderate amount of the popularity and activity observed in the network. We hypothesize that it is major charities’ recognizable brands and large audiences which explain the popularity size effect, whereas underresourced small charities explain the low activity effect, counter to what some have suggested in the past (Guo & Saxton, 2018; Jung & Valero, 2016; Zhou & Pan, 2016). These hypotheses are tested in the final model.
Binary group model
Model 3 concentrates on examining which size groups account for the effects observed in Model 2. With the categorical size groups included as binary dummy exogenous covariates, five endogenous variables were specified for each. Like the continuous external covariate, the first two effects for each group are sender and receiver—simply estimating the activity and popularity effect of each group versus the medium group, which is the reference category. Small charities have a sizably negative result for sender which suggests low activity. For receiver, only major charities shave a significant result which is positive, suggesting that major charities are more popular than their smaller counterparts.
None of the interaction effects, one-way or reciprocal, are significant which suggest that none of the groups interact with each other to a greater or lesser extent than the medium group. This is aside from small charities who do not interact with one another at all, which is a finding in itself, and means that an effect could not be specified. The final exogenous covariates, activity reciprocity, measure each group’s general tendency to reciprocate, net of the endogenous reciprocal result. The significant results from these effects are polarized with small charities being strongly positive and major charities strongly negative. This means that, net of all other effects, small charities tend to form more reciprocal ties compared with medium charities, whereas major charities are far less likely to be part of two-way ties. Given small charities tend to have less ties, this suggests that they value their ties more than major charities who do not follow back all the charities following them, resulting in a comparably lower level of reciprocity.
To conclude, this model expands on Model 2 by exploring the effect of size in more depth and highlighting the discontinuities in the continuous variable; for example, the negative activity effect is caused by small charities. Popularity was less discontinuous but still only had one significant result, with major charities being notably more popular than any of the other groups. The group’s reciprocal effects were highly polarized, with both small and major charities returning, overall, significant reciprocities, but small organizations being far more likely to form reciprocal pairings.
Goodness of fit
PNet estimates goodness of fit with a convergence statistic for each effect in the estimation output. It can also be performed postestimation which is based on a larger number of iterations and is more accurate.
Goodness of Fit for ERGM Models.
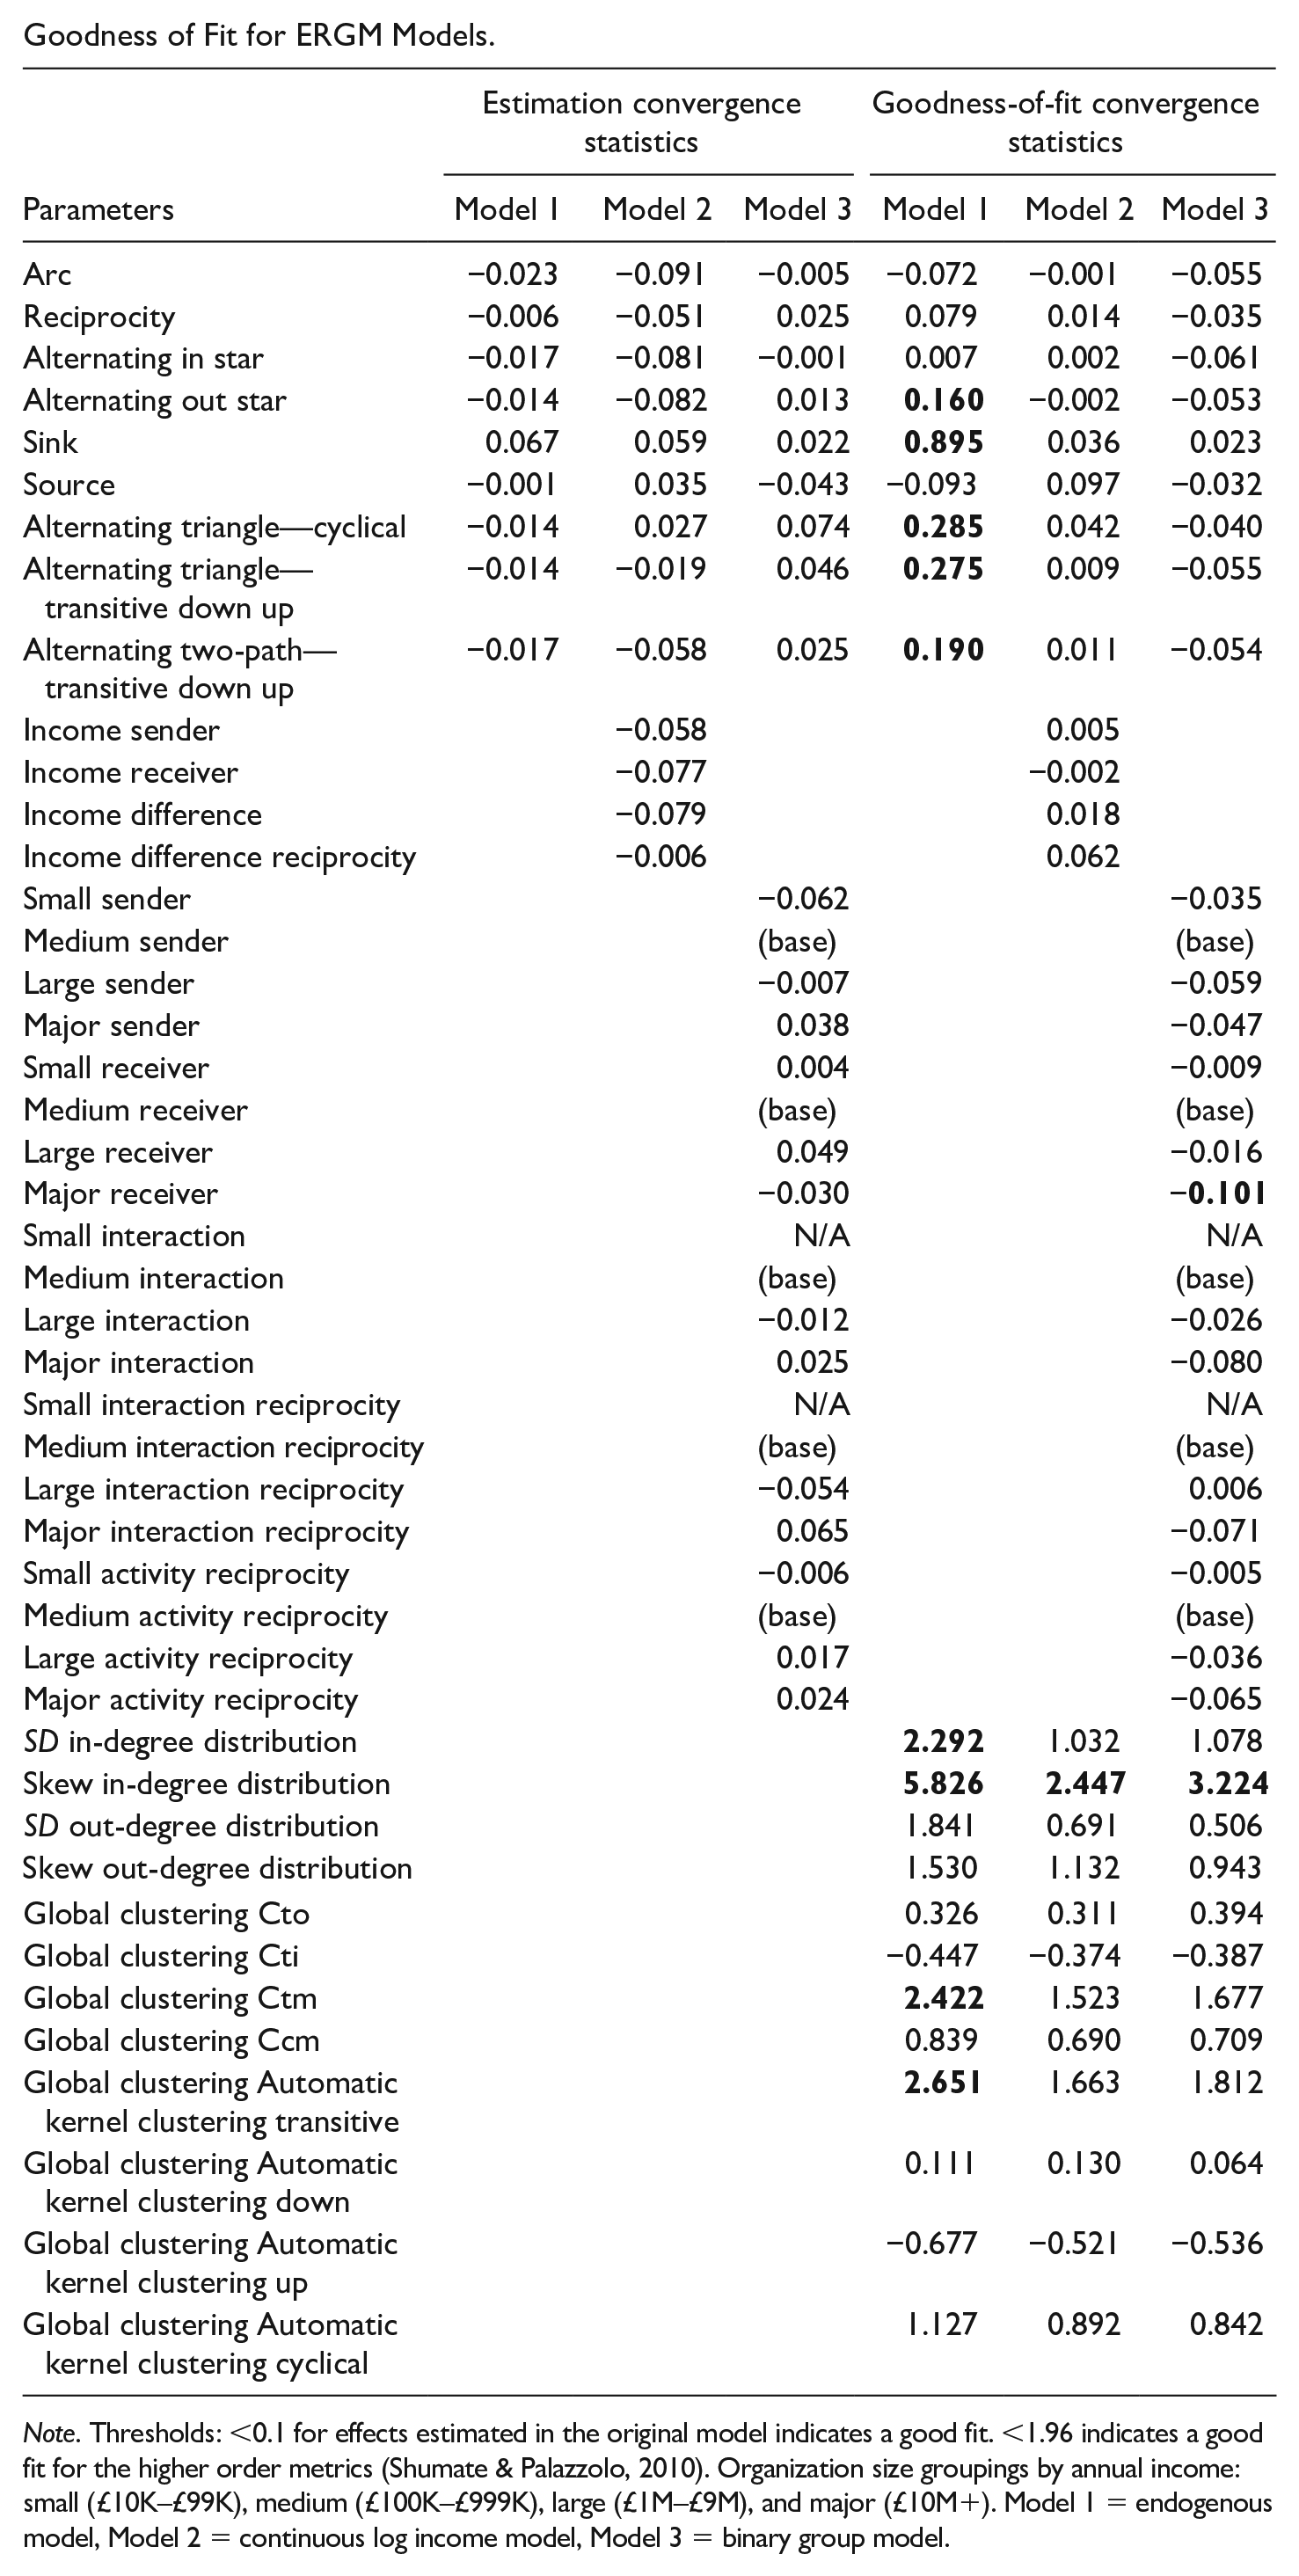
Note. Thresholds: <0.1 for effects estimated in the original model indicates a good fit. <1.96 indicates a good fit for the higher order metrics (Shumate & Palazzolo, 2010). Organization size groupings by annual income: small (£10K–£99K), medium (£100K–£999K), large (£1M–£9M), and major (£10M+). Model 1 = endogenous model, Model 2 = continuous log income model, Model 3 = binary group model.
Acceptable convergence is indicated by a statistic below 0.1 for the model parameters and below 1.96 for the higher order metrics. Poorly fit results are highlighted in bold. We note that all our models achieved good convergence on initial estimation. Post hoc, Model 1 has poor fit of several parameters. These issues are resolved in Models 2 and 3 which indicates that the network needs to have a control for organizational size to achieve proper fitment. Models 2 and 3 were generally well fit in terms of higher order statistics, apart from for the skew of the in-degree distribution which no model adequately fit. More detailed goodness-of-fit tables are available on the author’s GitHub.
Discussion and Conclusion
When Guo and Saxton (2014) proposed that the effect of size on charity social media use warranted further investigation, they invoked Nah and Saxton (2013) who found no size effect in a study of the 150 largest charitable organizations in the United States. Nah and Saxton suggested that social media might be different to previous technologies in terms of higher levels of usage by smaller organizations due to low cost and accessibility. This would also integrate with previous studies which argued smaller organizations tend to be more reactive and agile in adopting new information technologies (Corder, 2001). The results from our research are strongly counter to that hypothesis; while 62% of large and 83% of major organizations we sampled had Twitter accounts, this was only true for 27% of small charities. Even with this difference controlled for, Twitter usage metrics were heavily stratified by size with larger organizations tending to make more use of the platform and be more popular.
Turning to the more innovative SNA presented here, two thirds of the charities in our sample were connected on Twitter, but this was, again, substantially stratified by size with smaller charities much less likely to be part of the network. Even for those connected to the network, small charities tended to be in the peripheries with larger organizations making up the core. The group connections table further explored how the groups in the network interact with each other and found that there was a strong tendency for all charities to follow larger organizations.
Network modeling allowed for an even more detailed investigation of the structures and size effects in the network. The endogenous ERGM established that the most pertinent effects in the charities’ Twitter network were popularity and reciprocity, though this model had fitment issues. Further modeling found that the size of a charity, measured by the log of income, had a significant positive effect on its popularity in the network and accounted for a notable part of the endogenous popularity effect. Size also explained part of the activity effect, with smaller charities being notably less active. The final model revealed precisely which groups were behind these effects. Major charities were found to be overwhelmingly more popular than the other groups, potentially due to their brands and large follower counts which smaller organizations desire access to. This effect also did not appear discontinuous; high standard errors rather than low effect sizes seemed to inhibit significance for the other groups, and we cautiously conclude that size does not just affect the major group, though this warrants further investigation. Small charities suffered from notable inactivity, and this effect was clearly discontinuous with the other groups all having very similar levels of activity to each other. We hypothesize that this is due to limited resources constraining the time and staff that the smallest charities have to dedicate to social media as noted by Nah and Saxton (2013) and later Xu and Saxton (2019), but counter to hypotheses in several other papers (Guo & Saxton, 2018; Jung & Valero, 2016; Zhou & Pan, 2016).
We now reflect on the puzzle posed by the literature on organizational size and technology use. Is effective social media use the domain of small agile nonprofits, or is it dominated by large organizations with budgets to invest? Our study suggests that even apparently low-cost technologies can provide significant barriers to entry for small- and medium-sized charities. While creating a Twitter account does not require a big budget, its use is dominated by larger organizations. When considering the reach and characteristics of the charities’ Twitter networks, larger organizations were far more effective in growing and maintaining their online network. We did not find evidence that “free” technologies such as social media served as an equalizer; indeed, despite their seeming low barrier to entry in practice the effective use of the technology has more in common with other IT investments. This would suggest limits to the potential of a seemingly open, democratic space such as Twitter to effectively allow the engagement of marginalized voices.
Limitations and Opportunities
We next consider some limitations of our work and opportunities to extend this research. Due to limitations in our chosen data set, we were unable to use staff numbers as a proxy for size alongside income and instead used assets to robustness check our results. The number of nodes included in this research, 160, proved limiting in some instances. Future research should consider automated forms of handle collection if the error rate can be made acceptable. Our stratified sample could also, potentially, lead to an underestimation of the connectedness of smaller charities, as our equally stratified sample does not account for the unequal proportions of charities of different sizes in the full population. We chose this approach, rather than a proportional sample, to more easily identify differences between the groups, but future work should consider contrasting stratified sampling with a truly random approach which preserves the proportions of differently sized organizations found in the population. It was also not possible to make inferences about the overall network structure from our sampled network. The modeling could also benefit from additional covariates beyond size, but as size was our focus, this represents a future opportunity rather than a limitation, perhaps building further on the work of Nah and Saxton (2013). Finally, additional network modeling methods, such as relational event modeling (REM), could prove rewarding for analyzing this sort of social media data, particularly as REMs could determine the order of events such as reciprocal ties forming (Butts, 2008).
Practical Implications
Reflecting on what implications our results might have for charities who use Twitter, particularly smaller charities who may be struggling, we do have some advice: Reciprocity is a powerful force in the network, and although major organizations are less likely to form reciprocal pairs than smaller ones, the chances are still substantially higher than random chance. Connecting to larger organizations and interacting with them in more direct ways (mentioning them, retweeting them) is likely to increase the chance that they will reciprocate and expose the smaller organization’s tweets to a much wider audience, audience size being an essential part of gaining attention on social media (Guo & Saxton, 2018). This networking behavior should be the focus of small, time-limited, organizations over solely composing their own content as Lovejoy et al. (2012) found was the most dominant strategy among nonprofit organizations. While social media is easily accessible by small organizations, and can be a valuable communication channel, organizations need to acknowledge that effective use of social media still requires significant time and resources to reach a wide audience. Although beyond the bounds of this study, smaller organizations could also use their agility and reactiveness to adopt new platforms early, for example, making use of the current trend for content in the story format.
Overall, we conclude that there are indeed differences by organization size at every stage of Twitter use: owning a handle, making use of the platform, being connected to the network of other charities, and both popularity and activity within that network. This suggests that Twitter is not entirely the democratizing force that it could be, and those whose ideas are backed by significant resources will be better able to share their messages. It is apparent that the big bird, does indeed, get the worm.
Footnotes
Acknowledgements
We would like to thank all those with whom we had fruitful discussions which led directly to this article: Diarmuid McDonnell, John Mohan, David Griffiths, Paul Lambert, Vikki McCall, Mark Tranmer, and the members of the Social Surveys and Social Statistics research group.
Declaration of Conflicting Interests
The author(s) declared no potential conflicts of interest with respect to the research, authorship, and/or publication of this article.
Funding
The author(s) received no financial support for the research, authorship, and/or publication of this article.