
Abstract
Introduction
In the United States, older adults aged 65 years and over are the fastest-growing group of the population (Jarzebski et al., 2021) and it is expected that more than a quarter of Americans will consist of older adults by 2030 (Fulmer et al., 2021; Kaplan & Inguanzo, 2017). With aging, older adults are prone to experiencing significant distress as they undergo life transitions and are continuously exposed to psychosocial stressors (Moore et al., 2020). During this stage of life, older adults experience changes in their health conditions and social life such as retirement, children leaving home, decrease in social role, and deaths of friends and family members (Charles & Carstensen, 2010). Compromised physical functioning limits their active engagement in social activities that were once done easily (Charles & Carstensen, 2010). Furthermore, their social network size, referred to as the size of a network of social interactions or relationships, decreases with aging as older adults exclude less meaningful, and casual acquaintances (Charles & Carstensen, 2010; Yeung et al., 2008). When compared to younger adults, the social patterns of older adults differ significantly and tend to change over time.
Older adults are a heterogeneous group in terms of their age and each age group is presumed to have different social patterns (Jaul & Barron, 2021). These older adults are classified into three groups based on their age: young-old adults aged 65–74 years, old-old adults aged 75–84 years, and oldest-old group aged 85 years and over (Jaul & Barron, 2021; S. B. Lee et al., 2018). Previous studies focused on studying social patterns based on each heterogeneous group of older adults at a single time point (Fiori et al., 2007; Key & Culliney, 2018). For example, young-old adults were engaged in the diverse-supported and friend-focused social networks, whereas oldest-old adults remained in the restricted social networks (Fiori et al., 2007). While it is presumed that social patterns become restricted with aging, cross-sectional studies may provide an inaccurate view of their social pattern changes without following the same group of individuals over time. Thus, little is known about how their social patterns might change over time as they transition into one age group to another age group.
Latent transition analysis (LTA) is a person-centered approach to identify changes in latent classes of individuals over time (Jeon et al., 2019; Kim et al., 2013). As an extension of latent class analysis (LCAs), LTA assumes that the latent class membership is dynamic and individuals transition in their latent class membership over time (Abarda et al., 2020; Bray et al., 2021). A recent study used LTA among older adults to understand transitions in social network types over 2 years among community-dwelling Singaporeans aged 60 years and older (Sung et al., 2022). This study found five social network types of diverse, unmarried and diverse, extended family, immediate family, and restricted (Sung et al., 2022). While this study findings serve as an important first step to understanding different social network types, cultural beliefs and societal roles among Singaporean older adults may be different from older adults in the United States (Sung et al., 2022). In addition, Sung et al. (2022) acknowledged as a limitation that examining transitions in social networks within the 2-year time span may be subtle (Sung et al., 2022). Given the heterogeneity of older adults living in the United States, it is important to understand the changes in social networks from a homogeneous group of older adults (e.g., young-old adults) to another (e.g., old-old adults and oldest-old adults) in a broader time span where transitions may become more evident.
Therefore, the purpose of this study is to identify the types of social networks among young-old adults, and to examine the transitions in social networks as young-old adults become old-old adults over a 10-year time span.
Methods
Design and Data Collection
A secondary data analysis was conducted using the longitudinal data of three available waves from the National Social Life, Health, and Aging Project (NSHAP): Wave I (2005–2006), Wave II (2010–2011), and Wave III (2015–2016).
Description of the Data Set
The NSHAP is a population-based study that aims to understand the overall health and well-being of community-dwelling older adults in the United States. Wave I was conducted in 2005–2006, and 3005 participants aged between 57 and 85 years were enrolled at baseline. Wave II was conducted in 2010–2011 and Wave III were conducted in 2015–2016, where all the surviving participants from previous waves was re-invited for interview. Details of the NSHAP cohort have been previously reported (Lindau et al., 2007).
Participants
A total of 1092 young-old adults aged between 65 years and 74 years at Wave I were included. This subgroup of participants was selected to examine their transitions of social networks as they become old-old adults aged between 75 years and 84 years at Wave III.
Measures
Social Networks
The types of social network variables were selected based on data available from NSHAP as well as previous literature, and dichotomized to facilitate model identification and interpretation which is a common approach used in LCA and LTA (Cheng et al., 2021; Rinne et al., 2017; Sung et al., 2022). The social network variables related to immediate family ties were (1) marital status as married or non-married (married vs. never married, separated, divorced, widowed) and (2) the number of living children (having at least one living children vs. not having any children). The social network variable related to relatives and friends was (3) social frequency in the past year (less than once a month vs. more than once a month). The social network variables related to community were (4) attendance of meetings of organized groups in the past year (less than once a month vs. more than once a month) and (5) attendance of religious services in the past year (less than once a month vs. more than once a month).
Sociodemographic,Lifestyle,Clinical Characteristics
Sociodemographic, lifestyle, and clinical characteristics were obtained from self-report at Wave I using the study designed questionnaire. These characteristics included age, gender, marital status, race/ethnicity, level of education, current employment status, annual household income, number of comorbidities (arthritis, ulcers, emphysema/COPD, asthma, stroke, hypertension, diabetes, dementia, cirrhosis, leukemia, lymphoma, skin cancer, poor kidney function, thyroid), current smoking, current alcohol consumption, level of physical activity, rested sleep, social support, depression, anxiety, and loneliness.
Social support refers to the totality of material and psychological resources that individuals are provided via social relationships (Cohen, 2004). Here, social support was measured using the 6-items in accordance with previous research using NSHAP data set (Lee & Min, 2023). These 6-items include questions on how often older adults (1) rely on spouse/partner, (2) open up to spouse/partner, (3) rely on family, (4) open up to family, (5) rely on friends, and (6) open up to friends. Each item response was graded on a Likert with scoring 0 for “hardly ever or never” and 3 for “often.” The total score ranged from 0 to 18, and a higher score indicates more social support (Santini et al., 2020; Stephens et al., 2011).
Depression was assessed using the 11-item Center for Epidemiological Studies Depression (CESD-11) scale, which has demonstrated a good internal reliability (Cronbach’s alpha = .80) with the original 20-item CESD scale. The frequency of their feelings in the past week was measured from 0 “rarely or none of the time” to 3 “most of the time”. The total score ranged from 0 to 33, and a higher score represents higher severity of depressive symptoms (Pun et al., 2017; Shiovitz-Ezra et al., 2009).
Anxiety was measured using the 7-item Hospital Anxiety and Depression Scale (HADS), which demonstrated a good internal reliability and validity in other population-based studies (Pun et al., 2017; Shiovitz-Ezra et al., 2009). The frequency of their feelings in the past week was measured from 0 “rarely or none of the time” to 3 “most of the time.” Positively worded questions were reverse coded when creating the total score. The total score ranged from 0 to 21, and a higher score represents higher severity of anxiety symptoms (Pun et al., 2017; Shiovitz-Ezra et al., 2009).
Loneliness was measured using the 3-item shortened UCLA-loneliness scale with good internal validity with the original UCLA-loneliness scale (Cronbach’s alpha = .81). The frequency of their feelings of loneliness was measured from 0 “hardly ever” to 2 “often.” The total score ranged from 0 to 6, and a higher score represents greater loneliness (Shiovitz-Ezra et al., 2009).
Ethical Considerations
The NSHAP study database, codebook, and survey questionnaires are currently available for public access from the Inter-university Consortium for Political and Social Research (ICPSR) website. Only the de-identified information was archived and analyzed for the current study. All datasets, corresponding codebooks, and statistical programs were stored on a secure, encrypted server at Columbia University. The current study received Columbia university institutional review board declaration of exemption [IRB-AAAU4294].
Data Analysis
We conducted the LCA and LTA using Mplus, Version 4.1 (Muthén and Muthén, Los Angeles, CA, USA). Researchers often recommend conducting LCA before LTA which helps obtain preliminary information on latent status structure (Nylund-Gibson & Choi, 2018). Thus, we initially conducted LCA followed by LTA for current data analysis.
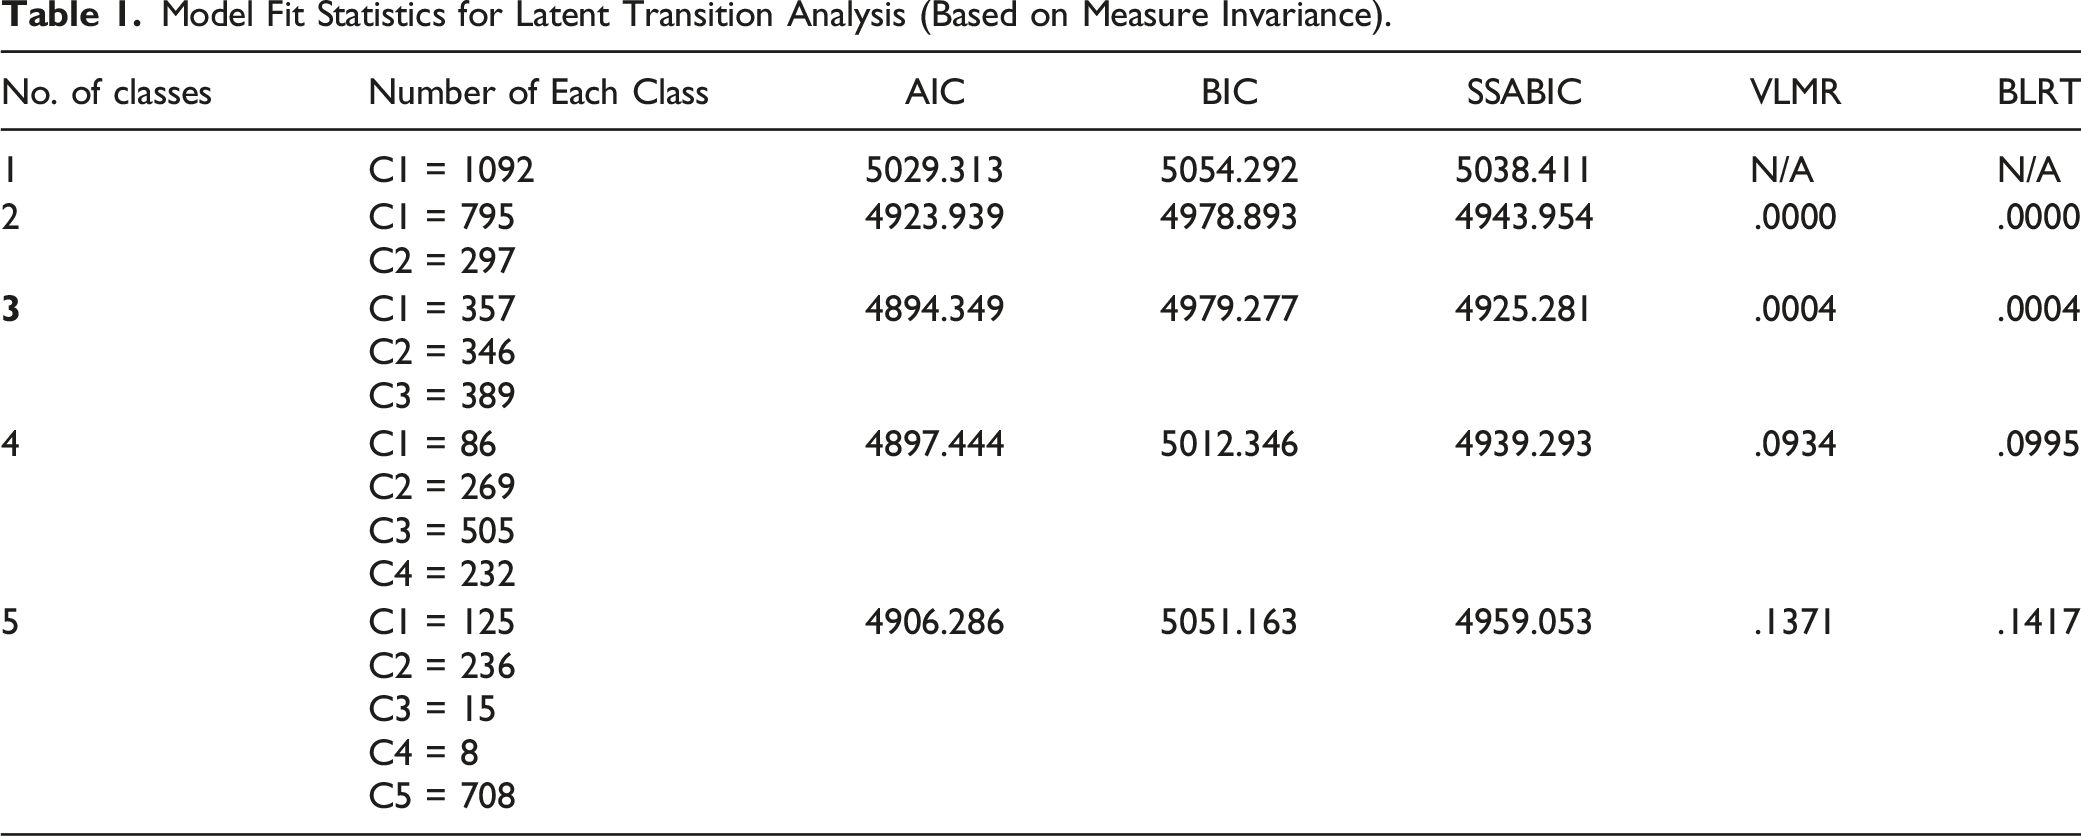
First, LCA was conducted to identify the optimal number of latent classes of young-old adults based on the combination of social network variables. The model was tested from a 1-class to 5-class model, and statistical fit indices such as Akaike information criterion (AIC), Bayesian information criterion (BIC), sample-size adjusted BIC (SSABIC), Vuong-Lo-Mendell-Rubin adjusted likelihood ration test (VLMR-LRT), and bootstrap likelihood ration test (BLRT) were obtained (Nylund et al., 2007). The AIC, BIC, and SSABIC measures goodness-of-fit of each class model, and a low value represent a better-fit model. The VLMR-LRT and BLRT measures whether the current model is a better-fit model (e.g., 4-class model) than the previous model (e.g. 3-class model). When the p-value is significant (p < .05), it indicates that the current model is better than the former model. Along with the statistical fit indices, clinical meaningfulness and interpretability based on authors’ judgment are also considered to determine the best fitting final model (Mulaik et al., 1989; Pignon et al., 2018).
Then, LTA was conducted to examine the transition probabilities of social network variables from young-old adults to old-old adults across the three waves. The LTA model yielded three main parameters of interest, which were item-response probabilities, latent status probabilities, and transition probabilities (Lanza et al., 2010). Measurement invariance in item-response probabilities was assumed to ensure the psychometric equivalence of a construct measured across the three waves and to improve identification and interpretation of latent classes over time (Collins & Lanza, 2009; Putnick & Bornstein, 2016). Each latent class was named based on item-response probabilities indicating the correspondence between the social network variables and latent status membership (Lanza et al., 2010). Latent status probability further details the proportion of individuals expected to belong to each latent class at each time point (Collins & Lanza, 2009; Lanza et al., 2010). For the current study, we are most interested in the transition probabilities, which indicates the probability of transitioning from a particular latent status at time t to another latent status at time t+1 (Lanza et al., 2010). In the matrix, the row corresponds to latent status membership at time t and the column corresponds to latent status membership at time t+1 (Velicer et al., 1996). Thus, the row in first matrix indicates latent status membership at Wave I and column indicates latent status membership at Wave II. The row in second matrix indicates latent status membership at Wave II and column indicates latent status membership at Wave III.
Last, descriptive statistics, chi-square test for categorical variables and analysis of variance (ANOVA) for continuous variables were conducted to understand the characteristics of each latent class and to identify significant differences among the latent classes.
Results
Model Selection
Model Fit Statistics for Latent Transition Analysis (Based on Measure Invariance).
Latent Transition Analysis
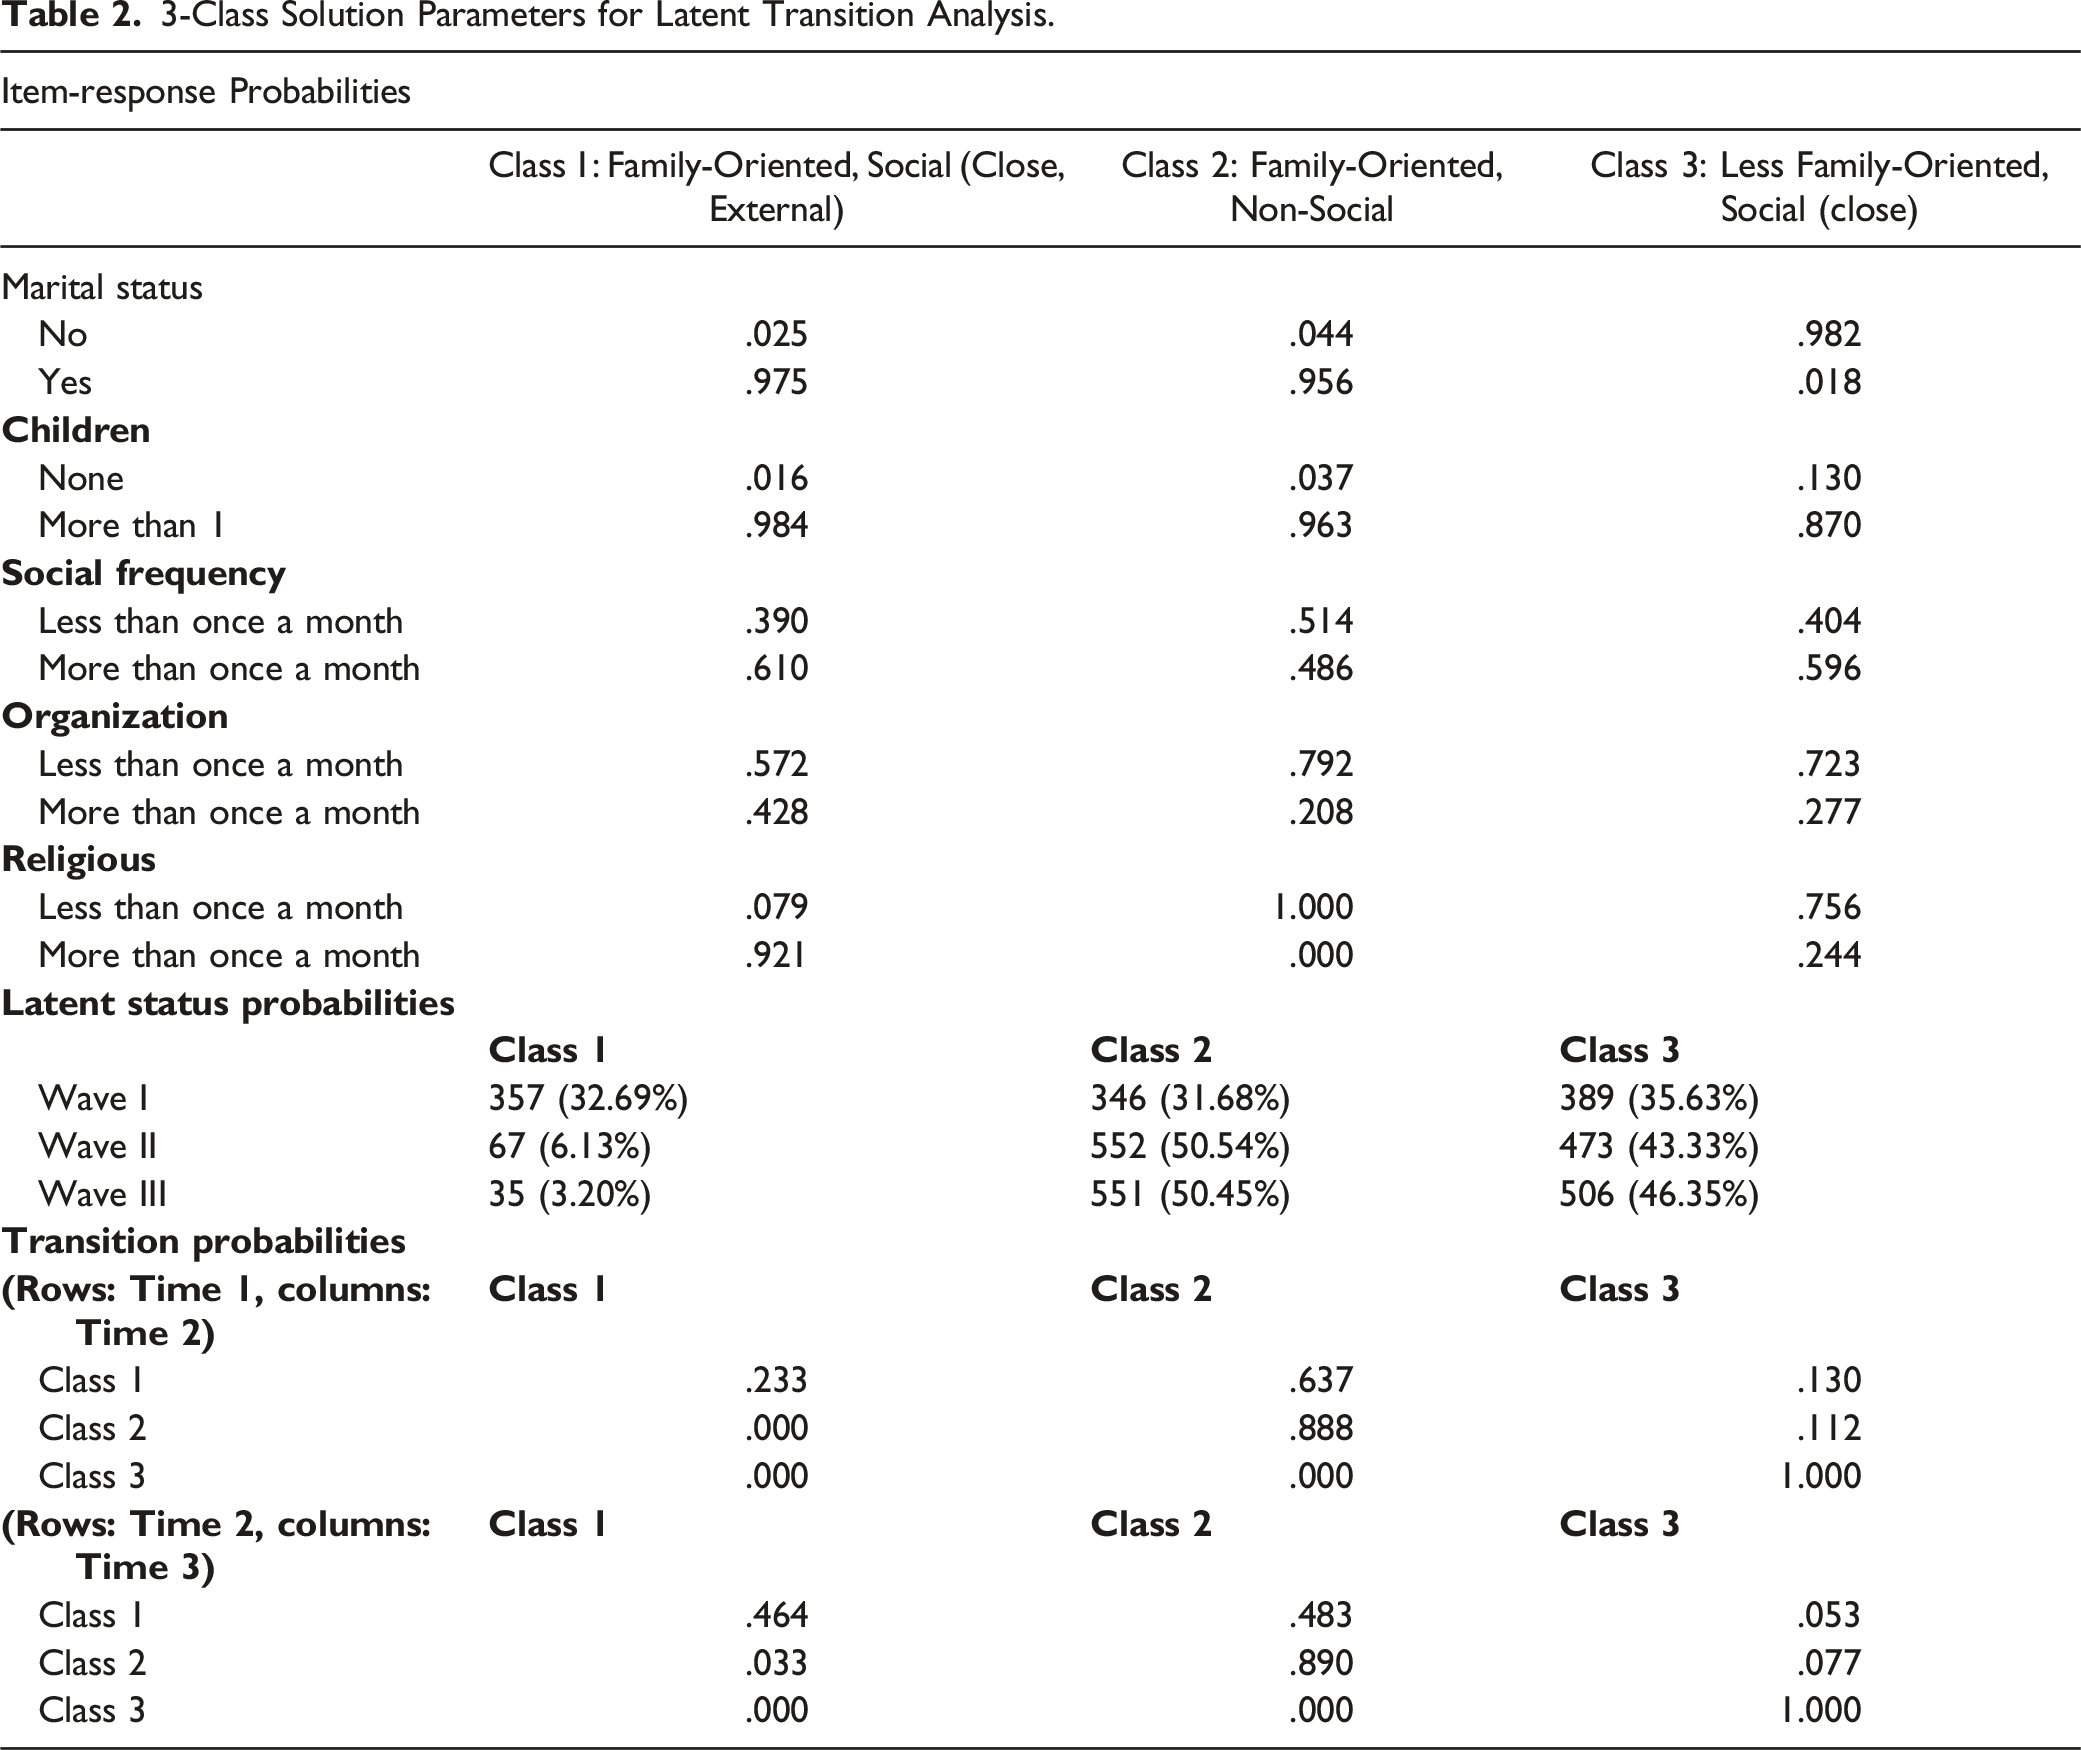
The 3-class model consisted of Class 1: family-oriented, social (close, external), Class 2: family-oriented, non-social, and Class 3: less family-oriented, social (close). Here, social (close) indicates being socially active with relatives and friends, and social (external) interaction indicates being socially active with external organizations and religious activities. Class 1: family-oriented, social (close, external) included individuals who were mostly married, having more than one child, socially frequent with relatives and friends, and active with religious activities. Class 2: family-oriented, non-social included individuals who were mostly married, having more than one child, less socially frequent with relatives and friends, and not active with organization or religious activities. Class 3: less family-oriented, social (close) included individuals who were mostly not married, having more than one child, socially frequent with relatives and friends, and not active with organization or religious activities.
The latent status probabilities show the proportion of older adults who are expected to belong to each class at each wave (Cleveland et al., 2018). At Wave I, one-third of young-old adults belonged to each class. At Wave II and Wave III, the latent status probability for Class 1: family-oriented, social (close, external) decreases, whereas the probability increases for Class 2: family-oriented, non-social and Class 3: less family-oriented, social (close).
3-Class Solution Parameters for Latent Transition Analysis.
Baseline Participant Characteristics
Sample Characteristics at Baseline.
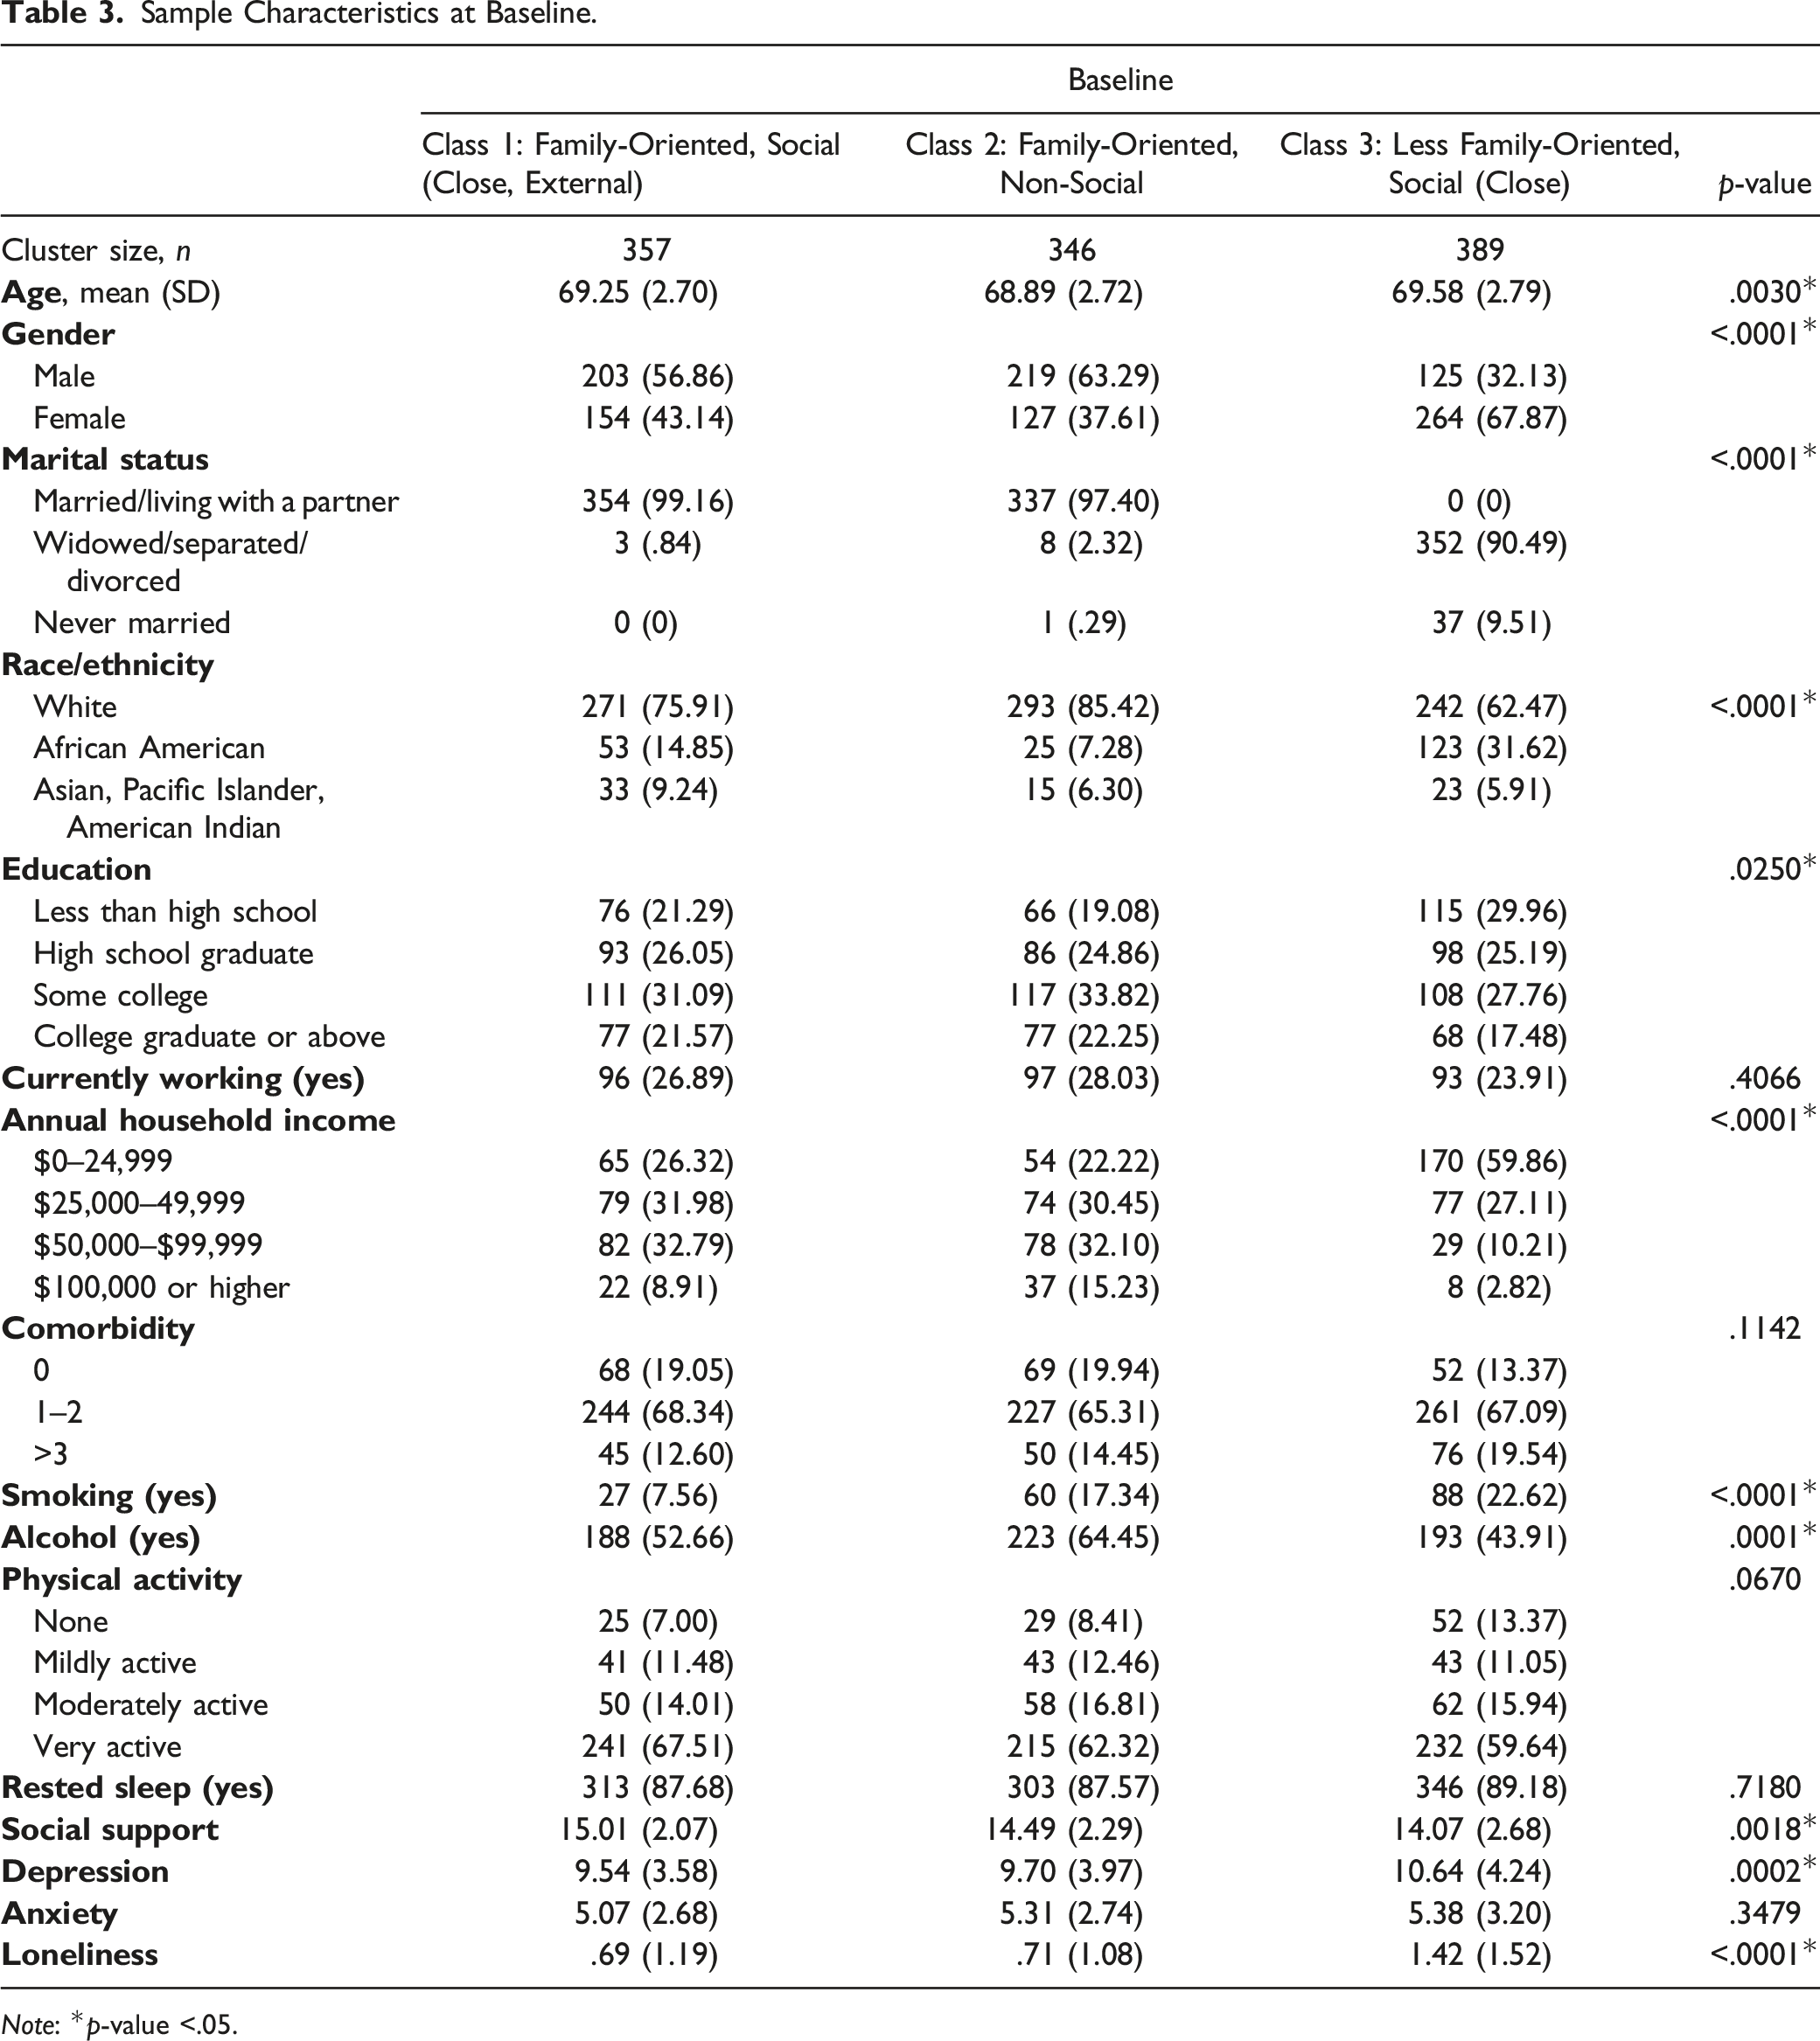
Note: *p-value <.05.
Discussion
To the best of our knowledge, this is the first study to use latent transition analysis to understand the transition patterns of social networks as young-old adults become old-old adults over a 10-year time span. Three classes of young-old adults were identified based on the combination of their social network variables: Class 1: family-oriented, social (close, external), Class 2: family-oriented, non-social, and Class 3: less family-oriented, social (close). Young-old adults in Class 1: family-oriented, social (close, external) transitioned into Class 2: family-oriented, non-social, indicating less engagement in social activities over time. In contrast, young-old adults in Class 2: family-oriented, non-social and Class 3: less family-oriented, social (close) were less likely to transition to another class. In addition, we found statistically significant differences in baseline participant characteristics among three classes of young-old adults.
Old adults engaged in less close and external social activities over time. This is evident in the transition patterns of Class 1: family-oriented, social (close, external) into Class 2: family-oriented, non-social from Wave I to Wave II, and from Wave II to Wave III. Our study findings support previous research that found decreased social engagement over time as young-old adults transitioned into old-old adults (Antonucci, 2001; Kemperman et al., 2019; Zheng & Chen, 2020). Compared to younger adults, older adults tend to isolate themselves from social activities and have smaller social networks which may be due to changes in their social roles and emerging health issues that restrict their mobility (Kemperman et al., 2019; Zheng & Chen, 2020). Zheng and Chen (2020) reported that older adults’ frequency of social engagement with friends and relatives may decrease over time as older adults focus more on the network structure and quality of family relationships (Zheng & Chen, 2020). Similarly, Antonucci (2001) indicated that the family network of older adults tends to expand while their social network narrows down with aging and this family support has been associated with well-being among older adults (Antonucci, 2001). Our study found a similar phenomenon where older adults continued to maintain their family ties over time while their social engagement with external and close network has changed. Family support has been inversely associated with loneliness frequency and transitioning from non-lonely to lonely state among older adults (Hawkley & Kocherginsky, 2018). It is important to understand that social engagement and support are important aspects of healthy aging in regards to their overall well-being (Chen & Feeley, 2014; Thomas, 2010). Thus, older adults should be encouraged to continue their social engagement with close social network of friends and relatives, and continue to maintain their relationship with immediate family members.
Young-old adults in Class 1: family-oriented, social (close, external), who are likely to transition into Class 2: family-oriented, non-social as old-old adults, consisted of the highest percentage of Asian, Pacific Islander, American Indian. This aligns with previous research that examined the influence of Asian culture on family-orientedness and family-togetherness (Barrenetxea et al., 2022; Miyawaki et al., 2022; Sarwono, 2020). In Southeast Asia, family is defined as a unit consisted of family social networks that are centered around elderly parents and adult children living in the same or different households (Sarwono, 2020). Based on this cultural-specific definition of family, Miyawaki et al (2022) found Asian older adults expected to preserve their traditional, family-oriented culture, including the expectation of being cared for by their children in their older years (Miyawaki et al., 2022). Such cultural expectation may explain the continued family-oriented structure over time. In addition, the level of social support for young-old adults in Class 1: family-oriented, social (close, external) was the highest among all the classes. The social support sources of Asian older adults are mostly refined to close family members based on their value of family-oriented culture (Barrenetxea et al., 2022). Therefore, it is important to maintain the intergenerational relationship for Asian older adults with strong emphasis on family-oriented culture which may assist in increasing the level of perceived social support and reducing loneliness (Miyawaki et al., 2022).
Furthermore, young-old adults in Class 3: less family-oriented, social (close) remained in the same class even when they became old-old adults. Previous researchers found that the family structure has significantly changed in the past few decades to a smaller size nuclear family, increased divorce and decreased marriage rate, and a higher number of women working with higher education (Bengtson, 2001; Unsar & Erol, 2016). Such change in family structure may have led older adults to turn to friends for social support, which may explain young-old adults in Class 3 to stay in the same class over time (Bath & Deeg, 2005; H. Luo, 2018). Social engagement has been found to be positively associated with healthy behaviors such as healthy eating and moderate-to-vigorous physical activity (M. Luo et al., 2020). In addition, active social engagement and participation have led to positive health outcomes such as greater self-efficacy and better physiological and psychological well-being (Bath & Deeg, 2005). Thus, more effort should be made to continue and maintain active social engagement among older adults to ensure their overall well-being.
Significant differences were found in age, gender, marital status, race/ethnicity, level of education, annual household income, health behaviors (e.g., smoking and drinking alcohol), and psychological symptoms (e.g., depression and loneliness) among the three classes of young-old adults at baseline. Compared to Class 1: family-oriented, social (close, external) and Class 2: family-oriented, non-social, Class 3: less family-oriented, social (close) had the highest mean age, proportion of female, African Americans, education less than high school, annual household income of $0–24,999, current smokers, and psychological symptoms. Our study findings support previous research that found older age to be associated with a closer social network consisted of more emotionally close relationships (Bruine de Bruin et al., 2020; Wrzus et al., 2013). This is evident in Class 3 where older adults with the highest mean age did not engage in any external social activities but only maintained social activities with close network of relatives and friends. In addition, previous studies have found females to report a higher level of loneliness and thus place a stronger emphasis on friendship than males (Felmlee & Muraco, 2009; Pinquart & Sörensen, 2001). As the highest proportion of females has been found in Class 3, this may indicate that female older adults tend to depend on their close social network of friends whom they can receive support on daily basis, rather than direct family members, which has been associated with higher levels of life satisfaction (Ng et al., 2020). They often engaged in more stressful conversations and found the interactions to be less pleasant with direct family members (Ng et al., 2020). We also found a highest percentage of African Americans with low annual household income in Class 3. Previous research have supported the African Americans’ cultural value of family cohesiveness and togetherness (Min et al., 2021; Robinson & Golphin, 2021). However, it may be worthwhile to consider that African Americans are no longer able to maintain such cultural values from financial challenges and busy lifestyle working which may explain their high proportion in Class 3 (Min et al., 2021). While family support is also important, more efforts should be made to encourage older adults to maintain social activities with close network of relatives and friends which can help reduce psychological distress and improve emotional well-being (Ng et al., 2020).
Our study has several limitations to consider. First, all of the social network variables were dichotomized. The dichotomization of study variables has been a common approach used to facilitate model identification and interpretation in LCA and LTA (Cheng et al., 2021; Rinne et al., 2017; Sung et al., 2022). However, future studies should use different set of standards to categorize the social network variables to better understand the transition patterns of social networks among older adults. Second, our study used limited number and types of social network variables related to immediate family ties, relatives and friends, and community due to data availability. Other important social network variables such as social network size, density, and composition should be considered (Kreider et al., 2015). Third, we focused on young-old adults who transitioned into old-old adults over a 10-year time span. As older adults are a heterogeneous group of individuals, future studies should further understand how their transition patterns of social networks might differ when they become oldest-old adults. Fourth, the NSHAP data set may not be representative of the U.S. older population in terms of important sociodemographic characteristics (e.g., race, gender, and education) despite their efforts in sample and estimation plan. In addition, NSHAP did not consider institutionalized or homeless older adults which may have different social networks. Future research should consider using sampling weights to correct for any potential bias between the sample and target population. Last, our study focused on depression, anxiety, and loneliness as psychological symptoms and did not consider cognitive function which is significantly affected with aging due to limited data availability at baseline. It is important for future researchers to consider the differences in cognitive function among the three latent classes and how social networks may affect their overall cognitive function.
Conclusion
The current study examined the transitions in social networks as young-old adults become old-old adults over a 10-year time span. A total of three classes were identified that included Class 1: family-oriented, social (close, external), Class 2: family-oriented, non-social, and Class 3: less family-oriented, social (close). Young-old adults in Class 2: family-oriented, non-social, and Class 3: less family-oriented, social (close) were likely to remain in the same class. In contrast, young-old adults in Class 1: family-oriented, social (close, external) transitioned into Class 2: family-oriented, non-social, indicating their less engagement in social activities over time.
Footnotes
Declaration of Conflicting Interests
The author(s) declared no potential conflicts of interest with respect to the research, authorship, and/or publication of this article.
Funding
The author(s) disclosed receipt of the following financial support for the research, authorship, and/or publication of this article: Se Hee Min is supported by the National Institute for Nursing Research training grant Reducing Health Disparities through Informatics (RHeaDI) (T32NR007969).
Ethics Approval
This article does not contain any studies with human participants or animals performed by any of the authors.