
Abstract
Background:
More elderly frail patients are now treated by peritoneal dialysis (PD). Frailty, sarcopenia and protein energy wasting (PEW) are all associated with increased mortality. Simple screening tools are required to identify patients to allow for interventions. As such, we wished to review the prevalence of frailty and compare frailty with sarcopenia and PEW in a contemporary PD population.
Patients and methods:
We used the Clinical Frailty Score (CFS) to determine frailty, bio-impedance body composition and hand grip strength (HGS) to determine sarcopenia and combining laboratory, body composition and protein nitrogen appearance rate (PNA) to assess PEW.
Results:
Records of 368 PD patients, 61% male, mean age 60.9 ± 16.1 years, body mass index (BMI) 26.2 ± 5.1 kg/m2 were reviewed, with 71 classified as frail (19.3%; CFS > 4), and frailty associated with age (odds ratio (OR) 1.047, 95% confidence interval (CL) 1.01–1.085, p = 0.012), Stoke-Davies co-morbidity (OR 1.808, 95%CL 1.129–2.895, p = 0.014) and negatively with HGS (OR 0.906, 95% CL 0.897–0.992, p = 0.033); 17.7% met muscle loss and HGS criteria for sarcopenia, with fair agreement with frailty (kappa 0.24 (CL 0.09–0.38)). Only two patients (0.5%) met all four criteria for PEW, 26.1% met the reduced BMI criteria, 4.6% the serum albumin, 32.9% the PNA and 39.4% the reduced muscle mass. HGS correlated with lean muscle mass (r 2 = 0.42, p < 0.001).
Conclusion:
Using the CFS, 19.3% of patients were classified as frail, compared to 17.7% with sarcopenia and <1% with PEW. The CFS requires no special equipment or laboratory tests and was associated with age, co-morbidity and HGS weakness.
Keywords
Introduction
In many Western European and other countries, peritoneal dialysis (PD) was originally reserved for the healthier older patient who could perform their own dialysis. However, the demographics of the PD population in many developed countries have changed over the last decade, with increasing numbers of more elderly patients now being treated by PD, 1 particularly following the introduction of various healthcare models of assisted PD. 2,3 As such, more elderly frail co-morbid patients are now being treated by PD in Western Europe.
Despite improvements in medical care and disease management, mortality of PD patients remains higher than that of the general population, particularly for PD patients with sarcopenia, protein energy wasting (PEW) and frailty. 4 Although muscle mass naturally declines with older age, the term sarcopenia is generally used to indicate greater than age expected loss of muscle mass, and various speciality groups have proposed definitions of sarcopenia, typically based on a combination of non-invasive measurements of muscle mass, along with functional assessments of muscle strength or performance. 5 If patients have also lost fat weight and have a lower serum albumin, then they may be classified as having PEW. 6 The prevalence of sarcopenia varies between PD studies depending upon the definition used 7,8 and the demographics of the patient population studied. 9,10
Frailty, on the other hand is a syndrome of decreased reserve and resistance to stressors, resulting from cumulative declines across multiple physiologic systems. 11 In clinical practice, the 9-point Clinical Frailty Score (CFS) can be used to determine frailty, with a score of more than 4 being taken as defining frailty 12 (Supplemental Table 1), and frail dialysis patients are reported to be at greater risk of both hospitalisation and mortality. 13,14,15 The CFS was introduced into the United Kingdom (UK) National Health Service (NHS) hospital practice to screen for frailty, as part of the NHS holistic policy for patient care. As such, we wished to determine the phenotype and determinants of frailty in a multi-ethnic PD population, and how frailty overlapped with sarcopenia and PEW.
Patients and methods
We reviewed the electronic medical records of PD outpatients who had a CFS recorded when attending a tertiary centre for routine assessments of peritoneal membrane function, between January 2008 and October 2018. 12 Frailty was classified as a score > 4 (Supplemental Table 1). Nursing staff had been trained to assess patients for the CFS. Seventy-five patients treated for peritonitis or had an emergency hospital admission within the preceding 3 months were also excluded from the study. Body composition and extracellular water (ECW) and total body water (TBW) were measured by multifrequency segmental bio-impedance (In Body S720, Seoul, South Korea), using a standardised protocol, after PD effluent had been drained from the abdomen, and patients had voided. 16 Twenty-six other patients were excluded due to absence of bio-impedance measurements of body composition due to implantable cardiac devices, amputations and inability to stand, as bio-impedances had not been cleared for use in patients with implantable cardiac devices, and algorithms for calculating appendicular lean mass were not available for patients with lower limb amputations or those with unilateral muscle atrophy. Hand grip strength (HGS) (Dynamometer, Takei Scientific Instruments Co, Nigata, Japan) was measured according to the manufacturer’s instructions. 17 Whereas all patients had bio-impedance measurements, only 232 (61.1%) patients had contemporaneous HGS measurements. Routine laboratory test results were obtained along with assessments of peritoneal membrane function, and dialysis adequacy, with dietary protein intake estimated by the protein nitrogen appearance rate adjusted for weight (nPNA) for all patients. 18 Co-morbidity was adjudged using the UK Stoke-Davies co-morbidity scale. 19
We used the updated muscle mass and HGS cut off definitions of sarcopenia for Europeans and Asians, 20,21 and PEW as a combination of a serum albumin < 30 g/L, body mass index (BMI) of < 23 or percentage body fat mass (%BFM) <10%, reduced muscle mass and nPNA < 0.8 g/kg/day. 6
Statistical analysis
Results are expressed as mean ± standard deviation, or median and interquartile range, or percentage. Standard statistical analyses were used: D’Agostino & Pearson normality test, Student’s t test, Mann–Whitney U test, and chi-square test, with appropriate post-hoc adjustment for small numbers and multiple testing. Weighted kappa testing was used to compare sarcopenia and frailty. Determinants of frailty were assessed using Spearman univariate analysis, A backward stepwise multivariable logistic regression model was then built from variables associated with frailty at p < 0.1, and variables excluded if not statistically significant, unless they improved model fit. Variables were checked for collinearity. Statistical analysis was performed using Graph Pad Prism (version 9.2, Graph Pad, San Diego, California, USA; Analyse-It version 4.0, Leeds, UK), and Statistical Package for Social Science version 26.0 (IBM Corporation, Armonk, New York, USA). Statistical significance was taken at or below the 5% level.
Ethics
This retrospective audit was checked with and complied with the UK NHS Health Research Authority, guidelines for clinical audit and service development, with all patient data anonymised prior to analysis (https://www.hra.nhs.uk).
Results
We reviewed the results from 368 adult PD patients (Table 1). The mean CFS score was 3.4 ± 1.3, with 71 patients (19.3%) classified as frail (Table 2), with most mildly frail 42 (11.41%) followed by 20 (5.43%) moderately frail and 9 (2.45%) severely frail, respectively. Frail patients were older, more likely to have diabetic nephropathy, greater co-morbidity, higher ratio of ECW to TBW, greater percentage of body fat, higher C reactive protein (CRP) and N terminal pro-brain natriuretic peptide (NTproBNP) (Table 2). Frail patients weighed less, were less likely to be of African or Afro-Caribbean ethnicity, had less muscle mass indexed for height and weaker HGS, lower estimated dietary protein intake, serum albumin, creatinine and residual kidney function. Dividing patients according to gender, then more female patients were frail (p = 0.011), and more South Asian female patients were classed as frail compared to other ethnicities (p = 0.011), whereas there was no similar effect for males (p = 0.16). The median loss of protein in the urine was measured at 0.7 g/day (0.2–1.5) and was not associated with CFS.
Patient demographics.a
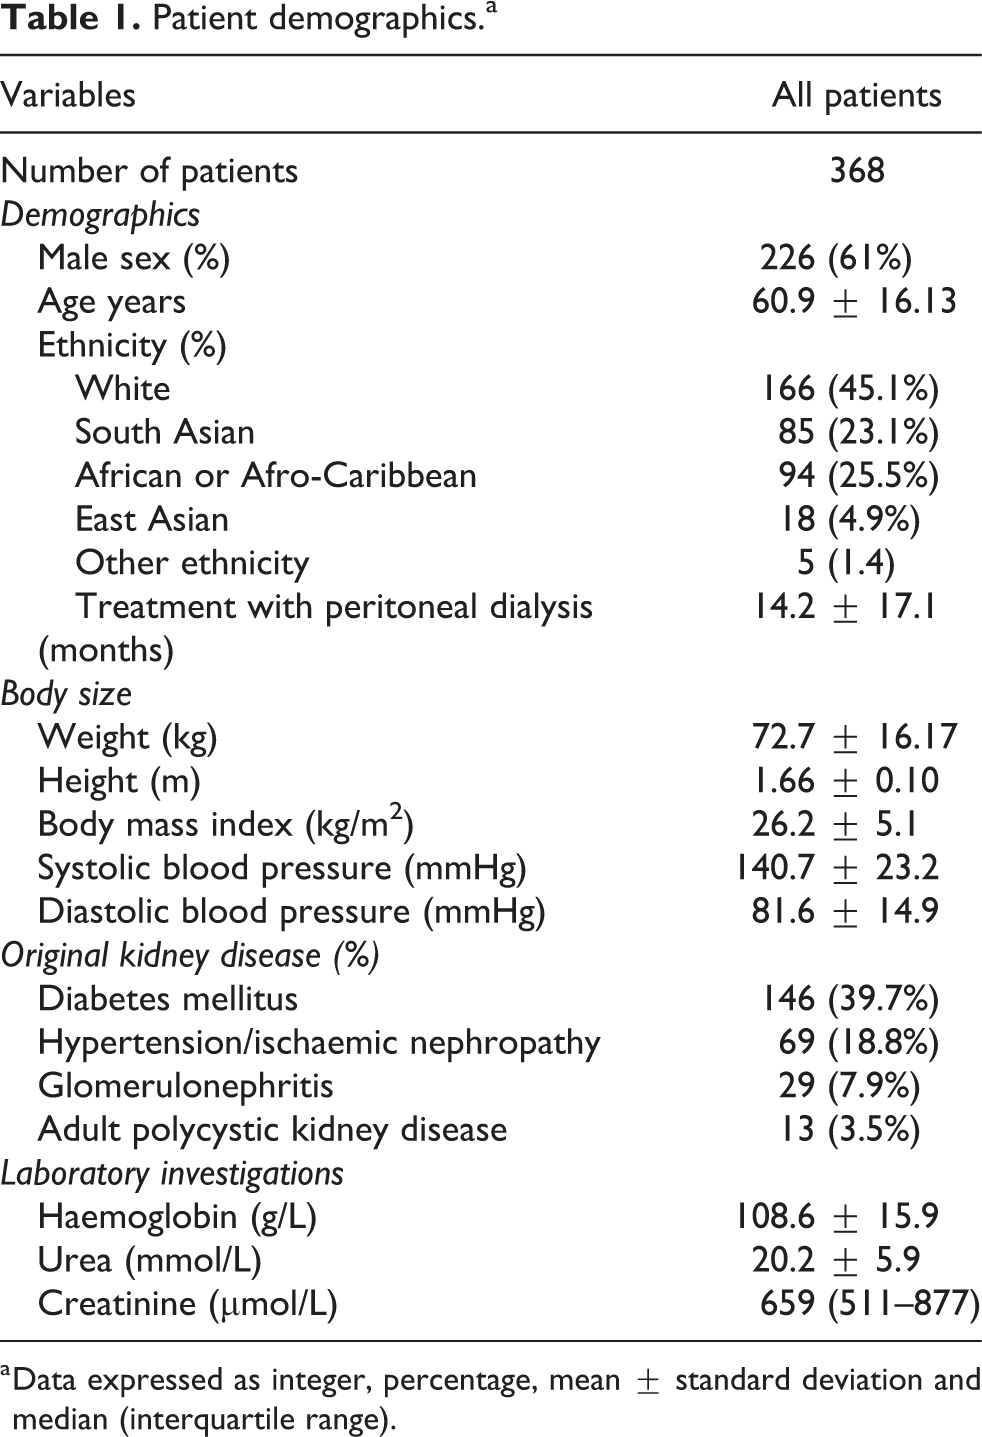
a Data expressed as integer, percentage, mean ± standard deviation and median (interquartile range).
Comparison of frail and non-frail patients. ±
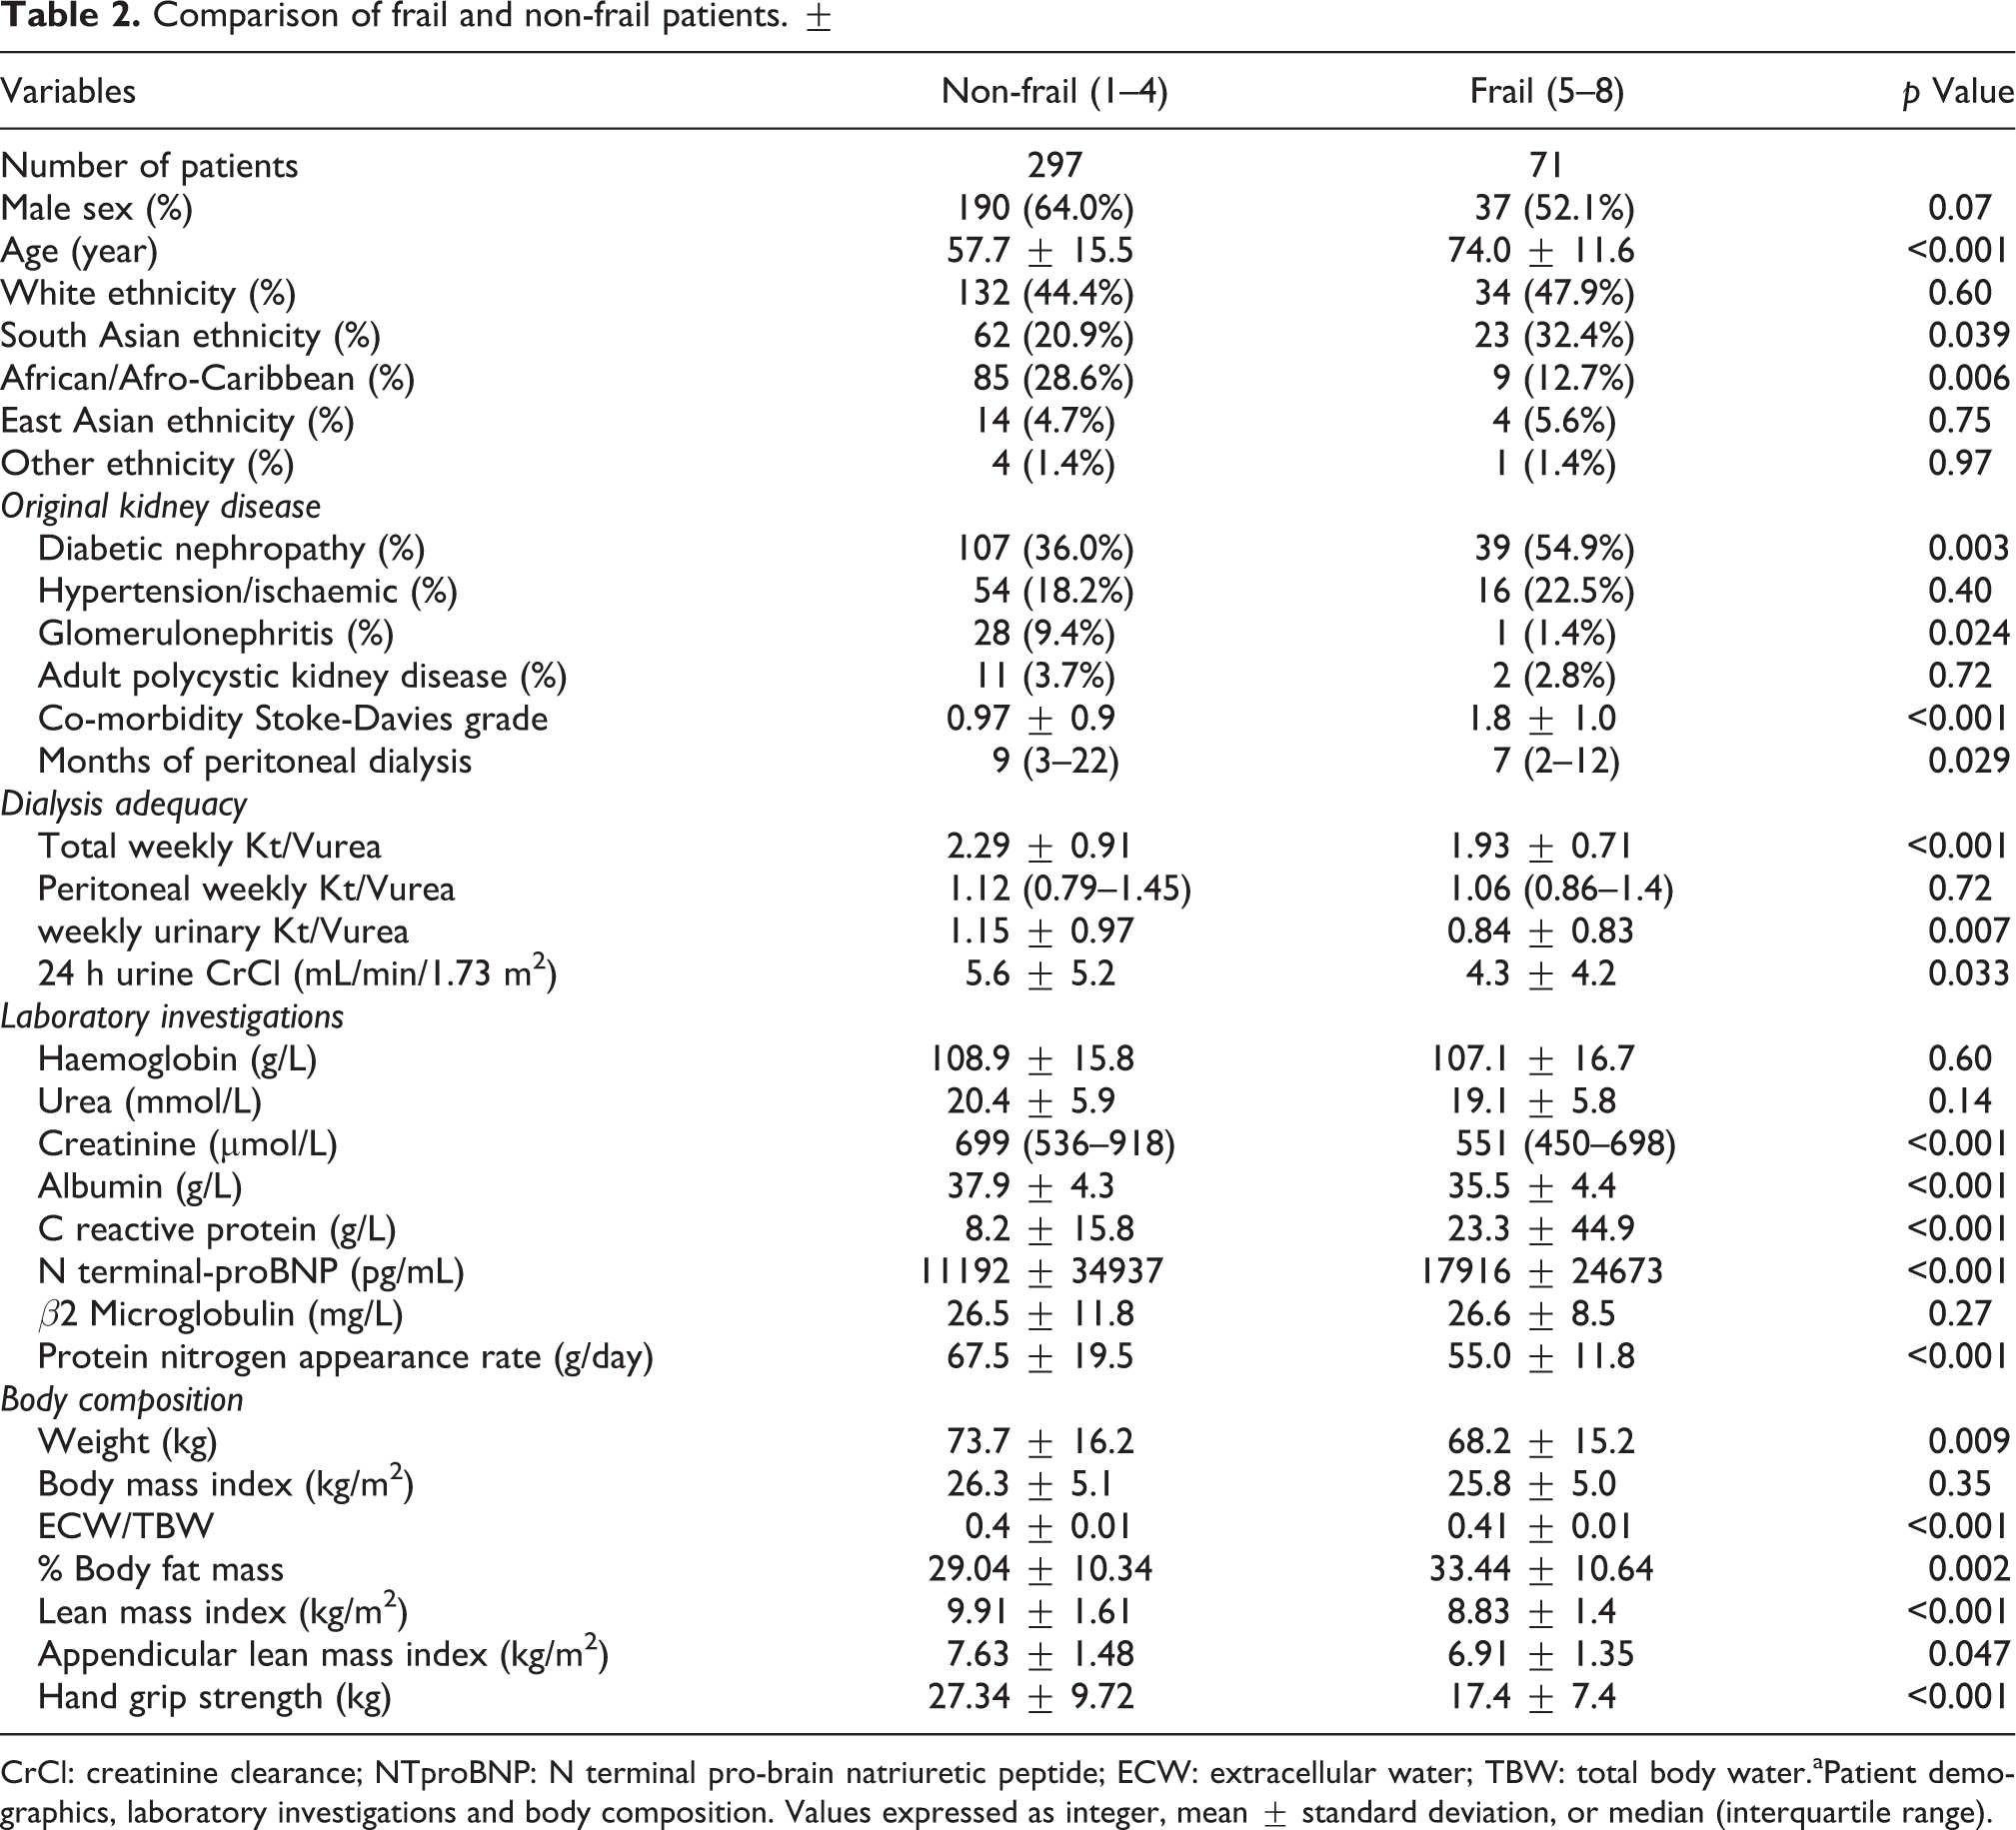
CrCl: creatinine clearance; NTproBNP: N terminal pro-brain natriuretic peptide; ECW: extracellular water; TBW: total body water.aPatient demographics, laboratory investigations and body composition. Values expressed as integer, mean ± standard deviation, or median (interquartile range).
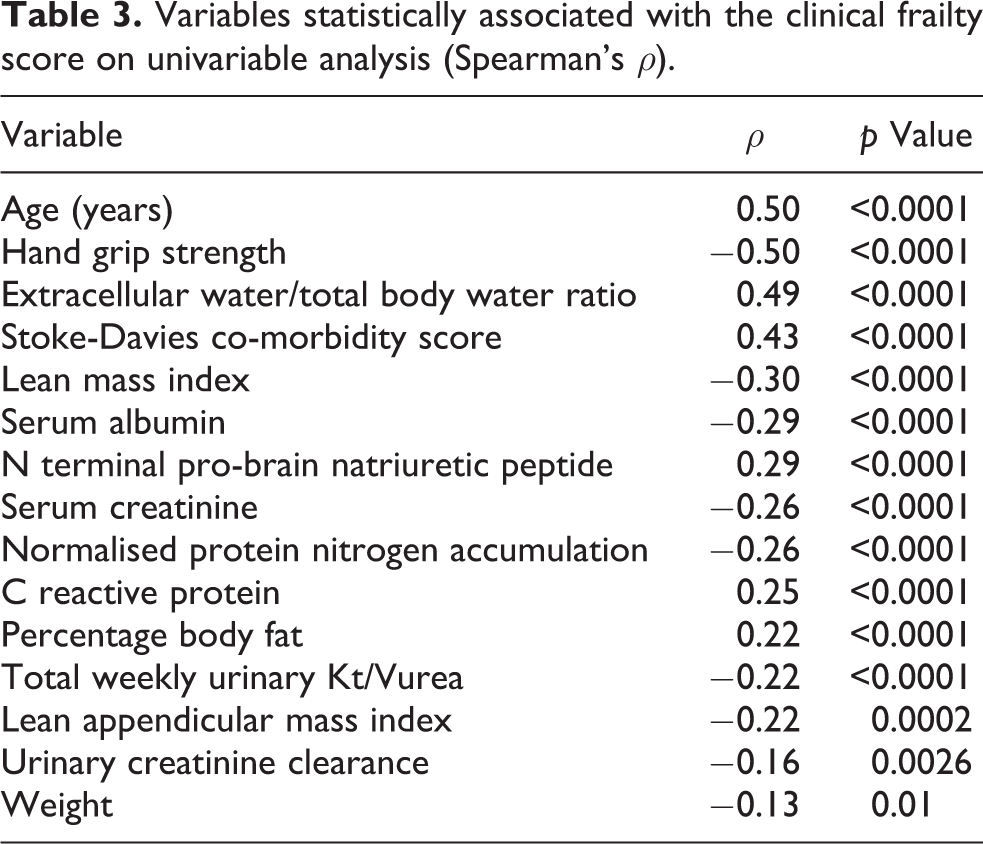
On univariable analysis, the CFS was associated with age, ECW/TBW, co-morbidity, serum NTproBNP, CRP and percentage %BFM and negatively with HGS, serum creatinine and albumin, muscle mass, nPNA, residual kidney function and weight (Table 3).
Variables statistically associated with the clinical frailty score on univariable analysis (Spearman’s ρ).
A multivariable logistic model was then created, and frailty was independently associated with age (odds ratio (OR) per year 1.047, 95% confidence interval (CL) 1.01–1.085, p = 0.012), co-morbidity (OR 1.808, 95%CL 1.129–2.895, p = 0.014) per unit and negatively with HGS (OR 0.906, 95% CL 0.897–0.992, p = 0.033) per kg (Table 4).
Logistic regression analyses for associations between subject characteristics and frailty status.
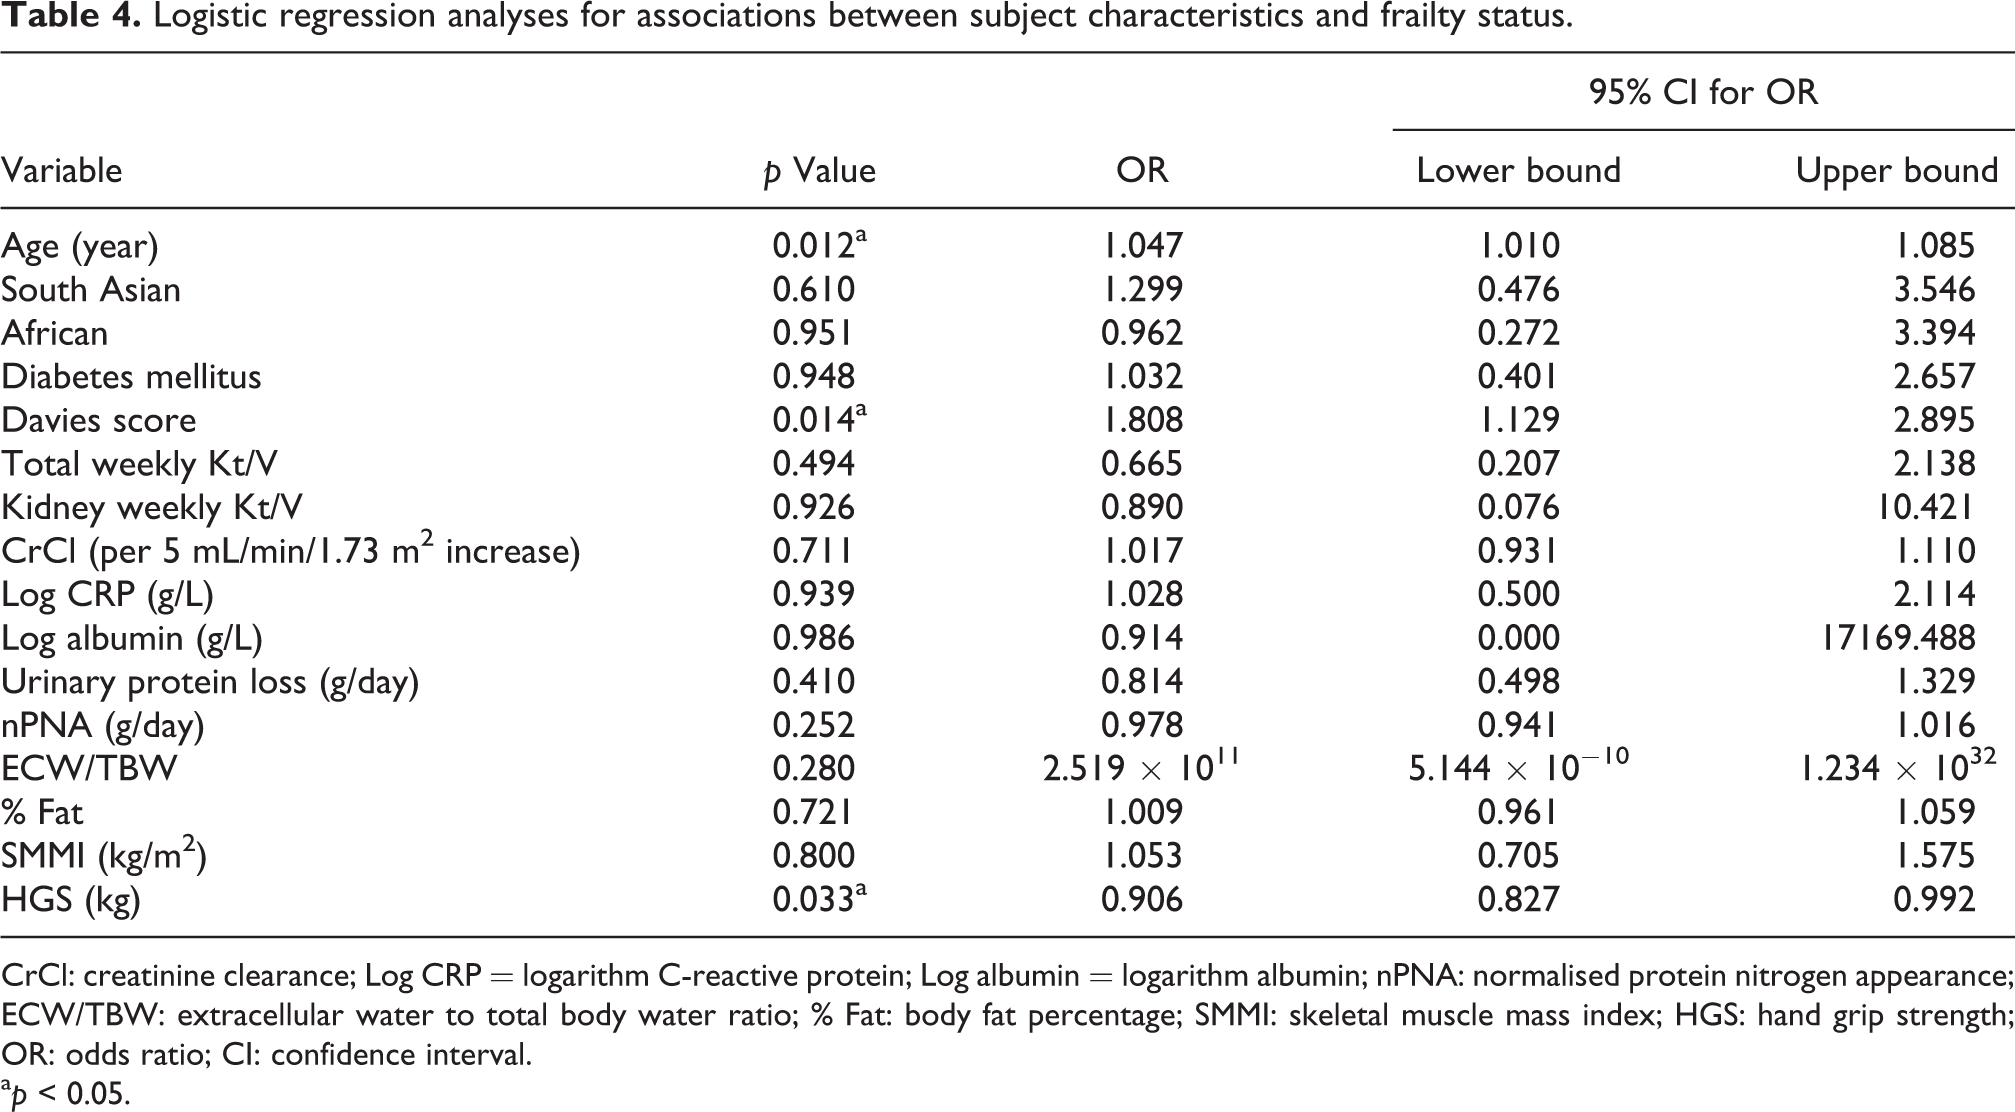
CrCl: creatinine clearance; Log CRP = logarithm C-reactive protein; Log albumin = logarithm albumin; nPNA: normalised protein nitrogen appearance; ECW/TBW: extracellular water to total body water ratio; % Fat: body fat percentage; SMMI: skeletal muscle mass index; HGS: hand grip strength; OR: odds ratio; CI: confidence interval.
a p < 0.05.
Using the European and Asian guidelines for defining sarcopenia, 20,21 78 (21.3%) patients had reduced muscle mass and 102 of 232 (44%) had reduced HGS, and both were reduced in 17.7%. More patients who were frail met the sarcopenia cut point for reduced muscle mass (39.4% vs 16.9%, p = 0.001) and reduced HGS strength (73.2% vs 34.7%, p < 0.001), and both criteria (39.4 vs 16.9%, p < 0.001). We compared the 19.3% of patients categorised as frail with the 17.7% with sarcopenia, which showed fair agreement with a weighted kappa score of 0.24 (95% Wald confidence limits 0.09–0.38) and also fair agreement for both the sarcopenia HGS criteria alone (weighted kappa 0.3 (0.19–0.42)) and loss of muscle mass (weighted kappa 0.22 (0.1–0.33)).
Taking the individual components of PEW, 6 then 26.1% met the reduced BMI criteria, 3% reduced body fat, 4.6% reduced serum albumin, 32.9% low PNA and 39.4% reduced muscle mass. However, only two patients (0.5%) met all four criteria using BMI, and no patient when using reduced body fat rather than BMI. Taking the individual criteria cut points, then there was no difference between frail and non-frail patients for BMI (32.4 vs 24.6%, p = 0.18), %BFM (2.8 vs 3%, p = 0.9) and reduced muscle mass (43.7 vs 38.4%, p = 0.41), but more frail patients had reduced serum albumin (12.7 vs 2.7%, p < 0.001) and nPNA (43.7 vs 30.3%, p = 0.031). Comparing frailty and the individual albumin and nPNA PEW criteria, then the method comparison was none to slight (weighted kappa 0.14 (0.03–0.25) and 0.11 (0–0.21), respectively). Whereas agreement between frailty and other individual components of PEW were even lower (fat mass 0 (−0.07 to 0.06), BMI 0.02 (−0.01 to 0.04) and skeletal muscle mass 0.04 (−0.05 to 0.13)).
HGS correlated positively with lean mass (r = 0.65, p < 0.001) and appendicular lean mass (r = 0.59, p < 0.001).
Discussion
The demographics of PD patients have changed over time, especially following the introduction of assisted PD programs. 2,3 The mortality risk is increased for patients with sarcopenia, PEW and frailty, 4,6 and as such simple screening tests are required to detect patients at an early stage to potentially allow for earlier interventions. Frailty scores using the CFS were recorded by the nursing staff based on the functional activity of patients, whereas defining sarcopenia required bio-impedance and HGS measurements, and PEW a composite of serum albumin, BMI, measurement of muscle mass and nPNA. The prevalence of frailty was 19.3%, similar to that for sarcopenia 17.7%, whereas very few patients met all four diagnostic criteria for PEW. 6 However, the agreement between frailty and sarcopenia was only fair on kappa testing, and even less between frailty and PEW.
In keeping with previous smaller studies, our frail patients were older, with greater co-morbidity, reduced HGS and lower muscle mass and fewer months of treatment with PD. 4 However, compared to other studies in PD, frail patients were more likely to have diabetes causing kidney disease, lower dietary protein intake and less residual kidney function. Earlier studies highlighted a relationship between declining residual kidney function and dietary protein intake. 22 Although the non-frail patients had greater residual kidney function and total weekly urea clearance, serum β2 microglobulin values were similar, suggesting equivalence in overall clearance. 23,24 Non-frail patients were heavier, with more muscle mass, higher serum creatinine and greater dietary protein intake, whereas frail patients had greater %BFM, in keeping with the concept of sarcopenic obesity. 25 Although PEW is associated with increased inflammation, only a reduced serum albumin is used as a biomarker of inflammation when assessing patients for PEW. 6 In this study, frail patients had lower serum albumin and raised CRP in keeping with inflammation, as inflammation has the propensity to increase the leakage of albumin into extracellular spaces. However, in PD patients, a lower serum albumin could also be due to ECW expansion and dilution of serum albumin. Thus, measurement of serum albumin is not a reliable guide to nutritional status in patients with kidney disease treated by PD. The ECW/TBW ratio and NTproBNP were both greater in frail patients, which could be due to volume overload. However other studies have shown that a loss of muscle mass reduces intracellular water and so can increase the ECW/TBW ratio, 26 and similarly NTproBNP can be increased in inflammatory states and with malnutrition. 27
On multivariable analysis frailty was independently associated with increasing age and co-morbidity and reduced HGS. Muscle mass naturally declines after the third decade, and sarcopenia is defined as a greater loss of muscle mass than that expected for age. 5 Dialysis patients have a number of risk factors for muscle loss, ranging from dietary restrictions, to protein losses with dialysis and reduced physical activity. 28,29 People with multiple co-morbidity are recognised to be less physically active, 30 which may be due to cardiorespiratory disease or other conditions limiting their ability to exercise. Both sarcopenia and PEW have a diagnostic criteria of reduced muscle mass, and although our frail patients also had lower muscle mass, the agreement between frailty and loss of muscle mass with sarcopenia and PEW was only minimal to fair. This would suggest that measurements of muscle mass in dialysis patients may not equate to physical performance. 31 Imaging studies have shown that as muscle contains a high proportion of water, then hydration status in dialysis patients can affect measurements of muscle mass, 32 and muscle may contain more fat and fibrous issue compared to controls. 32 In addition, electrophysiological studies have shown that muscle recovery times are delayed following electrical stimulation 33 and that the ability of muscle mitochondria to generate energy is reduced. 34 Thus, definitions of sarcopenia and PEW which include specific diagnostic cut points based on measurement of muscle mass may not be equally applicable to dialysis patients, with reports of physical activity in dialysis patients being independent of muscle mass or co-morbidity. 30 The agreement between HGS using the sarcopenia diagnostic criteria and frailty was somewhat better than for loss of muscle mass. Although there was a strong statistically significant correlation between HGS and lean muscle mass, the r 2 value of 0.42 would suggest that other factors contribute to more than 50% of the variance between HGS and muscle mass. In addition to the factors discussed above, dialysis patients may have bone and mineral disorders which reduce the relationship between arm strength and muscle mass further, and so patient ability to perform their every-day tasks of living.
This was a cross-sectional study, in patients established on PD and did not assess whether changes in body composition or HGS mirrored changes in CFS over time, either transitioning from a chronic kidney disease clinic to starting PD, or longitudinally with PD treatment. Prior to the introduction of the CFS, there was an educational program on CFS assessment, but we did not formally compare assessment scores between individual staff members.
Compared to the diagnostic criteria required for sarcopenia, and PEW based on the combination of the results of laboratory tests, changes in body composition and formal assessments of dietary intake, the nine-point CFS allows for rapid clinical scoring of patients, based on their functional ability, and can readily be performed in the outpatient clinic setting. Frailty increases with age and co-morbidity and is associated with reduced HGS. Studies in the non-dialysis population have suggested that exercise can help both reduce frailty and improve survival, 30 and exercise can increase muscle strength in dialysis patients. 35 Compared to earlier reports, this study reports a greater prevalence of frailty, due to changes in the demographics of our PD population. 36 As frailty is likely to become an increasing problem, then studies of exercise are required to determine whether increased physical activity can reverse frailty in this high-risk population.
Supplemental material
Supplemental Material, sj-docx-1-ptd-10.1177_08968608221077462 - Comparison of frailty, sarcopenia and protein energy wasting in a contemporary peritoneal dialysis cohort
Supplemental Material, sj-docx-1-ptd-10.1177_08968608221077462 for Comparison of frailty, sarcopenia and protein energy wasting in a contemporary peritoneal dialysis cohort by Andrew Davenport in Peritoneal Dialysis International
Footnotes
Acknowledgement
I would like to thank Ms Yin Menghan MSc for her statistical analysis.
Declaration of conflicting interests
The author declared no potential conflicts of interest with respect to the research, authorship, and/or publication of this article.
Funding
The author received no financial support for the research, authorship, and/or publication of this article.
Supplemental material
Supplemental material for this article is available online.
References
Supplementary Material
Please find the following supplemental material available below.
For Open Access articles published under a Creative Commons License, all supplemental material carries the same license as the article it is associated with.
For non-Open Access articles published, all supplemental material carries a non-exclusive license, and permission requests for re-use of supplemental material or any part of supplemental material shall be sent directly to the copyright owner as specified in the copyright notice associated with the article.