
Abstract
This study explores the effect of waiver school improvement designations on student achievement. In states that received waivers, schools designated for improvement had worse outcomes than undesignated schools (−0.044 SD). The average effect obscures the significant positive effect of the designations in 14 of the 44 states that received waivers. Federal per pupil education funding accounted for half of the effect of waiver school improvement designations on student achievement. These results reinforce the importance of providing additional resources to support school improvement, particularly for post-pandemic school improvement policy.
Introduction
The passage of No Child Left Behind (NCLB) was only possible because of a compromise over the standards used to designate schools for improvement. Paradoxically, NCLB mandated that (1) schools had to reach universal proficiency by 2014 and (2) NCLB was due for reauthorization in 2007 (Klein, 2015a; Olson & Hoff, 2006). This compromise satisfied both policymakers who believed that aspirational goal setting was essential to motivate school improvement and those who believed that transformational changes to schools would occur only after years of investing additional resources (Hoff, 2007; Kamenetz, 2014). Congress failed to reauthorize NCLB on time because of the emergency created by the Great Recession and political polarization (Houston, 2025). In 2011, the Obama administration offered waivers that removed NCLB’s escalating achievement targets. Waivers allowed states to set high but achievable goals, which are necessary for the viability school improvement systems. States without waivers were required to intervene in more schools with less federal funding (Hyslop, 2013; Klein, 2014). School improvement systems were degraded in states without waivers by achievement targets that were unattainable, ambiguous, and inconsistent (Emma, 2013; Klein, 2012b, 2015b).
Successfully implemented school improvement systems in states that received waivers had a small positive effect, but the effect in states with weak implementation that did not receive waivers is unknown. Prior studies relied on the scores used to assign school improvement designations as the forcing variable in a Regression Discontinuity (RD). In Rhode Island, Louisiana, and Michigan, schools that received waiver school improvement designations had outcomes that were indistinguishable from comparable schools that were not designated for improvement (Dee & Dizon-Ross, 2019; Dougherty & Weiner, 2017; Hemelt & Jacob, 2018). In Kentucky, school improvement designations led to sizable positive improvements in both math and ELA test score gaps between marginalized and advantaged students (Bonilla & Dee, 2020). However, in New York, schools that received Priority designations had worse outcomes (Atchison, 2020). Prior research has not explored the effects of school improvement systems in the 39 other states that received waivers or the 7 states that did not receive waivers. Prior research has also not described the distribution of school improvement effects across states or what explains those differences (e.g., resources).
The effects of NCLB’s waivers are particularly salient today because the number of schools designated for improvement is rising due to inattention from Congress. Today, the Every Student Succeeds Act (ESSA) is unlikely to be reauthorized for similar reasons that necessitated waivers for NCLB. High levels of political polarization have led to legislative gridlock (Binder, 2003). Education leaders are primarily focused on implementing nationwide interventions in response to the pandemic rather than school improvement systems that focus on the lowest-performing schools. Additionally, the proportion of schools designated for the most intensive improvement efforts increased rapidly during the pandemic (Bleiberg, 2023). In the 2011–2012 school year (SY), 21.96% of schools were designated for improvement under NCLB, and in the 2019–2020 SY, 24.22% of schools were designated for improvement under ESSA (U.S. Department of Education, 2019, 2021). 1 The Education Department (ED) will likely need to provide states with flexibility due to declining student outcomes (e.g., achievement, chronic absenteeism) in the wake of the pandemic.
Waiver’s Influence on School Improvement Systems
There are several reasons that might explain why school improvement systems would be more effective in states with waivers than in states without waivers. First, waivers can improve student outcomes by providing local policymakers greater flexibility. Federal agencies and departments use waivers to provide flexibility to local governments (Barron & Rakoff, 2013). States vary in their administrative, political, and fiscal capacities to improve schools. In the past, the ED provided flexibility in the form of waivers when it was clear that states could not comply with the law. For example, in 2005, the ED granted waivers to states, allowing the use of growth models because of concerns about the accuracy of summative assessments (Weiss & May, 2012). Waivers increase the level of control that states have over policy (Bowling & Pickerill, 2013; Wong, 2015). From a governance perspective, waivers are an interactional form of federalism in which the President takes power from Congress and returns it to the states (Gais & Fossett, 2005). The removal of regulations could enable states to adopt necessary reforms or interventions. For example, if federal regulations prevent states from implementing effective education policies, waivers freeing states from requirements could benefit students (McMurrer & Yoshioka, 2013). Waivers could have also enhanced school improvement systems if they mitigated harmful NCLB policies. School improvement designations under NCLB were intended to disrupt persistently low school achievement by employing drastic policies, such as firing teachers or principals (Rhim et al., 2007). However, applying pressure to increase test scores decreases teacher commitment and creates barriers to school improvement (Mintrop & Trujillo, 2005).
Second, states with waivers were able to spend more on school improvement systems. States that received waivers designated fewer schools for improvement (i.e., the lowest 15%) than under NCLB (Hyslop, 2013). NCLB also required states to spend 20% of their Title I funding on choice and Supplementary Education Services (SES) (Klein, 2014). States with waivers were able to reapportion 20% on school improvement funding. States with waivers were also permitted to combine several sources of federal funding to support school improvement efforts (e.g., 21st Century Community Learning Centers, Enhancing Education through Technology) (U.S. Department of Education, 2013). States with waivers had more resources to focus on a relatively smaller group of schools with the greatest need for support. Waivers provided states with more school improvement resources and flexibility over how to use those funds, creating additional variation in federal school improvement funding across states. States also took advantage of waiver flexibility to experiment with funding models, which increased the variation in school improvement funding (Karcher & Knight, 2021). School improvement designations that cause schools to receive relatively more funding are likely to result in greater positive effects on student achievement due to increased educational expenditures (Jackson & Mackevicius, 2023). States largely used the same school improvement strategies under NCLB and after receiving a waiver (Hyslop, 2013; Polikoff et al., 2014). The essence of waiver school improvement systems looked very similar to previous efforts under NCLB.
Finally, unattainable, ambiguous, and inconsistent achievement targets undermine school improvement systems in states that did not receive waivers. The underlying theory of school improvement systems depends on achievable, clear, and persistent achievement targets (Manna, 2010; Murphy & Bleiberg, 2019). States designated schools that failed to meet defined goals (e.g., standardized tests), provided resources, and required interventions for designated schools, and then held schools accountable if they were unable to improve. The efficacy of school improvement systems declined in all seven states that did not receive waivers. By the 2010–11 SY, schools in states without waivers were required to meet unrealistic achievement goals to avoid school improvement designations (i.e., 71.9% proficiency in math, 76.9% in ELA). 2 The ED either allowed states without waivers to use very high achievement targets or elected to not sanction states that were out of compliance by withholding federal funding. The ED allowed Iowa, Montana, and Wyoming to freeze their achievement targets while working on passing reforms to bolster waiver applications that were not submitted or rejected (Emma, 2013; Klein, 2012b; McNeil, 2011). The ED chose to not enforce NCLB requirements while negotiating draft waiver applications with a few states (i.e., Nebraska, North Dakota, Vermont) (Klein, 2012a, 2014, 2015b). California’s waiver application was rejected in January 2013, but later, 8 of the largest school districts in the state received a specialized waiver (McNeil & Klein, 2013). Educators in all 7 states that did not receive waivers had to deal with unrealistically high achievement targets and temporary plans that could change substantially during the school year.
Research Questions
This study endeavors to answer two research questions:
Did waivers that lowered achievement targets used to designate schools for improvement influence student outcomes?
Did federal funding mediate the relationship between school improvement designations and student outcomes?
This study makes three main contributions. First, the nationwide scope of the analysis expands upon prior studies that used RD designs to examine waiver designations in a single state context. No prior research has estimated the average effect of waiver designations nationwide. Additionally, this research explores the state level variation in school improvement system designation effects for all 44 states that received a waiver, including 39 states not previously studied in the prior literature. Second, this study demonstrates the importance of resources for the success of federal school improvement systems. Leveraging the variation in waiver designation systems allows for an examination of what explains the heterogeneity in their effects. Third, this study has important implications for contemporary school improvement systems operating under ESSA. The results are relevant for both fixing unexpected issues with school improvement systems created by the pandemic and the overdue ESSA reauthorization.
The first section of results describes the average effect of waiver school improvement designations using meta-analytic regression. Followed by the average effect of implementing waiver school improvement designations on student achievement in a state fixed effects (FE) framework. The internal validity of the state fixed models is established by comparing them to the meta-analytic effect of RD studies conducted in a single state. The next section of results describes the effect of NCLB and waiver school improvement designations on student achievement, measured using summative assessments. Then, using data from every state, the state fixed effects models identify effects by comparing student achievement in schools that were waiver designations to schools that did not receive waiver designations and NCLB designations.
The regression models include covariates that control for the endogenous selection of school improvement designations by including the measures used by states to assign those designations. The Obama administration’s decision to grant waivers to states that adopted their preferred education reforms creates a challenge to identifying causal effects. Contemporaneously, states were incentivized to implement reforms through the Race to the Top program. The inclusion of state-by-year fixed effects accounts for selection bias by controlling for time-varying state education reforms. The results are robust to using proficiency score based outcomes by reproducing the results with achievement data from the National Assessment of Education Progress (NAEP) and ordered achievement counts using Heteroskedastic Ordered Probit models (HETOP).
The final section of results explores why waiver designations did not have uniformly positive effects on achievement. It also describes the heterogeneity in waiver designation effects across states and a mediation analysis to test whether federal per-pupil education spending explains the differences in the effects of waiver designations.
Waiver designations had a small negative effect on student achievement. In states with waivers, achievement in schools designated for improvement was approximately 0.044 SD lower than in schools that were not designated, which differed by only 0.004 SD from prior state studies. The effect of NCLB school improvement designations (−0.034 SD) was slightly less negative than the waiver designations. However, that finding obscures the substantial state level variation in the effects of waiver designations. Waiver designations had a significant negative effect in 24 states and a significant positive effect in 13 states. The variation in effects is partially explained by differences in resources. Federal school funding per pupil explains approximately half of the effect of waiver designations on student achievement.
Data and Measures
Waiver Reform
The data include implemented NCLB and waiver school improvement designations from the 2003–04 SY to the 2014–15 SY. The Obama administration announced that it would offer waivers in September 2011, and the ED issued the first waivers to states in February 2012. The first states to receive a waiver implemented changes to school improvement systems in the 2012–13 SY. Congress passed ESSA in December 2015, and states began implementing changes to their school improvement systems in the 2015–16 SY. 38 states implemented waiver school improvement systems in the 2012–13 SY. 5 more states implemented waiver school improvement systems in the 2013–14 SY, followed by Illinois in the 2014–15 SY (see Figure 1, Panel A). 7 states (i.e., California, Iowa, Montana, Nebraska, North Dakota, Vermont, Wyoming) never received waivers. 3 The strength of this approach is that it avoids conflating waiver implementation with waiver application.
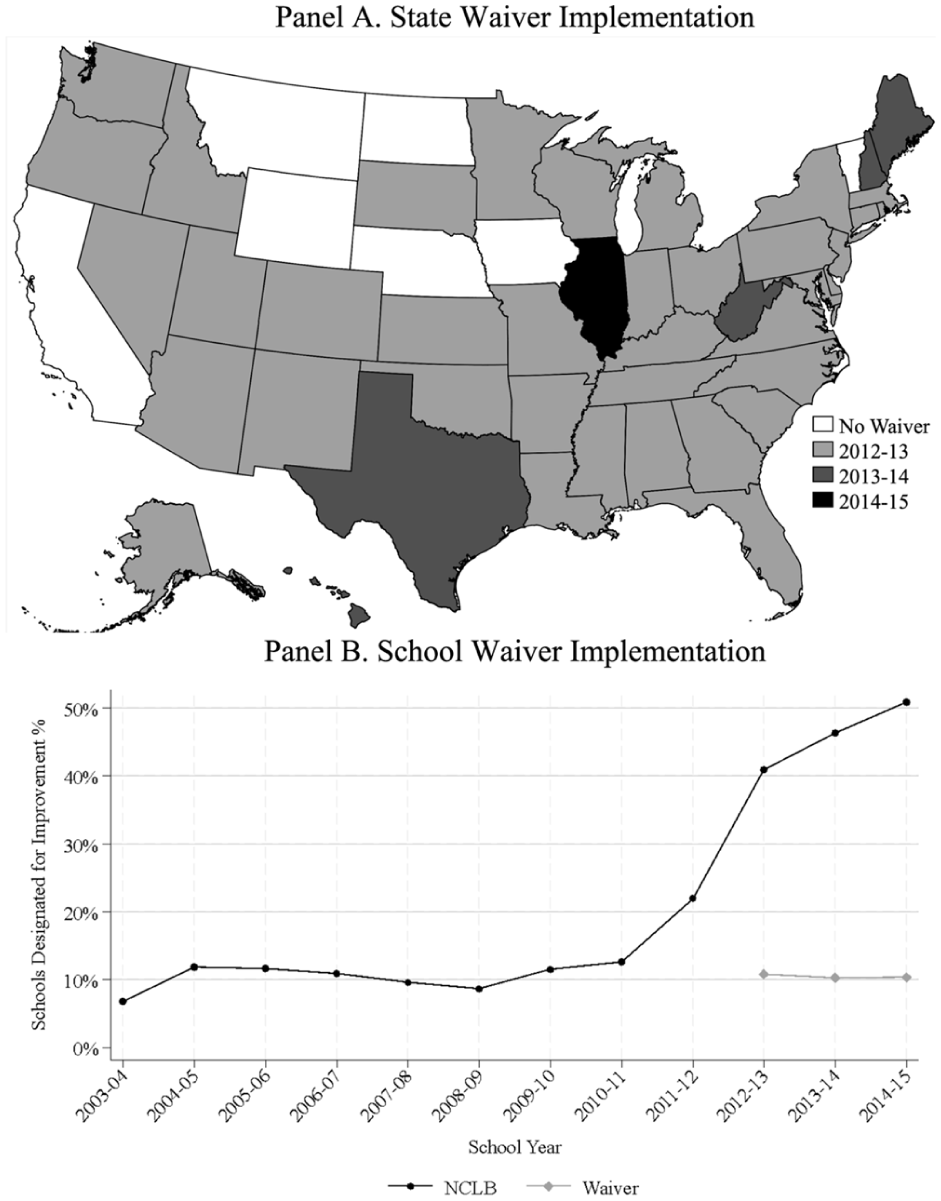
State and school waiver implementation.
States that received waivers designated fewer schools than states operating school improvement systems under NCLB. Figure 1, Panel B, describes the proportion of schools assigned to NCLB and waiver school improvement designations. NCLB required states to raise proficiency targets to 100% by the 2013–14 SY. States were free to decide the rate at which achievement targets would increase over time. Many states chose to rapidly increase their proficiency targets from the 2008–09 SY to the 2013–14 SY. The proportion of schools designated for improvement under NCLB nearly doubled from the 2009–10 SY (11.4%) to the 2011–12 SY (21.96%). Waiver systems designated approximately 10% of schools for improvement, which is a similar level to the first few years under NCLB. In states that did not receive waivers, the proportion of schools designated for improvement continued to increase.
Data on school improvement designations were collected from multiple sources. School improvement designations from the 2004–05 SY to the 2006–07 SY were collected from the National Adequate Yearly Progress and Identification Database (American Institutes for Research, 2009), for the 2003–04 SY and from the 2008–09 SY to the 2010–11 SY from the Consolidated School Performance Report, and from the 2012–13 SY to the 2014–15 SY from EdFacts (U.S. Department of Education, 2019). Waiver implementation is determined by school improvement designations reported by the state. There were five NCLB school improvement designations (i.e., School Improvement Year 1, School Improvement Year 2, Corrective Action, Restructuring Planning, Restructuring) and two waiver designations (i.e., Focus, Priority). School improvement designations are categorized as either non-intensive or intensive based on the level of student outcomes that triggered the label (see Appendix Table A1). NCLB non-intensive designations (i.e., School Improvement Year 1, School Improvement Year 2) were assigned to schools that did not make AYP for at least two consecutive years, and waiver non-intensive designations (i.e., Focus) were assigned to schools with weak achievement (i.e., 6th to 15th percentile). NCLB designations (i.e., Corrective Action, Restructuring Planning, and Restructuring) were assigned to schools that did not meet AYP for at least four consecutive years and waiver non-intensive designations (i.e., Priority) were assigned to the lowest-performing 5% of schools.
Student Achievement
The primary outcome is student achievement data derived from summative tests. Proficiency measures may be unreliable when examining trends over time because they are not normally distributed. Potential measurement error issues are addressed by following Ho (2008) and taking the inverse normal transformation of school level proficiency rates. The resulting data include the percent proficient in math and ELA from the 2004–05 SY to the 2014–15 SY (AIR, 2007; U.S. Department of Education, 2019).
NAEP achievement data and ordered counts of students in achievement categories collected by Oster (2024) are used to demonstrate the results are not due to the limitations of the inverse normal transformation. One challenge inherent in comparing student achievement across states is that states can select and design their own exams and set their own proficiency standards. Therefore, “proficiency” reflects different levels of achievement across states. Additionally, proficiency rates are sensitive to the location of the proficiency cut point; for example, it is considerably more likely that students cross the cut point in the center (i.e., median) of the student achievement distribution rather than a cut point closer to the tails, where fewer students are observed (Ho & Reardon, 2012).
Lagged School Improvement Criteria Controls
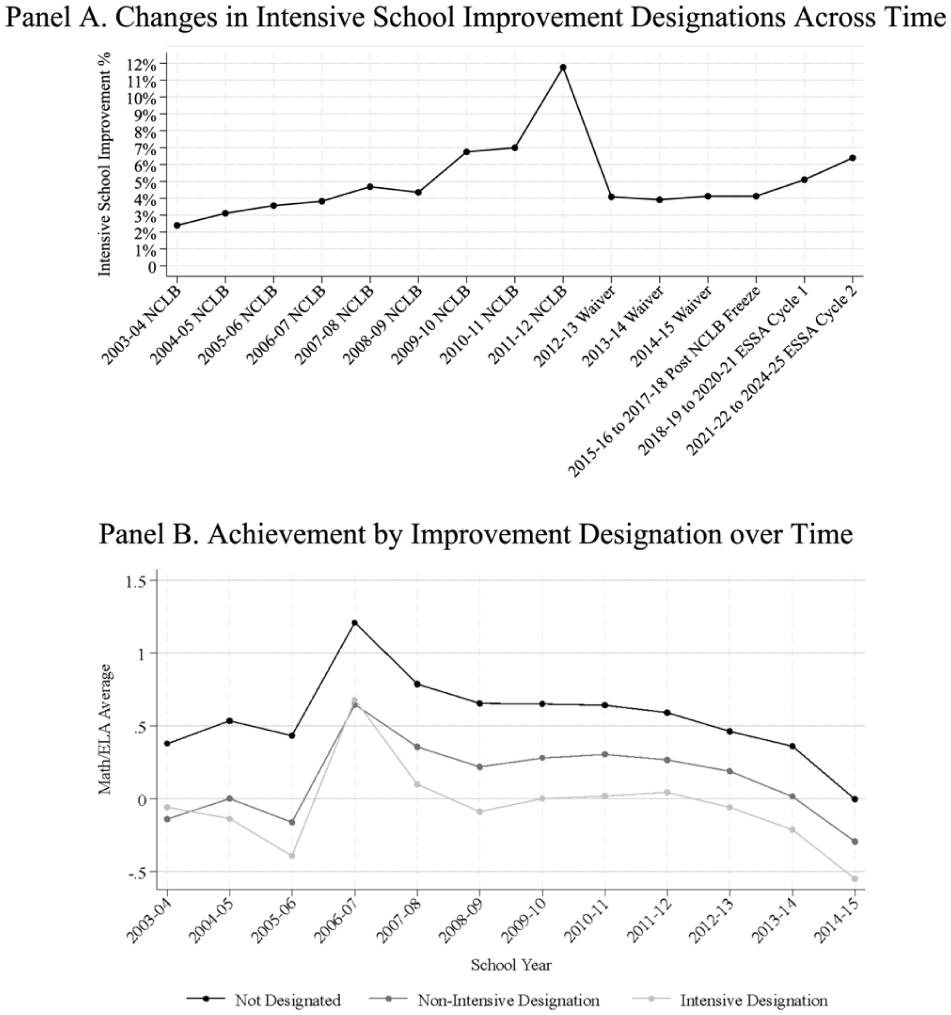
Lagged school improvement criteria exogenously control for differences between schools that were and were not designated for improvement. The lagged school improvement criteria include the measures used by states to determine a school’s improvement designation (e.g., lagged proficiency rates, lagged test participation) (U.S. Department of Education, 2019). The lagged school improvement criteria exogenously predict student outcomes because they are a function of data collected from the prior year. Some states that received waivers shifted away from using proficiency-based measures to designate schools for improvement (e.g., growth measures). The lagged percent proficient is included as a control because it is strongly correlated with the achievement measures that states did use and are a strong predictor of whether a school was designated for improvement. Figure 2, Panel A, shows the proportion of Title I schools designated for intensive school improvement under NCLB, the waivers, and ESSA. There are no clear changes in the relative achievement differences between designated and non-designated schools over time. Lower average achievement for designated schools is expected, given that states used test data to assign improvement designations.
School improvement designations and outcomes across time.
Methods
This study employs an outcome evaluation framework to evaluate the effects of waiver receipt (Kellaghan & Madaus, 2000). The intended objective of school improvement is to rapidly and substantively increase student achievement, as measured by summative assessments (Murphy & Bleiberg, 2019). The stated goal of NCLB, which was unchanged by the waivers, was to “close the achievement gap with accountability, flexibility, and choice, so that no child is left behind” (No Child Left Behind Act, 2002). A secondary goal of the waivers was to allow states to, “Set their own ambitious but achievable terms for closing achievement gaps and ensuring students are proficient in reading and math, instead of meeting the NCLB timeline that requires 100 percent proficiency by 2014” (Slack, 2012). In other words, the waivers were intended to provide states with the flexibility to designate fewer schools for improvement.
Estimation Strategy
The meta-analytic effect of waiver school improvement designations is estimated from prior state specific studies that used a rigorous RD design (Atchison, 2020; Bonilla & Dee, 2020; Dee & Dizon-Ross, 2019; Dougherty & Weiner, 2017; Hemelt & Jacob, 2018). The meta-analytic effect of waiver designations from prior studies is used to evaluate the validity of the FE estimates. The validity of the fixed effects estimates is augmented to the extent that it is similar to prior RD studies.
Next, the effect of waiver designations on student achievement are estimated in a FE framework. The model assumes the following general form:

where y is the standardized school proficiency rate (i.e., math, ELA, average of math/ELA) for school i, state s, and year t. WaiverSIist is a binary variable equal to one if school c has been designated for improvement under a waiver system (i.e., focus, priority) in year t and zero otherwise. NCLBSIist is a binary variable equal to one if school c has been designated for improvement under NCLB (e.g., school improvement year 1, restructuring) in year t, and zero otherwise. β
1
is the average difference in achievement outcomes for schools that received waiver designations compared to schools that were not designated for improvement.
In subsequent models, state-by-year fixed effects are added to control for selection bias from other education reforms incentivized by waiver receipt. The Obama administration explicitly considered the education reforms that states adopted when granting waivers (Wong, 2015). To receive a waiver, states had to comply with four principles: (1) College- and Career-Ready Expectations for All; (2) State-Developed Differentiated Recognition, Accountability, and Support; (3) Supporting Effective Instruction and Leadership; and (4) Reducing Duplication and Unnecessary Burden (U.S. Department of Education, 2011). Typically, states made changes to their school improvement systems immediately after receiving their waivers, while other reforms (i.e., Common Core, teacher evaluation) took several years to adopt and implement (Wong, 2015). States demonstrated compliance with waiver guidelines by adopting the Obama administration’s preferred education reforms (e.g., content standards, teacher evaluation, principal evaluation). Additionally, Race to the Top was contemporaneous with waiver receipt and led states to implement education reforms (Howell & Magazinnik, 2017). The state-by-year fixed effects control for any time-varying state characteristics, including the implementation of education reforms incentivized by federal policy (i.e., Race to the Top, waivers).
The results are robust to the use of multiple measures of student achievement that are unaffected by differences in proficiency standards and sensitivity to cut points. The effect of waiver designations using transformed proficiency scores is similar to the results from models that use the NAEP and achievement from HETOP. The student level NAEP achievement data uses the same assessment and cut points, which supports valid comparisons across states and time. Similarly, the HETOP procedure was designed to create comparable achievement estimates across states and time using counts of students in ordered achievement categories (e.g., basic, proficient, advanced) (Ho & Reardon, 2012). The transformed proficiency rates were used in the main results because they are available nationally at the school level over time.
Finally, the variation in the effects of waiver designations across states are described, and tests are conducted to determine whether federal per-pupil education spending explains this heterogeneity. Prior state specific studies obscure how the effects of waiver designations vary across states. Equation (1) is modified to estimate state specific waiver designation effects, which have been demonstrated to validly replicate previous state RD studies. A mediation framework is used to examine the extent to which federal per pupil education spending explains the variation in waiver designation effects. If waiver designation effects are explained by federal education spending, then it suggests that spending, rather than the intervention, is the salient policy feature.
Results
Meta Analysis
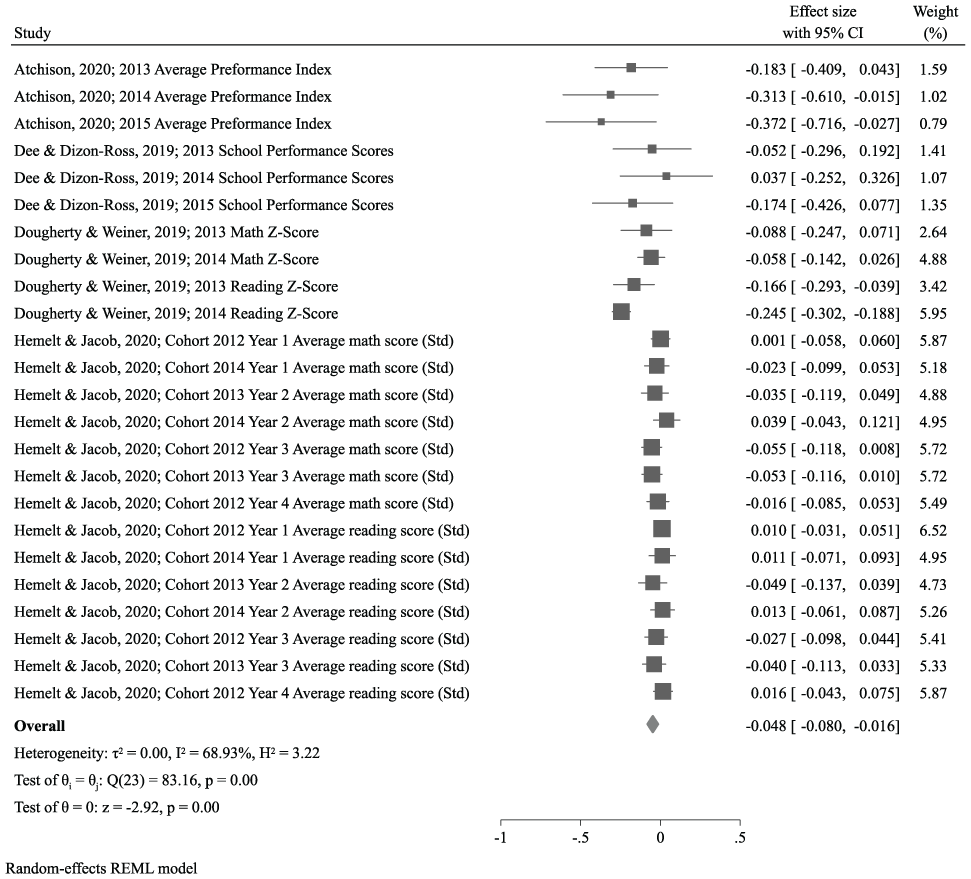
Previous studies have shown that waiver designations have a small negative effect. Each row in Figure 3 describes waiver designation effects for a subject-grade-cohort. Including subject-grade-cohort-specific effects increases the power to detect effects compared to previous meta-analyses of school turnaround (Redding & Nguyen, 2020; Schueler et al., 2022). 4 Using restricted maximum likelihood estimation, the meta-analytic effect of waiver designations was small and negative (−0.048 SD). The meta-analysis includes results from previous studies that estimated the effects of waiver designations in Michigan, Louisiana, Rhode Island, and New York (Atchison, 2020; Dee & Dizon-Ross, 2019; Dougherty & Weiner, 2017; Hemelt & Jacob, 2018). The results from Kentucky (Bonilla & Dee, 2020) were excluded because the primary outcomes are achievement gaps rather than school averages. The meta-analysis using the results from the RDs likely captures the true average effects of waiver designations. It also obscures the unobserved heterogeneity in states that were not examined in prior studies.
Meta-analysis of waiver designations.
Internal Validity
The similarity of the results in the state FE model to the average of the effects from the RD models bolsters the internal validity of the estimation strategy. Figure 4 describes the effects of waiver designations from state FE models with lagged school improvement criteria controls, where the sample is restricted to the states included in the meta-analysis (i.e., Rhode Island, Michigan, New York, Louisiana). Waiver designations had a larger negative effect on math (−0.065 SD) than on ELA (−0.034 SD). Waiver designations decreased average math and ELA achievement by 0.052 SDs, which differs by only 0.004 SD from the meta-analysis. The similarity of the state FE and RD results suggests that it is possible to validly estimate the effect of waiver designations throughout the country and within each state.
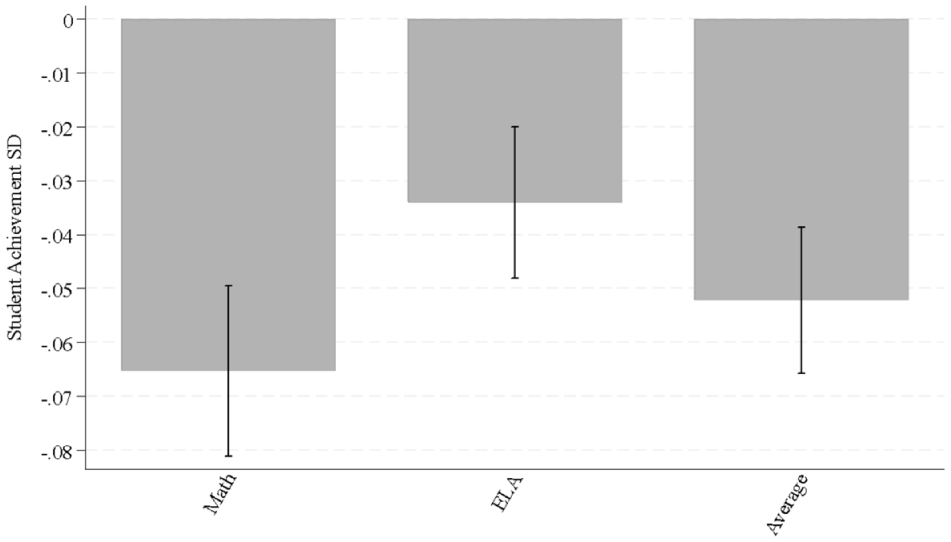
Replication of waiver effects in previous research.
State Fixed Effects
Waiver designations harmed student achievement on average and nationwide. Figure 5 describes the effects of NCLB and waiver school improvement designations on student achievement (i.e., math, ELA, average). The results in Figure 5 were estimated using state FE and lagged school improvement criteria controls. Each describes the effects of NCLB or waiver school improvement designations compared to schools that were not designated for improvement. The bars and corresponding confidence intervals also describe whether the effects of waiver designations are significantly different from designations under NCLB. Waiver designations decreased average achievement by 0.044 SD. The size of the decrease was similar for both math (−0.039 SD) and ELA (−0.045 SD). Waiver designations had significantly worse effects than NCLB on math and average achievement. However, the difference in effects across policy regimes is small in magnitude (approximately 0.01 SD). The schools that received waiver designations were worse off than schools that did not receive designations and schools that were designated under NCLB.
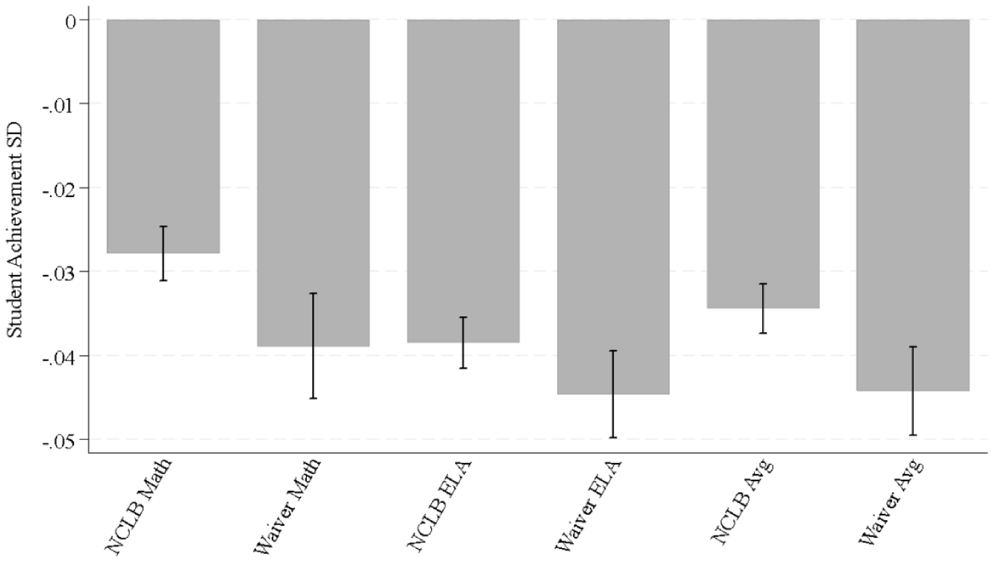
NCLB and waiver school improvement designation effects on achievement.
Robustness Checks
State-by-Year Fixed Effects
The average negative effect of waiver designations is robust to controlling for contemporaneous education policies that are correlated with waiver receipt. Appendix Figure A1 describes models that add state-by-year FE to the main specification (see Figure 5). The inclusion of state-by-year FE appears to control for some sources of confounding variation. The estimated effect is approximately 0.02 SD smaller than the primary estimation strategy in Figure 5, which includes only state and year FEs. After the inclusion of the state-by-year FEs, waiver designation effects remained small and negative (math = −0.0266 SD, ELA = −0.0257 SD). Robustness to controlling for time-varying characteristics is expected, given what is known about policy changes before and after states received waivers. States immediately changed their school improvement systems after receiving waivers. However, the implementation of other policies that states were required to implement in return for a waiver often took several years (e.g., Common Core, teacher evaluation) (Wong, 2015). Changes to school improvement systems after waiver receipt resulted in fewer designated schools and reduced workload for states. Other reforms mandated in return for waiver receipt required large investments in state resources (e.g., fiscal, human capital). Waiver designation effects were robust to the inclusion of state-by-year FE, which provides strong evidence that other education reforms mandated in return for waivers are not biased by the effect of interest.
Alternative Definitions of Student Achievement
Differences in the threshold for proficiency on state tests do not explain the negative effect of waiver designations. A potential concern with using school level proficiency data is that achieving proficiency is not equally difficult in all states (Reardon & Ho, 2015). If states changed their definition of proficiency at the same time that they received their waiver, then it would confound the effect of school improvement designations. To demonstrate that changes to proficiency thresholds do not bias the estimated waiver designation effect, the results are replicated in the restricted use student-level NAEP, which uses a uniform definition of proficiency. Appendix Figure A2 shows that the effect of waiver designations is robust when using the NAEP data. The results from Appendix Figure A2 use four subject/grade NAEP datasets (i.e., 4th grade math, 8th grade math, 4th grade reading, 8th grade reading) over the six odd numbered school years from the 2004–05 SY to the 2014–15 SY. The student level NAEP data also include exogenous controls for student characteristics (i.e., gender, whether the student has an Individualized Education Plan, Limited English Proficiency status, eligibility for Free or Reduced-Price Lunch, race/ethnicity, modal age for grade). The model in Appendix Figure A2 adds student covariates to the specification in Figure 5. Waiver designations had a small negative effect on math NAEP scores (−0.054 SD) and ELA NAEP scores (−0.063 SD). Waiver designations decreased average NAEP achievement by 0.059 SD, which is 0.015 SD different from the state fixed effects models (see Figure 5, Column 3). The NAEP results suggest that differences in state proficiency standards do not confound the effect of waiver school improvement designations on student achievement.
The results are robust to the limitations of proficiency scores by using achievement estimates from HETOP models. Appendix Figure A3 replicates the main results in Figure 5, but exchanges the transformed proficiency scores for achievement estimates from HETOP models. The HETOP model estimates use the counts of students in ordered achievement categories from Oster (2024). HETOP achievement estimates in math and ELA were available for 13 states in 2011–12, 13 states in 2012–13, 15 states in 2013–14, and 34 states in 2014–15. The effects described in Appendix Figure A3 using HETOP achievement differ from the main estimates in Figure 5 by 0.0281 SD in ELA, 0.0085 SD in math, and 0.0065 SD in average achievement. The results from the models with HETOP outcomes combined with the NAEP results provide additional evidence that differences in proficiency standards and cut points do not explain the main results.
Extensions
State Heterogeneity
The effect of waiver designations varies considerably across states. Appendix Figure A4 shows the effect of waiver designations in all 44 states that implemented waivers. State effects are estimated by replacing the main treatment indicator with a series of binary variables equal to 1 if a school was designated for improvement under a waiver system in state s, and 0 otherwise. States where waiver designations had negative effects are denoted by light gray bars, and states with positive effects are denoted by dark gray bars. There are approximately twice as many states in which waiver designations had a significant negative effect (24 states) compared to those with significant positive effects (13 states). However, in 7 states, waiver designations increased student achievement by at least 0.10 SD. Positive effects greater than 10% of a standard deviation reform are fairly large compared to similar reforms under NCLB (Redding & Nguyen, 2020; Schueler et al., 2022). The average small negative effect of waiver designations masks the positive effects in several states.
Mediation Analysis
Differences in federal education spending partially explain why the effects of waiver designations varied across states. The results in Appendix Figure A5 describe the test for whether federal per pupil education spending mediates the effect of waiver designations on average achievement. The mediation analysis was conducted in a Structural Equation Modeling framework with a specification that parallels the primary estimation strategy (Mize, 2024). Schools assigned waiver designations received about $226 more per pupil than schools that were not designated (see Appendix Figure A5, Path a). A spending increase of that size implies an achievement increase of 0.007 SD over 4 years (Jackson & Mackevicius, 2023). The total effect of waiver designations on average student achievement was −0.39 SD (see Appendix Figure A5, Path c). After controlling for federal education funding per pupil, the effect of waiver designations attenuates to −0.19 SD (see Appendix Figure A5, Path c’), and the effect of federal spending on average student achievement is substantively insignificant (see Appendix Figure A5, Path b). 5 The Sobel-Goodman mediation test is statistically significant (p < .001) and suggests that federal per pupil education spending explains about half (49.9%) of the waiver designation’s effect. The remaining differences in achievement are likely explained by non-federal resources and capacity for school turnaround (Murphy & Bleiberg, 2019). 6
Waivers provided states with additional flexibility to spend federal Title I funds on school improvement. Under NCLB, states were able to spend 7% of Title I funds on school improvement, but states with waivers were able to spend 27% of Title I funds on school improvement (Klein, 2014). School level Title I is not available during the period of study. Appendix Figure A6 uses state level Title I data to conservatively estimate the differences in federal school improvement funding available to states with and without waivers from SY 2012–13 to SY 2014–15. States with and without waivers can prioritize which schools receive Title I improvement funds. With state data, it is only possible to estimate school improvement funding by assuming that states divide federal funding equally among all schools designated for improvement and among schools designated for intensive improvement. Each bar in Appendix Figure A6 describes the approximate Title I funding that states could spend on school improvement (i.e., 7% under NCLB, 27% under waivers) divided by the enrollment in any school designated for improvement and schools designated for intensive improvement. States without waivers have access to less federal funding and more students in schools identified for improvement due to high achievement targets. The second bar from the left in Appendix Figure A6 shows that states without waivers had access to $2.5 per enrolled student in schools designated for intensive improvement. The third and fourth columns in Figure A6 show that states with waivers could spend $81.4 per student in schools identified for improvement and $43.9 per student in schools identified for intensive improvement, respectively. An important limitation of Appendix Figure A6 is that it does not consider additional stimulus funds for school improvement or non-Title I grants that states with waivers could use for this purpose. States with waivers may have had even more per pupil federal school improvement funding than states without waivers. While precisely estimating the exact difference is challenging due to data limitations, states with waivers had more school improvement resources than states without waivers.
Discussion
This study uses several strategies to estimate the effect of waiver designations. The meta-analysis demonstrates that the primary estimation strategy (state fixed effects with lagged school improvement criteria controls) yields results similar to the RD models. The state-by-year fixed effects control for endogeneity from the procedure used to designate schools for improvement. Finally, the NAEP analyses corroborate that the null results are not a function of differences in proficiency standards. Together, each strategy presents a coherent set of results and accounts for plausible confounding factors.
The effects of waiver designations are relevant for policymakers today. Waiver designations decreased student achievement by approximately 0.044 SD. A nationwide analysis showed that waiver designations had a positive effect in 13 states and a negative effect in 24 states. The analysis resolves the incongruous results of prior state specific waiver school improvement designation studies. Meta-analyses have found considerable variability in the effects of school improvement reforms (Redding & Nguyen, 2020; Schueler et al., 2022). Previous waiver school improvement system studies conducted in specific states found a mix of positive and negative effects (Atchison, 2020; Bonilla & Dee, 2020; Dee & Dizon-Ross, 2019; Dougherty & Weiner, 2017; Hemelt & Jacob, 2018). Waiver designations had negative effects in about half of states, but positive effects in about a quarter of states. The variation in the effectiveness of waiver designations is partially explained by federal per-pupil school funding. The results suggest that a key enabling factor for the success of improvement systems is providing resources to designated schools.
Policy Recommendations
The lack of attention from Congress to ESSA reauthorization underscores the need for school improvement systems to be robust against unexpected changes. Today, as student outcomes have declined since the pandemic, policymakers face the prospect of an increasing number of schools being eligible for improvement designations (Bleiberg, 2023). School improvement systems are brittle because they use relative rather than normative measures of student achievement.
Most school improvement systems designate a proportion of schools at the bottom of the test score distribution for improvement (i.e., normative). A better approach would be to assess whether students acquire the skills prescribed by academic standards. A new system could also consider summative assessments without measures of student outcomes (e.g., formative assessments, student learning objectives, portfolios, student/parent surveys).
A new approach to school improvement that emphasizes infusing resources and supports rather than sanctions is needed. One path to achieving this goal would be to increase investments in Title I programs and expand eligibility criteria by including all marginalized students (e.g., non-White, unhoused, migrant) rather than only students from economically disadvantaged families. In cases of chronically low achievement, states should invest in comprehensive school improvement models that include multi-year investments (Borman et al., 2003; Sun et al., 2017).
States have operated school improvement systems for half a century, which is unlikely to change due to federal inaction. Congress is unlikely to reauthorize ESSA, in part because of political polarization (Klein, 2025). The delayed reauthorizations of NCLB and ESSA further confirm the challenges faced by the federal government when implementing top down education reforms (Elmore, 2004; Manna, 2006). Waivers will likely be needed in the future to account for the unexpected effects of the pandemic. Under ESSA, schools assigned the most intensive improvement designation in the 2017–18 SY must substantially improve their pre-pandemic achievement to exit that status. State initiated waivers offer a potential solution to address political inaction and to implement needed reforms. The ESSA restricted the Secretary of Education’s authority to issue waivers (Klein, 2014). However, the ED maintains the ability to approve changes to school improvement systems proposed by states. States submit dozens of requests each year for flexibility (U.S. Department of Education, 2025). State leaders should proactively pursue waivers to safeguard school improvement systems.
Footnotes
Appendices
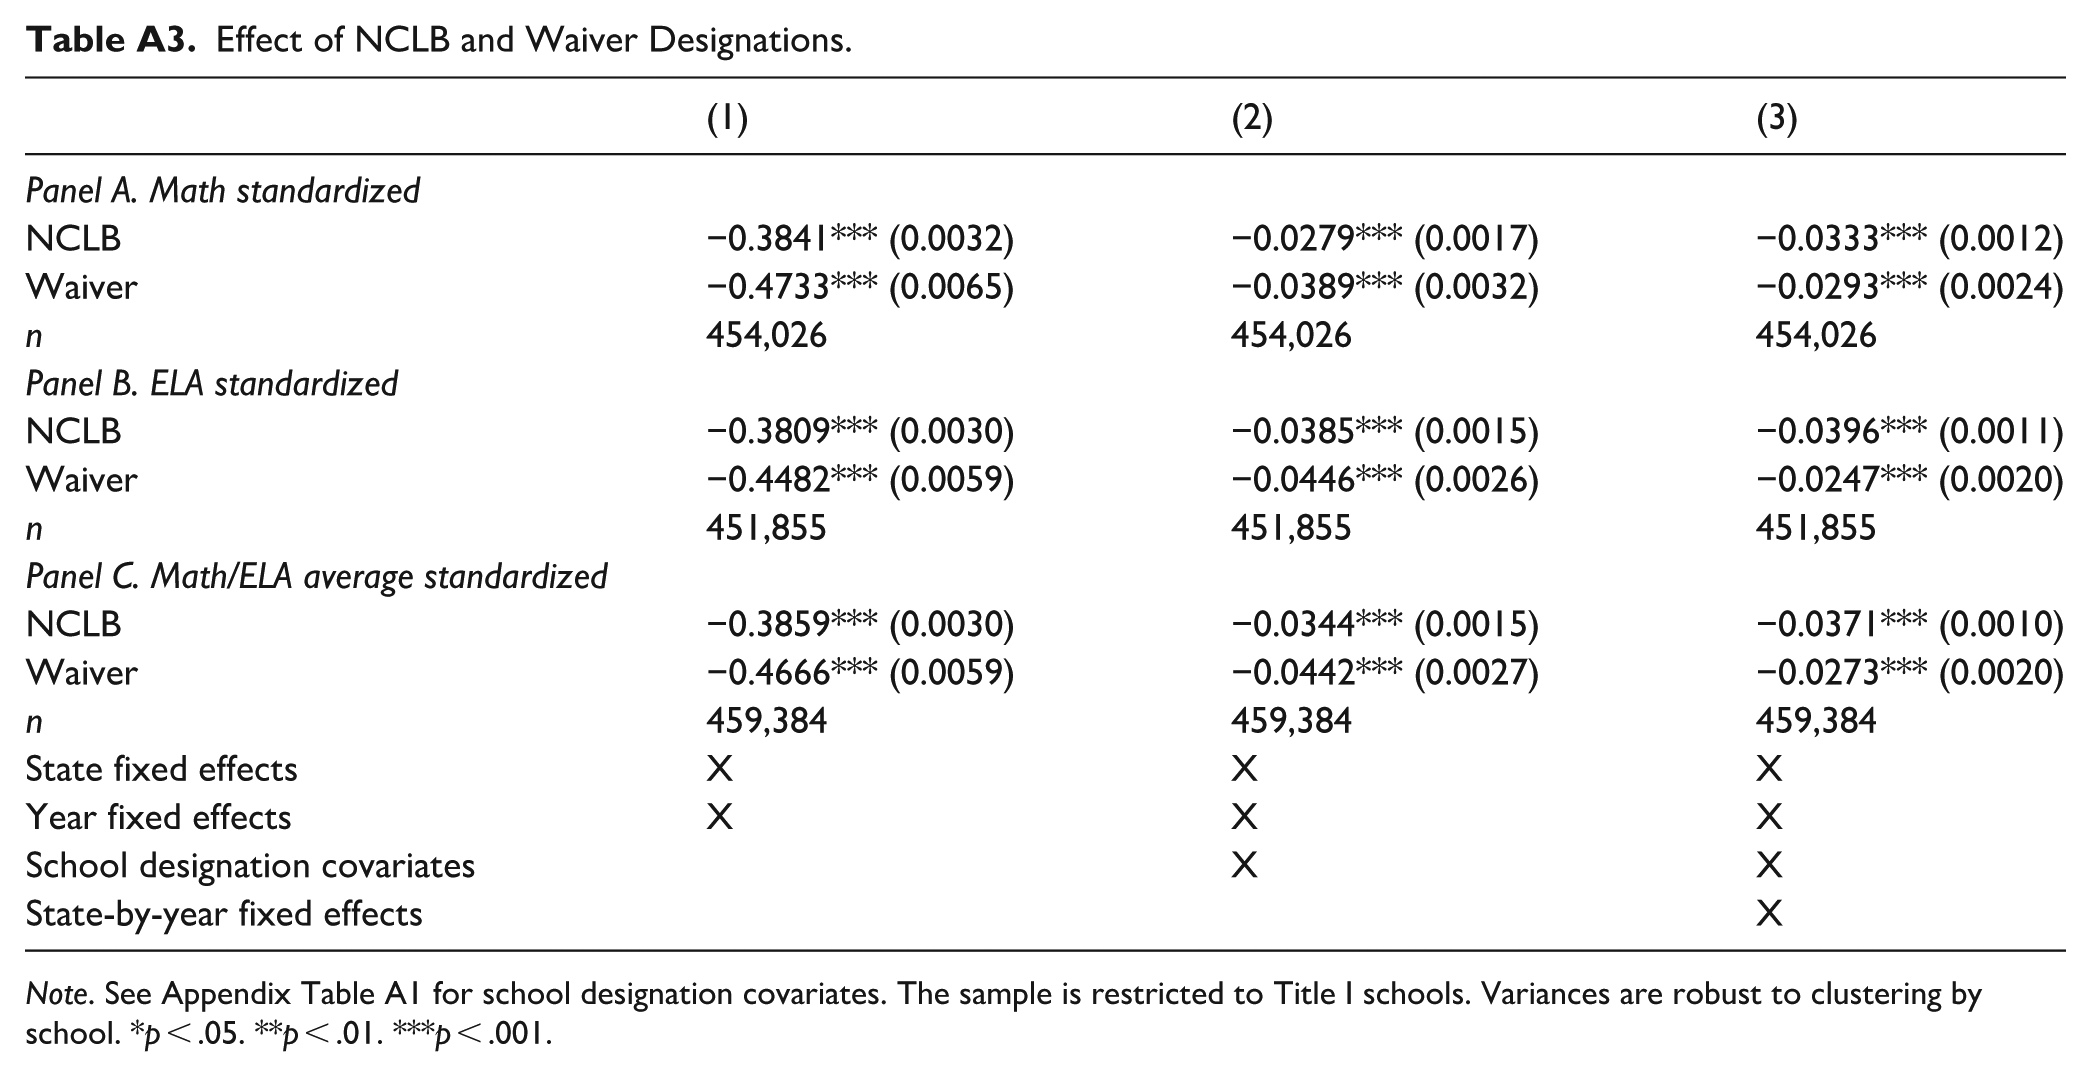
Effect of NCLB and Waiver Designations.
| (1) | (2) | (3) | |
|---|---|---|---|
| Panel A. Math standardized | |||
| NCLB | −0.3841*** (0.0032) | −0.0279*** (0.0017) | −0.0333*** (0.0012) |
| Waiver | −0.4733*** (0.0065) | −0.0389*** (0.0032) | −0.0293*** (0.0024) |
| n | 454,026 | 454,026 | 454,026 |
| Panel B. ELA standardized | |||
| NCLB | −0.3809*** (0.0030) | −0.0385*** (0.0015) | −0.0396*** (0.0011) |
| Waiver | −0.4482*** (0.0059) | −0.0446*** (0.0026) | −0.0247*** (0.0020) |
| n | 451,855 | 451,855 | 451,855 |
| Panel C. Math/ELA average standardized | |||
| NCLB | −0.3859*** (0.0030) | −0.0344*** (0.0015) | −0.0371*** (0.0010) |
| Waiver | −0.4666*** (0.0059) | −0.0442*** (0.0027) | −0.0273*** (0.0020) |
| n | 459,384 | 459,384 | 459,384 |
| State fixed effects | X | X | X |
| Year fixed effects | X | X | X |
| School designation covariates | X | X | |
| State-by-year fixed effects | X | ||
Note. See Appendix Table A1 for school designation covariates. The sample is restricted to Title I schools. Variances are robust to clustering by school. *p < .05. **p < .01. ***p < .001.
Acknowledgements
Thanks to my disseration committee chair Dr. Jason Grissom and committee members Drs. Joseph Murphy, Carolyn Heinrich, and Andrew Ho. This work would not have been possible without their guidance and support. I am grateful to the feedback from Drs. Shaun M. Dougherty and Erica Harbatkin.
Funding
The author received no financial support for the research, authorship, and/or publication of this article.
Declaration of Conflicting Interests
The author declared no potential conflicts of interest with respect to the research, authorship, and/or publication of this article.