
Abstract
Research shows that concurrent and sequential self-administered mixed-mode designs both have advantages and disadvantages in terms of panel survey recruitment and maintenance. Since concurrent mixed-mode designs usually achieve higher initial response rates at lower bias than sequential mixed-mode designs, the former may be ideal for panel recruitment. However, concurrent designs produced high share of paper respondents relative to web respondents. Since these paper respondents have been found to be at higher risk of attrition, cause higher data collection costs, and slow down the fieldwork process, sequential mixed-mode designs may be more practical in the regular course of the panel study after recruitment. Our study provides experimental evidence on the effect of switching a panel study from concurrent to sequential mixed-mode design after the panel recruitment. Results show that this switch significantly increases the share of online respondents without harming response rates. Respondents who are pushed to the web by the design change differ significantly from respondents who continue to participate via paper questionnaires with regard to a number of socio-digital inequality correlates. This suggests that, while the share of online respondents can be increased through mode sequencing, keeping the paper mail mode option is vital for ensuring continued representation of societal subgroups.
Recent years have seen an increase in the use of mixed-mode design strategies in both cross-sectional (see, e.g., Asimov & Blohm, 2024; Wolf et al., 2021) and longitudinal surveys (see, e.g., Burton et al., 2020). Reasons for this development include declining response rates and increasing costs of many single-mode surveys as well as the rise of the internet to a global mass medium (see, e.g., De Leeuw et al., 2018; Schonlau & Couper, 2017). According to Eurostat (2022), 93% of households across the European Union (EU) had internet access in 2022, compared to only 53% in 2007. Moreover, 84% of EU citizens between ages 16 and 74 used the internet every day in 2022, compared to 54% in 2011. The omnipresence of the internet in many lives helps explain the success of online surveys in providing critical data in a speedy manner during the COVID-19 pandemic (see, e.g., Cornesse, Krieger, et al., 2022; Kreuter et al., 2020).
Despite the steep rise in internet access and use, it should be acknowledged that a non-negligible part of the population still refrains from using the internet or feels uneasy with certain digital tasks, such as providing survey data online. Reasons for this can be structural disadvantages related to internet access and skills or personal choices regarding internet use and attitudes (see Helsper, 2021). In Germany, 17% of people between 65 and 74 had never actively used the internet in their life by 2022 and are thereby excluded from digital information and public services (see Statistisches Bundesamt, 2023). Moreover, many people use the internet selectively for certain tasks, either by choice or due to a lack of skills in a particular area. For example, the vast majority of people in Germany use the internet to send and receive email (80%), but only half the population is active on social media (48%) or engages in online banking (49%, see Statistisches Bundesamt, 2022).
Regarding data collection, research shows that non-internet users are often willing to participate in surveys if they are given the chance (see, e.g., Blom et al., 2017), in particular if they are offered an alternative participation mode (see, e.g., Bosnjak et al., 2016). Moreover, even among internet users, a significant proportion prefers to be surveyed offline rather than online (see, e.g., Bosnjak et al., 2018). These findings indicate that it may be useful to mix traditional offline and faster, more cost-efficient online modes for survey data collection (for a critical discussion, see, e.g., Couper, 2017). This notion is supported by studies which show that mixing modes can indeed increase response rates and reduce bias as well as costs and speed up fieldwork processes (see, e.g., Luiten et al., 2020). This is particularly true when comparing self-administered mixed-modes to online-only surveys (see, e.g., Cornesse & Bosnjak, 2018), but may also apply in comparison to face-to-face surveys, at least in some countries (see Luijkx et al., 2021 for a cross-national evaluation).
While many options for mixing self-administered modes exist, two strategies are particularly prevalent: (a) concurrent mode designs, in which participants are simultaneously offered an offline and an online survey option, and (b) sequential push-to-web designs, in which survey participants are asked to respond online and only nonrespondents are followed up with a choice of offline and online survey options (see Dillman, 2017). In our experimental study, we explore the consequences of switching from a concurrent to a sequential push-to-web mixed-mode design in a longitudinal panel survey for budgetary reasons.
Theory and Previous Research
In this section, we derive hypotheses on how switching from concurrent mode to a push-to-web design after recruitment may impact a self-administered panel study based on theoretical considerations and the existing relevant literature. To our knowledge, no study has as yet explored such a design change. Hence, we rely on considerations regarding concurrent versus sequential designs in cross-sectional studies, other types of changes to survey mode designs in panel studies, and existing knowledge about offline versus online respondents.
Concurrent Versus Sequential Mixed-Mode Designs
Social exchange theory proposes that the more options for addressing different preferences are offered in a request, the stronger will a person’s wish be to comply (see, e.g., Dillman, 2011). For mixed-mode surveys, this may mean that offering all available survey modes directly in the survey invitation (i.e., concurrent mode design) rather than withholding a mode (i.e., sequential mode design) will be beneficial for respondents’ participation likelihood. This should be particularly true for respondents who perceive the burden of participating online as relatively high (i.e., cost dimension of social exchange) or who are concerned about providing data online (i.e., trust dimension of social exchange). Switching from a design with direct access to the maximum available number of participation options from the start to a design with initially fewer options should consequently decrease panel participants’ willingness to continue responding.
The reasoning is in line with the leverage-salience theory of survey participation (see Groves et al., 2000), which suggests that adding the offline mode option to the survey request from the start will increase the perceived importance of the survey (i.e., the offline mode provides more “leverage” to the request). This leverage is smaller in sequential push-to-web designs, because fewer options are provided. Consequently, the perceived importance of participating in the panel may decrease when switching from concurrent mode to push-to-web.
These considerations are supported by empirical evidence. The majority of research on cross-sectional self-administered surveys shows that push-to-web designs maximize cost-efficiency while concurrent mode designs maximize response rates and minimize bias (for an overview, see De Leeuw, 2018).
Mode Switch in Panel Studies
Leverage-salience theory also provides a framework for thinking about the development of mode choices among respondents when being switched to a sequential push-to-web design. By making the online mode more prominent (and thus more salient to most respondents), respondents may be more inclined to use it. This consideration is in line with previous research, which shows that pushing respondents to the web significantly increases the share of online respondents among all respondents, thus ensuring lower data collection costs (see Holmberg et al., 2010; Mauz et al., 2018; Millar & Dillman, 2011; Patrick et al., 2018; Wolf et al., 2021). A competing interpretation of leverage-salience theory could, however, be that the concurrent design acknowledges that the different modes appeal to different people and offering both is making both salient. Following this interpretation of the theory, the concurrent mode design should then have a wider appeal than the sequential mode design.
To our knowledge, no study so far has investigated switching a panel study from a concurrent to a sequential self-administered mixed-mode design. However, Cornesse and colleagues (2022) as well as Christmann and colleagues (2024) showed in experimental studies that concurrent mode panel recruitment surveys achieved higher response rates than sequential mode recruitment surveys, but this initial advantage does not persist after recruitment. This may in part be due to the fact that the additional effort of having to send the paper surveys back via postal mail is a barrier to continued participation in this mode (for longitudinal evidence of higher attrition rates among paper versus online respondents, see also Cornesse & Schaurer, 2021a and Cornesse & Schaurer, 2021b). Encouragingly, Bretschi et al. (2023) found that a significant share of panel respondents who previously participated via paper mail-back questionnaires can be converted to the online mode for at least one survey wave by offering mode conversion incentives. These results suggest that a significant share of offline respondents both generally use the internet and would be willing to provide survey data online given the right circumstances.
This is in line with experimental research on switching panels conducted in the face-to-face data collection mode to mixed-mode designs. Most evidence suggests that the design change decreases response rates (see, e.g., Jäckle et al., 2015; Lynn, 2013). Moreover, these studies show that some population subgroups (e.g., younger people, urban dwellers, highly educated people) are more likely than others to take up the online survey option for all or at least some panel data collection waves subsequent to the design change (for an analysis of web participation patterns, see, e.g., Cernat & Sakshaug, 2021).
Offline Versus Online Respondents
To understand the impact of switching a panel study from a concurrent to a sequential push-to-web design, it is crucial to also examine who the people are who participate online, and whether societal subgroups may react differently to the design change. As a framework, it may be beneficial to view online versus offline survey participation as an expression of digital inequality. Digital inequality manifests in differences in access, skills, and use of information and communication technologies (ICTs, see Scheerder et al., 2017).
According to Helsper’s (2012) corresponding fields model, inequalities in the online and offline world mutually influence one another. For example, highly educated people may find it easier to develop strong ICT skills and these skills may help them to improve their education (e.g., through educational resources offered on the internet). In that sense, access, skills, and use of ICTs are both cause and effect of people’s available general economic, cultural, social, and personal resources (see Helsper, 2021). Consequently, barriers to participate in a survey online should be higher for people with fewer resources in the offline world. This is in line with the common finding that offline respondents in mixed-mode surveys often have lower socio-digital status (Herzing & Blom, 2019).
Based on the theoretical considerations and literature outlined above, we derive the following hypotheses for our panel survey setting:
Respondents will be more likely to respond to a survey if they remain in the concurrent mode design rather than being pushed to the web.
Respondents will be more likely to participate in a survey online rather than via paper mail-back questionnaire when they are pushed to the web than if they remain in the concurrent mode design.
Compared to people with lower socio-digital status, people with higher socio-digital status will be… H3.1: … more likely to participate online from the start. H3.2: … more likely to switch from the offline to the online mode of data collection. H3.3: … less likely to become survey wave nonrespondents.
Data
The data for our analyses come from an experiment implemented in the second wave of the German Social Cohesion Panel (SCP, see Gerlitz et al., 2024). The SCP was recruited in 2021. It is based on a sample of individuals drawn from German population registers. The sampling process consisted of two stages: First, municipalities in Germany were sampled proportional to their population size, but with an oversampling of municipalities in Eastern Germany. Second, individuals were drawn from the municipalities’ population registers. All sampled individuals were contacted via postal mail, surveyed, and asked for their consent to be re-surveyed as panel members. Moreover, all sampled individuals who responded to the survey (from hereon referred to as “anchor persons” or APs) were asked to provide the names of all of their household members aged 18 and older (from hereon referred to as “household members” or HMs). The reported HMs were also contacted via postal mail, surveyed, and asked for consent to be re-surveyed. Due to this recruitment strategy, the SCP consists of individuals nested in their household contexts.
The initial recruitment survey is referred to from hereon as part one of wave one (W1P1). This is because due to the questionnaire space needed for panel consent questions and other recruitment features, the first panel survey wave was split into two parts. W1P1 was conducted from September 2021 to April 2022. The second part of wave 1 (W1P2) followed successively with those respondents who had completed W1P1 and provided panel consent from December 2021 to July 2022. Respondents were invited to W1P2 approximately 3 to 6 months after they had participated in W1P1. Fieldwork for the second wave (W2) of the SCP was conducted from September 2022 to January 2023. In W2, respondents were again invited in tranches with those who had participated early in W1P2 being the first to be invited to W2 and those who had participated late in W1P2 also being invited later during fieldwork. At each measurement time point, respondents received a 10€ cash incentive conditional on their participation together with a letter of appreciation. At W1P1, APs additionally received a 5€ unconditional cash incentive with their invitation letters to ensure that panel recruitment would be successful.
Overall, 43,819 people were invited to W1P1. Of those, 37,874 were APs drawn from the population registers and 5,945 were HMs reported by the APs. 17,027 individuals participated in W1P1 (13,053 APs and 3,974 HMs; 38.86% of all those invited). Of these, we excluded four from the analysis sample because they were younger and therefore did not fall within the defined age range (i.e., of legal age at the time they completed the first survey wave). 11,593 respondents (those who gave panel consent in W1P1 and in the meantime did not actively de-register, emigrate, die, or change address without letting us know) were invited to W2. At W2, new respondents could also enter the sample if they moved into a panel member’s household or became 18 years old while living in a participating household. This is true for 274 people, who are not included in our analyses, because they have no panel history. In total, 8,367 panel members participated in W2 (i.e., 72.17% of all invited).
Experimental Setup
In all survey waves, sample members were invited via postal mail and received up to two reminder letters (see Figure 1). Overview of the Experimental Setup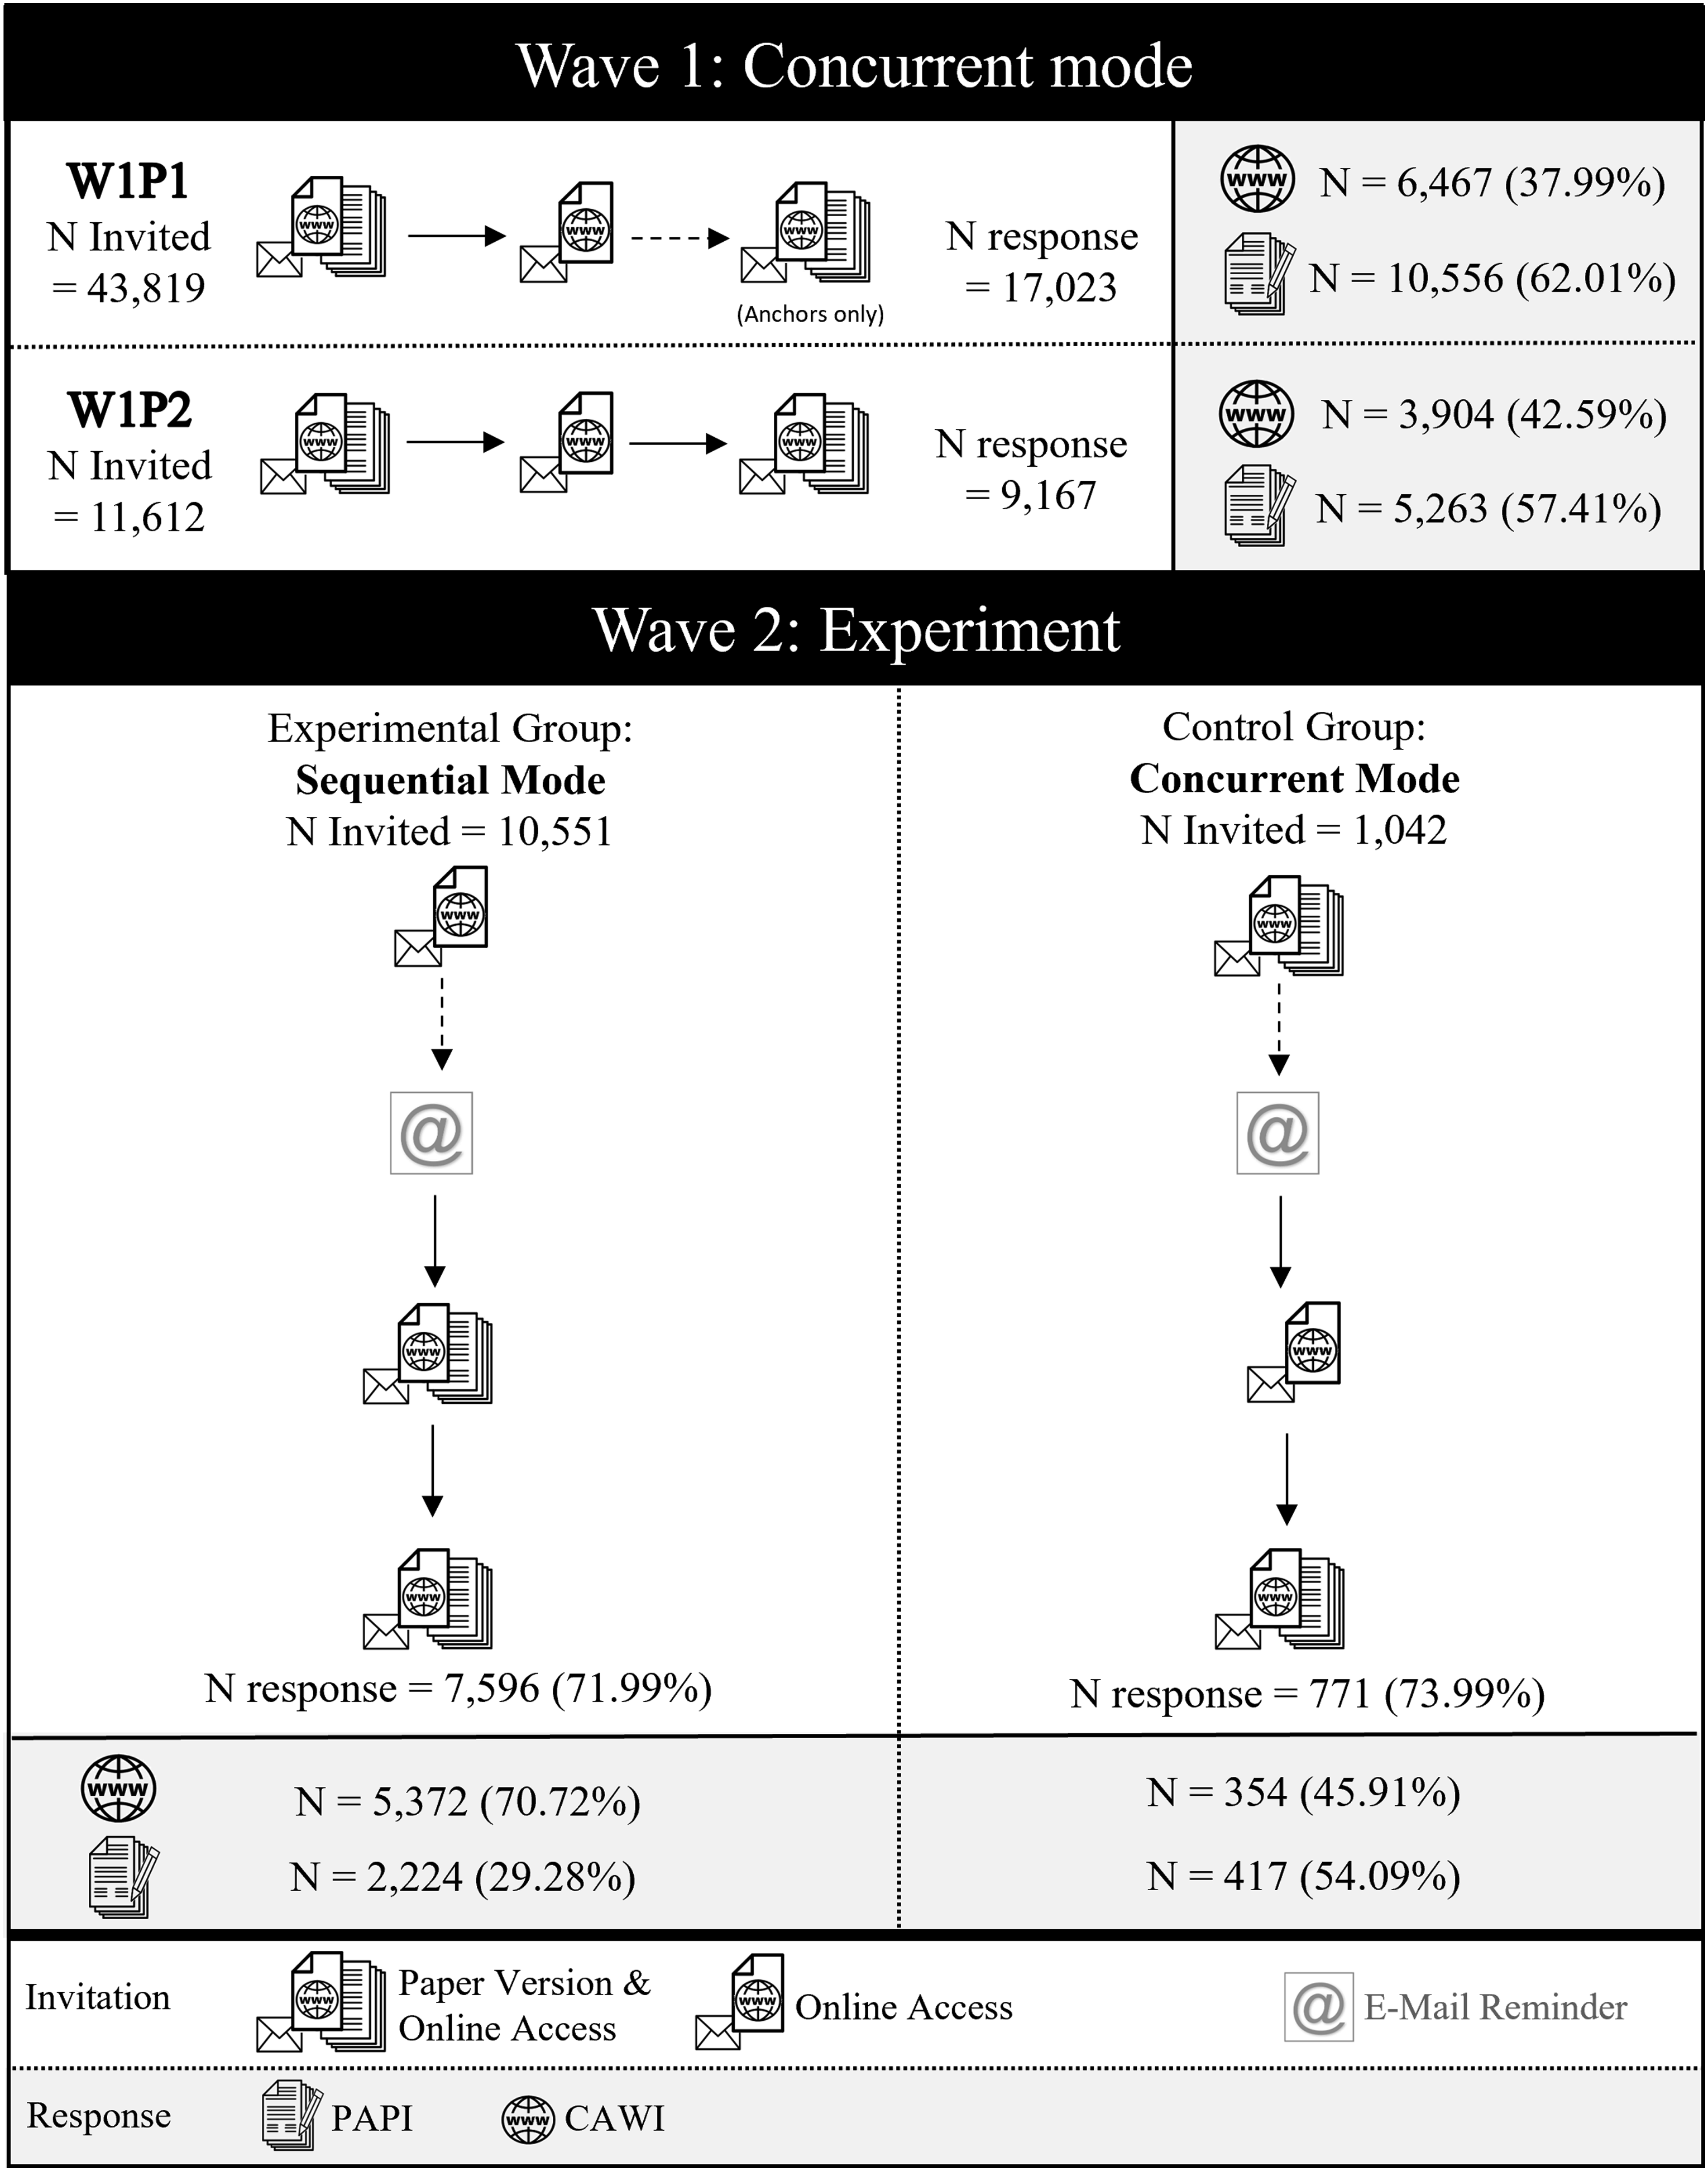
In both W1P1 and W1P2, a concurrent mixed-mode design was applied. This means that the invitation letter and the second reminder contained both a link and QR code to the web version of the survey and a paper questionnaire alternative with a stamped mail-back envelope. For cost reasons, the first reminder letter only contained the link and QR code and not the paper questionnaire. However, the reminder letter encouraged sample members to fill out and mail back the paper questionnaire they had received with the first mailing if they preferred this offline option.
The majority of the sample was switched to a sequential push-to-web design in wave 2 while a random sub-sample remained in the concurrent mode design. This means that, in the sequential push-to-web group (i.e., the experimental group), respondents first received an invitation letter with the link and QR code to the web survey version only. It should be noted, however, that the invitation letter already mentioned that panel members who prefer to participate via pen-and-paper would be provided with a paper questionnaire with the next mailing approximately 2 weeks from the initial invitation. Both the first and second reminder letters then contained both the link and QR code and the paper questionnaire. Compared to the control group, which remained in the concurrent mode design respondents were used to from the two previous surveys (W1P1 and W1P2), the difference is not the number of mailings which contained the paper questionnaire but the timing: directly with the invitation versus only with the first reminder.
Regarding the sample composition, it should be noted that paper respondents differ from online respondents at all measurement timepoints (W1P1, W1P2, W2). Most notably, they are older (see Figure 2). Distribution of Age and Gender Across Survey Waves and Modes Across the Three Measurement Timepoints Relevant for This Study (W1P1, W1P2, W2). Note: Violin plots display the density distribution of age (measured at baseline), with embedded boxplots showing median and interquartile range. The upper panel shows Wave 1 (Part I), where all respondents self-selected into Web or Mail mode. The lower panels include nonresponse and non-consent categories. Non-consent in Wave 1 (Part II) reflects participants who did not provide panel consent after completing Wave 1 (Part I or II). Nonresponse is wave-specific; participants who withdrew consent in a previous wave were excluded from subsequent waves. Violin widths are scaled proportionally to the number of observations; scaling is not directly comparable between the panels. 40 respondents self-identifying as of diverse gender and 200 item missings are not included in the plot.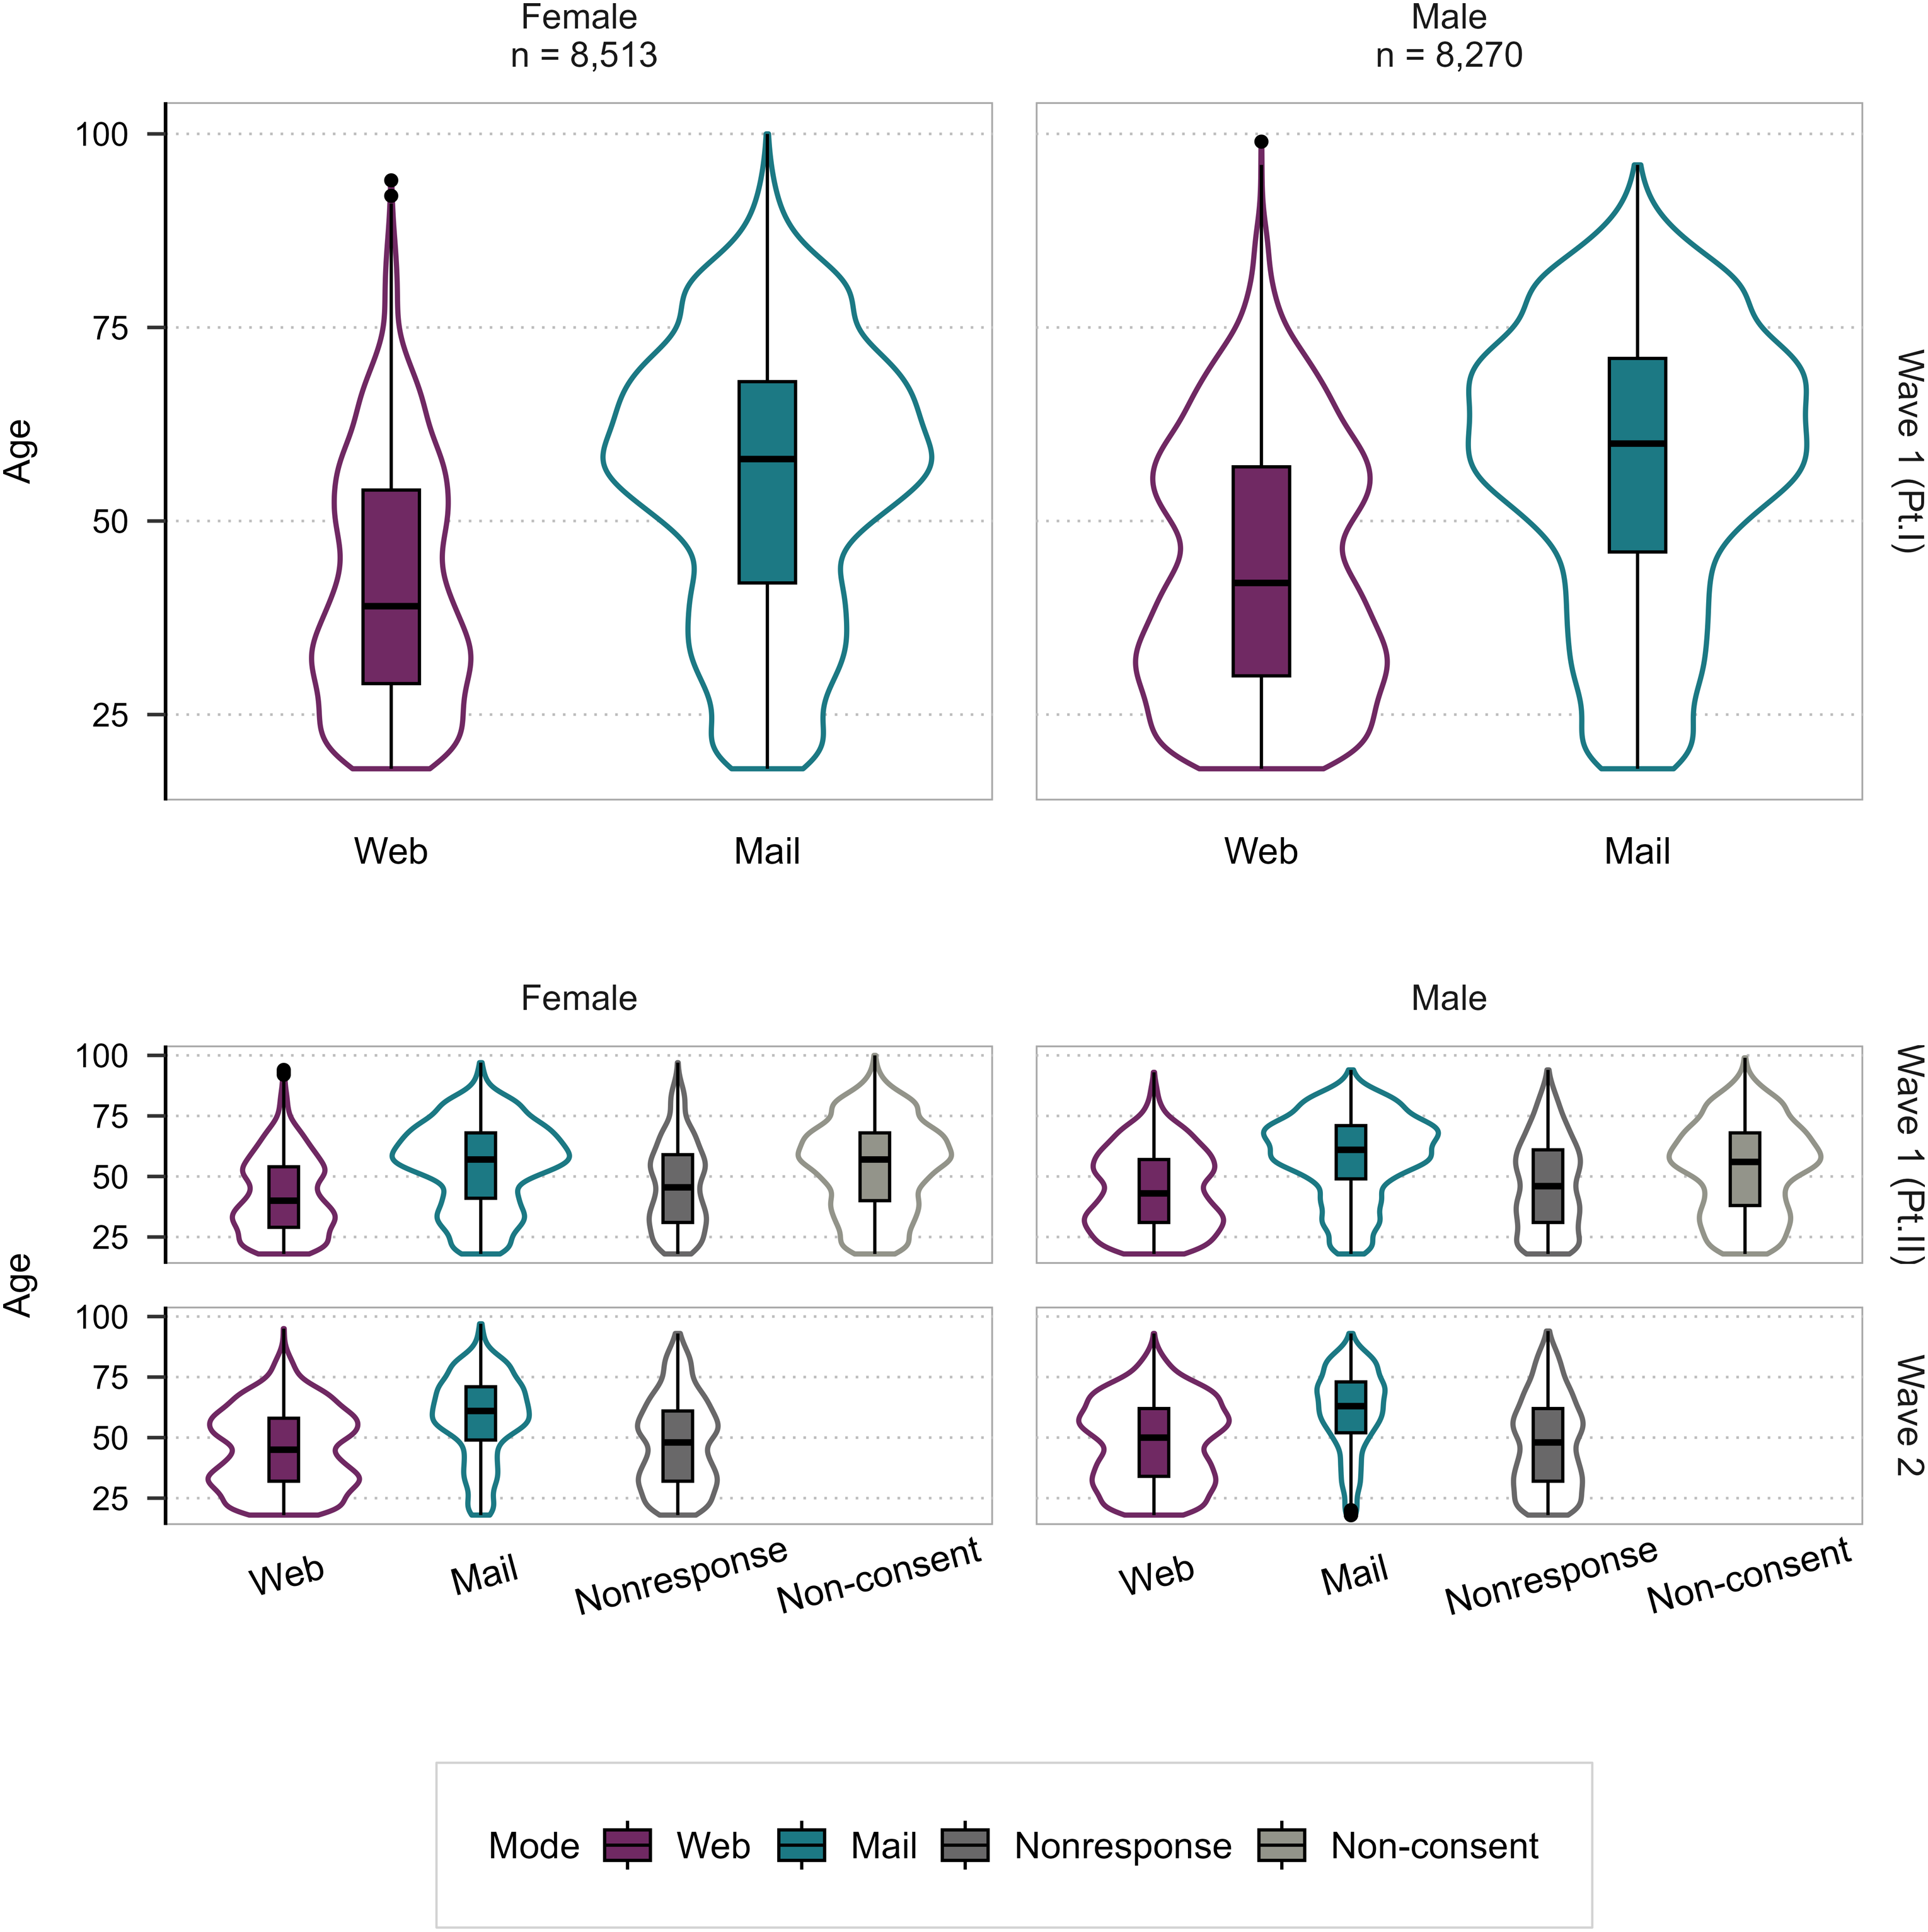
In W2, an additional reminder email was sent to everyone who had previously provided their email address in the contact form, which was administered to all panel members at the end of the previous survey waves. The reminder email was sent approximately a week after their invitation letter was posted. Only 22% of all panel members had provided their email address, meaning that only a selective minority of panel members received this additional reminder. In fact, only 2.26% of W1P1 online respondents could be sent a reminder email, compared to 24.76% of W1P1 mail respondents (see Table A1 in the Appendix).
Methods
In the following, we describe the methods we use to analyze the experimental data along our hypotheses using R (R Core Team, 2024). Hypotheses H1 and H2 focus on W2, where the design experiment was implemented. They are tested using logistic regression models as well as simple directed two-proportion χ2-tests. Our outcomes of interests for the logistic regressions are: • H1: survey participation (respond vs. not respond at W2) conditional on panel consent at W1P1 • H2: survey mode (online vs. paper at W2) conditional on participation at W2
We test the following alternative hypotheses using directed two-proportion χ²-tests: • H1: p(RespW2|SequentialDesign) < p(RespW2|ConcurrentDesign)
Conditional on panel consent at W1P1, the survey participation rate in the push-to-web design is significantly lower than in the concurrent design. • H2: p(WebW2|ConcurrentDesign) < p(WebW2|SequentialDesign)
Conditional on participation at W2, online mode participation is significantly more common in the push-to-web than in the concurrent design. In addition, we also explore survey mode transition patterns across measurement timepoints descriptively using alluvial plots (see Figure 3). Survey Mode Transitions From W1P1 Via W1P2 to W2 by Experimental Condition (n = 9,148)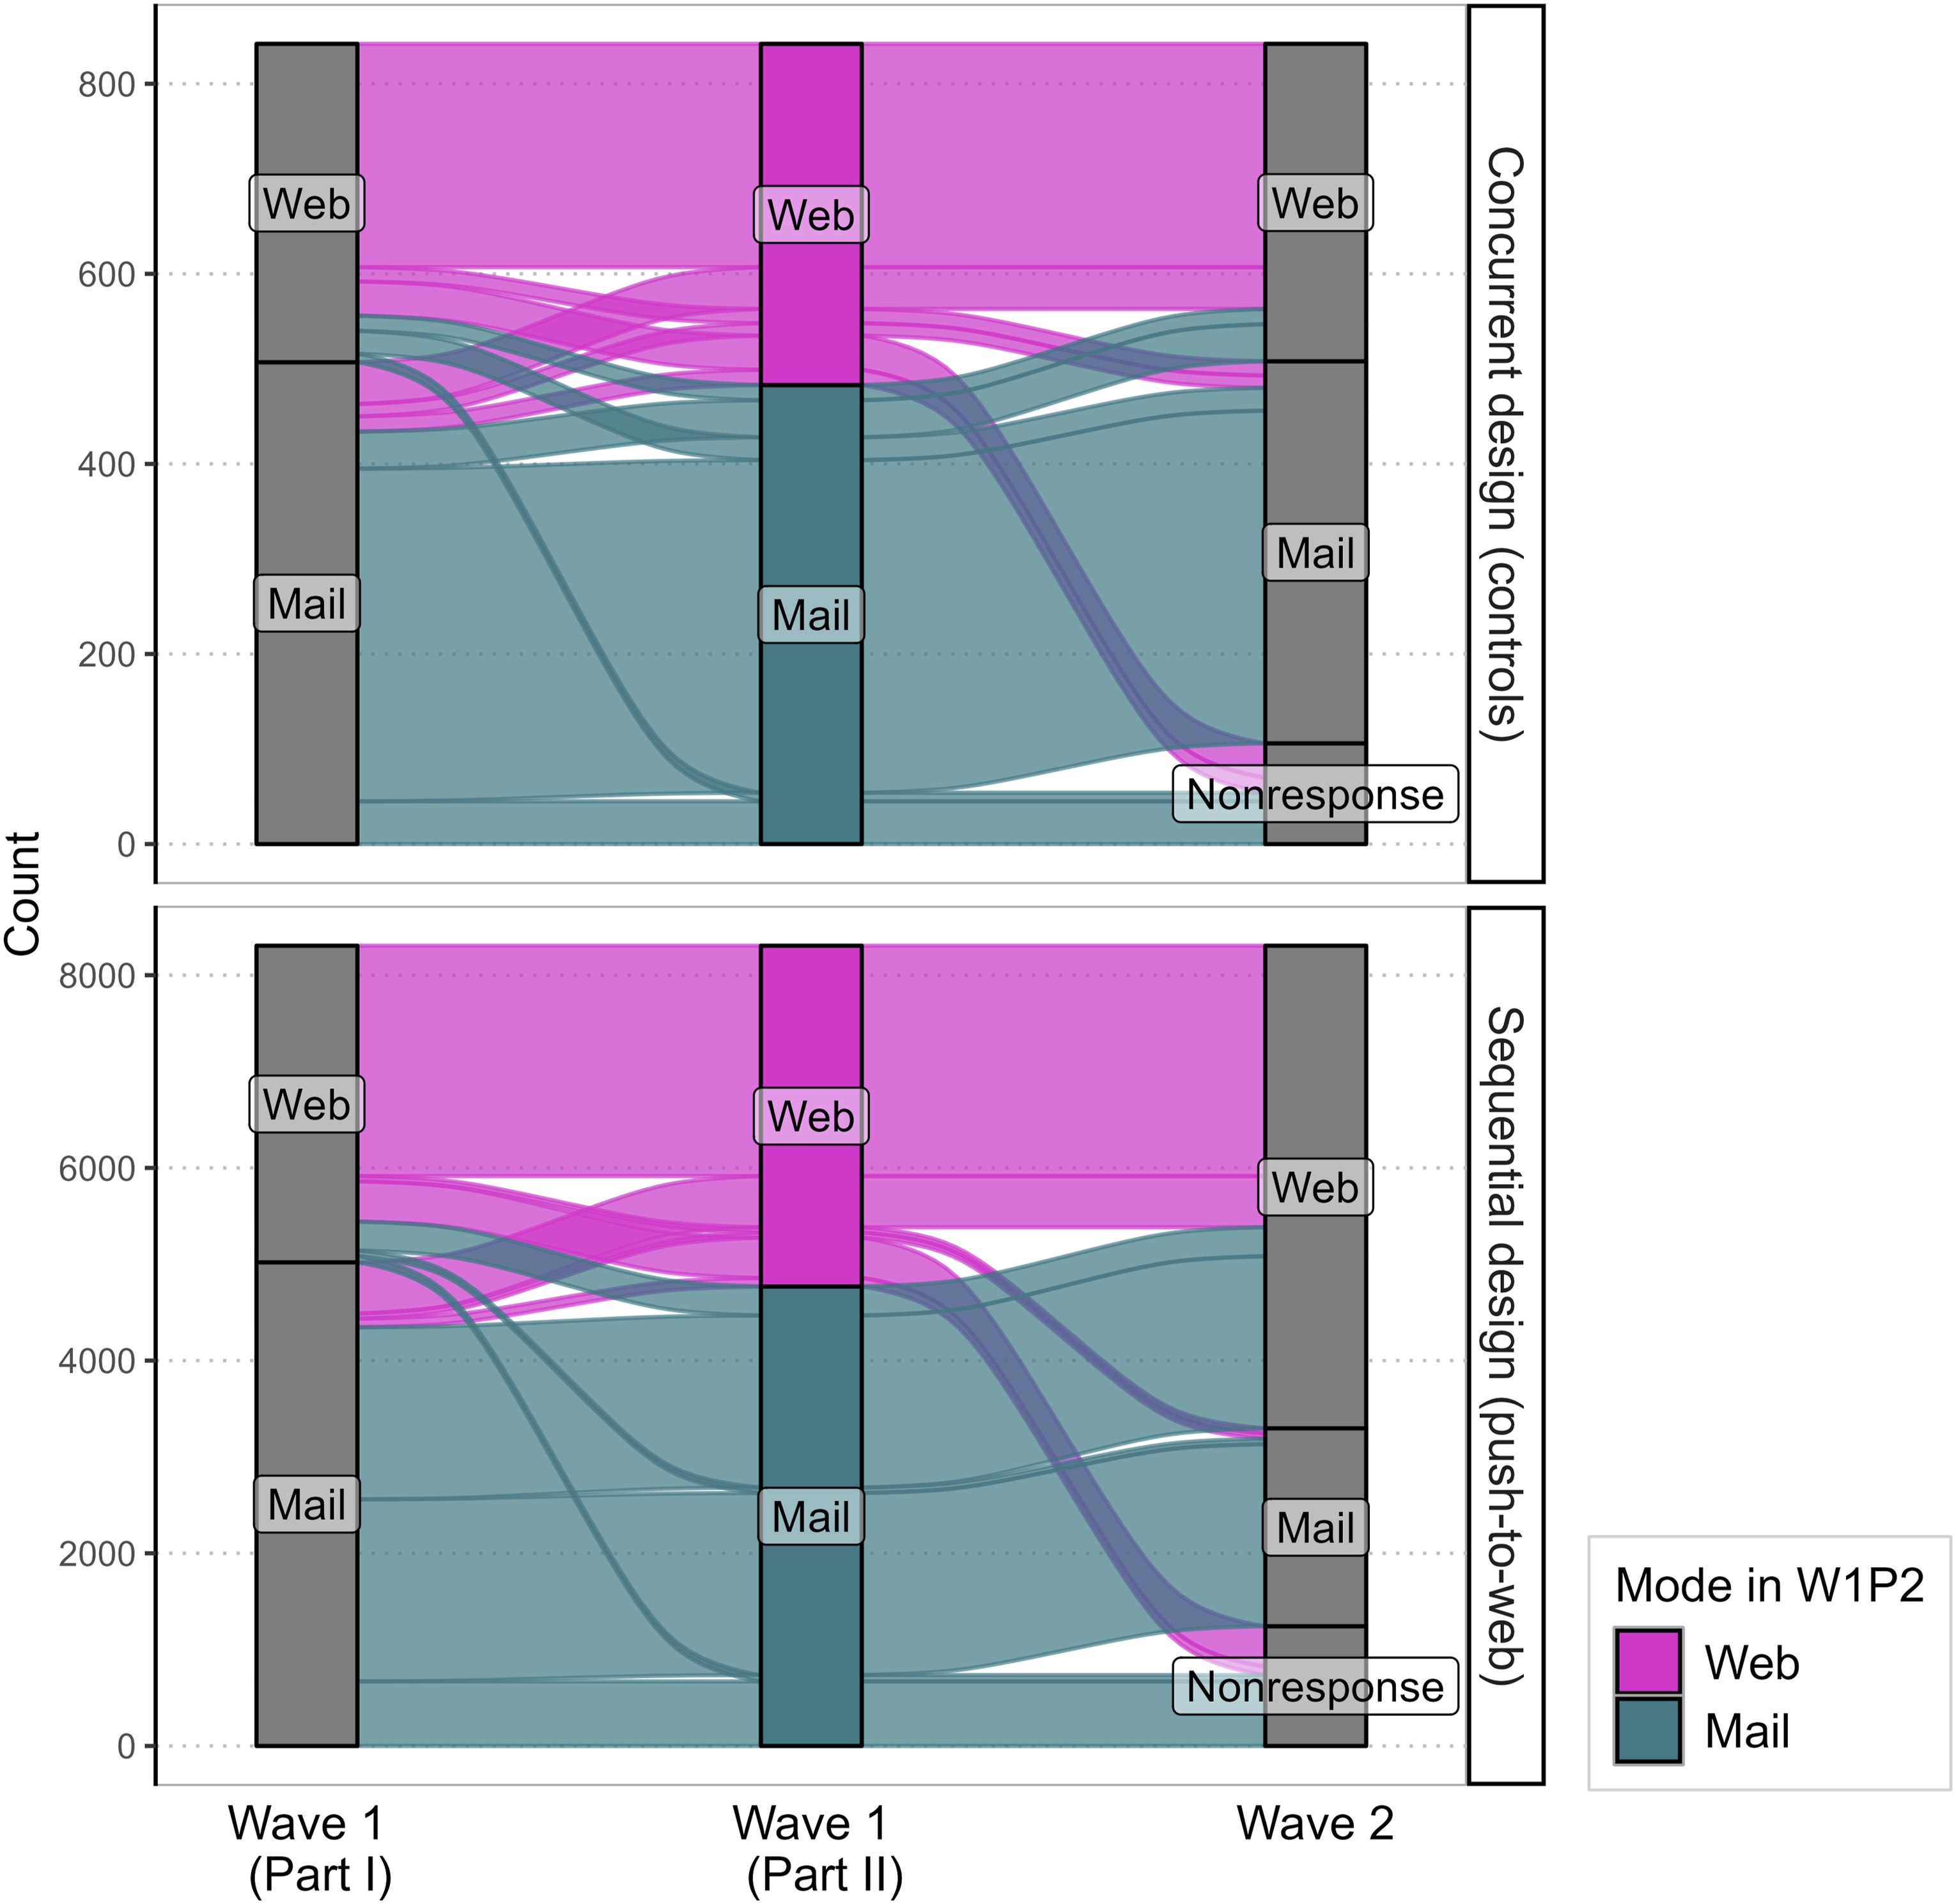
All three parts of hypothesis H3 focus on putting the results from the design experiment into the context of respondents’ profile data collected during panel recruitment. However, due to the small number of measurement timepoints, longitudinal models (e.g., random effects models) are not applied. Instead, we fit logistic regression models with the following outcomes of interest: • H3.1: online mode continuation (online participation at all measurement timepoints vs. paper at least once) conditional on participation in all survey waves. • H3.2: mode switch (switch from paper in W1P2 to online in W2 vs. paper at both W1P2 and W2) conditional on participation in all survey waves • H3.3: switch to nonresponse (response to both W1P2 and W2 vs. response to W1P2 but not W2)
In all models for the H3 hypotheses, we include the same set of predictors (for an overview, see Table A2 in Appendix A.2). Direct measures of digital inequality that capture its key components digital access, use, and skills are unavailable in the data. Therefore, we use indicators which measure offline resources that, according to Helsper’s (2012) corresponding fields model, impact digital inequality. These are economic, cultural, social, and personal resources. In addition, we include proxy measures of digital access and use available either from the panel data or an external source. The resulting indicators are described in the following.
To represent economic resources, we include the logarithmized equivalized income (Eurostat, 2025), employment status, and homeownership versus renting. Cultural resources are operationalized using educational attainment and variables measuring generalized trust as well as trust in the government, science, and internet companies. For social resources, we rely on network heterogeneity, the number of social contacts with family and friends, living situation (alone or in a shared household with other adults), and measures of social support availability expectations for personal matters, caregiving, and finances. Personal resources are captured through the variables age, a quadratic age term to account for a non-linear association, and subjective health.
While direct measures of access are unavailable, the share of households in the area that can be provided with high-speed (1000 Mbit/s or more) internet access serves as a key proxy for infrastructural access. We use micro-geographic data based on official statistics for this purpose (infas360, 2021). In addition, we include municipality size (less than 5,000 inhabitants 5,000 to less than 20,000 inhabitants, 20,000 to less than 100,000 inhabitants, 100,000 to less than 500,000, and 500,000 or more inhabitants), since internet access in Germany is usually better in more urban than rural areas (Statistisches Bundesamt, 2022). As a proxy for internet use, we include a variable on the use of email portals such as Yahoo or Gmail and social media platforms such as X or Facebook as a source of information (e.g., news consumption) as well as general active use of social media (i.e., (re-)posting own content) in our analyses. It should be noted that previous research on using micro-geographic area data for nonresponse modeling suggests that such indicators often only possess weak predictive power (e.g., Biemer & Peytchev, 2013; Cornesse, 2020; West et al., 2015).
We include control variables for gender, migration background, region (East/West Germany), the potential effect of the selectively sent email reminder as well as the potential interaction of the reminder across experimental groups in our analyses. All analysis samples only include participants who had consented to being panel members at W1P1, since only they had a chance to participate in multiple survey waves and were assigned to the push-to-web experiment at W2. We apply design weights in all our analyses to account for unequal selection probabilities as well as clustered standard errors to account for the nested data structure (individuals within households) in all analyses using the R survey package (Lumley, 2004).
Item nonresponse is present in various variables of the analysis datasets for H3.1, H3.2, and H3.3. To avert a substantial drop in the number of observations available for our analyses and to reduce potential nonresponse bias, we apply multiple imputation by chained equations (Rubin, 1987; Van Buuren et al., 2006) to complete the partially missing datasets. This procedure entails replacing each missing value through multiple imputed values that are plausible based on an imputation model. This yields multiple imputed datasets, which we can analyze separately and subsequently pool the different estimates through appropriate combining rules. Using the implementation of this procedure in the R packages mice (Van Buuren & Groothuis-Oudshoorn, 2011) and miceadds (Robitzsch & Grund, 2023), we generate 25 imputed datasets each for H3.1, H3.2, and H3.3. Our imputation models in particular employ classification trees (Doove et al., 2014) for imputing nominal and dichotomous variables and partial-least-squares predictive mean matching (Robitzsch et al., 2016) for ordinal and continuous variables. The imputation models use all analysis variables as predictors for the imputation. Imputation models for ordinal and continuous variables also include a selection of additional auxiliary predictor variables from the remaining survey data identified via lasso regression. To include the cases of respondents who self-identify as “diverse” in our analysis (ten people in the analysis of H3.1, four in H3.2, and twelve in H3.3), we also impute their binary gender values.
To assess the H3 hypotheses, we fit logistic regression models for each respective hypothesis’ outcome that initially include the complete set of predictors introduced above (a maximum model). On these maximum models, we employ two consecutive steps for the final model selection: As the first step, we adopt a backwards stepwise AIC selection for which we use the MASS package (Venables & Ripley, 2002). Following Van Buuren (2018), we apply the procedure separately on each of the 25 imputed datasets and include predictor variables if the algorithm selects them into at least 50% of the resulting 25 models.
The second step includes multivariate Wald-testing. Iteratively, we test the significance of each of the remaining predictors’ relationship with the outcome. To that end, we fit a logistic regression model including a predictor and test it against a restricted model without the respective predictor. For this procedure, we utilize the D1 command from the mice package which uses the pooled models for the comparison. We remove variables in instances of insignificance (i.e., if p
Results
H1: Wave 2 Response
Table 1 shows the results for our first two hypotheses. H1: Respondents will be more likely to respond to a survey if they remain in the concurrent mode design rather than being pushed to the web. Cross Tabulation Results for Hypotheses 1 and 2, by Experimental Design (Column Percentages with 95% Confidence Intervals Shown in Square Brackets)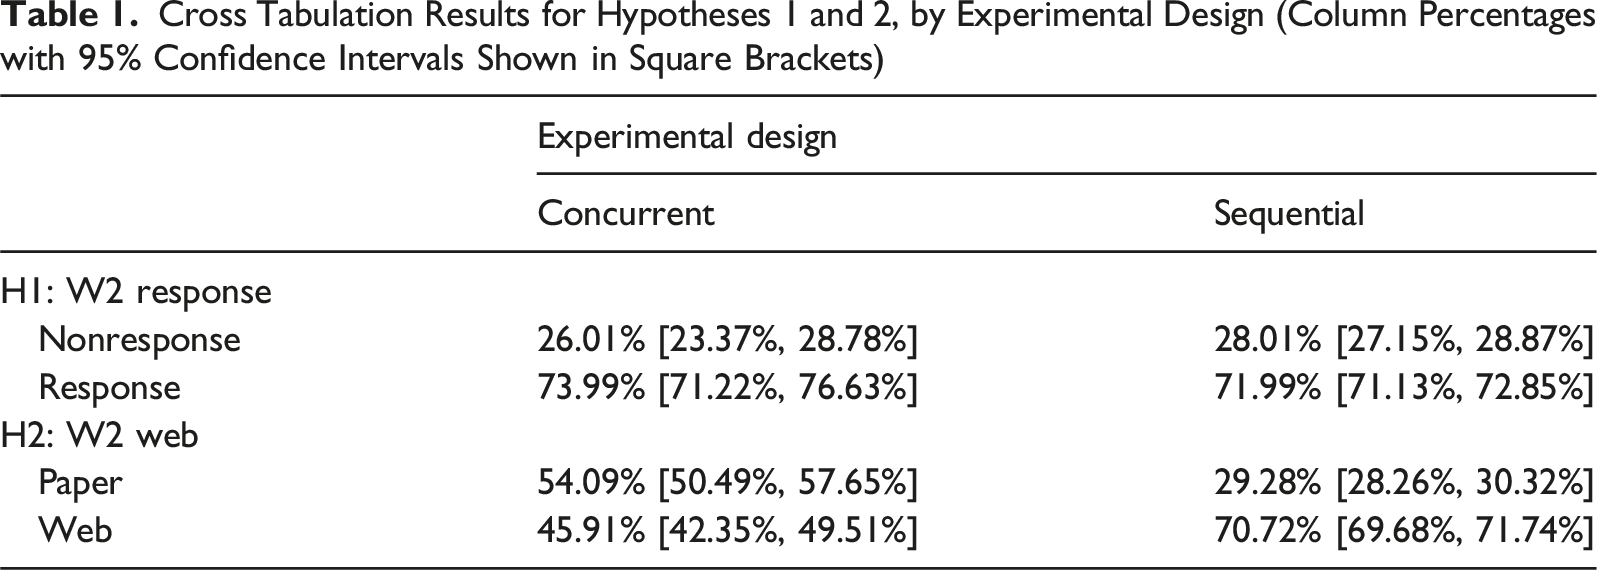
Contrary to H1, we find that panel participants are not significantly more likely to respond if they remain in their accustomed design (concurrent) mode rather than being switched to a sequential push-to-web design (73.99% response compared to 71.99%, see upper part of Table 1). Confidence intervals between the groups overlap and the finding of no significant difference is confirmed in a directed χ²-test (χ² = 1.79, df = 1, p = .091, 95% CI [−1, 0.004]).
As a sensitivity analysis, we examine the experimental design’s effect on survey response also controlling for the email reminder using logistic regression. We find that controlling for the reminder, the effect of the design remains insignificant and changes direction (see Table A3 in Appendix A.3).
H2: Wave 2 Web Participation
H2: Respondents will be more likely to participate in a survey online rather than via paper mail-back questionnaire when they are pushed to the web rather than remaining in the concurrent mode design.
In line with H2, we find that panel participants are significantly more likely to participate online than on paper when being pushed to the web (70.72% vs. 45.91%; see lower part of Table 1). This finding is confirmed in a directed χ²-test (χ² = 198.26, df = 1, p < .001, 95% CI [0.22, 1]) and also holds when controlling for the email reminder (see Table A3 in Appendix A.3). When examining survey mode transitions across panel survey waves by experimental group visually, we find only a limited amount of switching from one mode to the other in the concurrent mode design from W1P1 via W1P2 to W2 (see upper panel of Figure 3). The pattern in the concurrent mode control group is mostly characterized by stability as well as a dominance of the paper mode over the web mode. In the experimental group, the pattern is different and characterized by a clear increase in web mode participation, especially from W1P1 to W2. In W2, web becomes the dominant mode. As can be seen in Figure A1 in Appendix Section A.4, in both the experimental and control groups, it is older people who choose the paper mode (W2 median age paper: 59 years versus median age web: 44 years in the concurrent mode group; median age paper: 63 years versus median age web: 48 years in the sequential push-to-web mode group).
H3: Digital Inequality
We find that some digital inequality indicators significantly explain the outcomes for H3.1 to H3.3. Key predictors present in at least 50% of imputed datasets after AIC reduction include: • • •
All control variables (experimental design, email reminder, region, gender, and migration background) are included in at least one final model. However, some indicators are excluded by the AIC reduction since they did not contribute to improving any of the models (cultural resources: trust in government or Big Tech companies, social resources: frequency of social contacts, living in a household with other adults, expected support availability for personal or financial issues, internet use: using social media as a source of information).
H3.1: Participating Online at All Measurement Timepoints
Regarding the correlation between digital inequality and participation by survey mode, we find partial support for the hypothesis that greater offline resources as well as internet access and use are associated with choosing the online survey mode over paper questionnaires (see Figure 4 and model “Online Continuity” in the first column of Table A5 in Appendix A.6). Pooled Logistic Regression Results of Hypotheses 3 by Indicator Groups.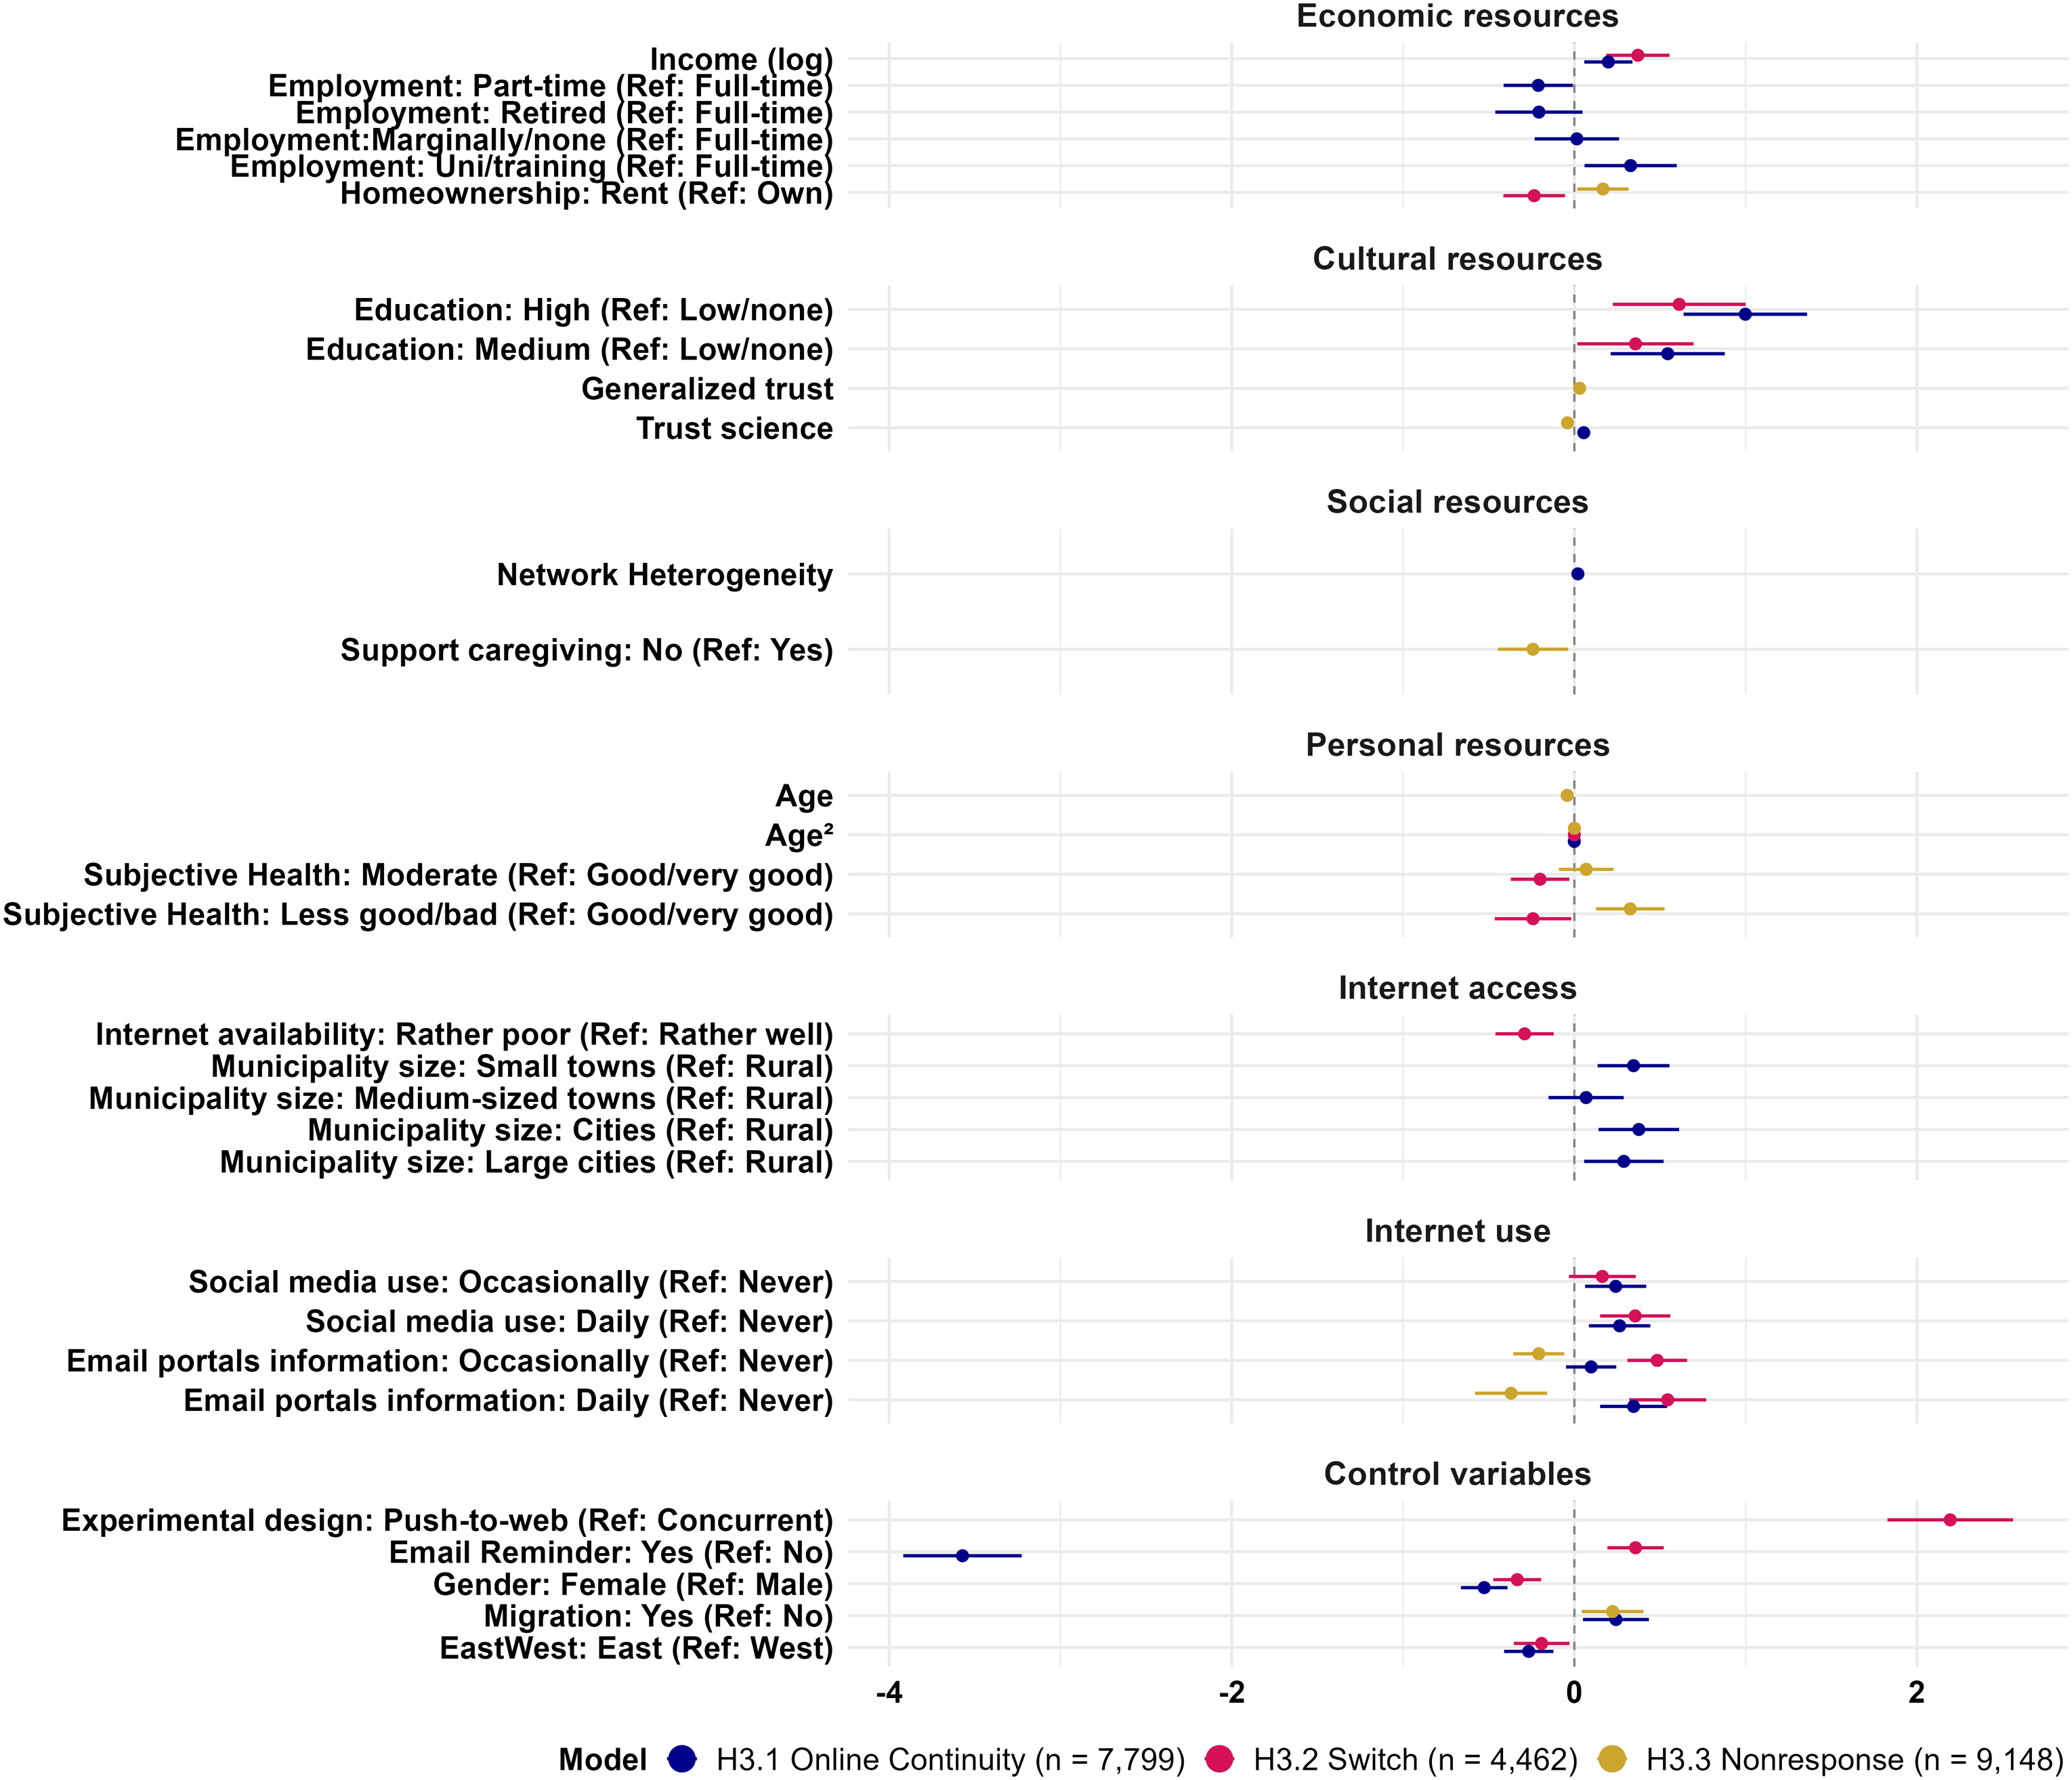
Our results are the following: • • • • • • •
Overall, the direction of all statistically significant results is as expected in H3.1. With a Nagelkerke R² mean of 0.4129 over all imputations at marginal variability (SD = 0.0004), the model on H3.1 is relatively strong, suggesting that our digital inequality indicators explain continued online participation rather well.
H3.2: Switching From Paper to the Online Mode
Regarding the correlation of digital inequality with switching from paper to online, we again find partial support for our hypothesis that greater offline resources as well as internet access and use are associated with mode switching from paper at W1P2 to the web at W2 (model “Switch,” see Figure 4 and second model in Table A5 in Appendix A.6): • • • • • •
Overall, the direction of all statistically significant results is in the direction expected in H3.2. With a Nagelkerke R² mean of 0.2546 over all imputations at marginal variability (SD = 0.01), the model on H3.2 has moderate explanatory power, suggesting that our indicators explain switching to the online mode after recruitment to some extent.
H3.3: W2 Nonresponse
Regarding the correlation between digital inequality and nonresponse, we find limited support for the hypothesis that offline resources as well as internet access and use are associated with becoming nonrespondents at W2 (model “Nonresponse,” see Figure 4 and last model in Table A5 in Appendix A.6). Very few of the resource indicators significantly contribute to explaining wave nonresponse: • • • • • •
Overall, the direction of the statistically significant effects is sometimes in the direction expected in H3.3 and sometimes opposed to it. Based on the Nagelkerke R² mean of 0.0224 at marginal variability (SD = 0.0005) over all imputations, the model for H3.3 is very weak, indicating that digital inequality indicators do not explain becoming nonrespondents at W2 well.
Conclusion
Our study aimed to address the following question: Which consequences does switching a mixed-mode panel survey from a concurrent to a sequential push-to-web design have? To answer this question, we conducted an experiment with random allocation in a probability-based panel survey recruited via a concurrent mode design. In the experiment, a control group was kept in the concurrent mode design panel members were used to from the recruitment. An experimental group was switched to a sequential push-to-web mixed-mode design where people were invited to an online survey and only the reminder letters contained paper mail-back questionnaires as an offline participation alternative.
Results showed that our worry about increased nonresponse in the experimental group as compared to the control group (H1) was unwarranted. There was no backlash to the design change. As expected and desired, however, the share of respondents who chose the online rather than offline mode was much larger in the experimental than the control group (H2). The sequential design really did push respondents to the web. This is particularly striking as the push to the web was very soft, because panel members in the experimental group were already informed in the survey wave invitation letter that they would have the possibility of participating on paper if they waited for the first reminder letter. In line with our expectation, respondents who chose the online mode continuously (H3.1) or switched from offline to online (H3.2) or from participating in the panel recruitment to being nonrespondents (H3.3) at W2 differ on a number of offline resource as well as internet access and use indicators related to the concept of digital inequality. This includes economic resource indicators (income, employment status, homeownership), cultural resources (education, generalized trust, trust in science), social resources (network heterogeneity, expected availability of support for caregiving needs), and personal resources (age, subjective health) as well as some proxy data on internet access (share of households in the area that can be supplied with high-speed internet access as measured using micro-geographic area data, municipality size) and use (social media use, using email portals as a source of information). These findings suggest that not offering the paper mail-back mode anymore may selectively disadvantage people with lower socio-digital status and increase bias in the data for such subgroups. It should be noted, however, that while the explanatory power of our model on choosing the online mode at all three measurement timepoints was rather good (Nagelkerke pseudo-R² = 0.41), it was only moderate for our model on switching from paper questionnaires during the recruitment to the web at W2 (Nagelkerke pseudo-R² = 0.25) and low for the model on switching from participation in the panel recruitment to nonresponse at W2 (Nagelkerke pseudo-R² = 0.02). This suggests that factors other than digital inequality impact mode choice, mode switching, and nonresponse. Based on our findings, we recommend switching a mixed-mode panel study from concurrent to sequential mode after recruitment, but not to let go of the paper mode altogether. It should be noted, however, that our design did not test the mixed-mode strategies against an online-only strategy. Thus, we do not have any evidence on who would or would not have participated or not if we had dropped the paper mode entirely.
An additional limitation of the present study is that the SCP questionnaires do not directly measure digital inequality. For example, rather than an indicator of the share of households that can be supplied with high-speed internet access in the area where the respondents live it would be desirable to ascertain whether the respondents themselves actually have access to high-speed internet connections at home. It would also be important to ask respondents how much and for which purposes they use the internet, on which devices, and how they rate their digital skill levels. Moreover, additional attitudinal measures related to internet use (e.g., relating to data protection concerns) as well as personality traits (e.g., Big Five) may help improve models such as ours. For future research on the impact of switching modes, we, therefore, recommend that panel studies with mixed-mode designs include suitable predictors in their questionnaires. These may also be useful to monitor and correct for attrition bias or mode effects across the panel in relation to digital inequality.
Supplemental Material
Supplemental Material - From Concurrent to Push-To-Web Mixed-Mode: Experimental Design Change in the German Social Cohesion Panel
Supplemental Material for From Concurrent to Push-To-Web Mixed-Mode: Experimental Design Change in the German Social Cohesion Panel by Carina Cornesse, Julia Witton, Julian B. Axenfeld, Jean-Yves Gerlitz, and Olaf Groh-Samberg in Social Science Computer Review.
Footnotes
Acknowledgments
The authors thankfully acknowledge support from the German Federal Ministry of Education and Research (Bundesministerium für Bildung und Forschung).
Consent to Participate
Participants provided their consent to participate in the survey.
Author Contributions
Carina Cornesse initiated and co-designed the experiment, co-coordinated data collection, wrote the original manuscript, and coordinated manuscript revisions and journal submission.
Julia Witton prepared the data, conducted the analyses, created the visualizations, and contributed to revising the manuscript.
Julian B. Axenfeld was responsible for the multiple imputations, contributed to devising the analysis strategy, and contributed to revising the manuscript.
Jean-Yves Gerlitz and Olaf Groh-Samberg contributed to designing the experiment, co-coordinated data collection, and contributed to revising the manuscript.
Funding
The authors disclosed receipt of the following financial support for the research, authorship, and/or publication of this article: Our research was funded by the German Federal Ministry of Education and Research (Bundesministerium für Bildung und Forschung) grant (01UG2050CY).
Declaration of Conflicting Interests
The authors declared no potential conflicts of interest with respect to the research, authorship, and/or publication of this article.
Data Availability Statement
The data is available at the Research Data Centre Social Cohesion of the Research Institute Social Cohesion (RDC-RISC). For more information, please contact
Supplemental Material
Supplemental material for this article is available online.