
Abstract
Once recruited, probability-based online panels have proven to enable high-quality and high-frequency data collection. In ever faster-paced societies and, recently, in times of pandemic lockdowns, such online survey infrastructures are invaluable to social research. In absence of email sampling frames, one way of recruiting such a panel is via postal mail. However, few studies have examined how to best approach and then transition sample members from the initial postal mail contact to the online panel registration. To fill this gap, we implemented a large-scale experiment in the recruitment of the 2018 sample of the German Internet Panel (GIP) varying panel recruitment designs in four experimental conditions: online-only, concurrent mode, online-first, and paper-first. Our results show that the online-only design delivers higher online panel registration rates than the other recruitment designs. In addition, all experimental conditions led to similarly representative samples on key socio-demographic characteristics.
Keywords
Online panels constitute valuable infrastructures that are increasingly attractive for conducting social science research (Callegaro et al., 2014). The appeal of online panels lies in their speed, flexibility, and cost-effectiveness (Blom et al., 2016). For example, online panels can be adapted flexibly to unforeseen societal changes and shock events, such as the COVID-19 pandemic, and provide high-frequency and high-quality data to decision makers fast when needed (see Blom et al., 2020). In addition, an increasing body of literature shows that, when based on a probability sample of the general population, online panels can yield representative population predictions (for a review, see Cornesse et al., 2020).
Despite these advantages, recruiting a high-quality probability-based online panel of the general population is challenging (Baker et al., 2010). Whereas for some special-population online surveys, it may be possible to randomly sample from existing email lists (see, e.g., Couper & Miller, 2008; Hupp, 2015), for the general population, a sampling frame of email addresses is usually unavailable. Thus, online panel recruitment and surveying are typically conducted in two separate, bi-modal stages: A probability sample of the general population is first approached in an offline mode. For this initial offline contact with the sample members, face-to-face interviews, postal mail contacts, or a mix of contact modes which may include telephone calls are typically used (see Callegaro et al., 2014). Contacted sample members then have to be transferred to the online mode for online panel data collection. This can, for example, be done by requesting sample members’ email addresses for further contact or by asking them to follow a website link to a registration page.
In Europe, it is common to use interviewers for the initial contact. The Dutch Longitudinal Internet Studies for the Social Sciences (LISS) Panel (Scherpenzeel & Toepoel, 2012), the French Études Longitudinales par Internet Pour les Sciences Sociales (ELIPSS) Panel (Revilla et al., 2016), the German GESIS Panel (Bosnjak et al., 2018), and the first two recruitment rounds of the German Internet Panel (GIP; Blom et al., 2015) 1 all relied on face-to-face and/or telephone interviewers. In the United States, initial contact is more commonly established via postal mail, such as in the American Trends Panel (Pew Research Center, 2019) and Ipsos (2020) Knowledge Panel or via a mix of self-administered and interviewer-administered recruitment modes, such as in the Gallup Panel (GALLUP, 2020) and AmeriSpeak (National Opinion Research Center, 2019).
Regardless of how initial contact is established, many probability-based online panels implement two surveys during their recruitment process: first, an initial recruitment survey during the offline contact (e.g., to ask for an email address); second, a subsequent online registration survey to collect consent to becoming a member of the online panel and additional background information (for examples of such recruitment processes with two surveys, see Blom et al., 2016; for a counter-example that skips the offline recruitment survey, see Høgestøl & Skjervheim, 2014).
Compared to approaches that use interviewers in the online panel recruitment (either for face-to-face or telephone contacts), postal mail contacts tend to be less expensive and avoid interviewer effects (for an overview of potential interviewer effects, see West & Blom, 2017).
2
However, little is known about how to best conduct such a mail-mode recruitment in a way that maximizes panel registration rates and representativeness (for a notable exception, see Rao et al., 2010). The overarching research question in this article, therefore, is: In terms of panel registrations and sample representativeness, which postal mail contact design strategy is most successful at recruiting sample members into a probability-based online panel?
Literature and Hypotheses
Previous research has shown that probability-based online panels can successfully be recruited via postal mail (see, e.g., Høgestøl & Skjervheim, 2014). However, postal mail recruitments can be conducted in a number of ways that may impact the success of the recruitment in terms of how many sample members can be recruited and to what extent the recruited sample accurately reflects the intended target population.
The most straightforward approach to recruiting a probability-based online panel via mail is to just send sample members a letter that includes a request to register to the panel on the Internet. In the following, this approach will be referred to as an “online-only” design strategy. Online-only design strategies are comparatively inexpensive and particularly attractive for sample members whose preferred survey participation mode is the web anyway (as compared to face-to-face, telephone, or mail-back surveys; see, e.g., Olson et al., 2012; Shih & Fan, 2007; Smyth et al., 2014). However, online-only approaches are less attractive for people who are reluctant to provide data online (see, e.g., Cornesse & Schaurer, 2021) and they completely exclude people who are unable to participate in online surveys, because they lack internet access or the necessary skills to use the internet (see, e.g., Blom et al., 2017; Herzing & Blom, 2019).
To establish rapport with sample members who prefer survey modes other than the web, offering the possibility of participating in the first part of a two-stage recruitment process (i.e., the initial recruitment survey) via mail-back paper questionnaires may boost response. In addition, the data provided on paper may later be used in calibration weighting or, budget permitting, to provide non-internet users with the necessary equipment to participate in the panel online (see, e.g., Blom et al., 2017, Leenheer & Scherpenzeel, 2013). Moreover, once sample members have experienced being a respondent offline, they may be willing to switch to the online mode to stay in the panel.
Offering sample members the possibility of participating in the initial recruitment survey either online or via mail-back paper questionnaires is a mixed-mode design strategy (see de Leeuw, 2013; de Leeuw & Berzelak, 2016, for definitions). Some evidence from cross-sectional surveys suggests that mixed-mode designs can lead to higher response rates than single-mode designs, in particular, when the single-mode design is online-only (see Couper, 2011; Dillman et al., 2014; de Leeuw, 2018, for an overview). We thus obtain our first hypothesis:
Whereas mixed-mode designs may increase response rates as compared to online-only designs, some research suggests that modes should be offered sequentially rather than concurrently (see, e.g., Holmberg et al., 2010; Mauz et al., 2018). In a concurrent mode design, respondents are offered a choice between modes (see de Leeuw & Toepoel, 2018, for a definition). However, a meta-analysis by Medway and Fulton (2012) concludes that, on average, sample members are more likely to respond in a single-mode design than a concurrent mode design. In contrast, sequential mixed-mode designs first offer one mode, and, subsequently, sample members who did not take up this initial mode are offered a different mode (see, e.g., Klausch et al., 2017; Lynn, 2013; for a definition, see also Bethlehem & Biffignandi, 2012, Chapter 7). Several studies on cross-sectional surveys demonstrate the success of sequential mixed-mode designs (see, e.g., Dillman, 2017; Patrick et al., 2018). We thus obtain our second hypothesis:
When using a sequential mode design, researchers have to decide which mode to offer first and which mode to offer second (i.e., only to initial nonrespondents). A series of studies conducted at Washington State University (see Dillman, 2017, for an overview) find that inviting sample members to an online survey first and, subsequently, following up nonrespondents with a mail-back paper questionnaire leads to the best cost-benefit ratio and the highest share of online respondents (see Edwards et al., 2014; Dillman et al., 2014; Messer, 2012; Millar & Dillman, 2011; Smyth et al., 2010). This particular sequential strategy is commonly referred to as a “push-to-web” design (see Dillman et al., 2014, Chapter 11). In our study, we will refer to it as an “online-first” design. Our third hypothesis, therefore, is:
While online-first designs have been found to have many advantages, they have usually not been found to maximize overall response rates. On the contrary, some studies suggest that the highest cross-sectional survey response rates are achieved with sequential designs that prioritize the mail-back mode, that is, a “paper-first” design (see, e.g., Smyth et al., 2010). This may have changed in recent years with the world-wide increase in internet use, but to our knowledge, no recent studies comparing paper-first designs to other mixed-mode strategies are available.
In a paper-first design, sample members are initially invited to participate in a mail-back survey. Subsequently, nonrespondents are followed up with reminder letters that contain a link to an online version of the survey. While paper-first designs may thus boost response in cross-sectional surveys, the same may not be true for a panel context. On the contrary, some studies suggest that switching panel members from an offline survey mode that they were familiar with to the web may lead to increased nonresponse, either directly or in subsequent panel waves (see, e.g., Bianchi et al., 2017; Couper et al., 2007; Jäckle et al., 2015). Since in the GIP, sample members will have to make the switch to the online mode by the time they register to the panel, we obtain our fourth hypothesis:
Whereas a number of studies have examined the impact of different mixed-mode and single-mode designs on survey response rates, little is known directly about how these designs affect sample representativeness (for an exception in a special population survey, see McMaster et al., 2017). Indirect evidence from studies into the representativeness of online surveys, however, suggests that people who do not use the internet or who are unwilling to participate in surveys on the internet differ from people who use the internet (see, e.g., Blom et al., 2017; Callegaro et al., 2014; Helsper & Reisdorf, 2017). From this literature, we derive the expectation that different modes may lead to different selection effects, which could potentially cancel each other out. Therefore, our last hypothesis is:
Data and Experimental Design
To test the hypotheses described above, a large-scale experiment was conducted in the 2018 recruitment of the GIP. In an experimental setup that compares the online-only, concurrent mode, online-first, and paper-first designs, we examine response rates and sample representativeness in the GIP recruitment process.
Data
The GIP is a multi-topic, probability-based online panel of the general population aged 16–75 years in Germany. 3 To date, the GIP has seen three recruitment rounds, in 2012, 2014, and 2018. The 2012 and 2014 samples were recruited by means of interviewer-mediated face-to-face interviews (for details, see Blom et al., 2016; Blom et al., 2015; Blom & Herzing, 2017; Blom et al., 2017).
In an effort to reduce costs, eliminate interviewer effects, and explore alternative ways of recruiting probability-based online panels, the 2018 GIP sample was recruited via postal mail with a two-stage probability sample drawn from local community population registers (see Figure 1 for a graphical summary of the sampling and data collection protocol and Appendix B for a detailed description).
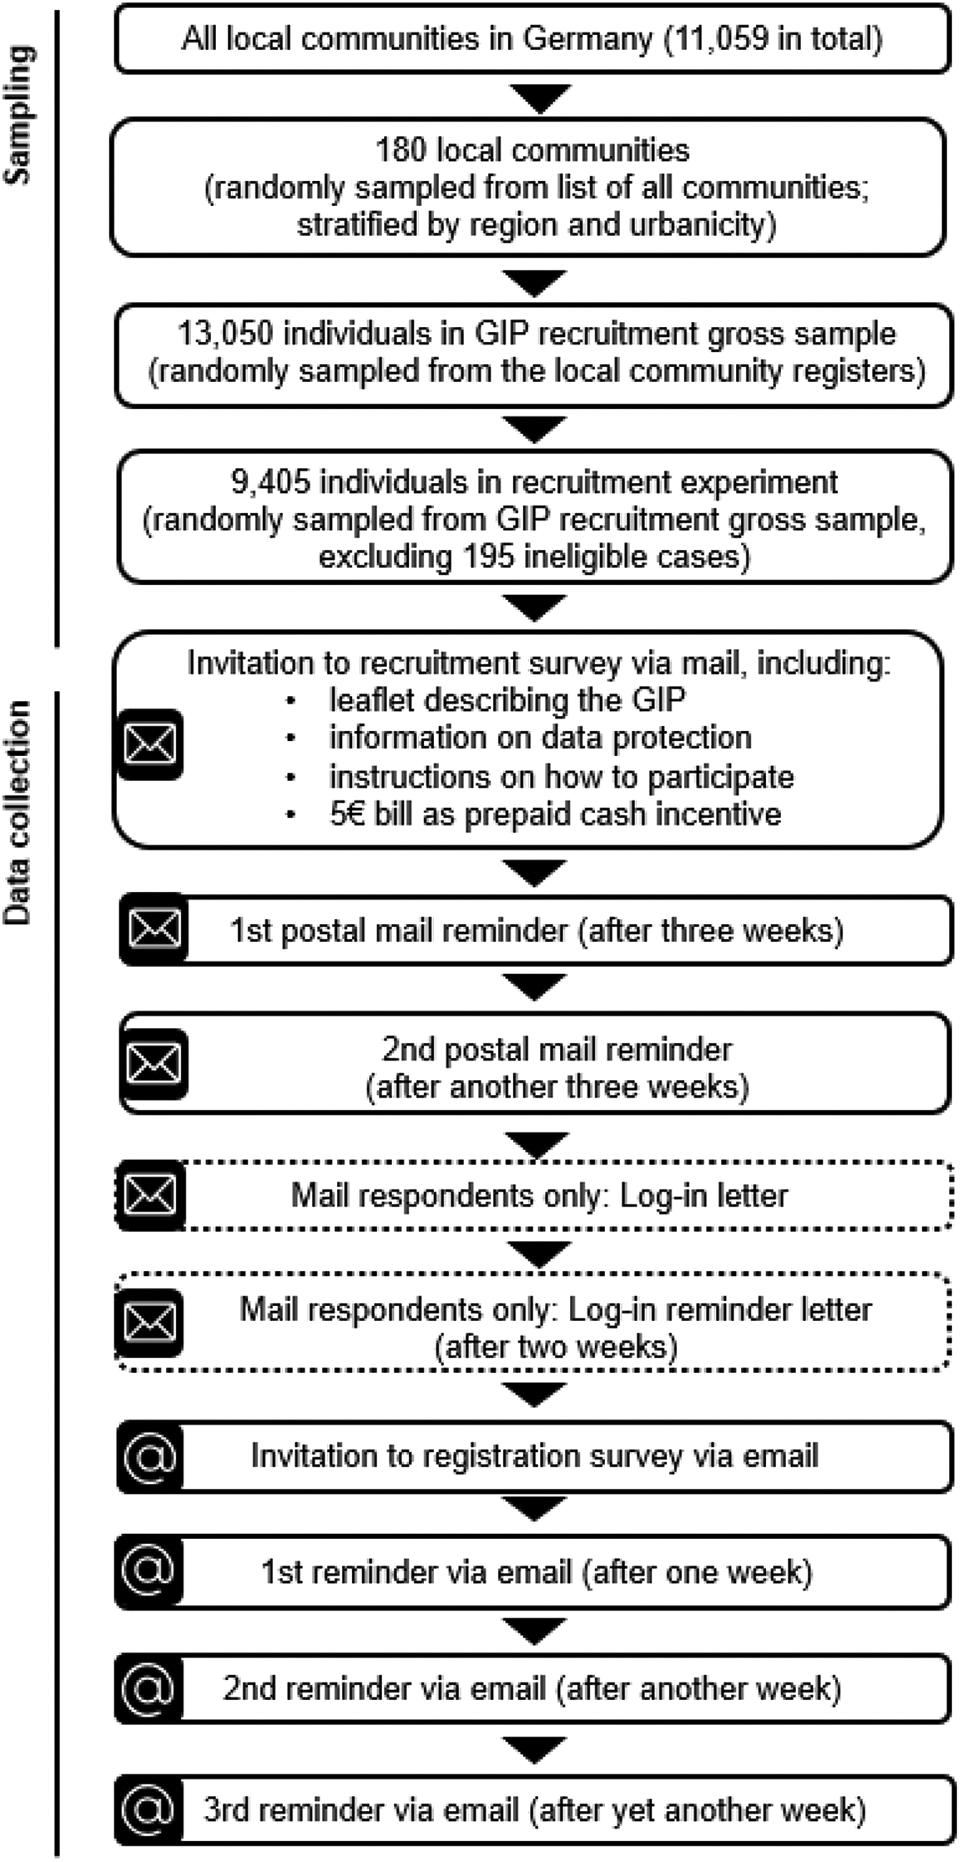
Graphical summary of the sampling and recruitment protocol.
Fieldwork for the panel recruitment started on September 13, 2018, and closed on February 28, 2019, with the large majority of cases recruited during the first 2 months. The recruitment survey contained 13 questions on attitudes toward digitalization and societal change, internet use, and socio-demographics (see the Online Appendix for the full questionnaires). The subsequent registration survey contained approximately 20 questions (depending on how many follow-up questions were triggered by filters). The central purpose of the registration survey was to obtain panel participation consent. In addition, the registration survey contained some questions to complete the panel members’ profiles (e.g., address confirmation, incentive payout preferences, further socio-demographic information; see the Online Appendix). Overall, 37.8% of all gross sample members assigned to the recruitment experiment participated in the recruitment survey and 22.7% of all gross sample members assigned to the recruitment experiment participated in the subsequent registration survey (see Figure A1 in Appendix A for more information).
Experimental groups
Four mail recruitment strategies were tested against each other: online-only, concurrent mode, online-first, and paper-first. The sample of individuals assigned to the recruitment experiment was randomly split into four experimental groups of equal size (n = 2,400 in each group; 195 cases were later identified as ineligible, see Appendix B and Table A1 in Appendix A for more information). Depending on their experimental group, sampled individuals were either invited and/or reminded to participate in a paper and/or online version of the recruitment survey (see Figure 2). The content of the invitation letters, reminder letters, and other study material was identical across experimental groups, except for necessary differences needed for the treatment.
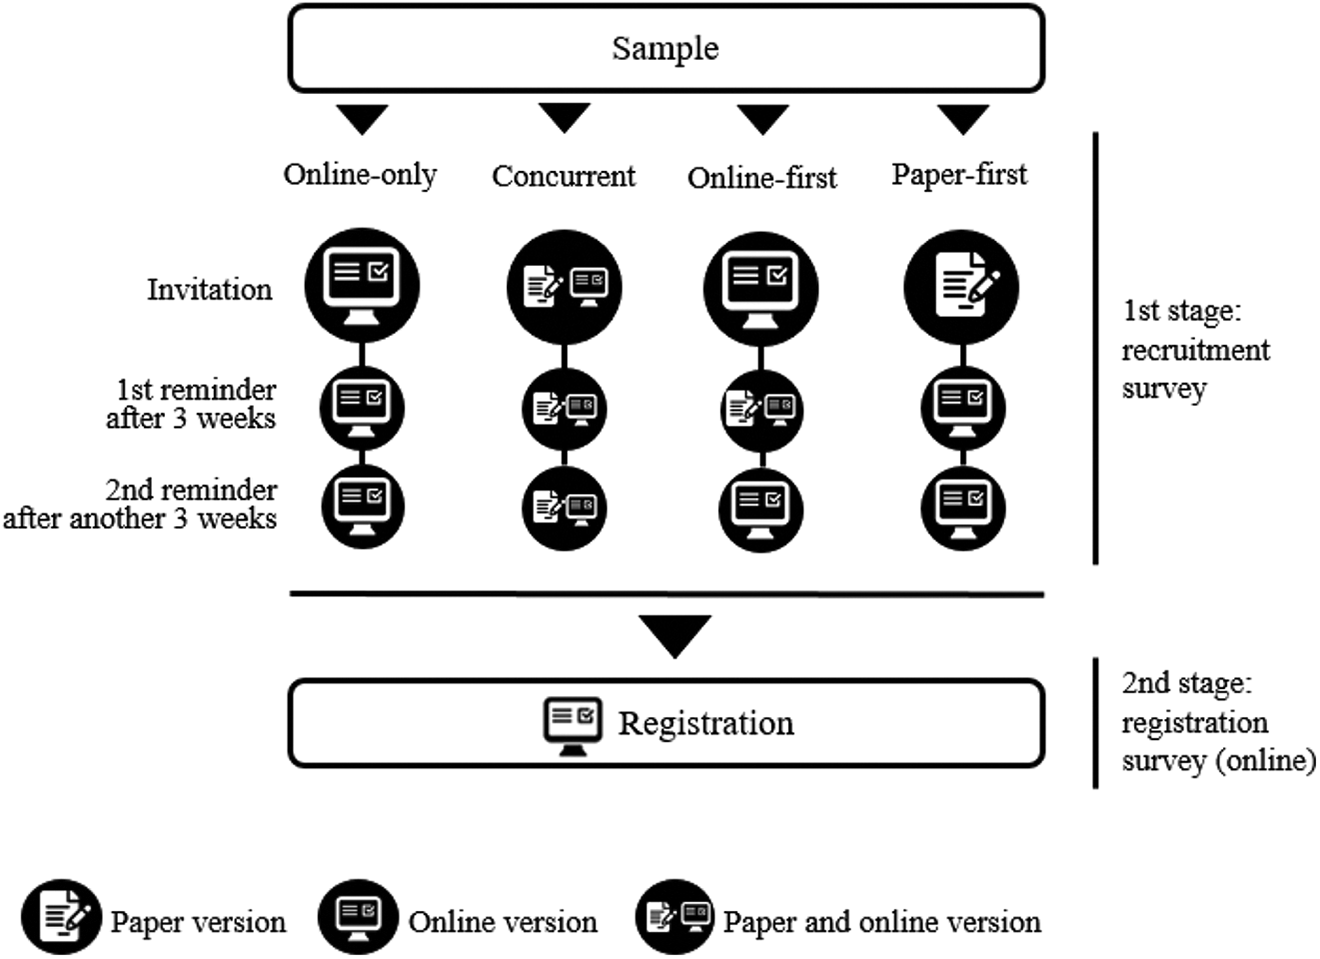
Overview of the recruitment process and experimental setup.
Online-only
Sample members in the online-only experimental group received an invitation letter via mail that contained a link and log-in credentials for the online version of the recruitment survey. Sample members who had not logged in to the online version of the recruitment survey after 3 weeks received a first reminder letter with a link and log-in credentials for the online version of the recruitment survey and a second reminder letter with the same information after another 3 weeks.
Concurrent mode
In the concurrent mode, sample members received an invitation letter via mail containing the paper version of the recruitment survey and a prepaid mail-back envelope as well as the link and log-in credentials for the online version of the recruitment survey. In the invitation letter, sample members were informed that they could pick the data collection mode they preferred. Sample members who had neither sent back the paper questionnaire nor logged in to the online version of the recruitment survey received two reminder letters. Each of the reminder letters included the paper questionnaire and the prepaid mail-back envelope as well as the link and log-in credentials for the online version. In each of the reminder letters, sample members were, again, instructed to pick their preferred mode.
Online-first
In the online-first experimental group, sample members first received an invitation letter via postal mail that contained a link and log-in credentials for the online version of the recruitment survey. The invitation letter did not mention the paper mode offered in follow-up mailings. Sample members who had not logged in to the online version of the recruitment survey after 3 weeks received a reminder letter that, again, included the link and log-in credentials for the online version of the recruitment survey, along with the paper version of the recruitment survey with a prepaid mail-back envelope. Sample members who had neither participated in the online version of the recruitment survey nor sent back the paper questionnaire after another 3 weeks received a second reminder letter that, once again, contained the link and log-in credentials but no paper questionnaire or envelope. However, sample members were informed that they could still send back the paper questionnaire that they had received with the first reminder letter. The decision to only include a paper questionnaire in the first reminder letter and not in the second reminder letter was made to strengthen the emphasis on the web as the dominant mode.
Paper-first
In the paper-first experimental group, sample members received an invitation letter via mail containing the paper version of the recruitment survey and a prepaid mail-back envelope. Sample members who had not sent back the paper questionnaire within 3 weeks received two reminder letters that included the link and log-in credentials for the online version of the recruitment survey. In the reminder letters, sample members were informed that they could—if they preferred—still fill out and send back the paper questionnaire that they had received with the invitation letter. However, they did not receive another paper questionnaire and prepaid mail-back envelope. By not providing the paper questionnaire again with the reminder letters, we aimed to avoid the decision-making burden for the respondents which is suspected to be responsible for the comparatively low response rates of concurrent mode surveys (see Medway & Fulton, 2012).
Subsequently, all recruitment survey respondents—independent of their experimental group—were invited to the online panel registration survey via email. Respondents to the online version of the recruitment survey provided their email addresses at the end of the recruitment survey questionnaire. This email address was then used to send them the invitation to the registration survey. Respondents to the paper version of the recruitment survey received a letter with log-in credentials to the online panel and provided their email address when first logging into the online panel home space. Subsequently, they received the invitation email to the registration survey. This in-between step for the mail respondents was deemed necessary to avoid sending invitation emails to email addresses that the mail respondents may have misspelled or that may have been miscoded when entering their data from the recruitment survey questionnaires. Ensuring that invitation emails were not mistakenly sent to other people (e.g., with a similar email address) was considered particularly crucial because the sample member following the registration survey link would already find some of their personal data (in particular their name and postal address) on their online panel profile.
At the online panel registration survey stage, no paper version of the survey was offered anymore. Nonrespondents to the online panel registration survey received up to three reminders via email. Upon completing the online panel registration survey, respondents become regular members of the GIP and are invited to its bi-monthly online survey waves.
Analytical Strategy
Two metrics are used to assess outcomes of the experiment: response rates (to test Hypotheses 1–4) and sample representativeness (to test Hypothesis 5).
Response rates
For each experimental group, online panel registration rates (
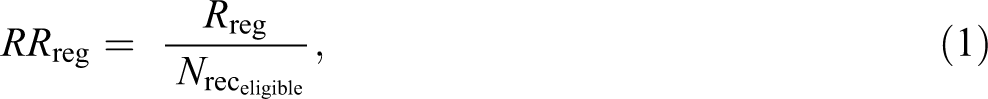
where
Because they might provide valuable background information on whether the different experimental groups perform consistently well in relation to one another or whether some groups perform well at an earlier stage of the recruitment process while others perform better at the final stage, we also compute response rates for the recruitment survey, which takes place prior to the registration survey. To examine progress in participation across the fieldwork period, response rates for each experimental group were calculated cumulatively at each fieldwork day with

where
Sample representativeness
For each experimental group, relative biases (

where
The standard error (

where the SE of the survey estimate
From the SEs of the relative bias estimates, the 95%-confidence intervals were computed. Confidence intervals that do not include zero indicate significant relative biases at the 5%-level.
In addition to exploring the relative biases of all the categories of a set of variables separately, the distribution of the absolute relative biases is investigated by experimental group, focusing on the mean and quartiles of the distribution. The mean across all examined absolute relative biases is commonly referred to as the absolute average relative bias (AARB; Groves, 2006). Similarly, we will refer to the median of the bias distribution as the median absolute relative bias (MARB, see Cornesse & Bosnjak, 2018). Since item nonresponse rates are negligible in all of the included variables (see Table A1 in Appendix A), complete-case analyses were conducted.
The socio-demographic variables included in the bias analyses are gender, age, and education, which were gathered in the recruitment survey, and marital status, household size, and citizenship, which were gathered in the registration survey. The survey data are compared to official German population statistics. These official population statistics are based on the German Mikrozensus (https://www.forschungsdatenzentrum.de/en/household/microcensus) conducted by the German federal statistical agency (Destatis). The Mikrozensus is a mandatory annual survey of 1% of the German resident population. 9
Results
In this section, we first describe differences in response rates (Hypotheses 1–4) and subsequently provide a detailed analysis of sample representativeness (Hypothesis 5) across the four the experimental conditions. In the subsequent Summary section, we will discuss these results in light of whether they support our research hypotheses or not.
Response Rates
The highest online panel registration rate was achieved by the online-only group (24.5%), followed by online-first (22.8%), concurrent mode (22.4%), and paper-first (21.1%; see Figure 3; for more detailed information, including confidence intervals for all response rate estimates, see Table A2 in Appendix A).
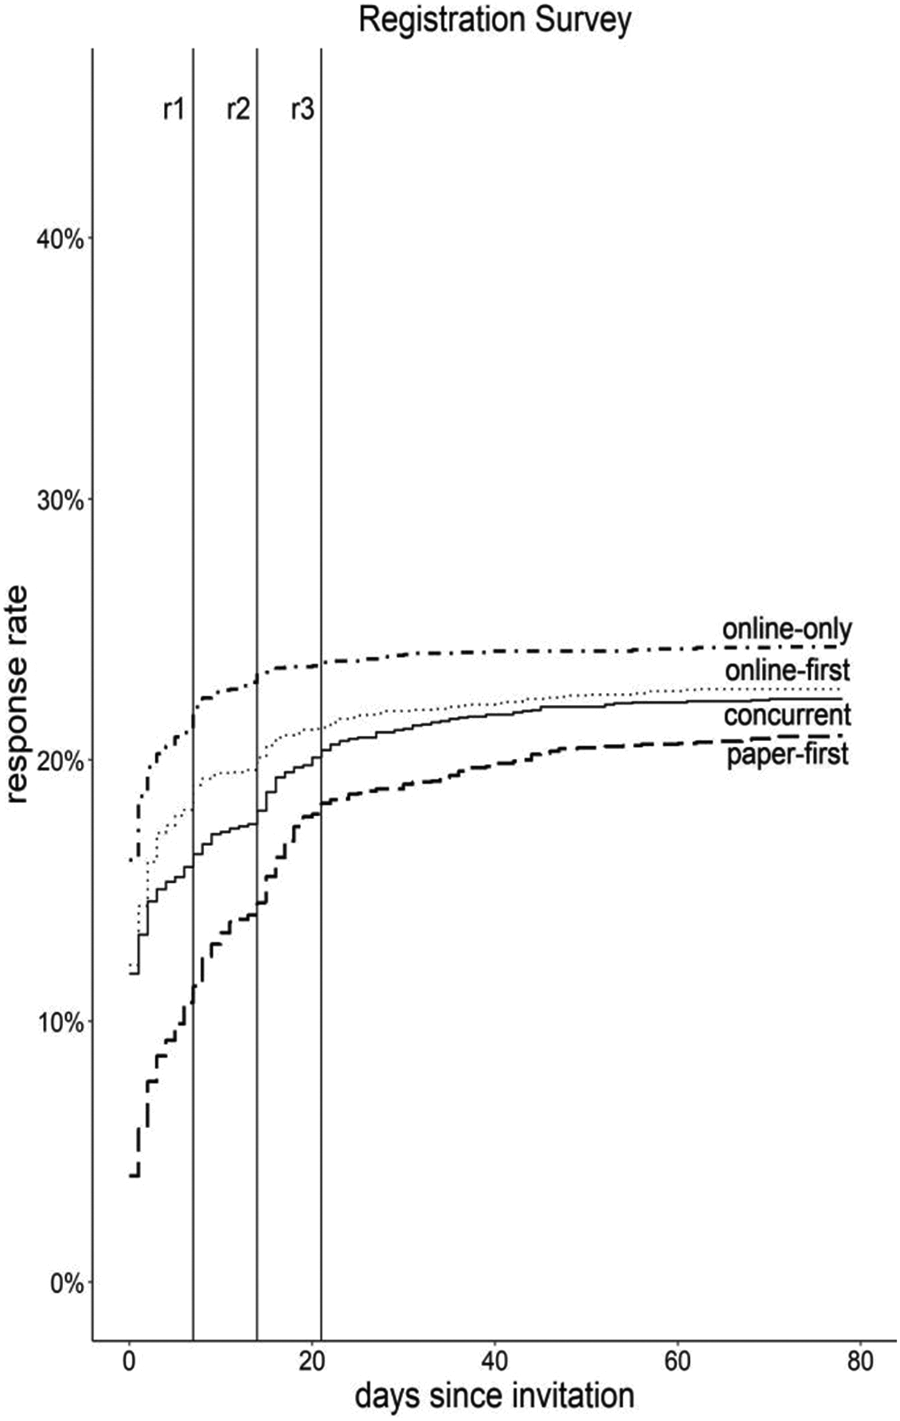
Registration survey response rate by days since invitation and experimental group. Note. Cumulative response rates are based on the gross sample of eligible names and addresses drawn from the population registers. Vertical lines denote sending of reminders (r1 = first reminder, r2 = second reminder, and r3 = third reminder). Graph is truncated at 80 days of data collection.
This is despite the fact that the response rate to the recruitment survey, which took place prior to the registration survey, was highest in the concurrent-mode group (43.9%), followed by paper-first (41.1%), online-first (36.6%), and online-only (29.7%; see Figure A2 in Appendix A). This means that, overall, the online-only design, which eliminates paper questionnaires altogether, obtained the lowest recruitment survey response rate but the highest panel registration rate.
Before the first reminder, panel registration rates were higher in the two groups that promoted the online survey versions at the previous recruitment survey stage (online-first: 19.0%, online-only: 22.0%) than in the two groups that put more emphasis on the paper questionnaires at the recruitment survey stage (paper-first: 11.3%; concurrent mode: 16.5%). The concurrent mode group nearly catches up with the online-first group after the reminders though. The paper-first group achieves a steep increase in participation but never reaches the other groups.
The finding that panel registration rates were highest in the online-only group may in part be attributable to the fact that respondents to the paper version of the recruitment survey had an additional step in the recruitment process that required their action (i.e., they received an additional letter with online log-in information after completing the recruitment survey, see Figure 1). The additional letter may have had a negative impact among the respondents to the paper version of the recruitment survey. Indeed, the lowest online panel registration rate was achieved in the paper-first group, which had the highest overall share of paper respondents in the recruitment survey (share of paper respondents: 83.8%). However, the online panel registration rates in the concurrent mode group and online-first group are nearly identical despite fairly different shares of paper version respondents in the recruitment survey (share of paper respondents in online-first group: 36.0% and share of paper respondents in concurrent mode group: 59.9%).
Sample Representativeness
To gain insights into how well the experimental groups performed in terms of recruiting a sample that adequately represents the general population, relative biases were assessed using a set of socio-demographic characteristics (see Figures 4 and 5 as well as Table A3 in Appendix A). In this section, we focus on the bias results for the online panel registration stage. For some variables (age, gender, and education), we can also examine sample representativeness at the recruitment survey stage (see Figure A3 in Appendix A).
Overall, we find similar biases across all experimental groups. No significant bias can be detected with regard to gender, age, or marital status (see Figure 4). However, we find biases in terms of education, household size, and citizenship (see Figure 5).
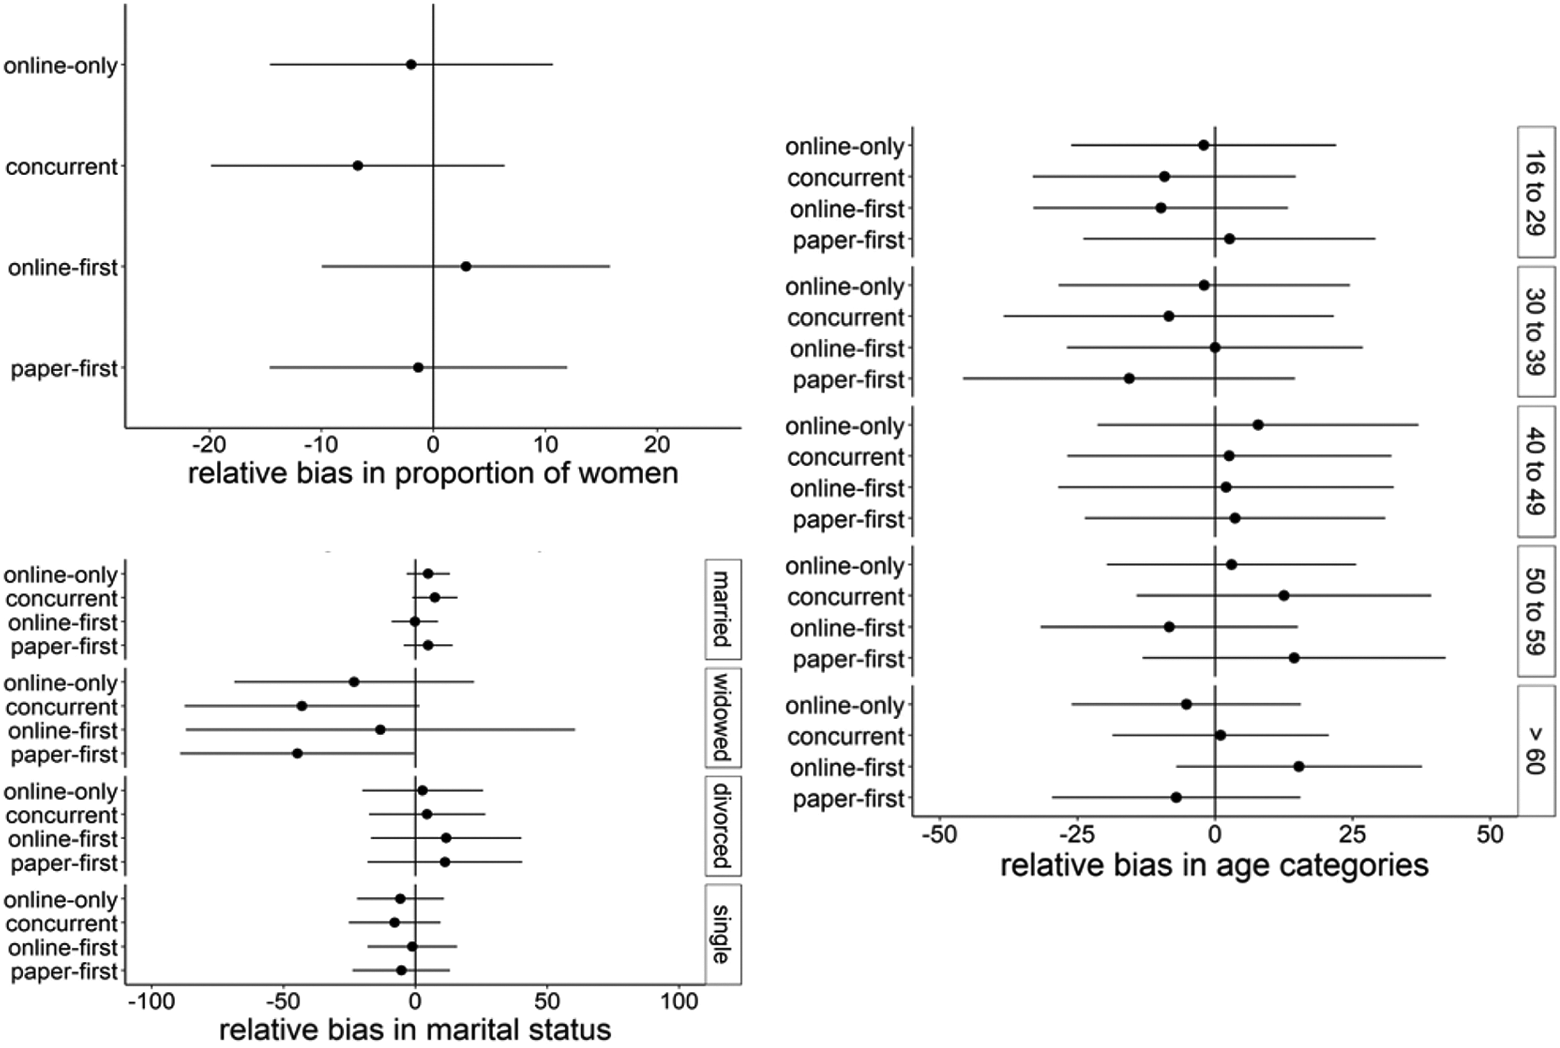
Relative biases in gender, age, and marital status at the registration survey stage across experimental groups. Note. The relative bias estimates are denoted by the dots and 95%-confidence intervals by the horizontal lines.
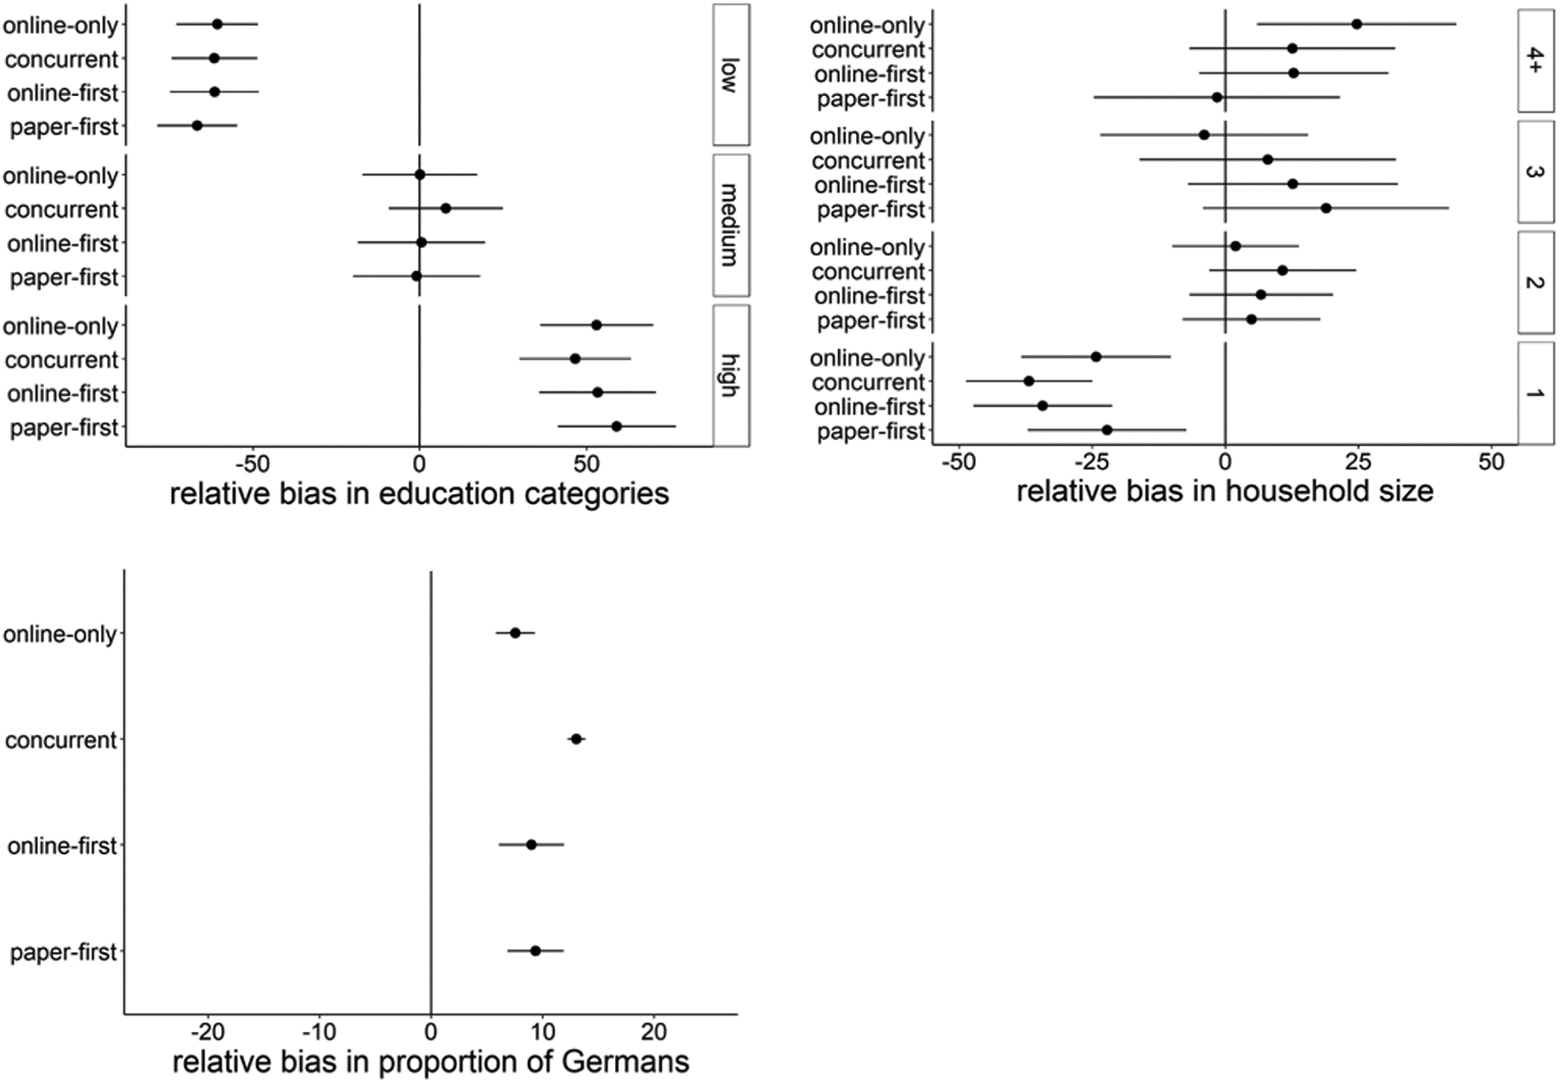
Relative biases in education, household size, and citizenship at the registration survey across experimental groups. Note. The relative bias estimates are denoted by the dots, and 95%-confidence intervals are denoted by the horizontal lines.
With regard to education, all experimental groups underrepresent persons with low education (relative biases: −60.9% online-only, −61.9% concurrent mode, −61.8% online-first, and 67.0% paper-first) and overrepresent persons with high education (relative biases: 57.1% online-only, 50.3% concurrent mode, 57.1% online-first, and 63.1% paper-first). With regard to household size, all experimental groups underrepresent single households (relative biases: −24.3% online-only, −36.8% concurrent mode, −34.5% online-first, and −22.4% paper-first) and the online-only group overrepresents households with four or more members (relative bias: 24.9%). With regard to citizenship, all experimental groups overrepresent German citizens (relative biases: 7.6% online-only, 13.0% concurrent mode, 9.0% online-first, and 9.5% paper-first).
To aggregate the findings described above, the distribution of the absolute relative biases across experimental groups was examined at the panel registration survey stage (Figure 6; see also Table A4 and Figure A4 in Appendix A for results on the recruitment survey stage). Overall, sample representativeness was very similar across experimental groups in terms of the mean, median, and interquartile range of the bias distribution.
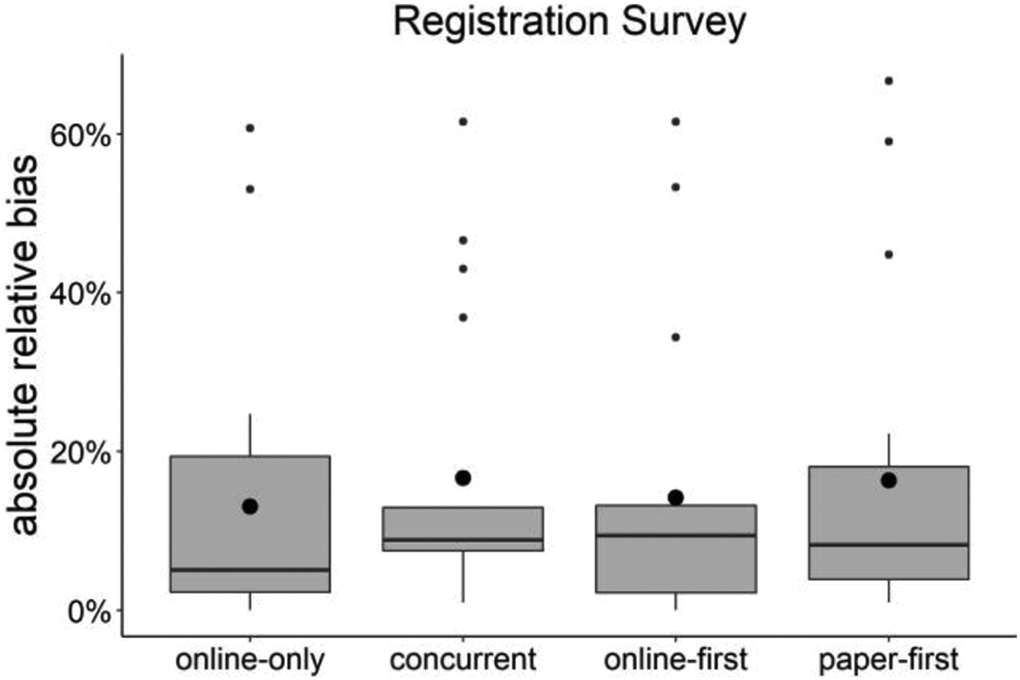
Distribution of absolute relative biases of all categories of the available socio-demographic variables in percent at the registration survey stage across experimental groups. Note. The large black dots denote the absolute average relative bias in each of the experimental groups. The horizontal bar in bold print denotes the median absolute relative bias, while the boxes and whiskers represent the interquartile range and the small dots represent outliers of a standard box-and-whiskers plot. The outliers are mostly due to the comparatively large biases on education.
Regarding the mean of the absolute relative bias distribution, all experimental groups performed similarly at the panel registration stage (AARBs: 13.0% for online-only, 16.7% for concurrent mode, 14.2% for online-first, and 16.4% for paper-first). However, the medians were lower than the means (panel registration stage MARBs: 5.1% for online-only, 8.8% for concurrent mode, 9.4% for online-first, and 8.2% for paper-first). Thus, some large biases in a few categories skew the distribution of the absolute relative biases.
Regarding the interquartile range, we find high overlap across experimental groups. The same is true when examining the variation in relative biases. The outliers displayed in Figure 6 are primarily the education biases observed in Figure 5. Most notably, the maximum absolute relative bias in each experimental group (as displayed by the small dots that lie furthest away from the respective boxes) in each case represents the comparatively large underrepresentation of people with low education (see also Table A4 in Appendix A).
Summary
In the following, we discuss the results described above in light of our research hypotheses.
The evidence from this study does not support Hypothesis 1. The online-only design led to very similar online panel registration rates compared to the mixed-mode designs (24.5% in the online-only group as compared to between 21.1% and 22.8% in the mixed-mode groups). This suggests that offering a paper version of the recruitment survey may not be necessary and that the cost-efficient online-only design may be sufficient to achieve reasonable online panel registration rates.
Based on the evidence from this study, Hypothesis 2 has to be rejected. Online panel registration rates were essentially the same across all mixed-mode designs (between 21.1% and 22.8% in the sequential mode designs compared to 22.4% in the concurrent mode design). Overall, concurrent mode designs performed better than expected (for further evidence of this, see Wolf et al., in press).
The evidence from this study provides little support for Hypothesis 3. The online-first design led to very similar online panel registration rates compared to the other mixed-mode recruitment designs (22.8% as compared to 21.1% and 22.4% in the other mixed-mode groups). This suggests that online-first designs are a viable option for recruiting a probability-based online panel. However, they do not seem to offer a noteworthy advantage over other designs in terms of registration rates.
The evidence from this study provides limited support for Hypothesis 4. The paper-first group had slightly lower registration rates than the other experimental groups (21.1% as compared to between 22.4% and 24.5% in the other experimental groups). These findings suggest that paper-first designs may be a viable option for cross-sectional surveys (see, e.g., Smyth et al., 2010, and our findings regarding the response rates to the initial recruitment survey), but they cannot be recommended for recruiting a probability-based online panel.
Based on the evidence from this study, Hypothesis 5 has to be rejected. All experimental groups performed similarly with regard to the examined socio-demographic characteristics. This suggests that offering mail-back questionnaires during recruitment does not increase the representativeness of probability-based online panels.
Discussion
The findings from our study provide insights into how to best recruit a probability-based online panel via mail. While mixed-mode approaches, such as online-first (which is often referred to as “push-to-web”), might be beneficial for conducting cross-sectional surveys, especially in terms of response rates, this does not seem to apply to the recruitment of online panels. Both panel registration rates and sample representativeness were just as high in the online-only condition as they were in the mixed-mode conditions. However, our results may be confounded by the potential impact of sending people who responded to the recruitment survey via paper questionnaires an additional log-in letter to ensure we did not mistakenly send registration survey invitation emails to the wrong people. While we deemed this additional step for paper respondents to be necessary for data protection and panel management reasons, future research should assess whether and to what extent this may have a negative impact on panel registration success among recruitment survey mail respondents.
It also remains unclear to what extent our findings are generalizable to other countries than Germany. The fact that online-only recruitment design strategies are successfully applied in Norway and the United States indicates that our findings may be generalizable to some other countries. However, more research is needed, in particular, in countries with different demographic profiles and degrees of digitalization. In addition, cultural differences may explain some of the differences between some of our findings and the cross-sectional survey literature. For example, German study participants may appreciate the possibility to pick their preferred survey mode in a concurrent design (leading to our comparatively high recruitment survey response rates in this group), while people in other countries may find it unnecessarily burdensome to have to choose between modes (leading, e.g., to the comparatively low concurrent mode response rates in the meta-analysis by Medway and Fulton in 2012).
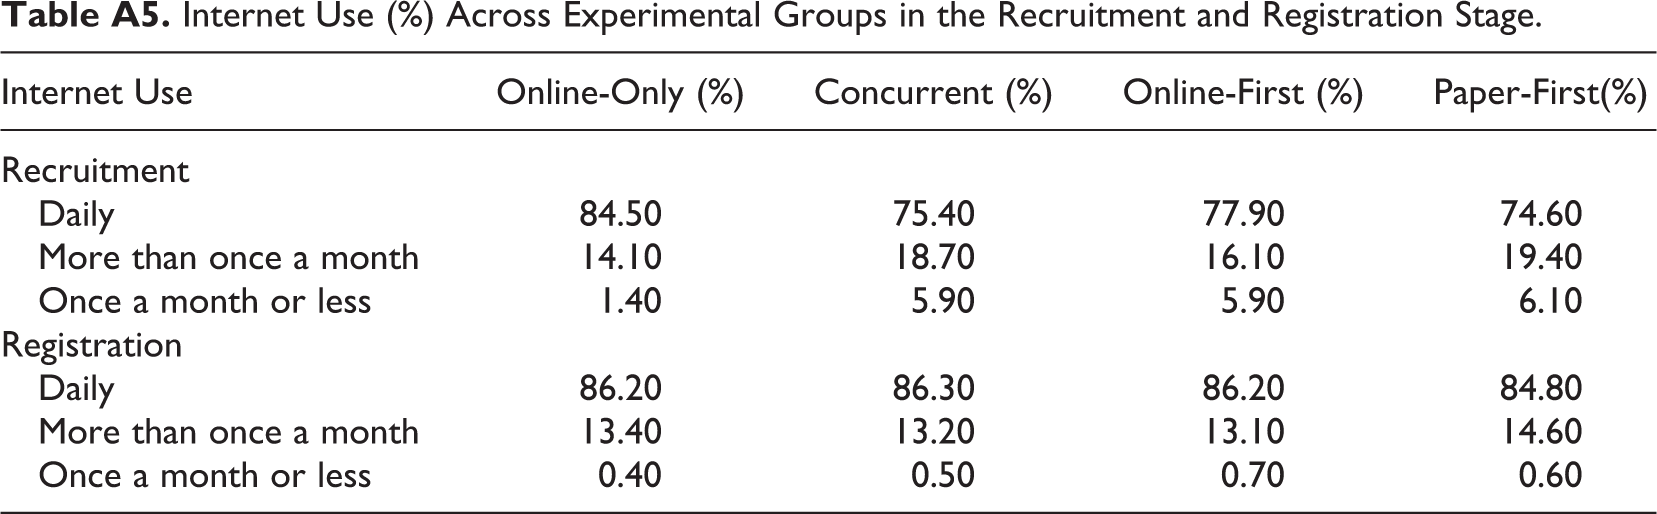
Furthermore, the findings from this study suggest that offering paper questionnaires in the recruitment survey does not have a positive impact on online panel sample representativeness as compared to only offering a link and log-in credentials for online participation. However, it should be noted that this has only been examined with regard to a set of primary socio-demographic characteristics for which widely recognized official statistics were available that could be used as a gold-standard benchmark. It is possible that the mixed-mode recruitment designs increase online panel representativeness with regard to other characteristics, such as political attitudes. Furthermore, the questions asked on topics relating to digitalization and social change that were implemented in the recruitment survey may have kept some non-internet users and late adopters of digital technologies from providing any information, even via postal mail (although Table A5 on internet use by experimental group suggests otherwise). Future research needs to address these limitations and further explore best-practices for recruiting a probability-based online panel via postal mail.
Supplemental Material
Supplemental Material, sj-docx-1-ssc-10.1177_08944393211006059 - Recruiting a Probability-Based Online Panel via Postal Mail: Experimental Evidence
Supplemental Material, sj-docx-1-ssc-10.1177_08944393211006059 for Recruiting a Probability-Based Online Panel via Postal Mail: Experimental Evidence by Carina Cornesse, Barbara Felderer, Marina Fikel, Ulrich Krieger and Annelies G. Blom in Social Science Computer Review
Footnotes
Appendix A
Internet Use (%) Across Experimental Groups in the Recruitment and Registration Stage.
| Internet Use | Online-Only (%) | Concurrent (%) | Online-First (%) | Paper-First(%) |
|---|---|---|---|---|
| Recruitment | ||||
| Daily | 84.50 | 75.40 | 77.90 | 74.60 |
| More than once a month | 14.10 | 18.70 | 16.10 | 19.40 |
| Once a month or less | 1.40 | 5.90 | 5.90 | 6.10 |
| Registration | ||||
| Daily | 86.20 | 86.30 | 86.20 | 84.80 |
| More than once a month | 13.40 | 13.20 | 13.10 | 14.60 |
| Once a month or less | 0.40 | 0.50 | 0.70 | 0.60 |
Appendix B
Authors’ Note
This article uses data from the German Internet Panel (GIP) 2018 recruitment and registration surveys. The authors gratefully acknowledge the support of the SFB 884, in particular of projects A8 and Z1. In addition, the authors would like to thank Don Dillman for valuable feedback on the experimental design, Christian Bruch and Matthias Sand for their help with variance estimation, and our student assistants Marie-Lou Sohnius, Lisa Wellinghoff, Anna Neumann, and Julia Schwab.
Declaration of Conflicting Interests
The authors declared no potential conflicts of interest with respect to the research, authorship, and/or publication of this article.
Funding
The authors disclosed receipt of the following financial support for the research, authorship, and/or publication of this article: The GIP is funded by the German Research Foundation (Deutsche Forschungsgemeinschaft, DFG) through the Collaborative Research Center (SFB) 884 “Political Economy of Reforms” (SFB 884; Project-ID 139943784).
Supplemental Material
The supplemental material (questionnaires, invitation letters, reminder letters, etc.) is available in the online version of the article.
Notes
Author Biographies
References
Supplementary Material
Please find the following supplemental material available below.
For Open Access articles published under a Creative Commons License, all supplemental material carries the same license as the article it is associated with.
For non-Open Access articles published, all supplemental material carries a non-exclusive license, and permission requests for re-use of supplemental material or any part of supplemental material shall be sent directly to the copyright owner as specified in the copyright notice associated with the article.