
Abstract
Studying political opinions of citizens stands as a fundamental pursuit for both policymakers and researchers. While traditional surveys remain the primary method to investigate individual political opinions, the advent of social media data (SMD) offers novel prospects. However, the number of studies using SMD to extract individuals’ political opinions are limited and differ greatly in their methodological approaches and levels of success. Recent studies highlight the benefits of analyzing individuals’ social media network structure to estimate political opinions. Nevertheless, current methodologies exhibit limitations, including the use of simplistic linear models and a predominant focus on samples from the United States. Addressing these issues, we employ an unsupervised Variational Autoencoder (VAE) machine learning model to extract individual opinion estimates from SMD of N = 276 008 German Twitter (now called ’X’) users, compare its performance to a linear model and validate model estimates on self-reported opinion measures. Our findings suggest that the VAE captures Twitter users’ network structure more precisely, leading to higher accuracy in following decision predictions and associations with self-reported political ideology and voting intentions. Our study emphasizes the need for advanced analytical approaches capable to capture complex relationships in social media networks when studying political opinion, at least in non-US contexts.
Introduction
Monitoring the political opinions of the general public is a valuable asset in today’s world. Tracking individuals’ political views and attitudes enables policymakers to develop tailored regulatory measures and supports researchers in studying political trends and factors that shape political opinions and behavior (Dong & Lian, 2021; Schober et al., 2016). Today, various methods exist to study public- and individual-level political opinions. Although self-reports integrated into surveys still dominate the opinion research space (Berinsky, 2017), the utilization of publicly available social media data (SMD) has gained extensive popularity in recent years (Rousidis et al., 2020). Arguably, SMD offers key benefits: Spontaneous expressions of opinions can be captured, accessed and analyzed in real-time without the limitations of predefined response options (e.g., Reveilhac et al., 2022; Schober et al., 2016). Further, the pool of available participants is high with a total of 4.8 billion unique user identities and 400 million active users worldwide across the major platforms as of July 2023 (Kemp, 2023). Although SMD represents a promising tool in social science, the number of studies using SMD to study sociopolitical issues—although increasing—remains relatively low compared to other data sources like self-reports (c.f. Dong & Lian, 2021), especially in countries other than the US. Additionally, existing studies differ greatly in their overall study aim, methodologies and study characteristics (Dong & Lian, 2021). The existing work extracting information about political opinions (e.g., attitudes and ideology) and behavior of users from SMD on an individual level can be broadly categorized based on what type of SMD is analyzed. Most of the work either deployed text analysis or network analysis (or in rare cases a combination of both).
Text analysis aims to transform textual (social media) content into quantitative data using (automated) lexical analyses (Schober et al., 2016). A variety of methods exists within text analysis (for an overview see Eichstaedt et al., 2021), all relying on the theoretical notion that individuals freely share their thoughts and opinions (e.g., in posts) and that derived estimates are based on psycho-linguistic properties of the texts (e.g., Kumar & Sebastian, 2012). A popular text analysis method to analyze SMD is sentiment analysis. Here, researchers first cluster semantically similar words within a text (e.g., social media posts) into categories or contexts which are then used to further categorize the content into positive, negative or neutral (and infrequently more detailed) sentiments. The contextualization of words in these models to extract sentiments is done using dictionary-based approaches, word embedding models or (nowadays increasingly popular) transformer-based models (Widmann & Wich, 2023). Finally, the estimated sentiment of posts is then used to predict sociopolitical outcomes (see Skoric et al., 2020, for an overview of recent studies). Notably, not all studies on SMD explicitly model sentiments. Some works also use machine learning models (ML) to directly use the contextualized words to predict sociopolitical outcomes (Skoric et al., 2020). Although using text analysis—specifically sentiment analysis—has yielded promising results in the past (e.g., Chung & Zeng, 2016; Lansdall-Welfare et al., 2012; Tumasjan et al., 2010), recent meta-analyses and reviews have revealed significant divergences in their prediction accuracies of sociopolitical outcomes (e.g., Rousidis et al., 2020; Skoric et al., 2020). This may not only be due to large differences in the analyzed political outcomes, data sources and political systems but also due to the model types used, with ML models yielding the highest prediction performance of political opinions and sociopolitical outcomes (Skoric et al., 2020).
Further, recent articles also showed that so-called network analysis approaches often outperformed text analysis approaches in estimating (or predicting) political opinions, with the highest accuracy observed when using both approaches in combination (e.g., Skoric et al., 2020). Based on these results and as argued by others, network analysis presents a promising way to study political opinions and sociopolitical outcomes using SMD (e.g., Gayo-Avello, 2013; Kwak & Cho, 2018; Livne et al., 2021; Pallavicini et al., 2017), which is why we will focus on this approach in our work. Network approaches use the connections (i.e., follows) and interactions (i.e., sharing, likes and comments) between users, so-called relational edges, to extract information about individuals’ political opinions and behavior. Such approaches rely on the theoretical notion that interactions and following decisions of users represent signals of their political opinions (e.g., attitudes and ideology) (e.g., Barberá et al., 2015). In line with that, research has shown that individuals tend to be more likely to connect with individuals who are similar to them, for instance, those who share their (political) opinions (McPherson et al., 2001), a phenomenon known as homophily. Especially on social media, such a tendency can be strengthened by friend recommenders and other algorithms (Aral, 2020). Although the homophily assumption describes a general tendency and does not imply that all individuals only connect with like-minded others, most empirical studies have shown that—much like in the real world—like-minded users (e.g., similar opinions) are more often than not connected on social media and, consequently, are also more likely to form homogeneous opinion networks (e.g., Aiello et al., 2012; Cinelli et al., 2021; Figeac & Favre, 2023; Khanam et al., 2023; Lee & Brusilovsky, 2010; McPherson et al., 2001; Pallavicini et al., 2017). Building on the homophily assumption, we also aim to estimate individuals’ political opinions from their social networks.
Although manifold approaches and model classes exist to analyze social networks, an essential method is dimensionality reduction (DR). DR presents a family of tools to condense the network structure (i.e., user and their connections) to create a more compact and informative representation of the network (Chikhi et al., 2007; Nishana & Surendran, 2013). In previous research, DR has been used to enable network models to work with high-dimensional SMD through creating embeddings (e.g., Chikhi et al., 2007; Grover & Leskovec, 2016; Yan et al., 2007) or was indirectly built into (advanced) models (e.g., layer transformations & pooling in Graph Convolutional Neural Networks, Bronstein et al., 2016; Zhang et al., 2019). However, DR methods have also been used standalone in network analysis for user clustering and community detection (e.g., Al-Omairi et al., 2021; Zarzour et al., 2018), uncovering hidden structures (e.g., Chikhi et al., 2007) or extracting global network characteristics like religious beliefs (e.g., Kurucz et al., 2008). Notably, and relevant to our approach, many studies on estimating (individual-level) political opinions from SMD have also used standalone DR models. For instance, Barberá et al. (2015) successfully used DR to analyze ideological segregation and cross-ideological communication in social networks. Wojcieszak et al. (2022) used DR to analyze ideological congruency in the interaction of social media users with politicians and news organizations, while Barberá (2015a) and Bond and Messing (2015) used DR to estimate political ideology of Facebook and Twitter users (renamed to “X”; we use the name “Twitter” throughout the work like it was called during data collection) which correlated with self-reported political opinions and was predictive of voting turnout.
Although studies using standalone DR have yielded promising results, they exhibit a few limitations that we will address in the present study. First, the DR techniques used so far to extract individual-level political opinions from SMD (e.g., ideology, beliefs and attitudes) tend to be relatively simplistic. That is, studies mostly used models such as Correspondence Analysis (CA) or linear latent space models (e.g., Barberá, 2015b; Barberá et al., 2015; Eady et al., 2019; Tausanovitch & Warshaw, 2017). However, these models focus on linear relationships in the data and thus are likely to perform badly in instances when more complex, non-linear relationships exist (e.g., De Backer et al., 1998; Nanga et al., 2021). We argue that similar to SMD sentiment analysis, where more complex ML models increased estimation performance (Anjaria & Guddeti, 2014; Skoric et al., 2020), network-based analysis of SMD would also benefit from using complex ML models. This is because individual political opinions (such as ideology) are complex phenomena and a linear combination of factors (i.e., followed accounts) seems unlikely to explain this manifoldness. Social networks—including those on platforms like Twitter—can be understood as complex systems (Boccaletti et al., 2006; Tunstel et al., 2021). As such, the different nodes (i.e., Twitter accounts) in a social network may interact, communicate, provide feedback to each other, and adjust accordingly. Looking at social networks from the angle of cybernetics, causal feedback loops continuously impact nodes in their thinking, attitudes, and behaviors (Tilak et al., 2023). In such networks, next to linear and non-linear effects, also synergetic effects can occur between nodes. Therefore, posts, likes, shares, etc. from various accounts a user follows, might exhibit synergetic effects that only occur at a specific constellation and/or complex non-linear, non-additive effects might shape the opinions of the user, including ideological views. Such effects, however, are unlikely to be caught by simplistic linear models. Complex ML models therefore seem more fitting to examine complex network structures and ultimately individuals’ opinions (Silva & Zhao, 2016). Notably, however, they have not been widely applied to extract individual-level public opinions from SMD.
Further, most studies so far have been conducted in the US political context (e.g., Barberá et al., 2015; Bond & Messing, 2015; Brito et al., 2021; Eady et al., 2019). It is questionable if their results would translate to other parts of the world, since estimating individual political opinions of users in bipartisan political systems (such as the US) seems much simpler than in more complex, multiparty systems like most European countries (Traber et al., 2023; Wagner, 2021). Further, previous studies analyzing cross-country network compositions revealed that European Twitter users usually have more ideologically heterogeneous networks than US users, making it potentially harder to pinpoint their political opinion from their network structure (Barberá, 2015b). To our knowledge, only one study by Barberá (2015b) explicitly estimated individuals’ political opinions from social media networks in countries other than the US. However, validation of the opinion estimates was limited to the correlation of political elites (i.e., followed political accounts by individual users) with expert ratings. Therefore, the feasibility and accuracy of estimating individuals’ political opinions from social media networks in non-US contexts is still understudied.
In the current study, we aim to address the mentioned limitations. Our primary research objective is to examine if general political opinions of non-US social media users can be estimated based solely on their Twitter network structure. Further, we aim to test if a complex, non-linear DR model outperforms a widely used linear DR model in extracting these opinions. Specifically, we employ an unsupervised Variational Autoencoder (VAE) ML model and a linear CA. Thereby, we obtain a point estimate for each social media account in latent space which we assume to represent their general political opinion. To test the capability of both models to estimate individuals’ political opinions, we first compare their DR performance on the same dataset and inspect the distribution of point estimates to validate how closely they resemble expected opinion distributions (from left-leaning to right-leaning). In the final validation step, we correlate the models’ point estimates with self-reported opinion data (symbolic ideology and voting intention) for a sub-sample of users from a dataset surveyed in 2021.
Methods
Data Collection and Pre-Processing
To facilitate individual-level opinion estimation, we analyzed the connections of regular, politically interested Twitter users with political accounts which present a clear political stance. For the most part, we followed the approach of Barberá et al. (2015). First, we identified the Twitter accounts of German politicians and their followers. To accomplish this, we created a list of German politicians in office in all sixteen federal states or the national parliament and matched each politician with their Twitter account. A detailed description of this procedure can be found in the supplemental materials, I.I. In total, we retrieved N = 1434 active Twitter accounts of German politicians. Next, using their Twitter user IDs, we queried the complete follower list of each account. Data collection took place in July 2022. In the following, we refer to the retrieved followers of political accounts as users. Similar to previous studies and to improve data quality (e.g., Gayo-Avello, 2013; Kwak & Cho, 2018), we pre-processed the user lists by removing politicians following each other and user accounts created after our survey data collection (see supplemental materials, I.I for full procedure). After the initial pre-processing, the list of users following political accounts resulted in N = 13 306 769 unique users. Next, analogous to Barberá et al. (2015), we only kept users, who followed at least 10 political accounts to reduce the number of inactive accounts and focus on politically interested users. The final user count after these steps resulted in N = 276 008 unique users. Although this final list only encompassed a subset of all followers obtained in the first step, we expected this reduction based on similar following rates of political accounts (number of users following ten or more political accounts) in social media networks reported in previous research (e.g., Barberá et al., 2015; Wojcieszak et al., 2022).
Analogous to Barberá et al. (2015), we considered the political opinion of a user as a position (i.e., point estimate) in a multidimensional, latent space which can be obtained from the following structure of Twitter users with the respective political accounts. For our models to calculate these positions, we first arranged users and political accounts in an N × m adjacency matrix, representing the following structure of each Twitter user i ∈ {1, ..., n} (row) for a target political account j ∈ {1, ..., m} (column), with Y ij = 1 indicating a following decision and Y ij = 0, otherwise. Doing so, our adjacency matrix represented a bipartite, directional graph structure (see Tabassum et al., 2018) with initial network matrix dimensions of Y = [276 008 × 1434]. After a further check of this following matrix, we removed seven additional political accounts that were either no longer followed by any user or were mistakenly identified as accounts of politicians previously, yielding the final following matrix Y = [276 008 × 1427]. To validate our models on out-of-sample data, we divided the final matrix into a separate training and test set (90% train and 10% test), resulting in Y train = [248 407 × 1427], Y test = [27601 × 1427] matrices. Further information about the adjacency matrix and dataset splitting procedure can be found in the supplemental materials, subsection I.I.
For our final model checks and the relation of point estimates to self-reported political opinion and behavioral intentions, we used survey data (collected between December 2020 and February 2021) from a study conducted by one of the authors. In total, N = 780 individuals reported on different personality and political opinion items. Relevant to the current study, this survey assessed self-reported symbolic political ideology via the one-item left-right self-placement and voting intentions. Participants were also asked to provide their Twitter user name voluntarily (if they had an account). Of all participants in the study, N = 173 provided a (valid) user name. In the present study, we used the self-report data of these participants to validate our models and refer to it as the self-report dataset in the following. To create this dataset, we first used the reported Twitter user names and queried the Twitter API to retrieve their user IDs. In total, N = 163 unique accounts could be retrieved. Then, we matched user IDs to the IDs in the follower lists of political accounts acquired previously. Since one of our intended models (CA) only works if an individual user follows at least one political account (see Model Selection and Description), we removed all users not following any political account (i.e., all zero values). After applying these procedures, the self-report dataset matrix Y self-report = 119 × 1427 was obtained. Further information about the self-report dataset (including deployed scales, study procedure and ethics approval) can be found in the supplemental materials, subsection I.III and in (Sindermann et al., 2021, 2022, 2023).
Model Selection and Description
As mentioned in the Introduction, manifold network analysis approaches could be applied to our research questions. However, based on our data structure (bipartite, directed graph) and similar to many previous studies on individual-level political opinion (e.g., Barberá, 2015a; Barberá et al., 2015; Bond & Messing, 2015; Eady et al., 2019; Kurucz et al., 2008; Wojcieszak et al., 2022), we used standalone DR models. Specifically, to test whether individual political opinions of German Twitter users can be inferred solely from their network structure and whether a more complex ML model would outperform a simple linear model, we deployed two DR models: Correspondence Analysis (CA) and Variational Autoencoder (VAE).
CA is conceptually related to Principal Component Analysis and can be used to analyze relationships between multiple categorical variables. Specifically, CA uses linear combinations (i.e., transformations) of the original input data to project the rows and columns onto a new, lower-dimensional subspace. Similar to previous studies (e.g., Barberá et al., 2015; Eady et al., 2019), we used CA to reduce the full following matrix Y to a lower-dimensional subspace. Afterward, we analyzed its DR capabilities by reversing this transformation to reconstruct (i.e., approximate) the input data from this subspace and compared it to the original input data. We further checked if projected subspace row coordinates represented Twitter users’ opinion point estimates and if column coordinates represent the overall political positioning of the respective political accounts. The CA was set to reduce the following matrix to two latent dimensions. This was done for several reasons. First, we were interested in obtaining a single point estimate on one latent dimension for each user that is expected to represent their political opinion. In a CA, the first dimension extracted incorporates the highest eigenvalue (i.e., the highest amount of variance captured) of all dimensions, which we assumed to represent overall political opinion (see Barberá et al., 2015, for a similar approach and in-depth description). Second, fitting a CA on large datasets can be computationally expensive. Thus, mapping inputs to fewer dimensions reduces the computation time substantially (e.g., Halko et al., 2011). Lastly, using two dimensions simplifies data visualization by creating a 2D plot of the point estimates, even though we were only interested in the first CA latent dimension. A more detailed description of the CA and its working principles can be found in the supplemental materials, subsection I.II and in Barberá et al. (2015).
Similar to CA, VAE also presents a DR model. However, in contrast to CA, VAEs compress data with greater complexity using non-linear and probabilistic mappings. VAEs are unsupervised ML models based on neural-network autoencoders. They comprise an encoder network for projecting data into a latent distribution and a decoder network for reconstructing the original input from the latent codes. The encoder typically consists of multiple, fully connected layers with the last layer approximating the latent representations (posterior) using a multivariate Gaussian distribution from which the individual latent codes of users and political accounts (much like the projected row and column coordinates in the CA) can be sampled. The decoder part of the network then reconstructs (i.e., approximates) the original input matrix from the sampled latent codes. From an intuitive standpoint, VAEs learn to represent the essence of a dataset (i.e., network structure) in a condensed and structured way. Using a probabilistic, non-linear, neural network-based DR approach, their encoding of users and political accounts should lead to a more nuanced representation and differentiation of political stances in a multiparty system compared to a linear, deterministic DR model like CA. Although adaptations of VAE for network-based data (geometric ML) exist (Variational Graph Autoencoder, see Kipf & Welling, 2016), we used a regular VAE which does not explicitly preserve relational structures between users but only between users and political accounts. This decision was made based on our data structure and the overall goal of estimating users’ opinions from their decisions to (not) follow political accounts analogous to previous studies. To enable model comparison with the CA, we mapped inputs to two latent dimensions in the VAE as well. We assumed that one dimension would represent individuals’ and politicians’ overall political opinions. The VAE used in our study comprised three hidden, fully connected neural layers for the encoder and decoder. The general model architecture is depicted in Figure 1, a detailed description of the VAE (latent code extraction, differences to CA, training procedure and hyperparameter setting) can be found in the supplemental materials, subsection I.II. VAE architecture and analysis procedure. Note: (a) Depiction of the general VAE architecture. Left part (red bars) shows the input and encoder model. Right part (yellow bars) shows the decoder model. (Hidden) layer sizes (data shape) of the VAE are depicted under the respective bars. Green box depicts the sampling layer, in which the user and political account point estimates are extracted (sampled) from the two latent dimensions. (b) Study analysis procedure and workflow for VAE and CA. Detailed information about the VAE model and latent representations can be found in the supplementary material, subsection I.I and I.II.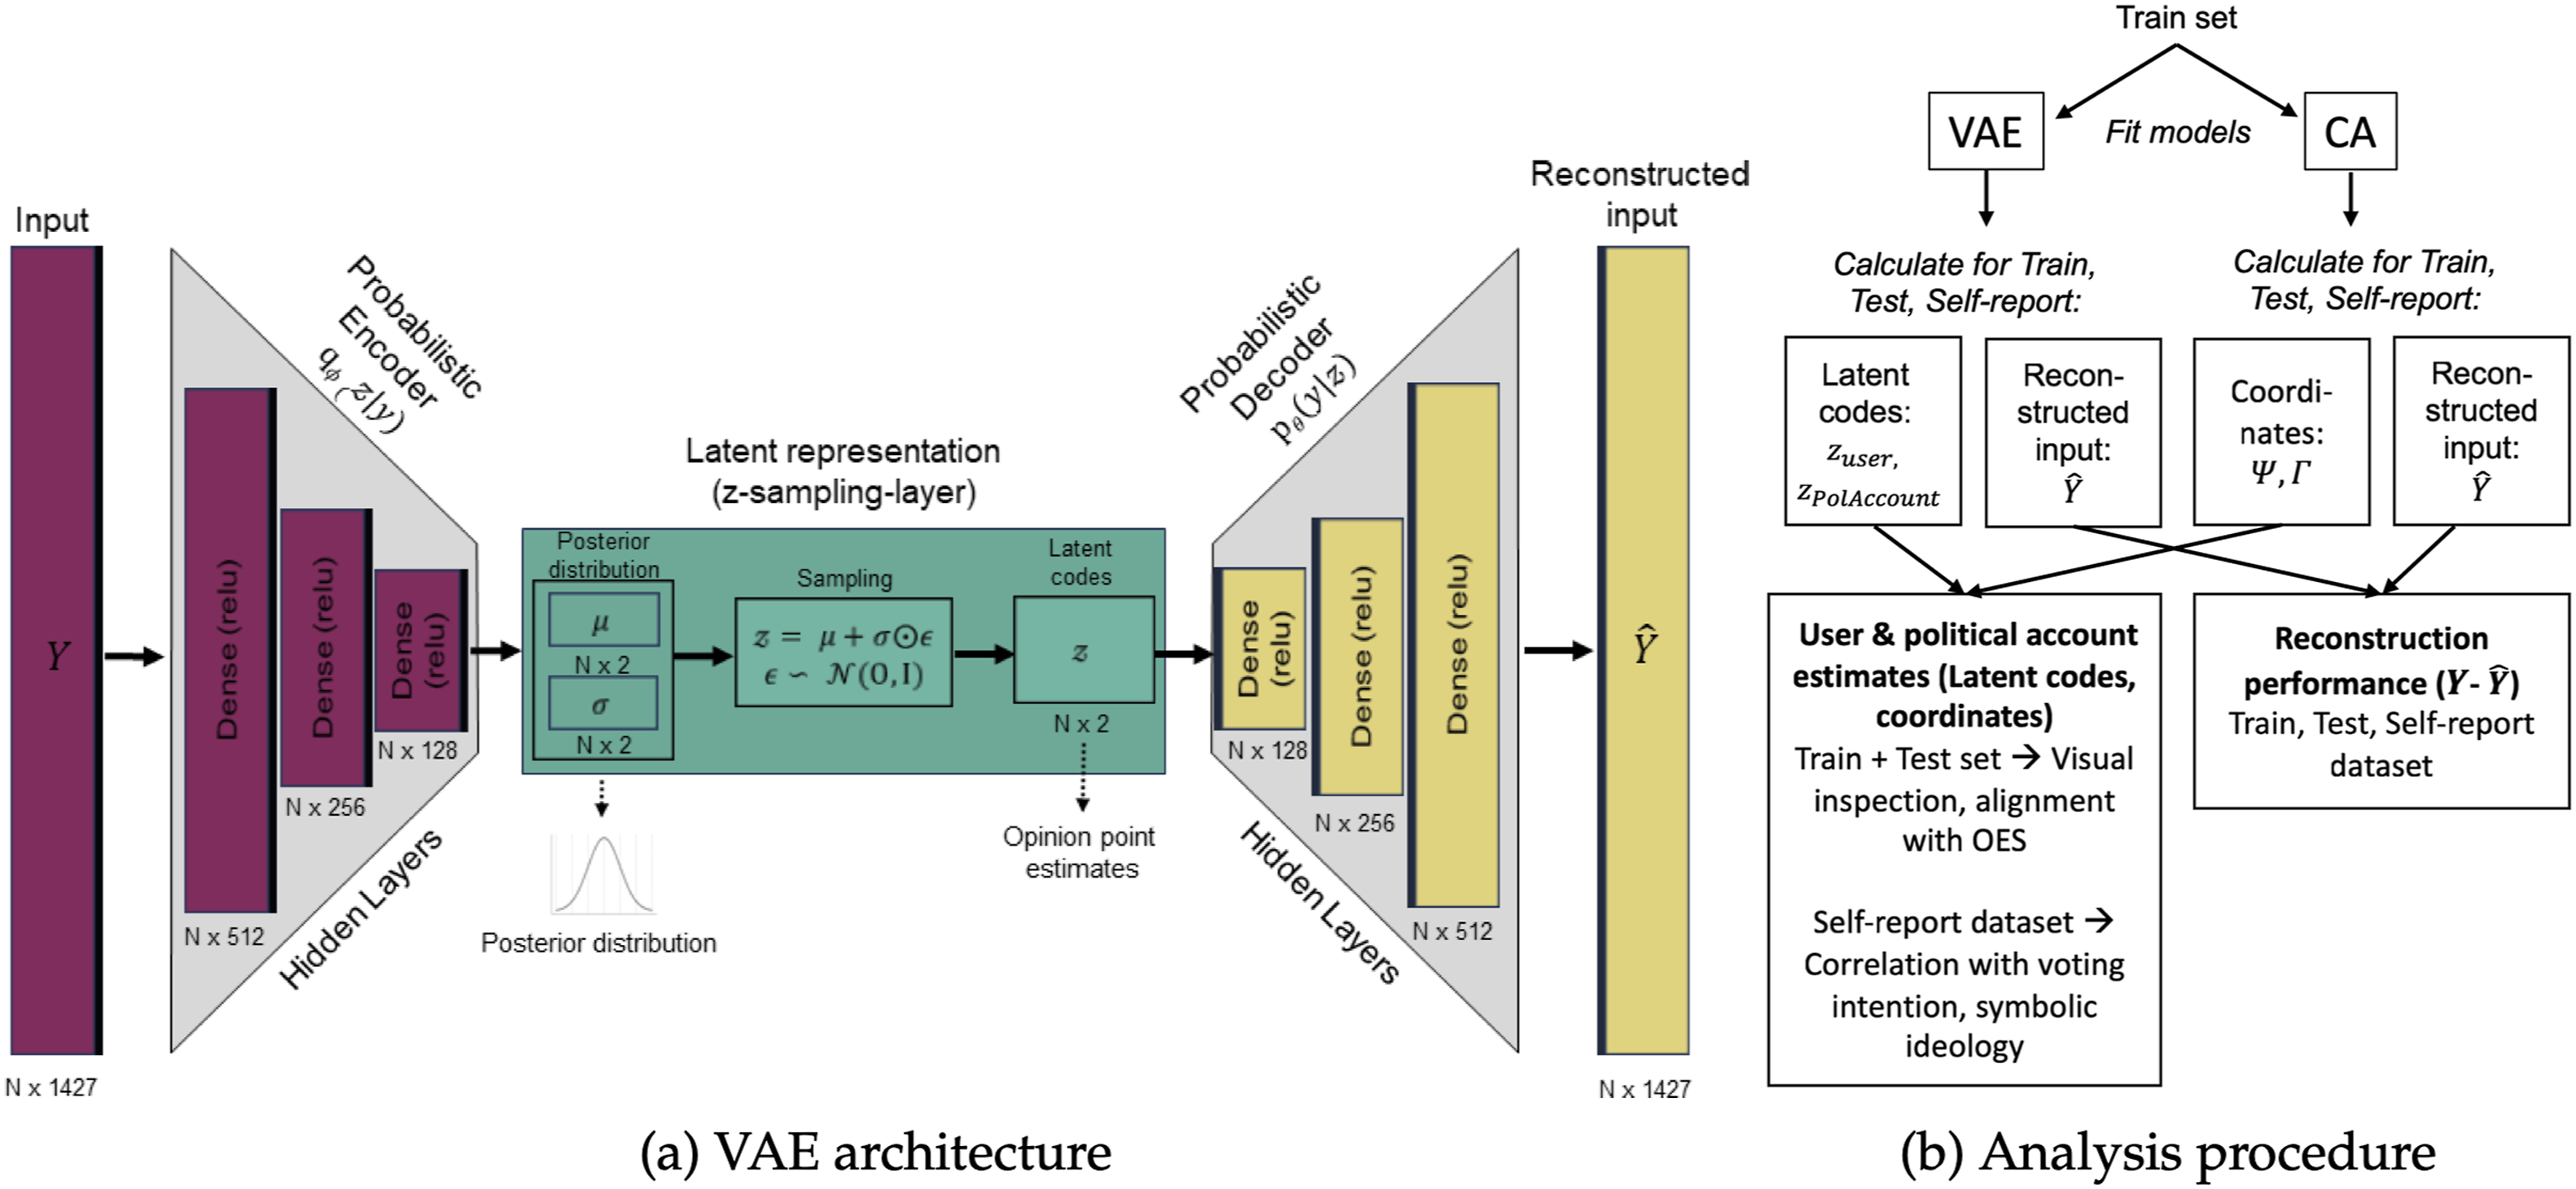
Analysis Procedure
Both the CA and VAE were first trained on the training dataset. For an initial check of how accurately the models compressed the original network (DR performance), we reconstructed the following matrix from the calculated latent dimensions and compared it with the original matrix of the training dataset. Since both the original and reconstructed matrix contained binary data (following status), we used typical classification performance metrics to check model performance. In detail, we calculated Precision, Recall, F1 score, Matthew’s correlation coefficient (MCC) and Balanced Accuracy (BACC). The latter two are particularly well-suited metrics for sparse, imbalanced datasets, common in many network analysis applications (Chen et al., 2024). Imbalance also applies to our study’s data, since only ∼1.7% of all values in the training and test datasets represented “follows” (i.e., ones). Despite not opting for a data resampling technique before model fitting to balance the distribution, MCC and BACC still allowed us to evaluate the models’ performance and capability to represent the minority class appropriately. Also, we assumed follow decisions to be equally important/signaling as non-follow decisions to estimate individual political opinions. We were thus interested in the classification performance for both follow and non-follows, which are better represented by MCC and BACC compared to the aforementioned metrics. Additionally, we calculated the overall proportion of correctly predicted cases (PCP) and the Brier score to enable performance comparison with previous studies (see supplemental materials, subsection II.II). As an uninformed classification baseline and to benchmark both the CA and VAE, we further calculated a Naive Classifier (NCF), which always predicts the positive majority class (“no follow”). After training and evaluating the models on the training set via the reconstruction approach, we applied and evaluated the trained models on the test set using the same classification performance metrics.
Overview of party accounts followed per dataset.
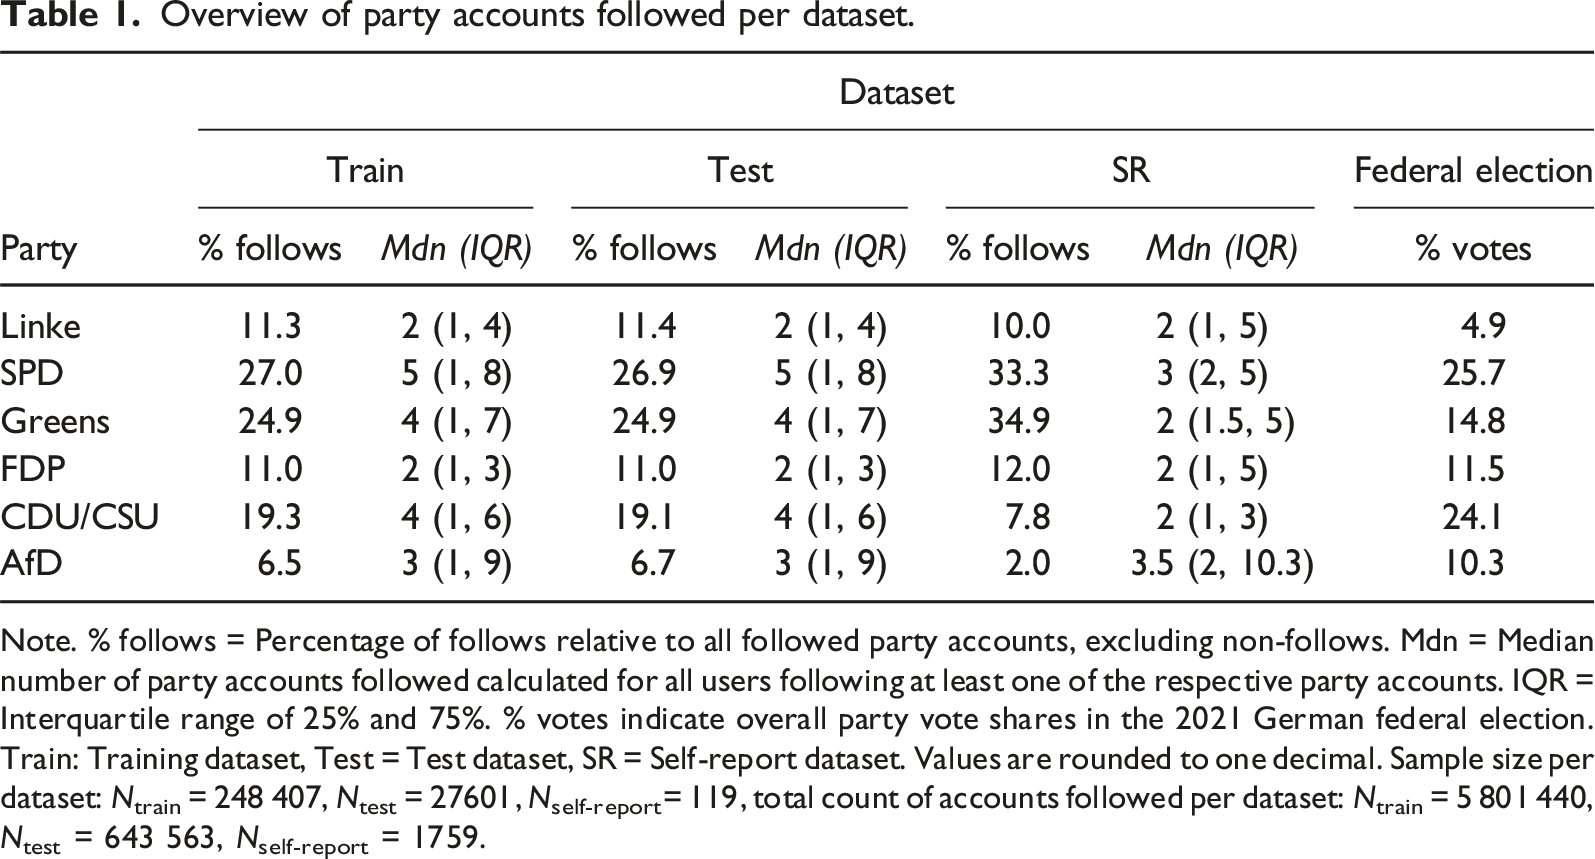
Note. % follows = Percentage of follows relative to all followed party accounts, excluding non-follows. Mdn = Median number of party accounts followed calculated for all users following at least one of the respective party accounts. IQR = Interquartile range of 25% and 75%. % votes indicate overall party vote shares in the 2021 German federal election. Train: Training dataset, Test = Test dataset, SR = Self-report dataset. Values are rounded to one decimal. Sample size per dataset: Ntrain = 248 407, Ntest = 27601, Nself-report= 119, total count of accounts followed per dataset: Ntrain = 5 801 440, Ntest = 643 563, Nself-report = 1759.
Afterward, we checked if the overall estimated political positioning of parties corresponded to their overall political positioning judged by experts. To this end, we again used data from the 2021 OES (Jankowski et al., 2022). Specifically, we used expert ratings positioning each party on a typically used left-right ideology scale ranging from 0–20. To check alignment, we plotted these scores against the median party point estimates of both the CA and VAE from our models. In detail, similar to Barberá et al. (2015), we collated the model column coordinates of political accounts from the same party on the first dimension (matching individual political accounts to their party) and used the median of all these column coordinates as a measure for the models’ overall party positioning. Further information about the extraction of column coordinates can be found in the supplementary materials, subsection I.II. All estimates were standardized to ensure comparability of party positionings in the models and the scores of the OES report. As a final check of our models capturing political opinions, we compared user point estimates with their self-report data in our self-report data set. After applying our trained models on the self-report dataset to get users’ point estimates, we first calculated Spearman correlations between users’ point estimates and their self-reported political (symbolic) ideology assessed on a scale ranging from 1 (left) to 10 (right). We expected a positive relationship between point estimates and symbolic ideology. Next, we plotted users’ point estimates conditioned on their reported party voting intention in the next German Federal election (Sonntagsfrage). Analogous to self-reported ideology, we expected a gradient in overall point estimates. That is, median point estimates of users signaling to vote for more left-leaning parties should be lower than users intending to vote for more right-leaning parties. Further, we used the opinion point estimates to predict self-reported voting intention using a multinomial logistic regression model (see supplemental materials, subsection I.III). However, due to the highly unequal cell sizes with much less participants indicating to vote for more right-leaning parties (see section “Opinion Estimate Validation Using Self-Report Data”), we focus on the visual inspection of point estimate distributions in the main text. Finally, we calculated the respective classification metrics of the reversed (i.e., reconstructed) matrices for the self-report set (see supplemental materials, subsection II.I). Figure 1 provides a visual depiction of the full analysis procedure and workflow.
Results
Reconstruction Performance
Model reconstruction performance.
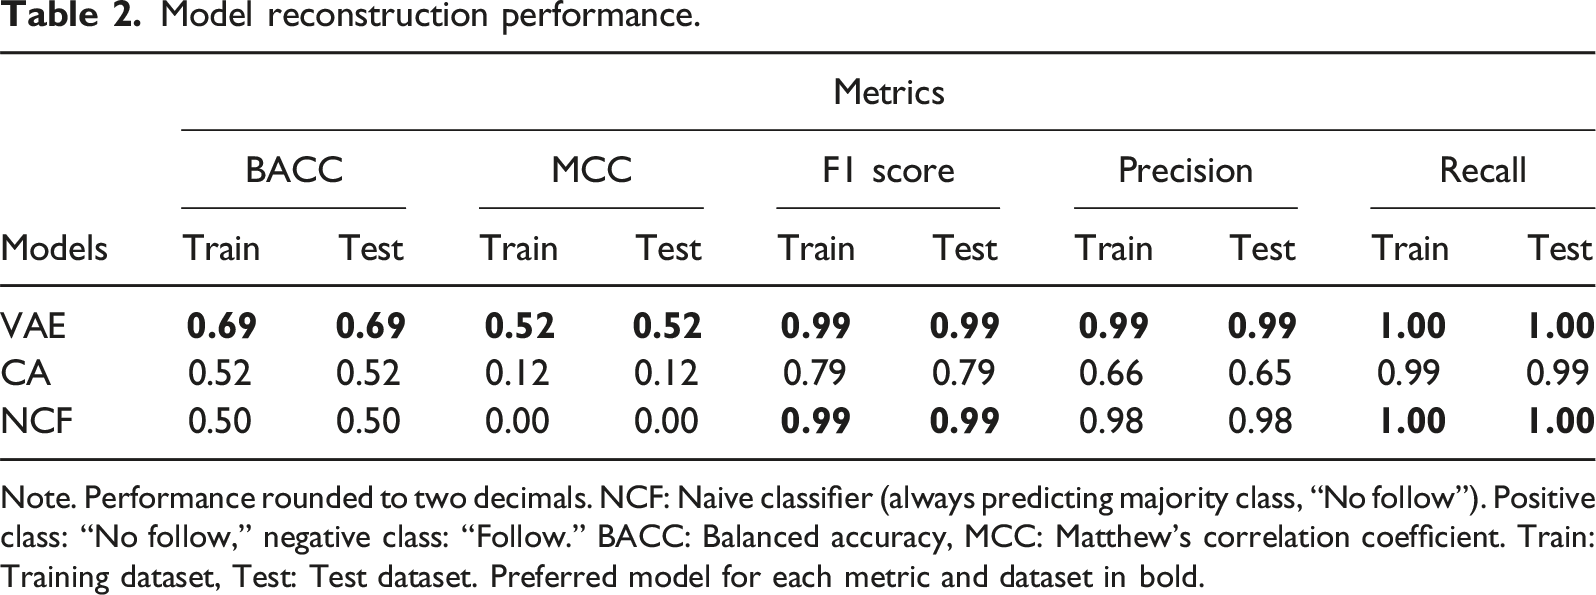
Note. Performance rounded to two decimals. NCF: Naive classifier (always predicting majority class, “No follow”). Positive class: “No follow,” negative class: “Follow.” BACC: Balanced accuracy, MCC: Matthew’s correlation coefficient. Train: Training dataset, Test: Test dataset. Preferred model for each metric and dataset in bold.
Inspection of Opinion Estimates
Next, we visually inspected the latent dimensions and user opinion point estimates. Since the VAE outperformed the CA regarding matrix reconstruction performance, we only show the point estimates for this model in the following (see supplemental materials, subsection II.III for CA point estimates). Figure 2 shows individual user point estimates from the VAE on the two latent dimensions plotted separately for each party. As expected, individuals following a proportionally high number of left-wing parties (Green party, Linke and SPD) appear to have low values on the second latent dimension and vice versa for followers of right-wing parties (AfD, CDU/CSU, FDP). This finding indicates that the second latent dimension in the VAE symbolizes individuals’ general political opinions. The first latent dimension in the VAE seems to represent the magnitude of users’ following decisions. In detail, the more political accounts users followed overall (total follows), the lower their scores in the first latent dimension seem to be. This is indicated by a gradient of large to small points from negative to positive values on the first latent dimension (Figure 2). Supporting this visual inspection, we found a substantial correlation between the total number of followed accounts and user values on the first latent dimension (r = −.54, p < .001). These observations are, however, purely post-hoc interpreted, because we had no prior assumptions about what this latent dimension in the VAE might represent before data analysis. Latent dimensions in the VAE. Note: Opinion point estimates in the VAE for all parties and users (combined training and test set). Each point represents a user, sequentially colored by the percentage of accounts followed per party (total number of accounts followed from a specific party divided by overall followed political accounts) with a brighter hue indicating a lower and a darker hue indicating a higher percentage of accounts followed from the respective party. Point sizes refer to the total number of followed accounts (independent of party) per user. Larger points indicate more followed accounts overall.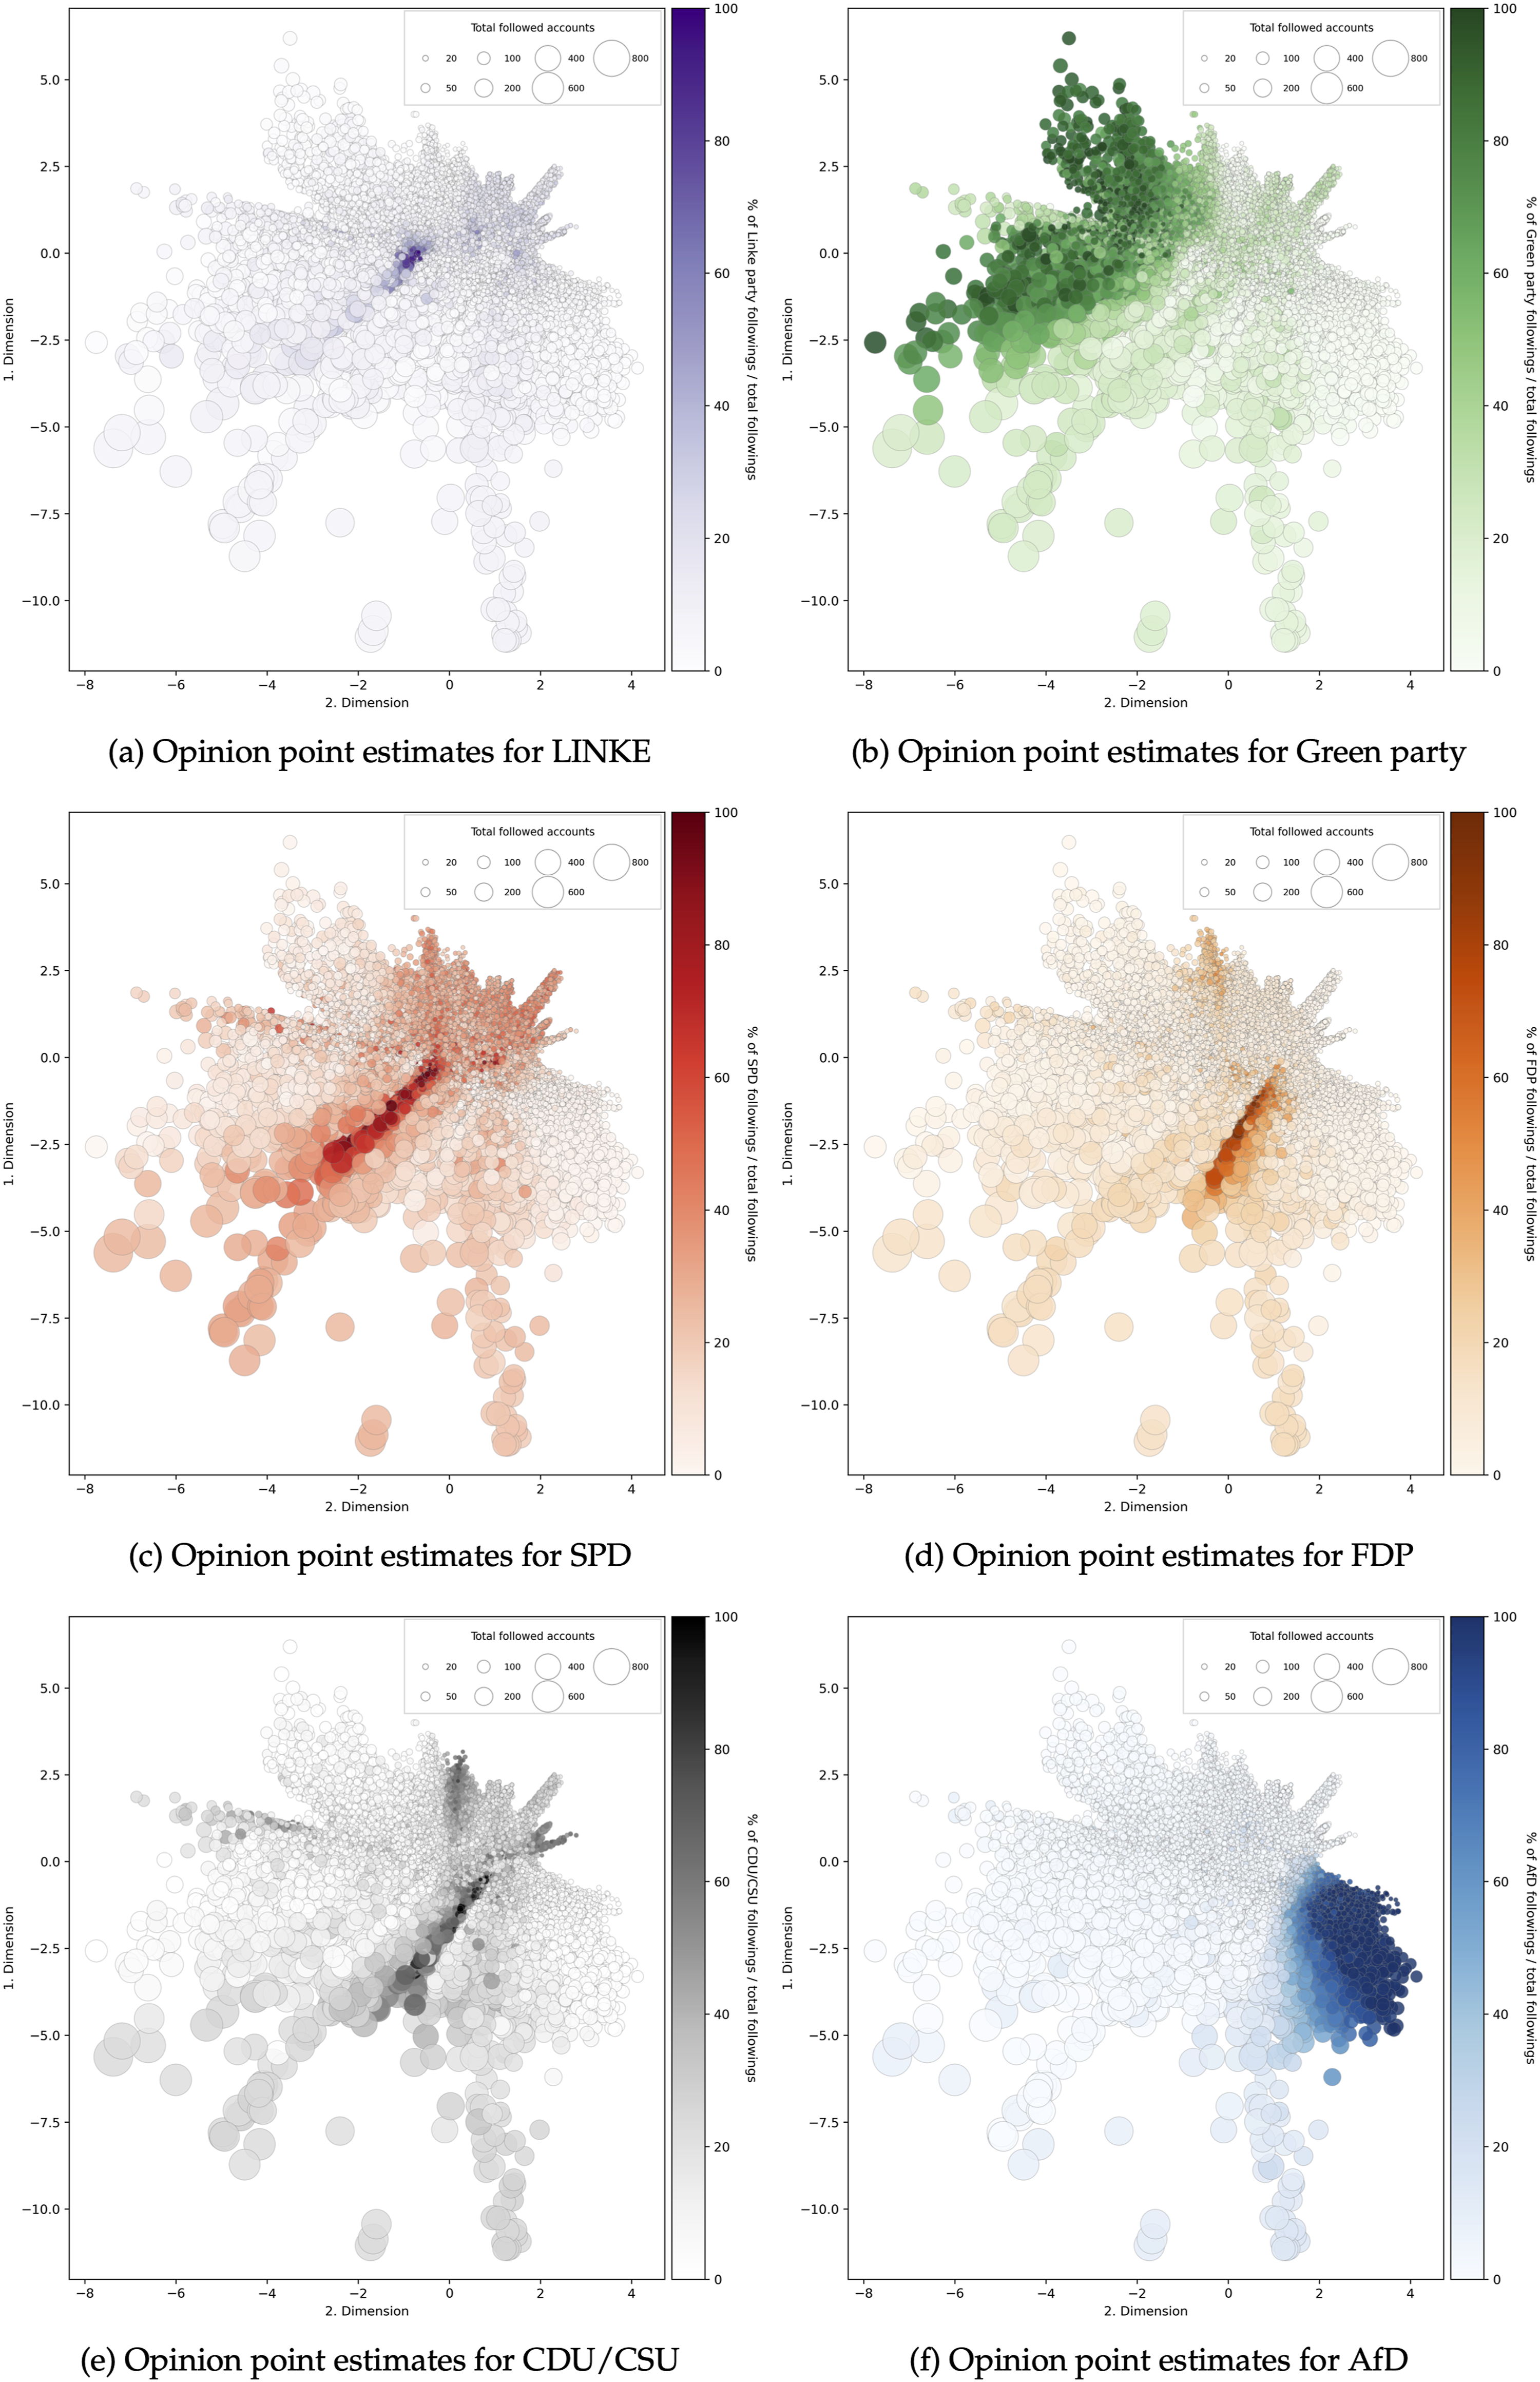
Next, we used the party estimates (i.e., column coordinates) on the second latent dimension in the VAE and the first dimension in the CA to check the overall estimated party alignment with expert ratings from the OES. The results are depicted in Figure 3. Broadly, the VAE more closely matched the expected overall party positions from the OES. The distance to the reference opinion estimates (OES) was lower for most of the parties compared to the CA (except SPD). Additionally, the overall distinction of estimated party positions (i.e., separating more left from more right-leaning parties) in the VAE was higher. In fact, party estimates in the CA were almost identical for five out of six parties (except AfD). Notably, the party estimates in both the VAE and CA for the party LINKE seem to deviate the most from the OES. Comparison of left-right alignment parties. Note: OES estimates represent the mean estimates of party positioning by experts from 2021. The party ordering runs from most left to most right party as identified in the OES. Negative opinion point estimates on the Y-axis represent left-leaning parties and positive ones represent right-leaning parties. Points for VAE and CA represent party opinion estimates, calculated by using the median of all political accounts’ column coordinates for each party. All estimates are standardized.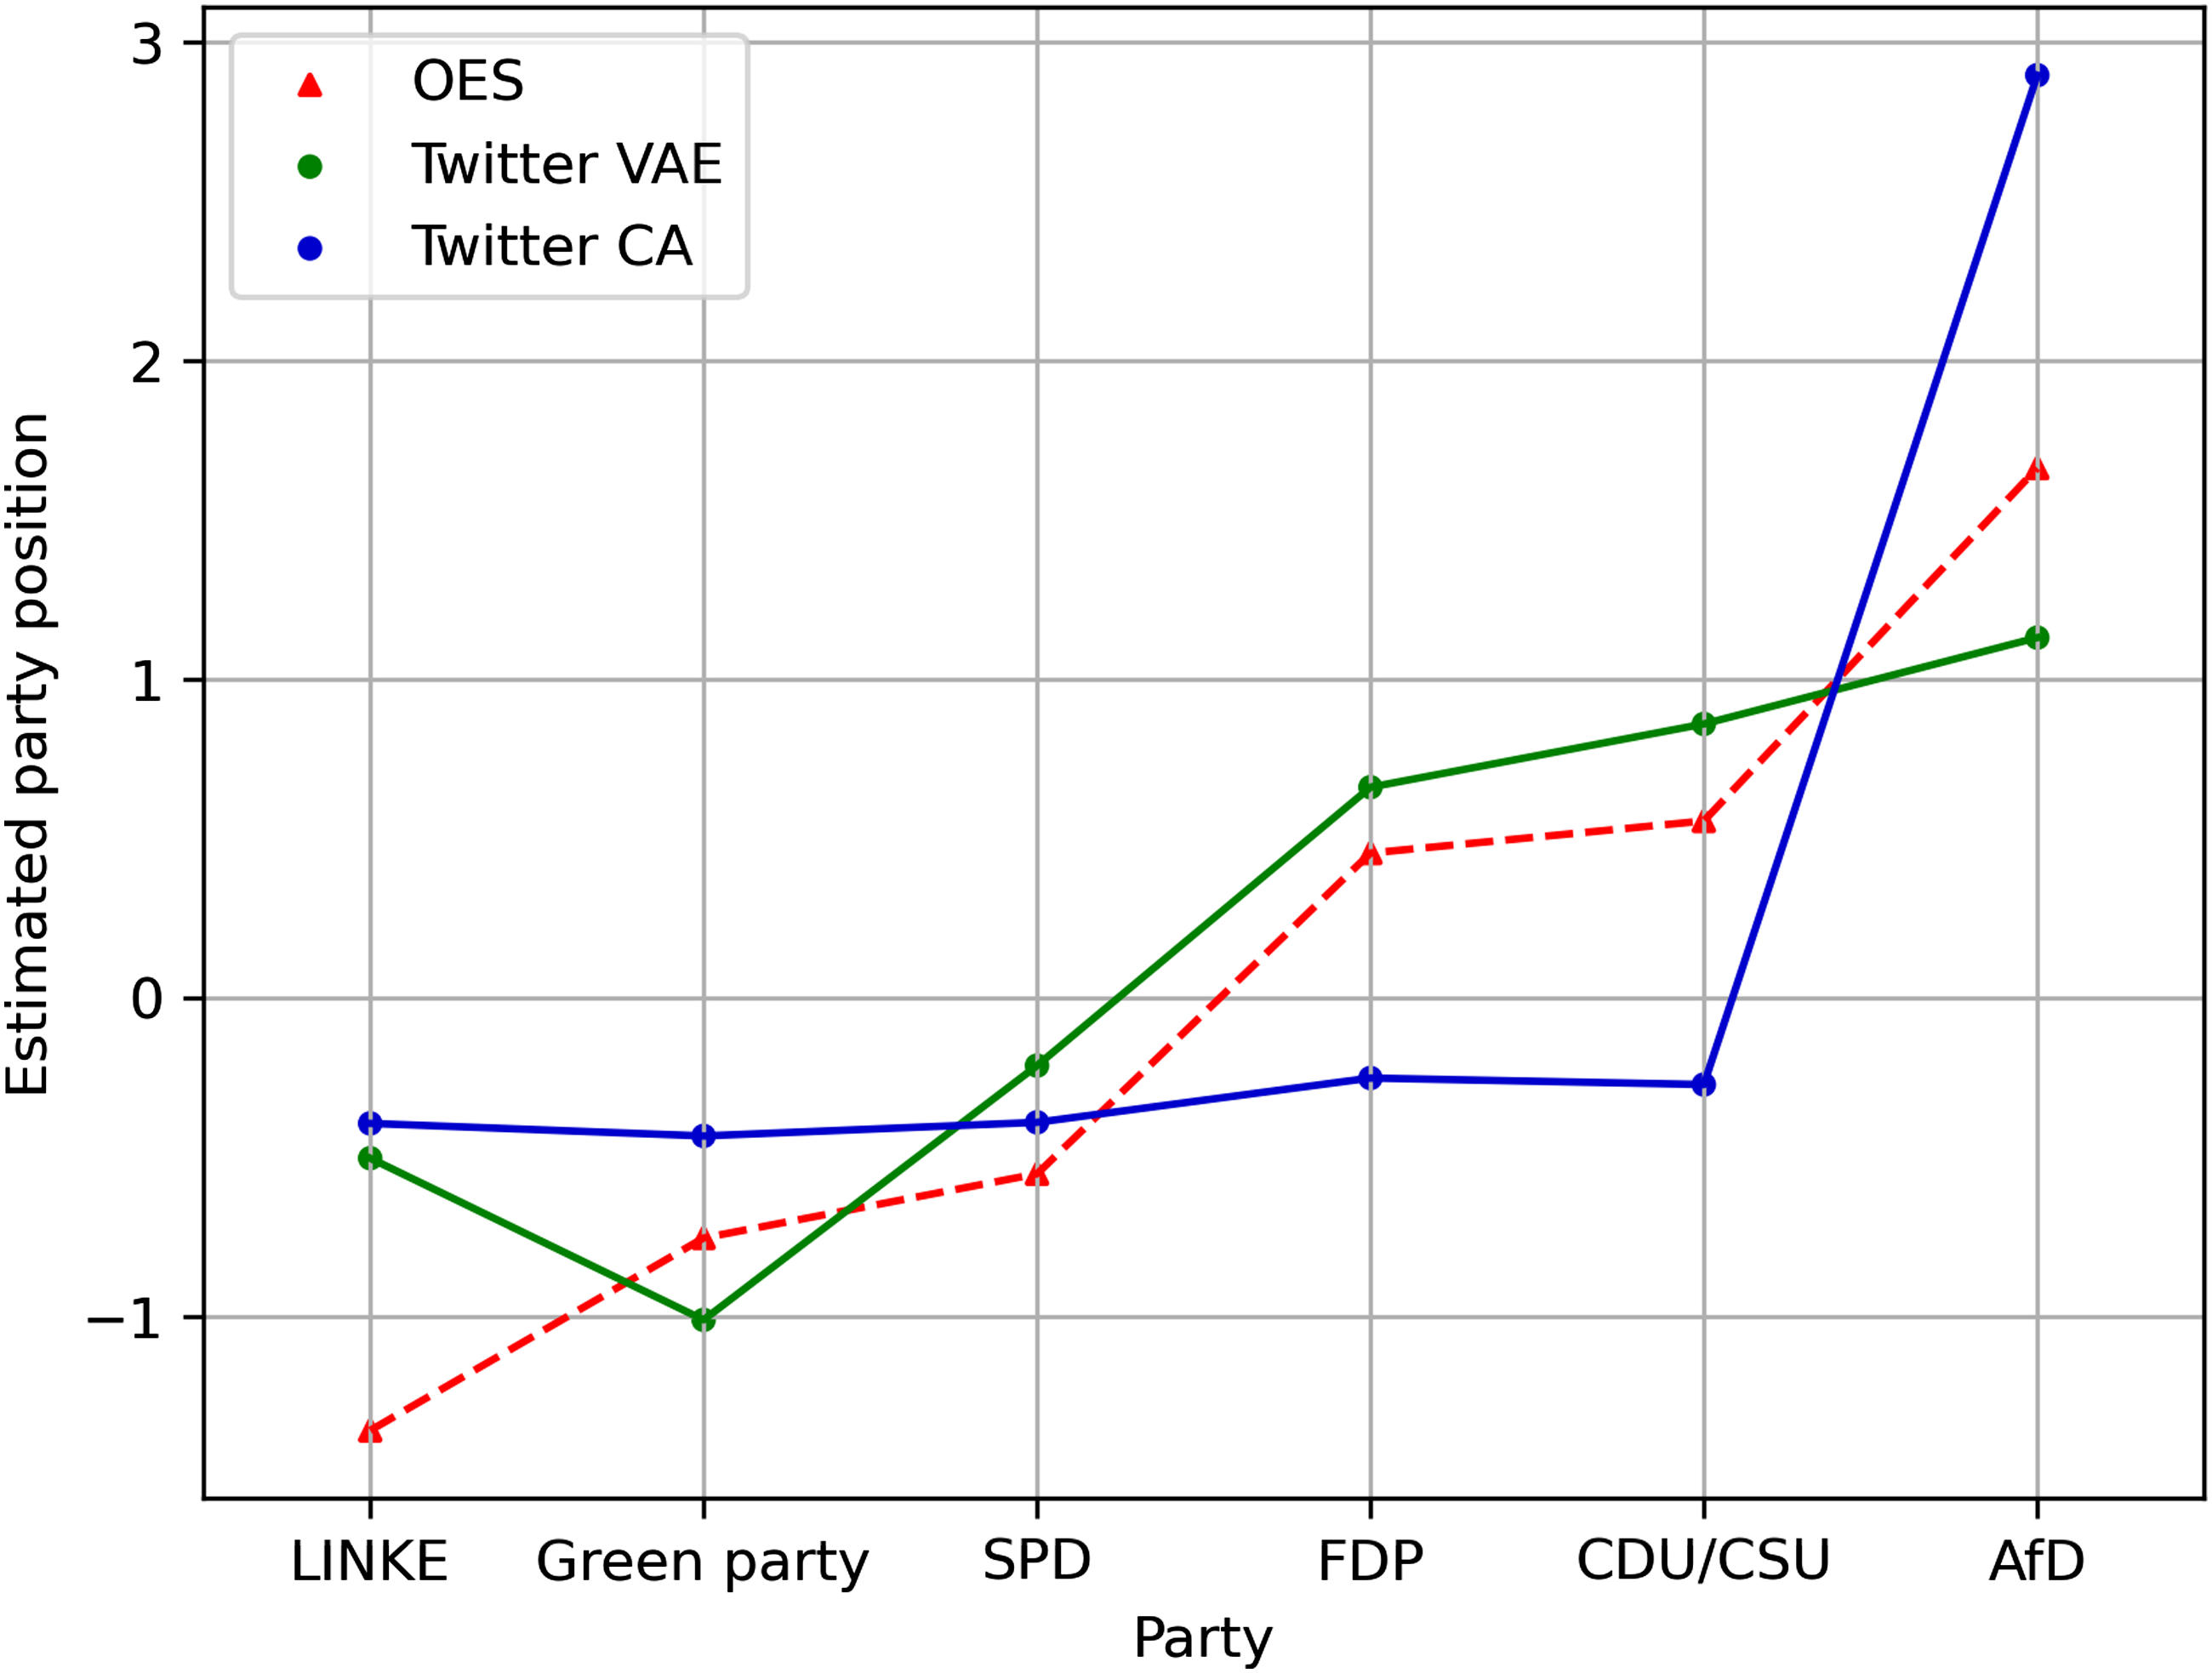
Opinion Estimate Validation Using Self-Report Data
In the last step, we validated opinion estimates from the VAE and CA with our self-report dataset. First, we looked at the distributions of self-reported ideology and voting intentions of our sample. On average, our sample’s self-reported ideology levels were left-leaning, and not a single individual reported strong right-leaning ideologies (M ideology = 3.29, SD ideology = 1.33, MinMax ideology = [1, 8]). The same was true for voting intentions. The majority of individuals reported intending to vote for left-leaning parties (Green party: 54, Linke: 15, SPD: 19) and only twelve individuals in total for the (more) right-leaning parties (FDP: 7, CDU/CSU: 4, AfD: 1). The remaining reported to vote for other, non-major parties (Other: 18) or to not vote at all (no vote: 1). These self-report results align only partly with the overall following rates of political accounts in our work since users in the self-report dataset followed even more politicians from left-leaning parties percentage-wise than users in the training and test set (Table 1).
Looking at the distribution of opinion point estimates of both the VAE and CA, their mean and standard deviation seemed to align with this overall left-leaning trend of the self-report data, with the VAE exhibiting a lower mean and higher standard deviation compared to the CA (M
CA
= −0.24, SDCA = 0.33, MVAE = −0.72, SDVAE = 0.76). Looking at the relationship between opinion point estimates of users with their self-reported symbolic political ideology (left-right), we found a medium correlation in both models (VAE: r = .46, p < .001, CA: r = .46, p < .001). Although exhibiting similar positive correlation coefficients, the opinion point estimate distributions and absolute values seemed to differ between models (see Figure 4). In the CA, most point estimates were closely grouped except for a significant outlier on the highest self-reported ideology scale point. In comparison, the general pattern of point estimates and self-reported ideology in the VAE seemed more nuanced, showing a bigger variance in point estimates within and between self-reported ideology scores. Correlation plot of opinion point estimates and self-reported ideology. Note: Opinion point estimates for all participants in the self-report dataset are represented by individual dots jittered on the x-axis with a bold red regression line. Error bars around the regression line indicate 95% confidence interval.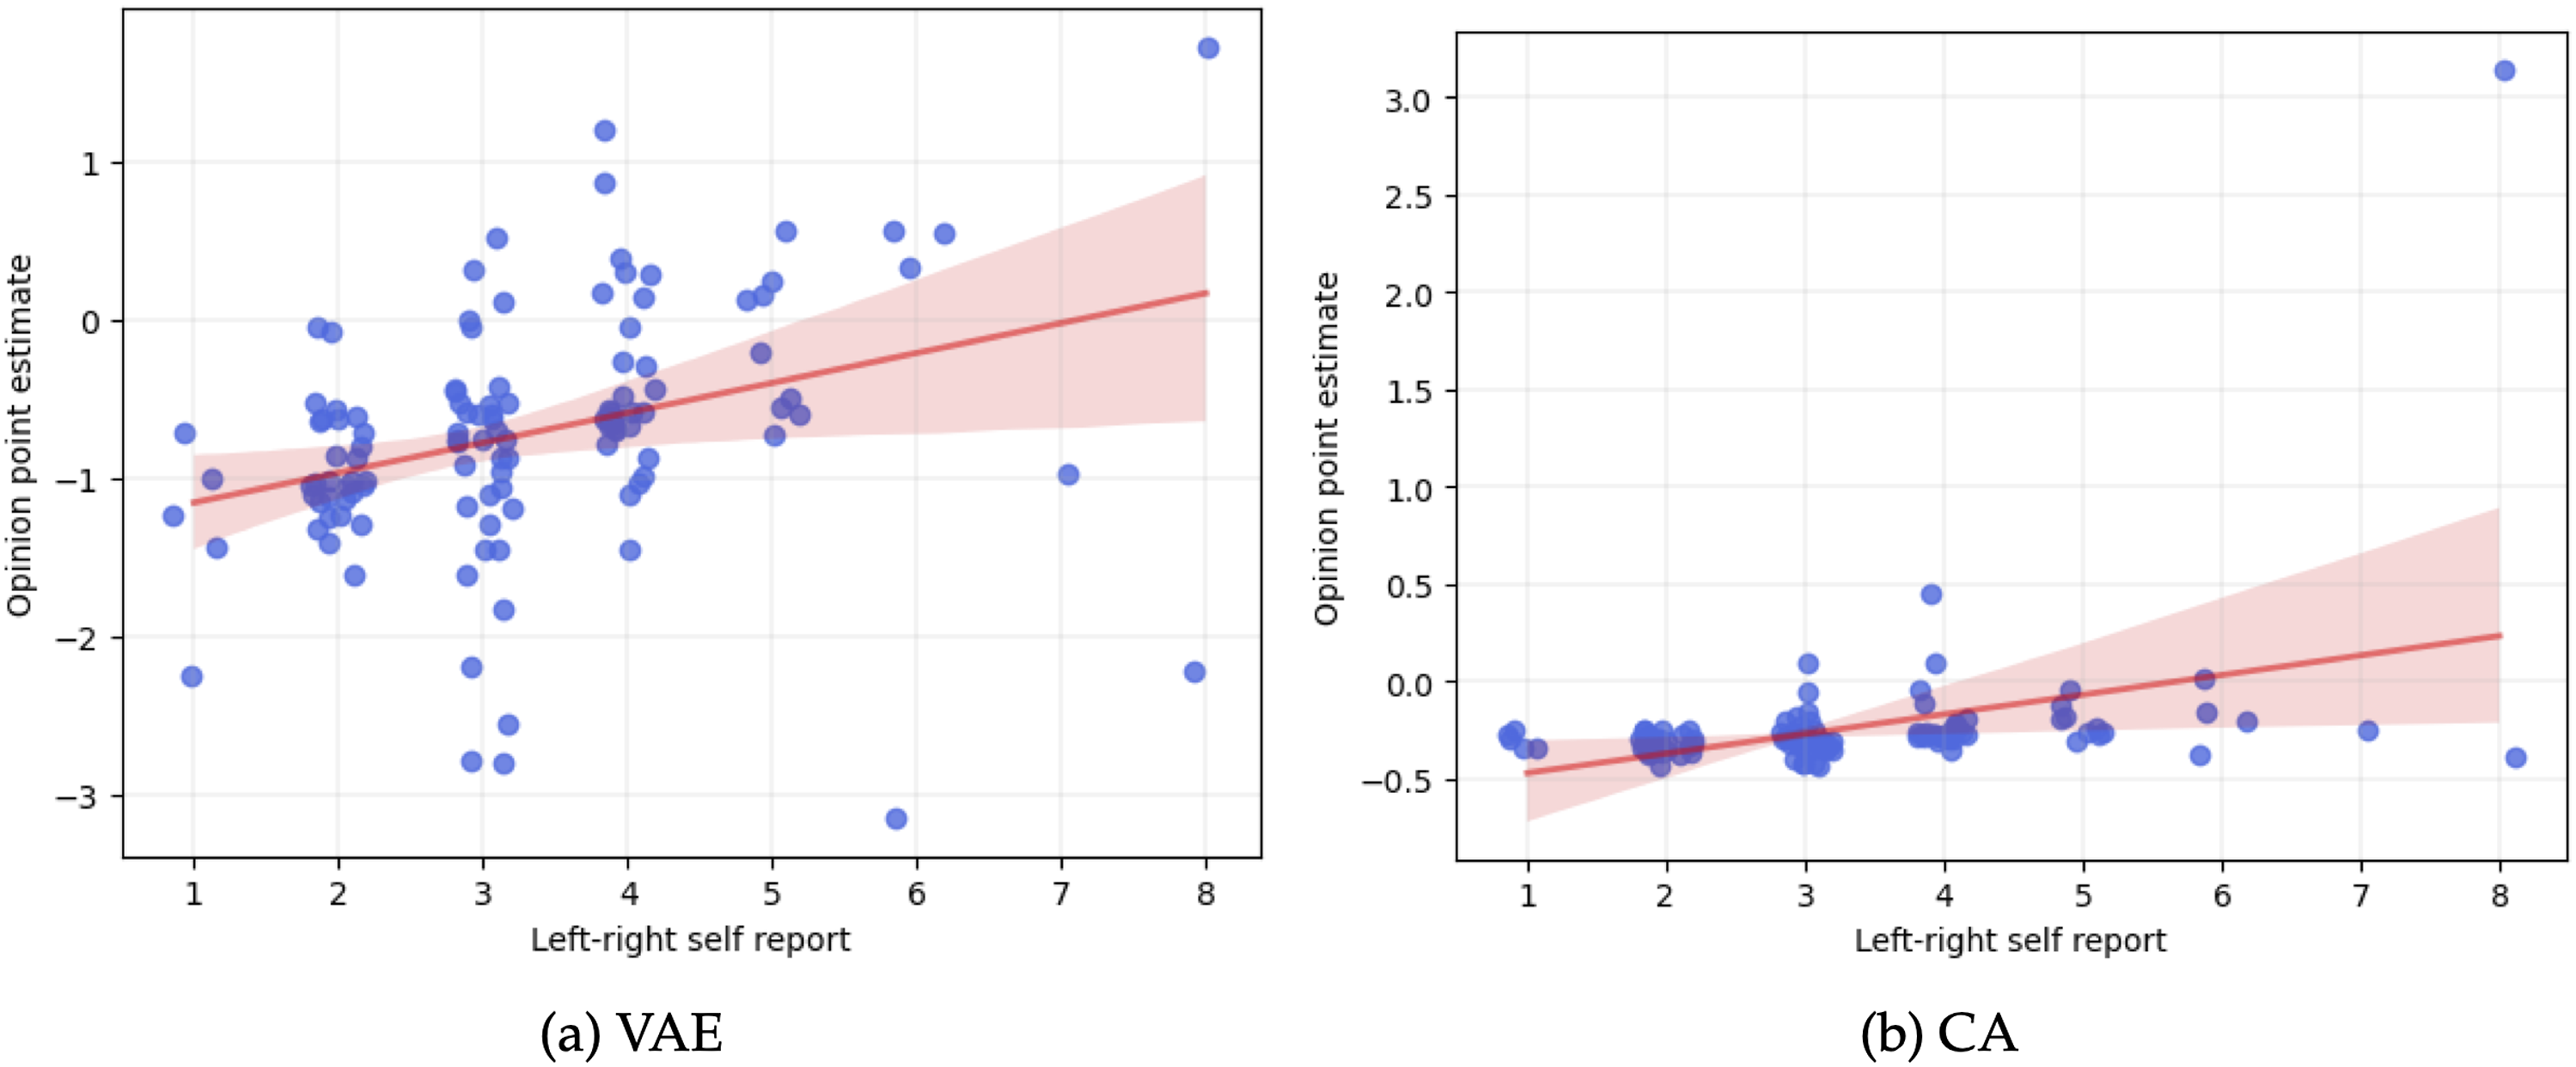
Next, we analyzed the capacity of our models’ point estimates to predict party voting intentions. Figure 5 shows the distribution of point estimates by self-reported voting intentions for each party and model. As expected, the ordering of opinion estimates in the VAE was mostly in line with the expected ordering per party. That is, individuals intending to vote for more left-leaning parties had lower, negative median opinion estimates (Md
Linke
= −1.04, Md
90/Greens
= −0.87, Md
SPD
= −0.62), whereas those intending to vote for more right-leaning parties had higher, (mostly) positive opinion estimates (Md
CDU/CSU
= −0.1, Md
FDP
= .33, Md
AfD
= 1.73). Notably, individuals intending to vote for CDU/CSU exhibited an overall lower median point estimate than expected (i.e., lower median estimates than the ones intending to vote for FDP). However, the point estimate variance for the CDU/CSU was relatively large compared to the other parties and only four individuals reported voting intentions for this party. Compared to the VAE, the CA median opinion estimates were less in line with the expected party ordering. Similar to the overall party positioning (Figure 3), the variance between median point estimates for the different parties was much smaller compared to the VAE with only the most right-leaning party (AfD) exhibiting a high difference (and high absolute value) in median point estimates. Median estimates for parties LINKE and Greens were identical (Md = −0.3) with the median estimate for SPD (Md = −0.29) being the lowest of all parties (although only marginally). Additionally, estimates for more right-leaning parties FDP and CDU/CSU were only slightly higher than for the previously mentioned left-leaning parties and also almost identical to one another (Md
FDP
= −0.19, Md
CDU/CSU
= −0.2). Put simply, the CA only showed small differences in estimated opinion estimates between individuals voting for different parties. This may, in turn, have led to a higher divergence of expected opinion estimate ordering based on the voting intention compared to the VAE. In sum, the relationship between the point estimates and voting intention in the VAE seemed more nuanced and in line with the expected distribution compared to the CA. This result was further supported by the multinomial logistic regression model, in which the VAE showed a superior model fit compared to the CA in predicting voting intentions through opinion point estimates (see supplemental materials, subsection II.IV). Self-reported voting intention and estimated ideological position. Note: Individual boxplots calculated for all participants intending to vote for respective party with an interquartile range of IQR = 3. Black dots indicating single observations. Points outside of Whiskers indicate outliers. Boxplots for AfD only showing single point estimate (N = 1). Median point estimates per intended voting behavior shown underneath individual boxplots. CA graph (b) includes y-axis break to facilitate plotting.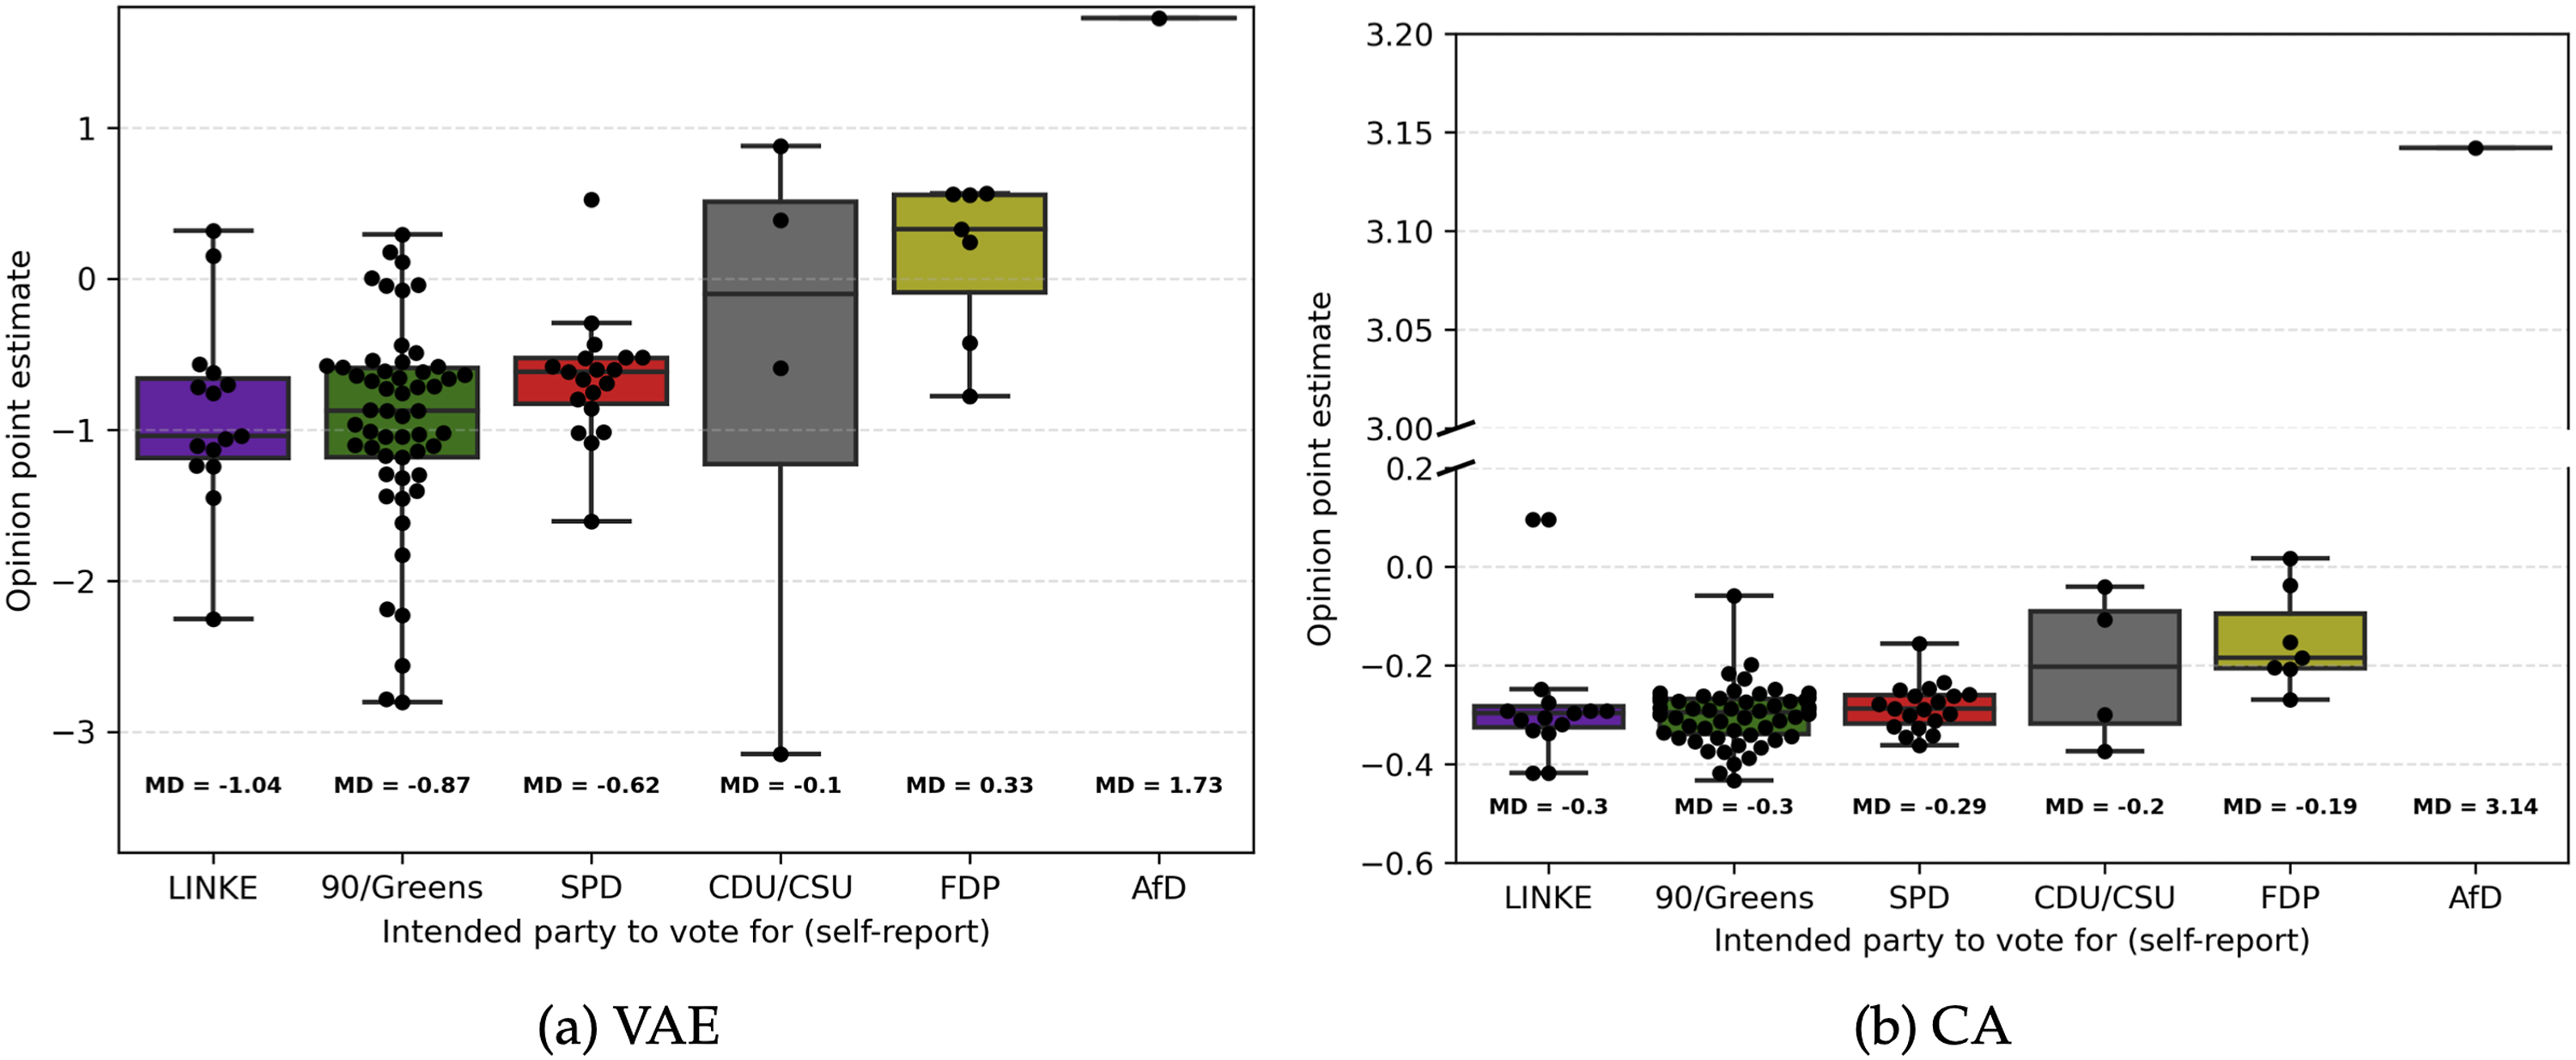
Lastly, we also checked the CA and VAE following matrix reconstruction performance on the self-report dataset. Similar to the train and test set, the VAE consistently outperformed the CA and NCF across calculated metrics (see supplemental materials, section subsection II.I). This again indicates that the learned latent representations in the VAE more closely captured the network relationships compared to the CA.
Discussion
In the present study, we explored whether social network data can be used to infer individuals’ political opinions in countries other than the US. In doing so, we utilized dimensionality reduction (DR) models to analyze the network of German Twitter users to obtain individual-level political opinion estimates.
Our results not only corroborate findings from previous studies showing that estimating individual political opinions from social media data (SMD) using individuals’ following decisions is feasible (e.g., Barberá, 2015a; Barberá et al., 2015; Bond & Messing, 2015) but that this estimation also works in a multiparty political system like Germany; and thus potentially in other countries outside of the US as well. This result is noteworthy since many countries other than the US have a multiparty system and—in the special case of Germany—ordering political parties on a general left-right continuum is a complex issue with no universally agreed-upon solution. Depending on the used dimension (social, economic, etc.) and applied method, researchers have come to different party orderings in the past (Jankowski et al., 2022; Lehmann et al., 2023). This ordering issue in combination with a higher number and unequal distribution of voting intention classes in our study (six parties following different political agendas in the German context) thus presents a more challenging prediction endeavor than in a bipartisan context like the US.
Despite these challenges, our study shows that opinion estimates of users following accounts from German politicians broadly align with the respective overall party stance judged by experts. Further, the results suggest that the more accounts portraying a specific political stance social media users follow, the more likely they are to hold similar opinions. Particularly, the more accounts from “extreme” parties, like the right-leaning AfD, individuals follow, the more extreme their opinion point estimates become, reflecting a left-right dimension. In line with previous studies on social media and offline social networks, this supports the assumption of homophily (e.g., Aiello et al., 2012; McPherson et al., 2001).
Moreover, we find that using complex ML models can benefit the estimation accuracy of individuals’ public opinions from SMD. First, the unsupervised VAE ML model captured the intricacies of the following structure more precisely compared to an uninformed baseline model and a linear DR algorithm (CA). Possibilities to compare our models’ matrix reconstruction performance to the literature are somewhat limited since—to our knowledge—only one related, previous study (conducted in the US) reported the (unbalanced) reconstruction performance (e.g., Barberá et al., 2015). Compared to this study, however, our VAE exhibited higher absolute reconstruction performance and greater improvements over an uninformed baseline. The nuanced network representation in the VAE is further corroborated by a closer match of the ideological party estimates with expert ratings compared to the CA. The individual-level opinion estimates in the VAE also showed stronger relationships with self-reported opinions compared to the linear CA. Not only did the user opinion estimates show strong correlations with self-reported symbolic ideology but also a more accurate relationship with individuals voting intentions. All these results empirically support the assumption that complex, non-linear relationships in the following structure of social media networks exist and need to be considered in the modeling phase to estimate individual-level opinions more accurately. Being able to extract individual-level political opinions solely from SMD following decisions yields several practical implications. Using SMD seems to provide a promising alternative to cost and labor-intensive surveys. The extracted opinion estimates may further be used by researchers and policymakers alike to predict political outcomes like elections, opinion networks and political polarization in social media networks.
Nevertheless, our study comes with a few limitations. We found slight differences in the estimated political stance of German parties in our models and their expected positions rated by experts. One of the reasons might be structural biases in our data, even though we adhered to previous best practices of data cleaning as far as possible. We might not have excluded all inactive and/or bot accounts due to restrictions in users’ geo-location, and other meta information. However, despite the potentially resulting noise in our datasets, the VAE still captured meaningful relationships as shown by our results. Judging from the following distribution of political accounts compared to the overall vote shares in the 2021 German federal election and the fact that most social media users do not seem to follow political elites, our data may not be representative of the general population, a common problem of studies using SMD (Mellon & Prosser, 2017; Wojcieszak et al., 2022). The representativeness of our sample for the Twitter user space might further be limited since we only analyzed data of users who followed at least ten political accounts (similar to previous approaches). Importantly however, users who do follow political elites, seem to be more aligned with the opinions of the followed accounts which conversely aids our study’s assumption of homophilic networks (Wojcieszak et al., 2022). On a similar note, our self-report dataset is comparatively small and the following frequencies of political accounts deviated from the bigger training and test datasets. As shown by our results, the overall distribution of voting intentions and self-reported ideology are rather left-leaning and limited in their variance; only a few participants reported voting for right-leaning parties. This may have led to slightly biased correlations of self-reported opinions with point estimates and may thus also explain similar correlations comparing the VAE and CA. Nevertheless, a small to medium correlation of opinion estimates with symbolic ideology and a fit with voting intention patterns indicate that the VAE captured important patterns in the self-report dataset users’ networks. Finally, researchers planning to adapt our method should be aware that VAEs require more careful planning, fine-tuning (i.e., hyperparameter and architecture selection) and computation time in contrast to simple linear DR models. Also, the interpretation of latent dimensions may require additional effort as noted in the Methods section. However, when trained and applied properly, they can capture the intricacies of the network in more detail, as shown by our results.
Based on our findings and study limitations, we pose several recommendations for future studies: While a ML DR model yielded promising results in the context of German SMD network-based analysis, future research should apply these models to other countries, political systems and politically uninterested users to test generalizability. Future studies may also test other existing, more traditional network analysis models and approaches which, for instance, focus on node-link prediction (instead of DR like our model, e.g., GNNs) to estimate individual-level political opinions. On a similar note, since our dataset exhibits a directed bipartite network structure (users →political accounts), future studies may explore the potential of other types of network data structures and representations (e.g., undirected user-user/user-political accounts networks, attributed graphs) to estimate political opinions from SMD. Doing so could, for instance, facilitate the application of resampling techniques and the application of other network analysis and benchmark models. Considering our rather small self-report dataset, future research may validate point estimates with self-report measures using larger samples. While we found substantial correlations between opinion estimates and self-reported symbolic ideology, future studies may investigate whether manifestations of dimensions of more complex models of political views (see for example Fatke, 2017; Feldman & Johnston, 2014; Gerber et al., 2010; Jost et al., 2009; Treier & Hillygus, 2009) can be predicted by these data as well. In this case, fitting models with more latent dimensions may be advisable to capture the manifoldness of users’ political opinions in European countries even more accurately (Barberá, 2015a). On that note, future studies could explore whether our results can be generalized to measures of operational ideology assessing individuals’ attitudes on specific topics and policy issues. Moreover, although our VAE ML model surpasses the network reconstruction performance of previous studies, linear (CA) and uninformed models (Naive), it is debatable what constitutes “good” dimensionality reduction performance. Therefore, future research could explore potential thresholds and benchmarks. Shortly after our data collection (July 2022), Twitter’s leadership changed and user counts decreased substantially (Alex Hern, 2024). Although we do not expect this circumstance to affect (homophilic) behavior, future research may still investigate periodic effects of such events on social media networks and replicate our findings. Interrelated with this, Twitter has become less attractive to researchers and political actors as a data source since it does not share data with independent researchers (like most social media platforms) and sets comparatively high pricing for acquiring big datasets (Calma, 2023). This hinders and may even prevent further in-depth examinations in this research area (Bruns, 2019). We hope that with the Digital Services Act, researchers will (re)gain access to conduct research on online platforms in the future (European Commission, 2024).
Using social media data to assess the political opinions of individuals offers valuable benefits over traditional opinion surveys for researchers and policymakers alike. However, finding reliable and accurate methods to extract information from unstructured SMD in different sociopolitical contexts remains one of the main challenges. Our study adds new insights to this endeavor, showing that using ML models capable of capturing intricate user network characteristics in a multiparty system is crucial to estimating individual-level political opinions more accurately. Opinion estimates from SMD may then be used to monitor political trends, capture ideological shifts in societies, or predict political behavior like voting patterns or policy support, ultimately benefiting the democratic process in modern societies.
Supplemental Material
Supplemental Material - To Follow or Not to Follow: Estimating Political Opinion From Twitter Data Using a Network-Based Machine Learning Approach
Supplemental Material for To Follow or Not to Follow: Estimating Political Opinion From Twitter Data Using a Network-Based Machine Learning Approach in Nils Brandenstein, Christian Montag, and Cornelia Sindermann in Social Science Computer Review
Data Availability Statement
The data underlying this research project constitute “special categories of personal data” (“personal data revealing racial or ethnic origin, political opinions, religious or philosophical beliefs, [. . . ]” GDPR, Chapter 2, Art. 9). Data processing was based on the fact that “processing relates to personal data which are manifestly made public by the data subject” (GDPR, Chapter 2, Art. 9, §2e; training set, test set) or “the data subject has given explicit consent to the processing of those personal data [...]” (GDPR, Chapter 2, Art. 9, §2a; set). Participants of the survey to recruit the self-report dataset additionally provided consent that their data might be shared if re-identification is impossible. Given the exponential growth in available data analysis strategies (algorithms, etc.), we did not find an appropriate data masking or data aggregation strategy to prevent re-identification of participants and still provide the whole dataset for replicability of the findings to the public. Thus, if researchers are interested in replicating the results reported in the present work, we ask them to contact us (cornelia.sindermann@iris.uni-stuttgart.de) and we will provide access to part of the data, aggregated data, or the like. Note that every request will need to undergo thorough examination first to ensure compliance with the GDPR and that participants cannot be re-identified in the dataset access is provided to. All questionnaires used in the survey to recruit the self-report dataset will be made publicly available at the OSF upon acceptance of the manuscript. The analysis code used to produce the results is openly accessible on the OSF: https://osf.io/2ft8d/?view_only=e56f7e9b7fdc4b4f8188084584141793.
Footnotes
Acknowledgments
We acknowledge the support of the Ministerium für Wissenschaft, Forschung und Kunst Baden-Württemberg (MWK, Ministry of Science, Research and the Arts Baden-Württemberg under Az. 33-7533-9-19/54/5) in “Künstliche Intelligenz & Gesellschaft: Reflecting Intelligent Systems for Diversity, Demography and Democracy (IRIS3D)” and the support by the “Interchange Forum for Reflecting on Intelligent Systems” (IRIS) at the University of Stuttgart. Further, we acknowledge the support by the Stuttgart Center for Simulation Science (SimTech).
Author Contributions
Declaration of conflicting interests
The author(s) declared the following potential conflicts of interest with respect to the research, authorship, and/or publication of this article: For reasons of transparency Dr. Montag mentions that he has received (to Ulm University and earlier University of Bonn) grants from agencies such as the German Research Foundation (DFG). Dr. Montag has performed grant reviews for several agencies; has edited journal sections and articles; has given academic lectures in clinical or scientific venues or companies; and has generated books or book chapters for publishers of mental health texts. For some of these activities he received royalties, but never from gaming or social media companies. Dr. Montag mentions that he was part of a discussion circle (Digitalität und Verantwortung: ![]() ) debating ethical questions linked to social media, digitalization and society/democracy at Facebook. In this context, he received no salary for his activities. Also, he mentions that he currently functions as independent scientist on the scientific advisory board of the Nymphenburg group (Munich, Germany). This activity is financially compensated. Moreover, he is on the scientific advisory board of Applied Cognition (Redwood City, CA, USA), an activity which is also compensated.
) debating ethical questions linked to social media, digitalization and society/democracy at Facebook. In this context, he received no salary for his activities. Also, he mentions that he currently functions as independent scientist on the scientific advisory board of the Nymphenburg group (Munich, Germany). This activity is financially compensated. Moreover, he is on the scientific advisory board of Applied Cognition (Redwood City, CA, USA), an activity which is also compensated.
Funding
The authors received no financial support for the research, authorship, and/or publication of this article.
Supplemental Material
Supplemental material for this article is available online.
Author Biographies
References
Supplementary Material
Please find the following supplemental material available below.
For Open Access articles published under a Creative Commons License, all supplemental material carries the same license as the article it is associated with.
For non-Open Access articles published, all supplemental material carries a non-exclusive license, and permission requests for re-use of supplemental material or any part of supplemental material shall be sent directly to the copyright owner as specified in the copyright notice associated with the article.