
Abstract
In this article, we analyze whether Twitter can be used to detect relative reports of issues at polling places. We use 20,322 tweets geolocated to U.S. states that match a series of keywords on the 2010, 2012, 2014, 2016, and 2018 general election days. We fine-tune BERTweet, a pre-trained language model, using a training set of 6,365 tweets labeled as issues or non-issues. We develop a model with an accuracy of 96.9% and a recall of 72.2%, and another model with an accuracy of 90.5% and a recall of 93.5%, far exceeding the performance of baseline models. Based on these results, we argue that these BERTweet-based models are promising methods for detecting reports of polling place issues on U.S. election days. We suggest that outputs from these models can be used to supplement existing voter protection efforts and to research the impact of policies, demographics, and other variables on voting access.
Keywords
Introduction
In the run-up to the 2018 gubernatorial election in the U.S. state of Georgia, reports of a wrongful purge of 340,134 voters from Georgia’s voter registration rolls emerged on major media platforms (Durkin, 2018). By the day of the election, the governor’s race in Georgia and allegations of voter suppression became a national news story (Anderson, 2018). However, on the election day itself, the best resource for learning about what was happening in Georgia was not national media, election watchers, or the state’s own website. Instead, it was Twitter, 1 where pictures of long lines at polling sites across Georgia had begun to go viral, with thousands of retweets, likes, and comments (Sarmiento, 2018). Activists, journalists, and politicians, but mostly regular voters, found in Twitter a platform not just to report issues at their polling places but also to spark a national conversation about voter suppression, voter turnout, and voting rights.
In 2013, the U.S. Supreme Court ruled that Section 4(b) of the Voting Rights Act of 1965 was unconstitutional (Roberts & Supreme Court, 2012). This ruling invalidated Section 5 of the Voting Rights Act, which required specific areas of the U.S. with a history of voter suppression to receive “preclearance” from the federal government before modifying any of their voting or election laws. Since then, the federal Commission on Civil Rights has found that discriminatory and restrictive voting laws have surged across the U.S. (Bradner, 2018). Despite this research, and its implications for American democracy, the U.S. has no central system for reporting issues at polling places. State hotlines are rarely used or advertised, and there is very little public data counting the number of issues that occur at polling places (Mebane et al., 2017). Thus, in the absence of a better system, Twitter offers a medium for reporting, detecting, and sharing issues. We already saw that the 2018 Georgia election demonstrated that many people share issues that occur at polling places on social media. The more general question is whether Twitter can be used to detect issue reports at polling places on U.S. election days reliably and systematically. In this article we argue in favor of a qualified, positive answer.
The article is structured as follows. In Defining Polling Place Issues, we define “polling place issues” to include issues such as electioneering, long lines, and broken voting machines. In Complaints on Social Media, we contextualize the theoretical foundations of our research by first discussing research on social media complaints in general. In Past Work on Polling Place Issues, we then discuss research studying issues at polling places, which is mostly focused on line-related issues. Next, in Big Data Approaches, we review larger-scale studies, including work from Mebane et al. (2017), which uses data from Twitter to detect a much more broadly defined version of “voting incidents.” We argue that past work is insufficient to support our research and, in Large Language Models, we propose a new method for detecting polling place issue reports using Twitter data and large language models, specifically the use of BERTweet (Nguyen et al., 2020). It is worth noting here that the primary goal of this article is to develop a method for detecting issue reports posted on Twitter, and not to verify the veracity of those reports. To build a model for this task, in the Data section, we describe our process for using keyword searches to download 20,322 unique, geolocated tweets, from the days of the 2010, 2012, 2014, 2016, and 2018 U.S. General elections. We also discuss our process for cleaning and labeling 10,241 of these tweets as describing “issues” or “non-issues.” Next, in the Methods section, we discuss the metrics of interest for this study, including accuracy (i.e., the percentage of tweets the model correctly classifies), precision (i.e., the percentage of model-predicted issue reports that are human-labeled issue reports), and recall (i.e., the percentage of human-labeled issue reports the model predicts as issue reports). 2 We argue that recall is the most critical metric for evaluating model performance, as finding issues is more important than finding non-issues. We also describe building the primary model for this article, a fine-tuned version of BERTweet. In the Results section, we highlight that our fine-tuned BERTweet model outperforms baseline models, with one version having an accuracy of 96.9% and recall of 72.2%, and another version having accuracy of 90.5% and recall of 93.5%. Finally, in the Discussion section, we summarize the performance of the BERTweet model and argue that, even without further modification, its results are suitable for use. We also discuss the limitations of this research, namely that the model may not generalize to the more complicated 2020 election and that it only contains geolocated tweets. We outline a few paths for future work, including further optimization of the model, using it to study the impact of restrictive voting laws, and applying it to voter protection efforts.
Background
Defining Polling Place Issues
Defining polling place issues is not strictly a legal question. Legally accepted issues occur at polling places, such as long lines, that still constitute barriers to voting worth cataloging. For example, while there is no universal legal standard for line times, a report from the (United States Presidential Commission on Election Administration (2014) recommends that “voters should not need to wait more than half an hour to vote” (19). Other examples of polling place issues for this article that are not necessarily illegal include polling places facing technical difficulties, late changes to polling place locations, and voters not appearing on registration rolls (USPCEA, 2014).
Other polling place issues occur because of illegal behavior. For example, U.S. federal law forbids voter intimidation, examples of which include aggressive questioning about citizenship or other qualifications to vote, falsely presenting as an election official, spreading false information about voting requirements and laws, harassment, and displaying intimidating or false signs about voter fraud (American Civil Liberties Union, 2021). Many states also have rules against “electioneering,” defined as political activities near or within a polling place. However, these restrictions and the definition of “near” vary significantly from state to state, with some states prohibiting voters from wearing political apparel while others only prohibit political literature (National Conference of State Legislatures, 2021).
In this article, we consider polling place issues as lines longer than 30 minutes, technical difficulties with machines, closed polling sites, voters wrongfully barred from voting, electioneering, voter intimidation, harassment, and any illegal behavior. These issues can involve official state policies, poll workers, voters, observers, campaigns, or other people at the polling place. While this is not a comprehensive list of issues that occur at polling places, it broadly covers the types of issues of interest and provides a reliable basis for polling place issue detection.
Complaints on Social Media
Before discussing past work about polling place issues, it is worth briefly discussing the theoretical foundations for this work. This article asks, can Twitter be used to detect issue reports at polling places on U.S. election days? Although there is limited work about polling place issue reports on social media, we look to another body of past work for theory, analyses of complaints posted to social media. This work helps us develop a theoretical foundation for this article’s research question in three ways. First, we can examine whether users are likely to complain about public services on social media; second, we can understand why users complain on social media, and examine if those reasons are likely to exist for polling place issues; and third, we can examine if it is possible to detect and classify those complaints.
Past work examining differences between tweets directed to New York City (NYC) agencies, tweets geolocated to NYC that complain about agency-relevant issues, and phones calls directed at 311 found that during their sample in 2013, there were differences in the number of complaints tweeted to agencies and called to 311. However, the relative volumes of geolocated tweets and 311 calls are similar (Frías-Martínez et al., 2014). They also find that complaints geolocated to NYC but not directed to the agencies are common, and are often directed to friends or followers, suggesting that some complaints skip official channels all-together. Additionally, although Heverin and Zach (2010) do not focus specifically on complaints, the researchers find that Twitter users do regularly share information with and ask questions of police departments in major U.S. cities. In Australia, there is evidence that the plurality of tweets directed at government agencies are complaints about services or policies (Alam & Lucas, 2011). Together, this body of research suggests that Twitter users may post about other public service complaints, polling place issues, when they occur to them.
Other work has examined why users decide to complain on social media. Although this work focuses on complaints about private companies, there are relevant insights about the types of complaints users share, as well as what motivates them to share. For example, there is evidence that people regularly complain about companies on social media, and the majority of those tweets are about products and services, rather than company policies or issues with specific employees (Einwiller & Steilen, 2015). We argue that the process of voting at a polling site can be thought of as a service to voters, potentially motivating them to report polling place issues. Research examining complaints on a popular social networking site in Taiwan finds that personal outcome expectations (e.g., this complaint will help resolve the problem) are a significant motivator for online complaints (Yen, 2016). This also maps on for voters, who may be facing issues at polling places that they hope to have resolved.
In a comprehensive analysis of corporate complaints posted to Twitter in Indonesia, Kusumawati et al. (2024) find various significant predictors of complaining behavior. Namely, users complain on Twitter to vent negative emotions, which may also be the case for some kinds of polling place issue reports. They also find that empowerment plays a role in the decision to complain; users who feel like they cannot solve the problem themselves (e.g., in this article’s case, a long line) and users who feel like their complaint will be seen by others are more likely to complain. Finally, users complain on Twitter because it is an easily accessible platform and because they want to share information with others who may be impacted (Kusumawati & Suhandi, 2024). We argue that these motivators are also likely to be present for voters experiencing polling place issues, suggesting that users are likely to tweet about polling place issues, especially in the absence of other easily accessible forms of complaining.
Researchers have also developed models for detecting and classifying complaints posted to Twitter. As the primary goal of this article is to test whether detecting polling place issue reports on Twitter is possible, this work helps us develop a baseline of feasibility. In many cases, the classification models developed by researchers use modeling techniques similar to the baseline models used in this article. Frias-Martinez et al. (2012) develop a classifier that has an accuracy of 87% for the task of detecting issue report tweets about NYC public services. In other countries, researchers have developed models that can reliably detect complaints relevant to public agencies such as water supply and train issues (Akhtar & Beg, 2021; Fatkhurrochman et al., 2018). In the field of traffic incident detection, researchers have also developed models capable of classifying tweets as reporting issues about traffic and roadways (Fu et al., 2015; Gu et al., 2016; Kumar et al., 2014).
Taken together, past research on complaints posted on social media suggests that users are likely to tweet complaints about public services, which in some cases are different from the complaints shared through traditional channels. Users are often motivated to post complaints by a desire to solve the problem for themselves and for others, and because social media is more accessible than traditional channels. Additionally, there is evidence that it is possible to classify these complaints using methods similar to the baseline models presented in this article. For the purposes of this article, then, there is reason to believe that Twitter is likely to be a platform for polling place issue reports, which share many of the same motivations as other complaints posted to social media, and, as we demonstrate in this article, it is possible to develop a model that reliably and systematically detects those reports.
Past Work on Polling Place Issues
Within the limited research on U.S. polling place issues, most work focuses on analyzing lines and wait times. An examination of this past work is useful for both understanding the constraints of existing methods as well as grounding the importance of further research on polling place issue reports.
Historically, research on lines has generally focused on using post-election surveys or in person observers, to examine where, why, and to whom line-related issues occur. In some cases, researchers have also used simulations to examine the impacts of machine choice and resource allocation on line times; this work is primarily useful to help us understand the causes of long lines—often a lack of voting machines and election workers—but not directly relevant to this article’s proposed method for detecting issue reports during or after elections (Edelstein, 2006; Herron & Smith, 2016; Highton, 2006; Yang et al., 2013).
In terms of surveys, some work has used data from the Congressional Election Study (CES) 3 or the Survey of the Performance of American Elections (SPAE), national surveys administered after general elections, which asks voters similar questions about their experience at polling places (Coll, 2022; Kimball, 2013; Pettigrew, 2017; Stewart, 2013; Stewart & Ansolabehere, 2015). However, it is worth noting that the CES only offers five options for voters when asked how long they waited to vote: “not at all,” “less than 10 minutes,” “10–30 minutes,” “31 minutes to an hour,” and “more than an hour” (Ansolabehere & Schaffner, 2018). This lack of granularity and the fact that the survey relies on self-reports after the election may present reliability issues. Specifically, because at least 20% of respondents to the CES claim to have voted when they actually have not, with SPAE responses also having similar issues, respondents may be misleading about their wait times (Chen et al., 2020; Stewart, 2023).
Researchers have also used in person observation to examine lines. This method solves the reliability problem of self-report surveys but introduces a new problem of generalizability, as the polling sites selected are not representative of the country (Herron & Smith, 2016; Spencer & Markovits, 2010). However, some of these studies have captured data in dozens of counties across multiple states, offering us valuable insights into the causes and impacts of long lines (Lamb, 2021; Stein et al., 2020).
Although this past work on polling place lines does not offer us much help in answering this article’s research question, which is largely methodological, it does underscore the potential impact of research on polling place issue report detection. As Highton (2006) notes, polling place wait times may influence voters’ decisions to vote and, as a result, affect the outcome of elections. There is also substantial evidence that line discrepancies are likely to be discriminatory, with minority and low-income voters facing longer wait times (Cottrell et al., 2021; Spencer & Markovits, 2010; Stein et al., 2020; Stewart, 2013). Research has also found that urban voters are more likely than rural voters to face issues at their polling places (Kimball, 2013; Stewart, 2013). Notably, long lines often result in “reneging,” where voters leave before voting, and reneging rates also appear to be disproportionately higher in minority precincts (Lamb, 2021; Spencer & Markovits, 2010). Long lines may also depress future turnout, once again disproportionately for minorities (Pettigrew, 2021).
Given the evidence that polling place issues, such as long lines, are both discriminatory and depressors of turnout, we argue that developing new methods for detecting polling place issue reports, such as the one presented in this article, is crucial. This is especially pertinent because simulations, surveys, and in-person observations all suffer from issues, including generalizability, respondent reliability, granularity, and a primary focus on lines. While one method is unlikely to satisfy all these concerns, introducing new methods may help expand our understanding of the causes and impacts of polling place issues.
In the course of this research, we were unable to find past academic work providing state-by-state counts for polling place issues apart from lines, such as problems with poll workers, incorrect information, and electioneering. Perhaps the largest source of this information comes from national election protection hotlines. The largest of these hotlines, “866-OUR-VOTE,” is led by the Lawyers’ Committee for Civil Rights Under Law, who make public some of their data about reports they receive (Grace & Conley, 2018). During the 2018 election season, 75,000 voters, 35,000 on the election day itself, contacted the hotline for either information or complaints about voting (Grace & Conley, 2018).
In 2018, the Lawyer’s Committee reported the top barriers that hotline callers faced when trying to vote, including long lines, inadequate poll worker training, issues with registration, faulty machines, absentee ballots, and provisional ballots (Grace & Conley, 2018). The Lawyer’s Committee reports offer us essential information about the types of issues voters have at polling places and highlights the importance of further detection. Unfortunately, as not every voter knows or cares to call the hotline with their problems, the Lawyer’s Committee has incomplete information about where and how frequently polling place issues occur.
Big Data Approaches
Recently, there have been a few “Big Data” approaches for detecting issues at polling places. Chen et al. (2020) secured smartphone location data for hundreds of thousands of users in and around the 2016 general election to study the line length problem. Using these data, in combination with polling place addresses obtained from election officials and web scraping, Chen et al. (2020) find that the average voting wait time was nineteen minutes, with 18% of the sample waiting more than 30 minutes to vote and Black voters having longer wait times. Although not directly related to this article, Chen et al. (2020) show the potential of using “Big Data” to study polling place issues.
The other “Big Data” approach from Mebane et al. (2017) used data from Twitter to detect more general “voting-related incidents.” Since this article also uses Twitter to answer a similar question, it is worth analyzing it in some detail. The researchers gathered tweets from Sysomos MAP, a Twitter archiver, and the Twitter API on the 2016 primary and general elections dates. Mebane et al. (2017) used over fifty key phrases, including “line to vote,” “vote,” “voter fraud,” and “voter id,” to gather 4,541,097 unique Tweet texts, 505,112 which had enough location information to geolocate to at least a state (p. 6). Human labelers then classified a sample of 19,789 of these tweets as “hit” or “not-hit.” The “hit” tweets were further labeled as one of twelve or fifteen categories, depending on the election, including “Line Length,” “Polling Place Event,” and “Voter Identification” (Mebane et al., 2017, p. 8). Using an active-learning method, Mebane et al. (2017) trained multiple iterations of a support vector machine, adding to the training set before each iteration by labeling tweets about which the model was least certain. Using this model, Mebane et al. (2017) achieve a “hit” precision of .81 and a “hit” recall of .72 for the general election. For the primary election, Mebane et al. (2017) achieve a “hit” precision of .68 and a “hit” recall of .42. However, when model-classified “hits” were viewed by human labelers, 41.5% were deemed to be “not-hits,” resulting in a “hit” precision of 58.5%. Additionally, the classification rules for general election “hits” in Mebane et al. (2017) were much broader than those used to classify “polling place issue” reports in this article. In Mebane et al. (2017), general election tweets were classified as hits not only if the tweet was a report of an issue at a polling place observed by the user or someone the user knows, but also if the tweet provided election information and guidance for other voters. Thus, “hits” also included “successes,” meaning that tweets where users said they successfully voted were also considered incidents (Mebane et al., 2017, p. 17). As a result, although Mebane et al. (2017) present us with a model for detecting their definition of “incidents,” it is unclear whether this same method would help exclusively detect reports of barriers to voting that occur at polling places, such as long lines, electioneering, and voter suppression.
Mebane et al. (2017) offer evidence that people regularly post information about voting to Twitter on election days and that an active-learning support vector machine model can be used to classify these tweets with some accuracy according to a broad definition of “incidents.” However, we still have an unanswered, key question: is it possible to create an accurate model that uses Twitter to detect reports of issues at polling places? The following sections suggest that it is.
Large Language Models
One way to approach an answer to the previous question is to look at advances in data science and machine learning. Recently, new language models have made waves in the field of natural language processing. Many of these are “Transformer” models, built on the work of Vaswani et al. (2017) that first proposed the Transformer framework and demonstrated that, because of their superior analysis of context, Transformers could outperform existing models for language translation tasks. Of particular interest for our purposes here is the Bidirectional Encoder Representations from Transformers (BERT) language representation model, which was trained on the entirety of English Wikipedia and the BookCorpus of 800 million words (Devlin et al., 2019). BERT can be “fine-tuned” for use on various natural language processing tasks, classification being the most important for this article.
Devlin et al. (2019) show that BERT drastically outperforms previous models on many classification tasks. However, other researchers have argued that, because BERT was trained on books and Wikipedia, it may not be well suited for tasks such as analyzing social media. Nguyen et al. (2020) sought to overcome this by developing BERTweet, a large-scale language model that uses the same architecture as BERT but is instead trained on a corpus of 850 million English tweets. The primary model of BERTweet used in this article was trained on 845 million English tweets obtained between 2012 and 2019. After fine-tuning, Nguyen et al. (2020) demonstrated that BERTweet successfully outperforms two pre-trained models, RoBERTa and XLM-R, on the two Twitter text classification tasks they attempted, namely, sentiment analysis and irony detection (Rosenthal et al., 2017; Van Hee et al., 2018).
Since BERTweet has been pre-trained on hundreds of millions of tweets, it contains contextual information about how English is spoken on Twitter. On Twitter-based tasks, there is evidence that it outperforms existing models. Hettiarachchi and Ranasinghe (2020) used BERTweet to classify COVID-19 tweets as “informative” or “not informative,” finding that the base version of BERTweet, which does not contain any COVID-19 related tweets, outperformed traditional non-Transformer–based models. BERTweet has also been used for research in politics, with work from Ballard et al. (2022) fine-tuning the model to classify tweets from U.S. congresspeople as “uncivil” with an accuracy of 95%, outperforming traditional models for the task. Heseltine and Dorsey (2022) use BERTweet for a similar purpose, fine-tuning the model to classify the tweets of congressional candidates as “uncivil” with an accuracy of 90%, also outperforming baseline models. Based on these promising results, we argue that BERTweet provides an opportunity to test more modern machine learning methods on the task of detecting polling place issues (Nguyen et al., 2020; Vaswani et al., 2017).
Data
Keywords Used for Tweets.
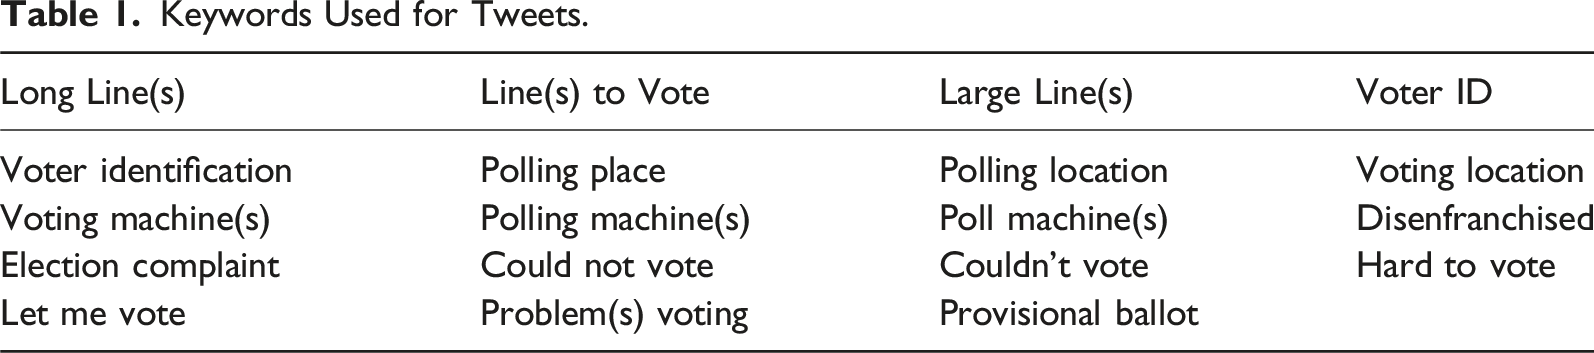
From the dataset of returned tweets, 10,241 tweets were randomly sampled without replacement for labeling to create the main dataset. 515 tweets were hand-labeled as “issues” and 9726 as “non-issues” according to the definition of polling place issues discussed earlier. As noted earlier, the primary goal of this article is to develop a method for detecting reports of polling place issues. Tweets were marked as “issues” if they described an incident that fit the definition, but we did not attempt to verify the veracity of each tweet. Much like voter protection hotlines and survey studies, we rely on self-reports. Labeling was conducted by one coder, with a subset of 1,000 tweets later tested against labels from an additional coder who was provided with the guidance in this and the “Defining Polling Place Issues” sections. There was 99.6% agreement between the two coders for the sub-sample, as most of the tweets were obvious non-issues. The second coder labeled three “non-issue” tweets as “issues” and one “issue” tweet as a “non-issue.” The two coders then discussed these conflicts and agreed that one of the originally labeled “non-issue” tweets should be considered an “issue,” as it referred to an issue with broken machines that had not been resolved. The two other originally labeled “non-issue” tweets remained “non-issues” as one referred to a request for voter ID in a state where that is a requirement, and another was not observed by the author themselves. The originally labeled “issue” tweet also remained an “issue,” as it referred to a line time over 30 minutes, expressed by listing the current time relative to when polls opened (e.g., “I have been here since polls opened, it is now 6:40” in a state where polling sites open at 6 a m.).
For the labeling process, tweets were only marked as issues if the tweet authors suggested they observed the issue themselves. Most importantly, tweets describing long lines were only marked as issues if they specifically mention a wait time of over 30 minutes or describe another issue at the polling place, such as a broken scanner or voting machine. Many “non-issue” tweets simply mention long lines or lines of a particular size (e.g., “around the block” or “forty people”). As mentioned earlier, although there is no legal standard for line times, USPCEA guidance recommends that waiting times should never exceed more than 30 minutes (USPCEA, 2014). Although this definition likely results in the undercounting of line-related issues, it does prevent the over-counting of potentially acceptable line lengths expressed in tweets such as “there was a long line at the polling place today.”
Sentiment was also ignored when labeling tweets. In some cases, tweets express joy at line length (e.g., “It’s so great that there was a two-hour line at my polling place!”), but these tweets were still marked as issues. In other cases, tweets express anger or frustration about non-issues, such as not being able to vote without a voter ID in states where voter ID is mandatory. These tweets were marked as non-issues. Additionally, some tweets describe issues that were already resolved (e.g., a machine had broken down and had just been repaired) and were marked as non-issues. Finally, a small number of tweets describe issues but were obviously from journalists or news outlets. In cases where the tweet describes a first-hand account of an issue, it was marked as an issue. In the cases where the tweet discusses or summarizes the content of an article, it was marked as a non-issue. It is also worth noting that some tweets in the dataset may themselves be considered voter suppression, such as tweets sharing misinformation about voter ID or the date of the election. Although worthy of further analysis, these tweets were not marked as issues.
After some additional duplicate removal, the tweets were then split into training, validation, and test sets of 6,365, 708, and 1,769 tweets, respectively. The full process for deduplicating the tweets is described in the preprocessing & splitting section on page three of the supplemental information. Figure 1 shows the number of tweets gathered from each election day. A breakdown of tweets gathered by state for each election is available in the summary table section on page two of the supplemental information. Number of tweets gathered by election.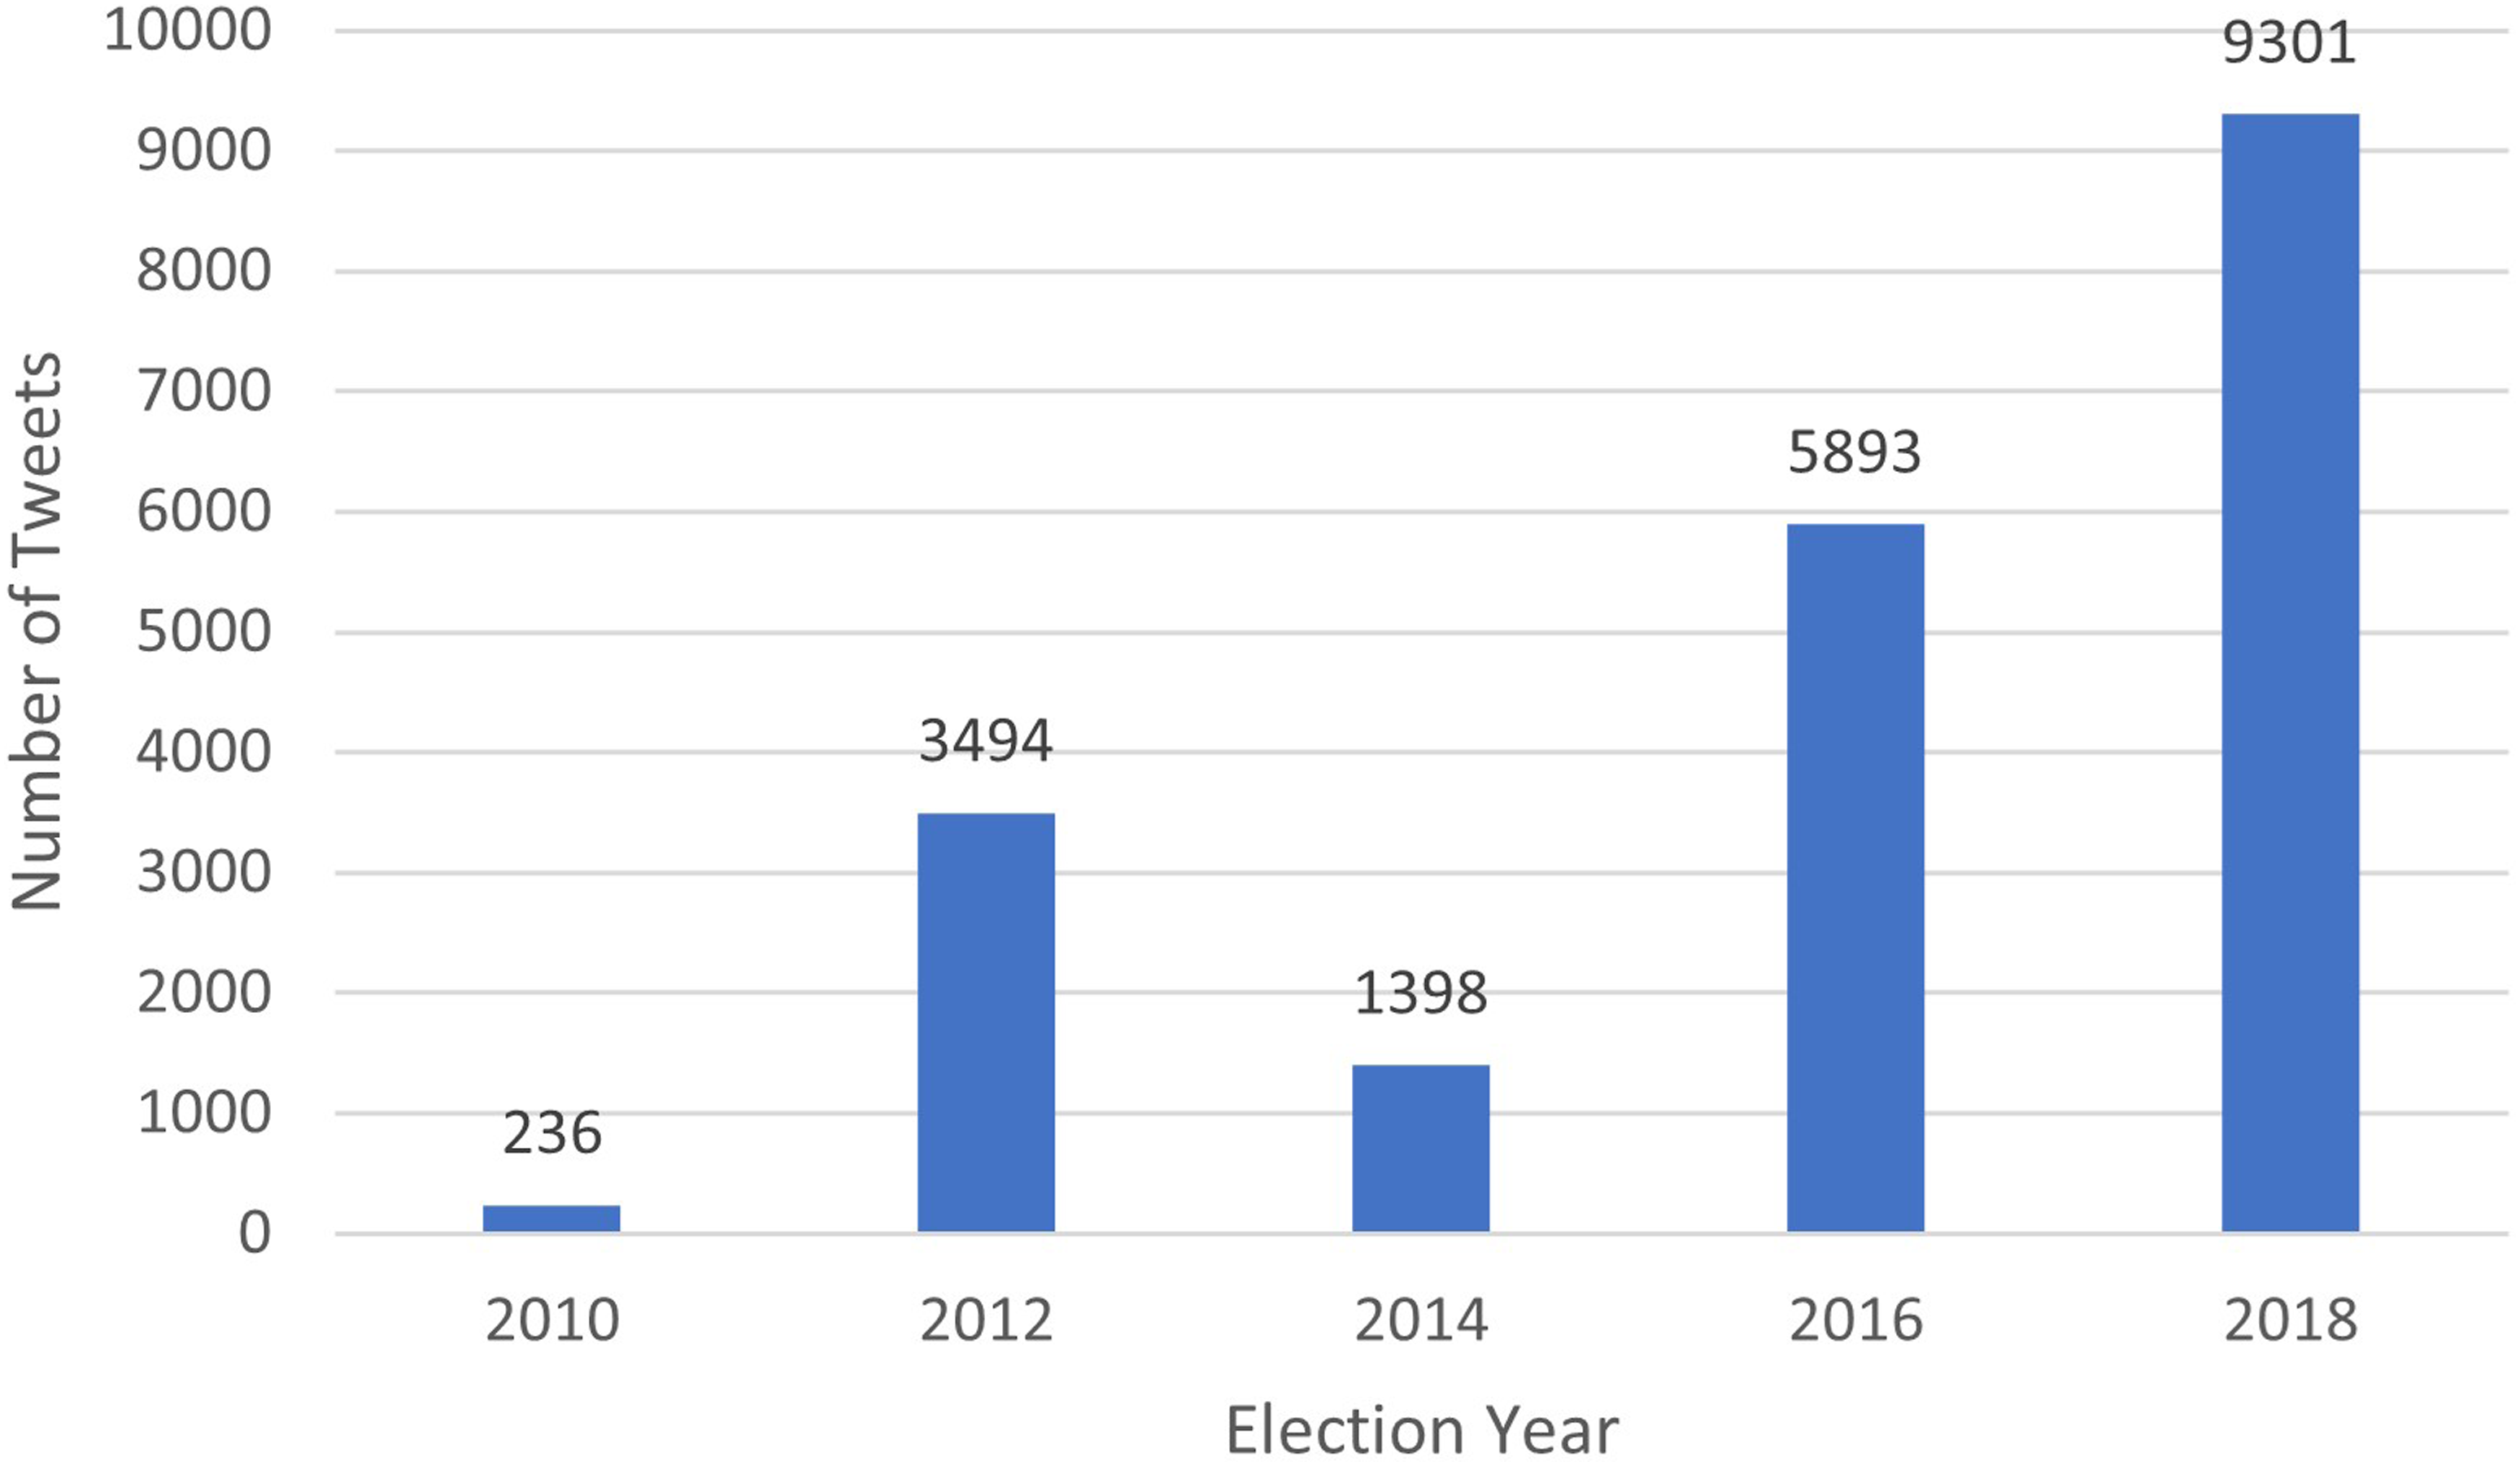
Methods
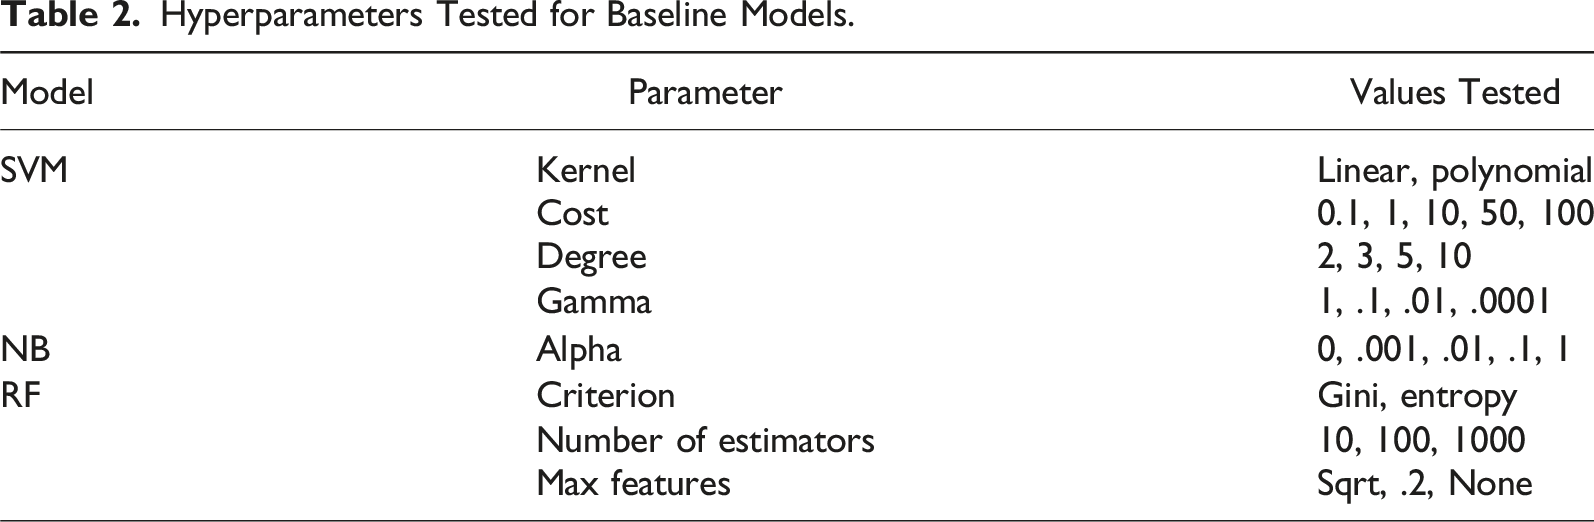
We develop four natural language processing (NLP) models for this article: three baselines and one primary model. The three baseline models are a support vector machine (SVM), a multinomial naïve Bayes (NB) classifier, and a random forest (RF) classifier. The primary model is a fine-tuned version of BERTweet. All model development was conducted on a Google Colab Pro environment. The train, validation, and test datasets are identical for all models to reduce the role of randomness in validation and testing. For the baseline models, the train and validation sets were combined for cross-validation. For the BERTweet model, the validation set is used for hyperparameter tuning, and the best performing model was retrained on both the training and validation sets. In all cases, the test set was only processed and used after the best model from each category was selected, and test data were not involved in the model development or tuning phases.
Baseline Models
Hyperparameters Tested for Baseline Models.
BERTweet Model
The primary model for this article is a fine-tuned version of BERTweet. To build it, we used the Hugging Face Transformers python library, which allows users to select from dozens of pre-trained language models and modify them for specific cases (Transformers, 2021). As mentioned earlier, BERTweet is a Transformer-based model trained on 845 million tweets.
Like the baseline models, preprocessing was conducted on the data before fine-tuning. However, because BERTweet is a pre-trained model, preprocessing must be identical to the preprocessing used during training. Specifically, we used the BERTweet tokenizer, which, apart from tokenizing the tweets, also uses NLTK’s Tweet Tokenizer and converts usernames and links to special tokens. These tokenized tweets were then combined with their respective labels and turned into PyTorch compatible datasets (Paszke et al., 2019).
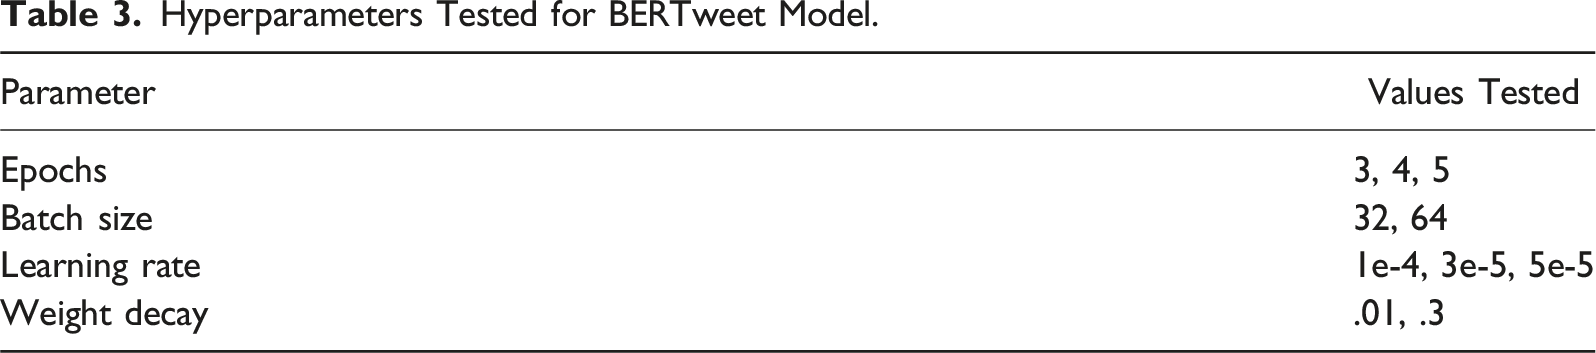
Hyperparameters Tested for BERTweet Model.
Metrics
The three primary metrics calculated for evaluating the performance of the models were accuracy, precision, and recall. There is also the f1 score, which is the harmonic mean of precision and recall. We argue that recall is the most important metric for analyzing the performance of models in this article. Since the data are strongly imbalanced—there are sixteen times more non-issues than issues in the labeled set—high accuracy does not necessarily tell us how successful the model was at its task. For example, imagine a test dataset with 9,000 non-issues and 1,000 issues; a model that simply classifies every tweet as a non-issue would achieve an accuracy of 90% but a recall of 0%. Although this is an exaggerated example, it shows how, for imbalanced datasets, accuracy can be deceiving.
There are two main use cases for an algorithm that detects polling place issue reports from tweets: voter protection efforts and research. In both cases, it is more critical to detect issues than it is to detect non-issues. If a model can offer more true positives at the expense of creating false positives (i.e., higher recall, lower precision/accuracy), a human labeler can comb through the dataset of classified positives to weed out the false positives. Essentially, the model’s goal is to serve as a highly efficient filter of non-issue tweets to help humans find actual issues.
For each model, we also calculated the receiver operating characteristic (ROC) curve and the area under the ROC curve (AUROC). The ROC curve plots the false positive (FP) rate on the x-axis and the true positive (TP) rate on the y-axis. Each point on the curve corresponds to a “threshold” at which a tweet is labeled as an issue or non-issue. Most models assign probabilities to labels; for a specific tweet, a model may say that there is a 40% chance the tweet is an issue report and a 60% chance the tweet is not an issue report. By default, whichever label has a higher probability (i.e., a threshold of 50%) is assigned. The ROC curve allows us to visualize how changing that threshold will impact the FP and TP rates. To achieve better recall, for example, one can choose a lower threshold for the positive class. The AUROC is simply a measurement of the area under the recall curve; it provides us with a metric to understand the overall performance at all thresholds.
For the BERTweet model, we used this ROC curve to find an optimal threshold to potentially increase the model’s recall. To find the optimal threshold, we calculated Youden’s J statistic, a commonly used formula to find the point in the ROC curve that best balances the true and false positive rate (Youden, 1950). The J statistic is simply: TPrate − FPrate. The point on the ROC curve that corresponds to the largest J statistic is the optimal threshold. Since, by default, BERTweet does not return classification probabilities, we added a softmax layer, which converts the original logit outputs to probabilities, to the end of the fine-tuned model. It is worth noting that this was done using the validation set to prevent biasing the results, so the threshold found is almost certainly different than the optimal threshold of the test set.
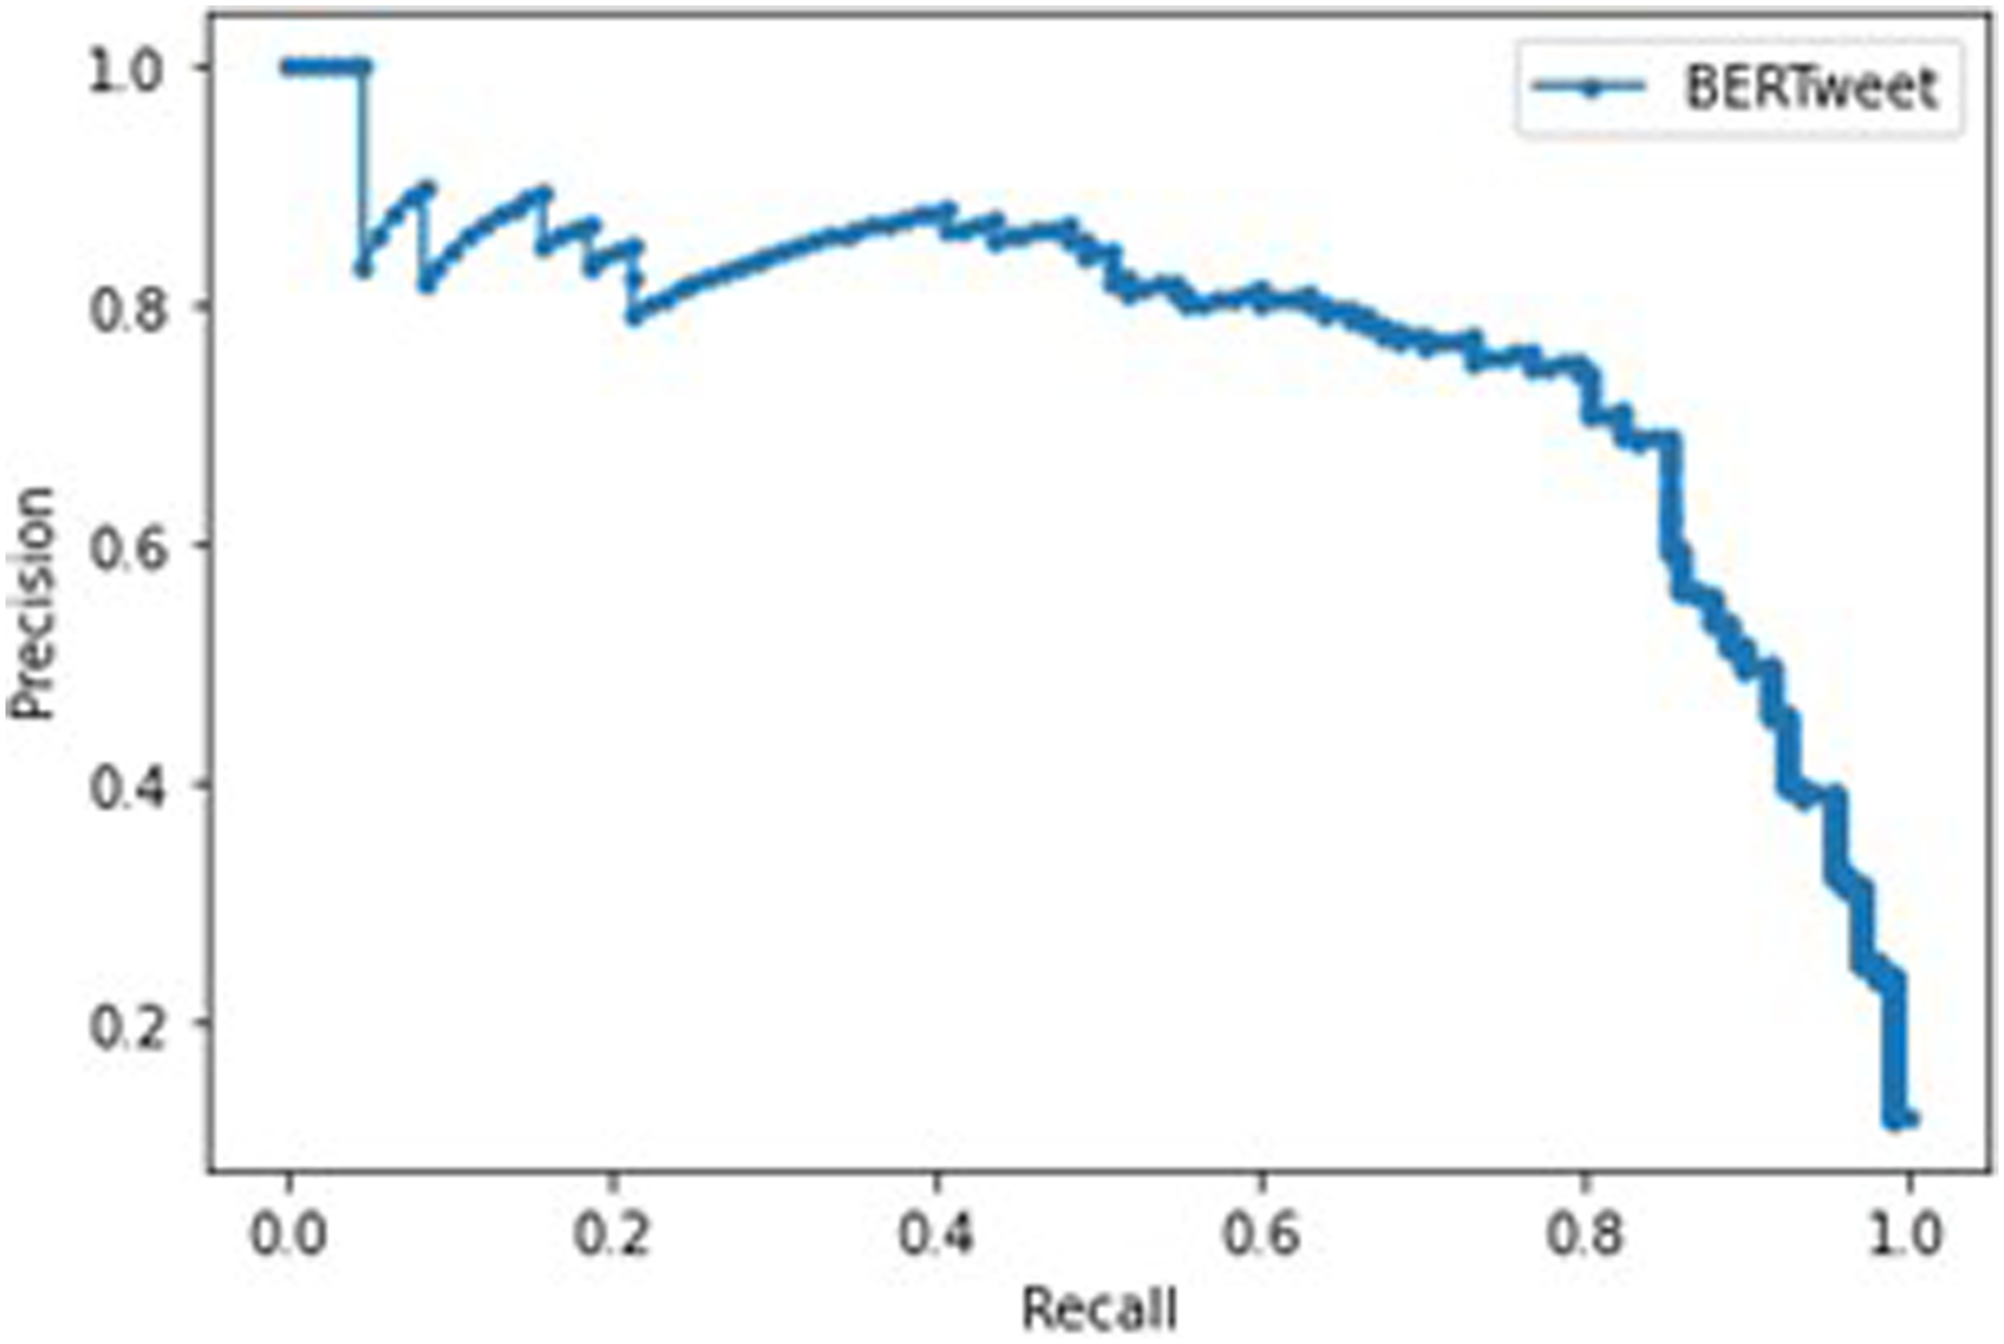
For the BERTweet model, we also calculated the precision-recall curve, which simply plots recall on the x-axis and precision on the y-axis at different thresholds. This is a valuable measure for models with highly imbalanced datasets, as it shifts the measurement focus to the positive class. The AUC for a precision-recall curve is the average precision score, the mean of the precision at each threshold weighted by the change in recall from the previous threshold (Pedregosa et al., 2011).
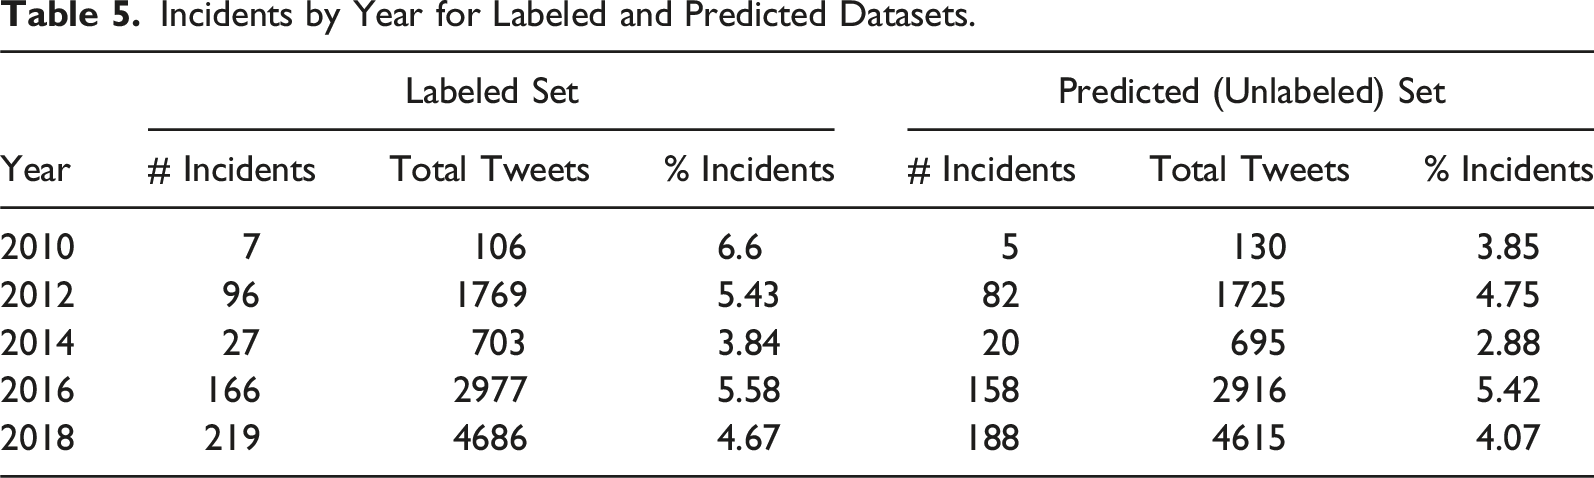
Finally, we also ran the BERTweet model with the original .5 threshold on the 10,081 tweets gathered but not human labeled. This was done to get estimates for each state’s total number of issues detected during each election.
Results
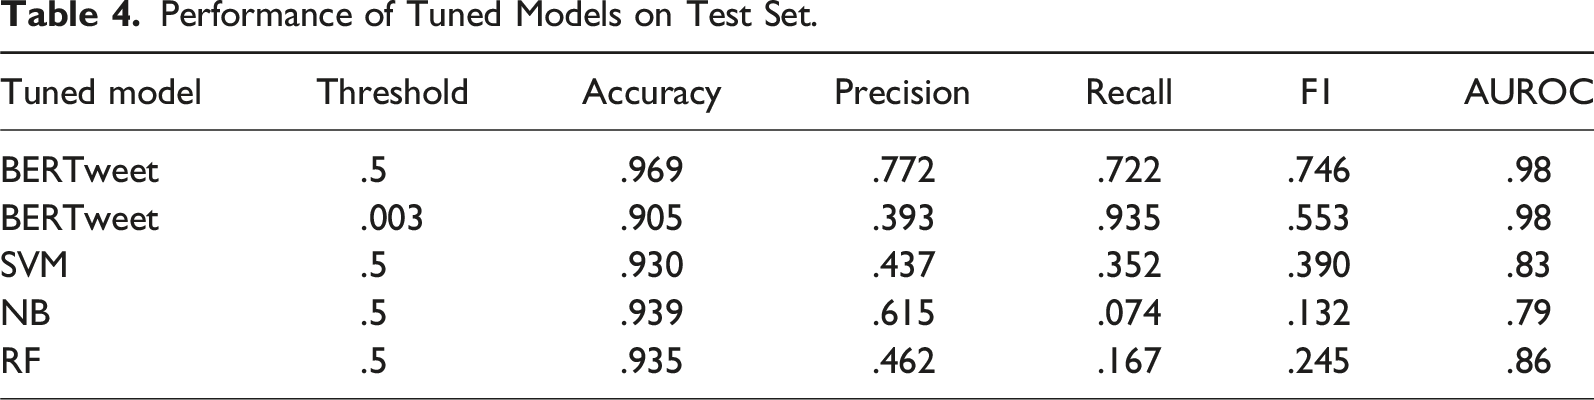
Performance of Tuned Models on Test Set.
BERTweet Model
The best performing BERTweet model was trained with five epochs, a training batch size of sixty-four, a weight decay of .3, and a learning rate of 1e-4. After creating an ROC curve for the validation dataset, .003 was chosen as the optimal threshold. Figure 2 shows the ROC curve with an AUROC of .98 and the optimal threshold. Additionally, the precision-recall curve, which is also not impacted by threshold choice, has an AUC of .77 and is available in Figure 3. BERTweet ROC curve. BERTweet precision-recall curve.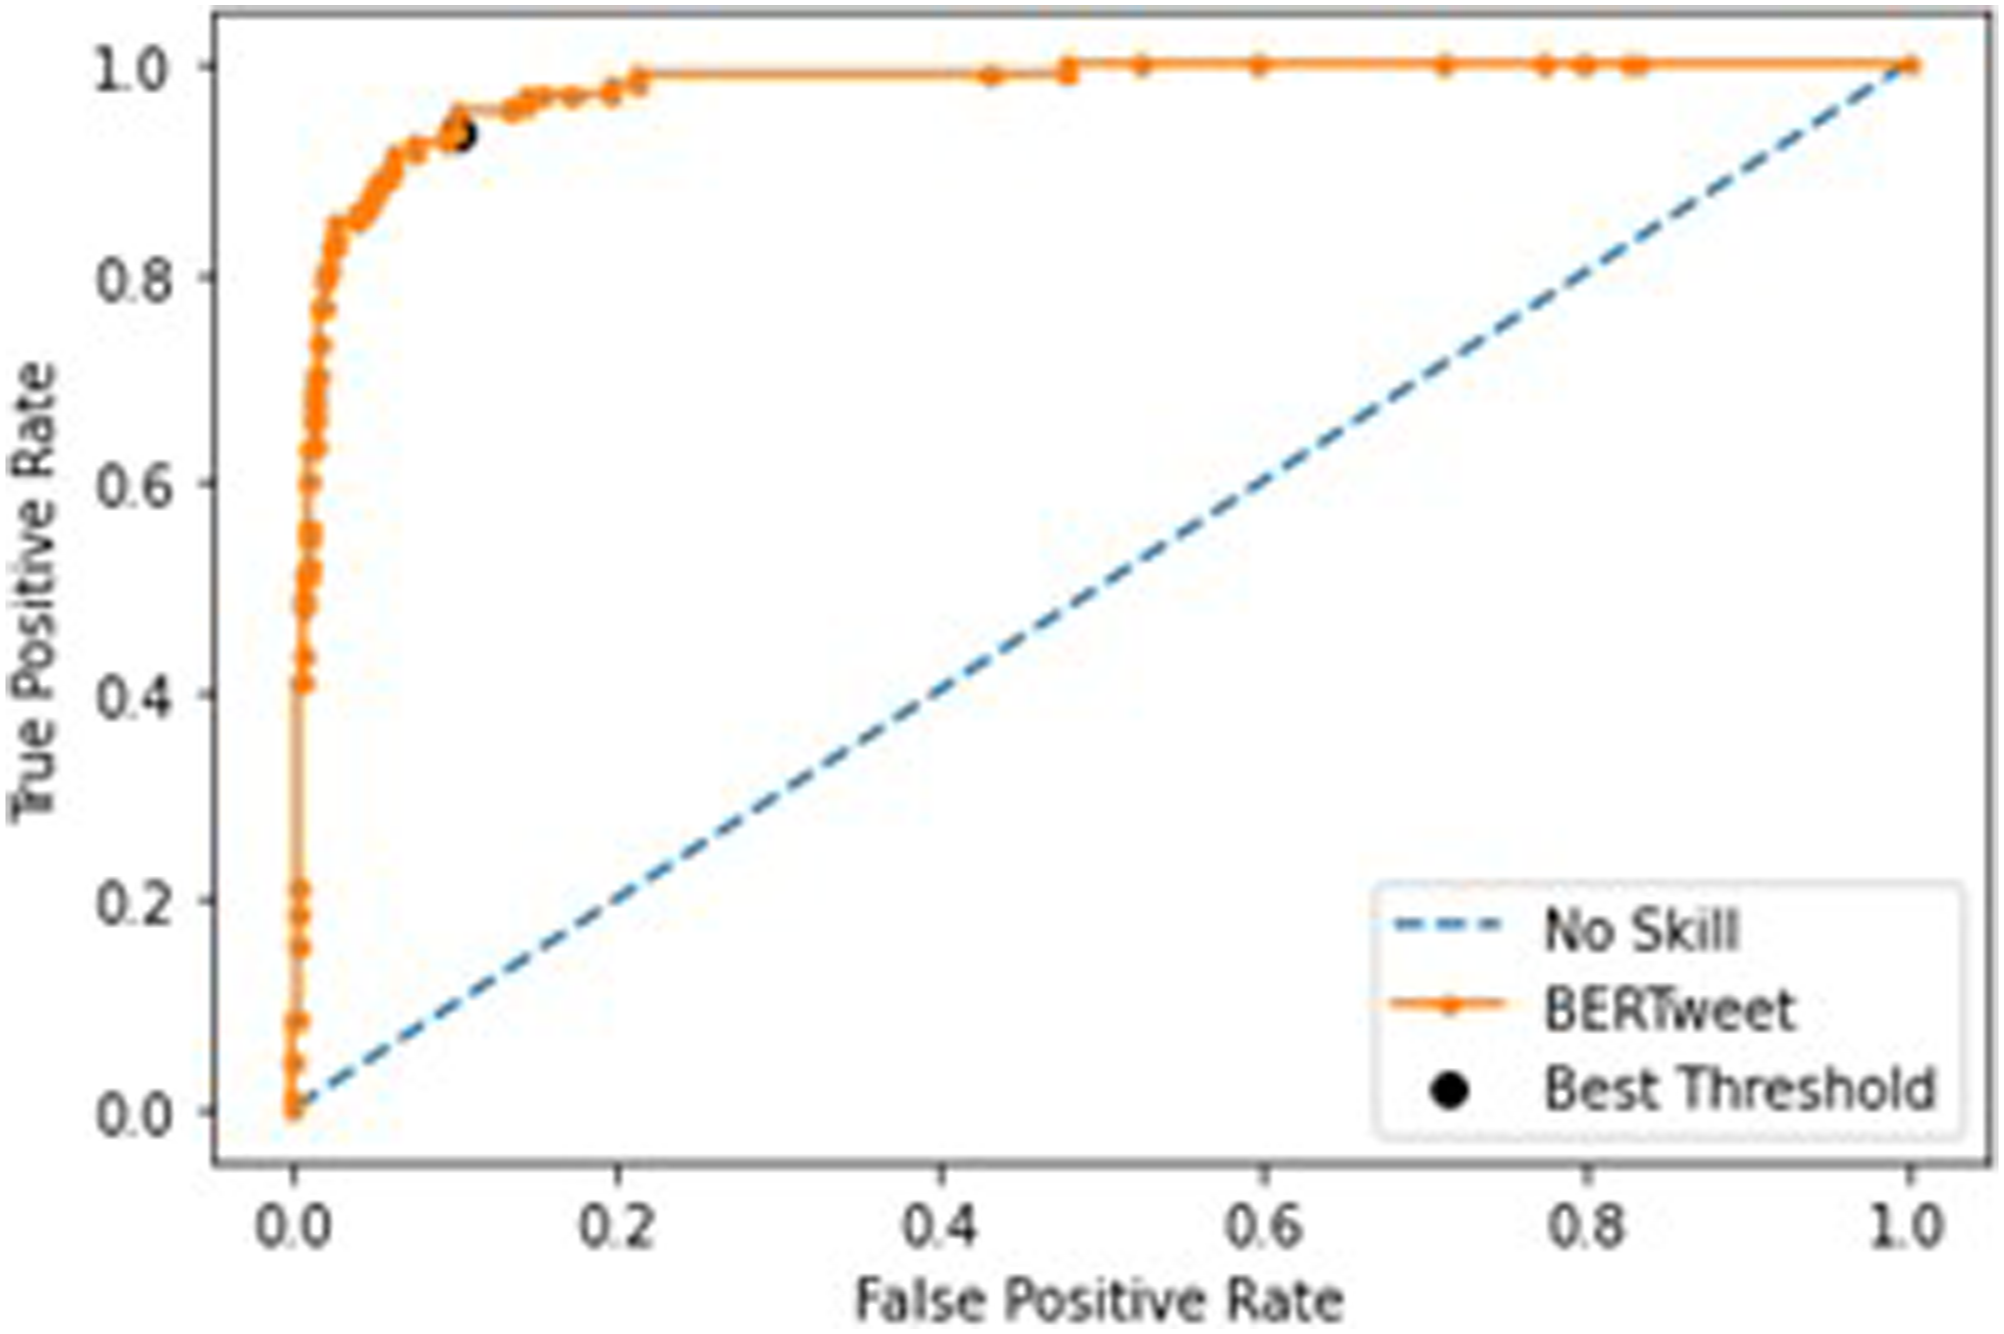
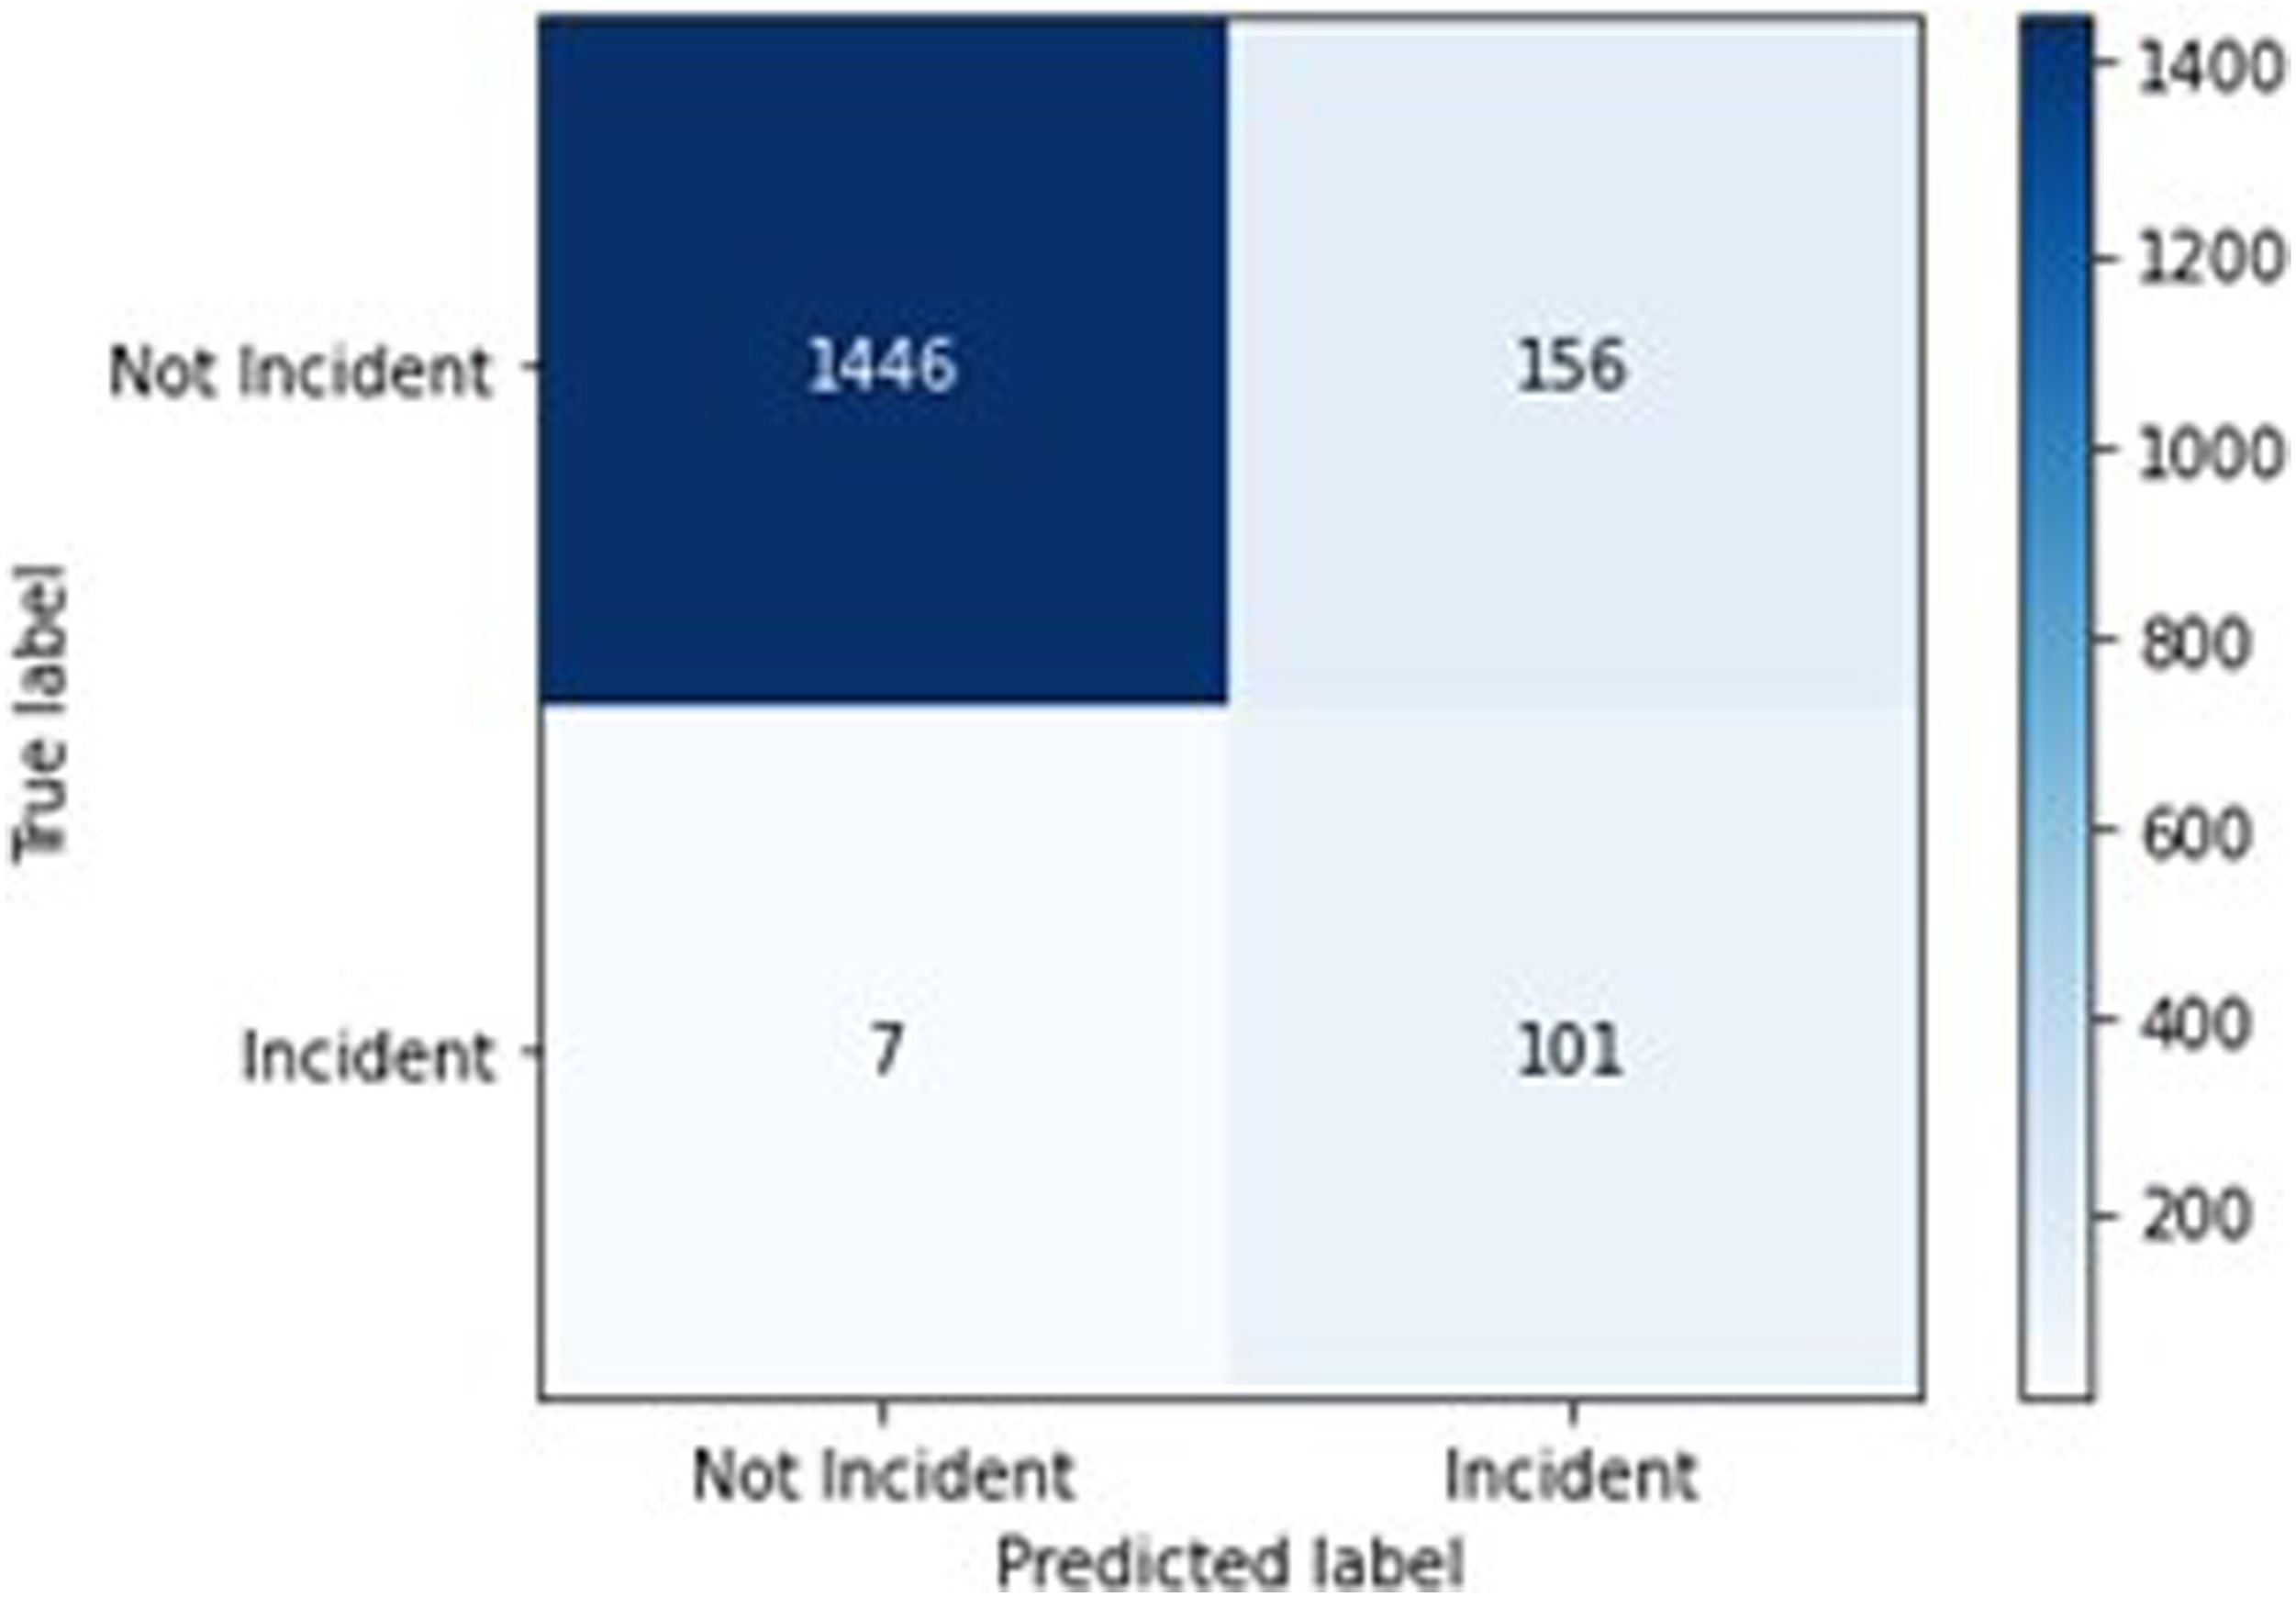
The BERTweet model with a .5 threshold has an accuracy score of .969, a precision score of .772, a recall score of .722, and an F1 score of .746. The confusion matrix for this model is available in Figure 4. The BERTweet model with a threshold of .003 has an accuracy score of .905, a precision score of .393, a recall score of .935, and an F1 score of .553. The confusion matrix for this model is available in Figure 5. BERTweet .5 confusion matrix. BERTweet .003 confusion matrix.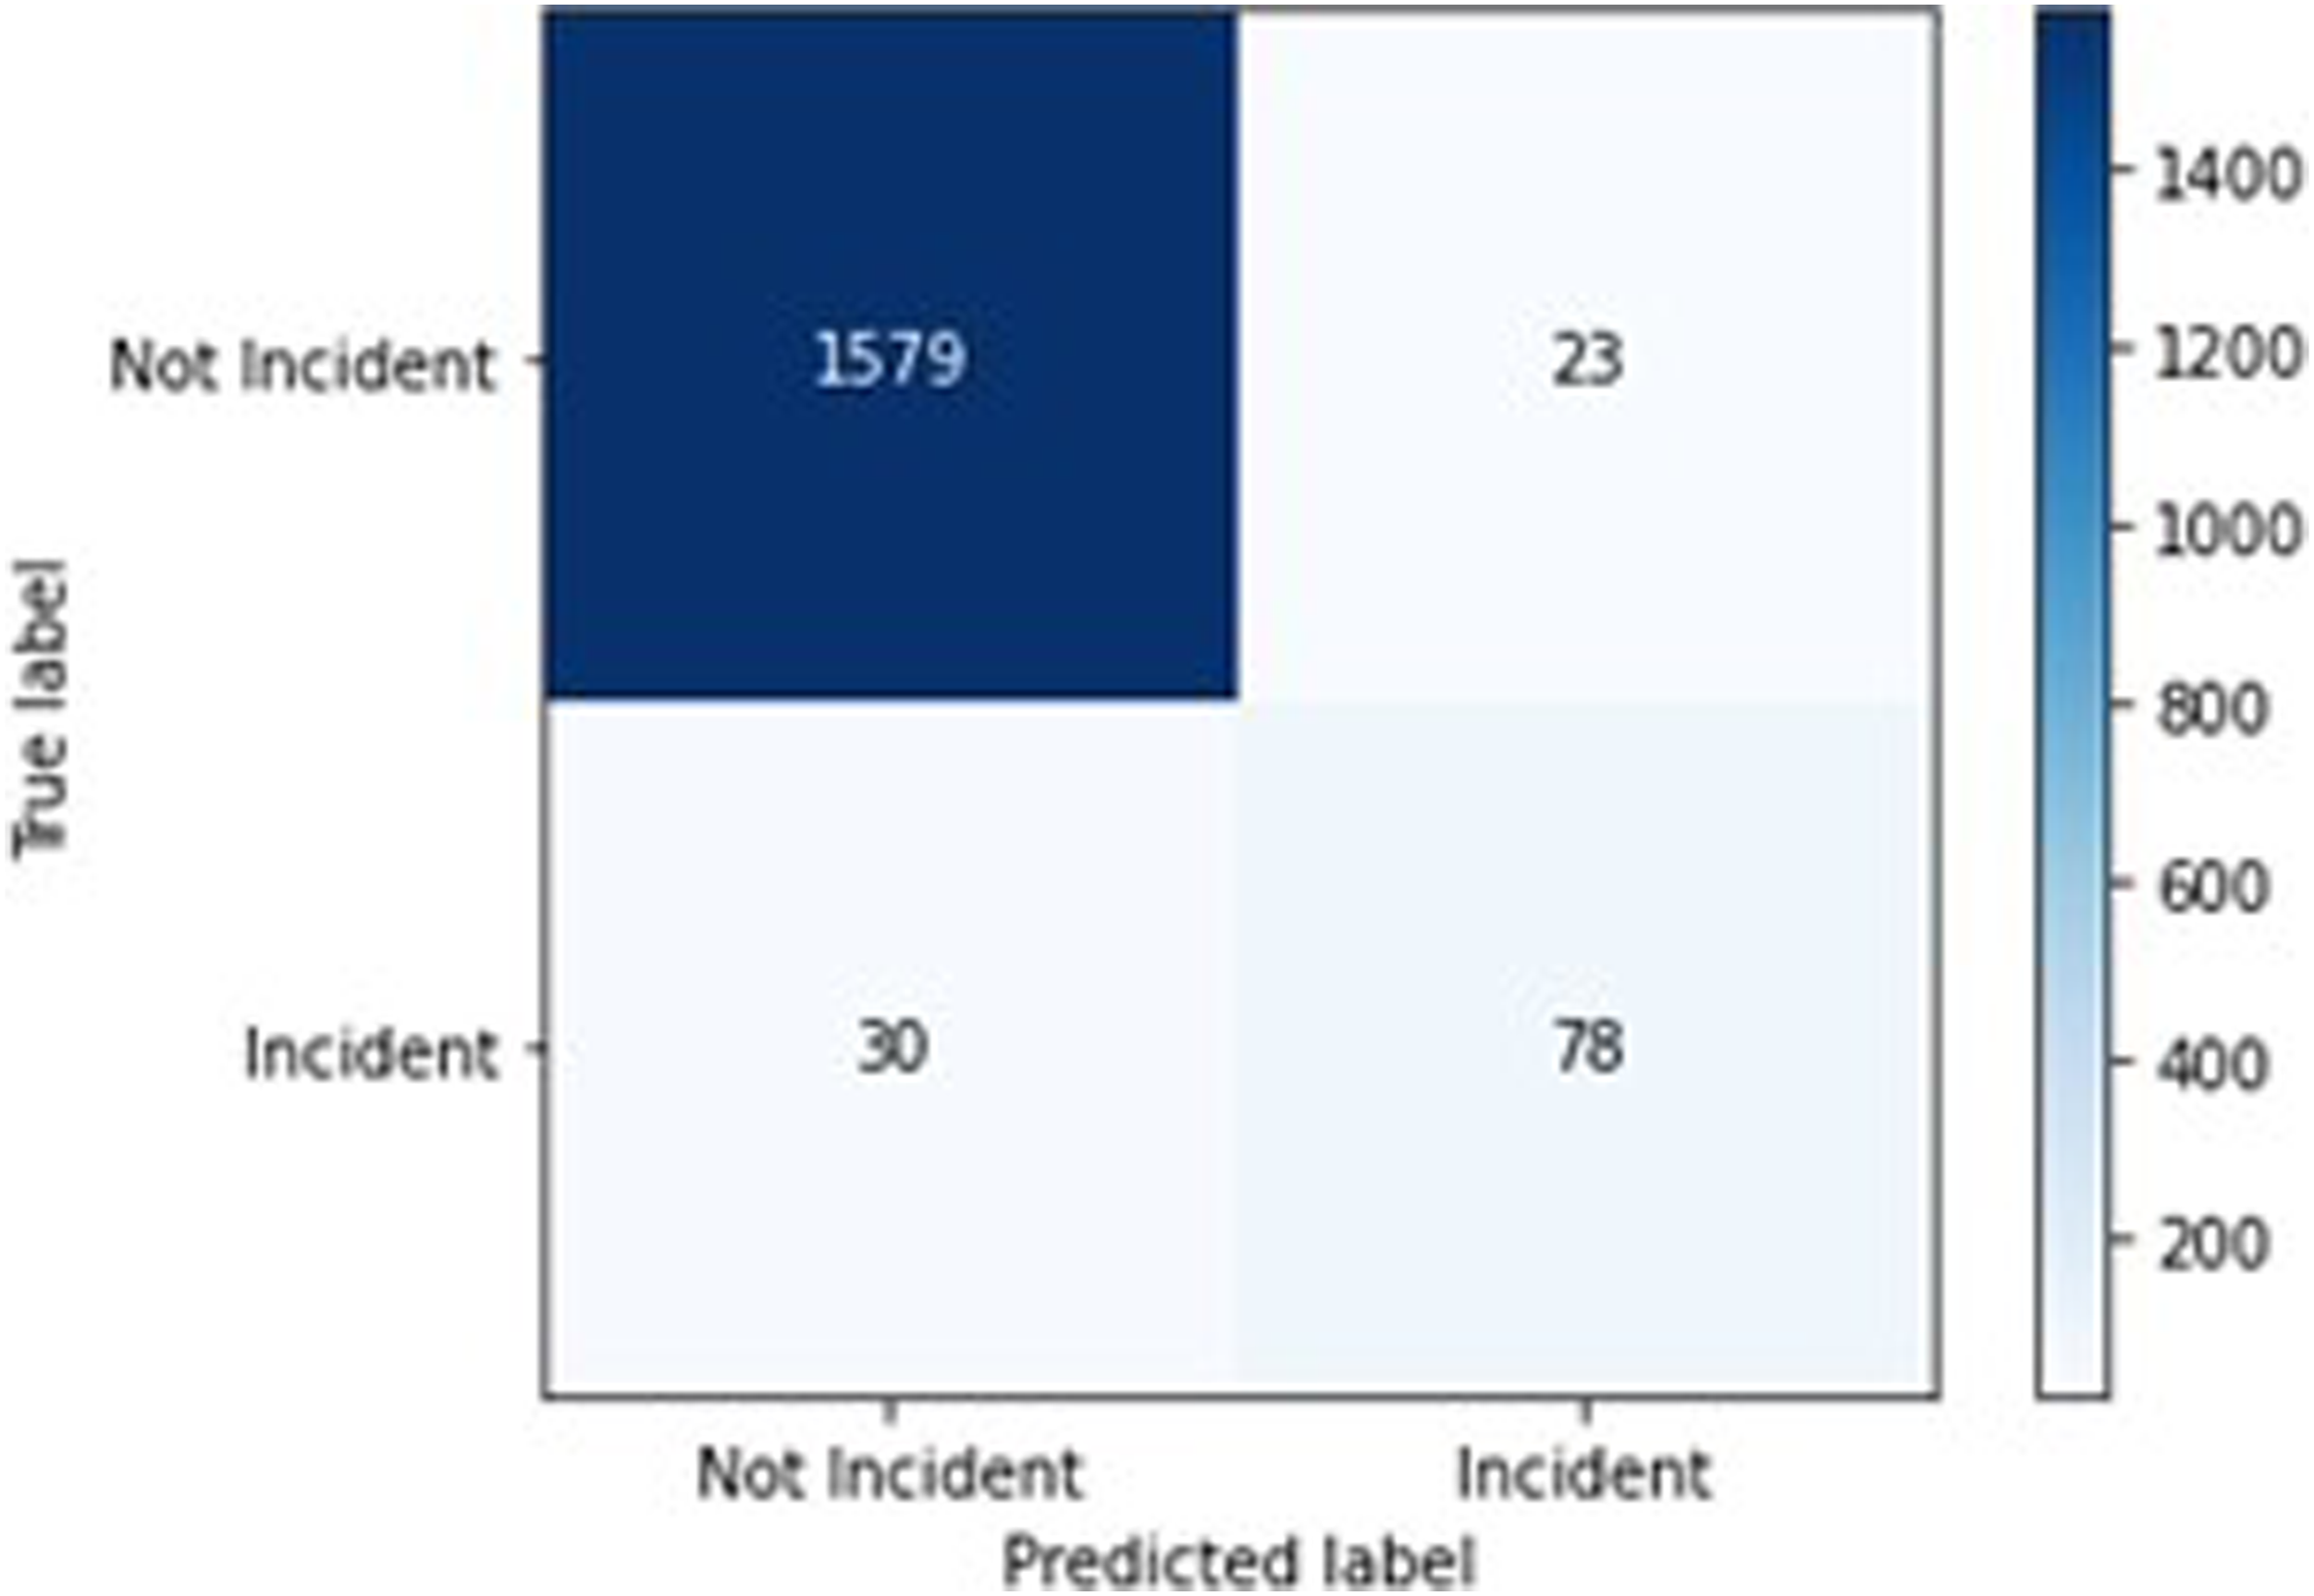
Unsupervised Results
Incidents by Year for Labeled and Predicted Datasets.
Conclusion
This article was motivated by the example of the 2018 gubernatorial election in the state of Georgia, and the virality of tweets that shed a light on issues occurring at polling places. We find that a fine-tuned BERTweet model provides high performance on the task of polling place issue report detection, presenting one version of the model with accuracy of 96.9% and recall of 72.2%, and another version with accuracy of 90.5% and recall of 93.5%. The fine-tuned BERTweet model outperforms baseline models and offers promising performance with a limited training set and only one primary labeler.
Table 4 shows that our BERTweet model offers large improvements over the baseline models in all categories except accuracy and precision for the .003 threshold. The baseline models have high accuracy scores of over .93, but this is largely a consequence of the dataset being greatly imbalanced towards the negative class, as demonstrated by their poor recall scores. A model that simply predicts every tweet as a non-issue would receive an accuracy score of approximately .94.
The BERTweet model at both thresholds achieves excellent results for issue report detection. Additionally, the BERTweet model with .003 threshold sacrifices only a few points in accuracy to drastically increase the recall score. In most cases, it would make sense to use the lower threshold and then manually review predicted issue reports. In general, while we were labeling the training set, we labeled about 200 tweets an hour. Therefore, using a lower threshold would add only a few hours of work after running the model to detect almost all the polling place issues fed into it.
We also examined the specific results of the BERTweet .5 threshold model’s performance on the test set. Although, due to the un-interpretability of deep learning models such as BERTweet, we cannot make generalized claims about why the model made the labeling decisions it did, there are some patterns worth discussing. Amongst the 78 true positives, 67 issue reports were about line or voting machine related issues; the model successfully marked many tweets with varying estimates of line length over 30 minutes, ranging from 36 minutes to 4 hours, as well as tweets with positive-sentiment about line-related issues. Amongst the remaining 11 reports, issues ranged from voters being asked to file provisional ballots, voters being barred from voting, or electioneering. For the 23 false positives, 12 were people discussing stories, rumors, or news reports about other people having polling place issues, 6 were referencing a conspiracy theory article about votes being changed, 3 were about issues that the voter caused, such as going to the wrong polling place, and 2 were about lines under 30 minutes. Finally, of the 30 false negatives, 22 were about line length or voting machine issues, generally in longer, less clear, posts than the true positives, 5 were about electioneering, without mentioning the word, 2 were about voters reneging because of polling site defunction, and 1 was about poll workers not knowing about election day registration. Overall, it appears that most issue reports are about line times over 30 minutes and issues with polling machines, and that the model is generally capable of detecting these. The false positives also demonstrate that the model is not perfectly capable of detecting if an issue report was observed by the author themselves, resulting in positive labels for news articles, conspiracy theories, and hearsay, all of which may obscure geolocation statistics. Finally, the false negatives do not represent a clear difference to the true positives and may simply require more training data. In general, a substantial amount of these issues can be mitigated by using the .003 threshold model alongside human oversight of predicted positives.
Overall, although there is no previous research to directly compare the model to, our model’s high accuracy, precision, and recall are encouraging signs for both current applications and future progress. However, there are some limitations. In particular, the Covid-19 pandemic drastically impacted the 2020 Presidential election, which saw a considerable shift towards mail-in and early voting. Estimates show that 46% of voters voted by mail in 2020, compared to 21% in 2016 (Rakich, 2021). At the same time, polling shows that nearly 20% of in-person voters stated they had to wait more than 30 minutes in line to vote in 2020 (Pew Research Center, 2020). Without further work, we do not know whether the model presented in this article would detect polling place issue reports during the 2020 election.
Additionally, as mentioned earlier, the tweets for this article were restricted to ones that contained enough location information to be geolocated to a specific state. Past work suggests that there are statistically significant differences in the demographics of people who enable geolocation and those who do not, making our sample less representative of Twitter as a whole; however, these differences for gender and age distributions are minor (Sloan & Morgan, 2015). Also, the keyword “vote” was left out of our searches to the Twitter API to avoid further imbalancing the dataset with thousands of non-issues. This necessarily means that the model did not detect some issue reports because they were never in the dataset. It is possible that the model would detect those reports if presented with the data, but this article did not test that. Apart from “vote,” there may be dozens of more keywords that describe polling place issues. These issues, as well as our strict coding practices, are likely to have resulted in an undercount of polling place issue reports. It is worth re-emphasizing that the model is only capable of detecting issue reports and cannot verify if the described issue actually occurred. Although this limitation exists for other methods of polling place issue analysis, we argue that detecting reports is still useful for a variety of purposes, discussed below.
The BERTweet model offered in this article is encouraging for future research on polling place issue report detection. However, it is worth noting that the Twitter Academic API used for this analysis is now defunct, and future research using data directly from Twitter would require paying for enterprise API access, likely to be cost-prohibitive for most researchers. Alternative forms of data gathering may include manually collecting data, which is likely to be time-intensive, or the use of data-scrapers, which Twitter’s terms of service now prohibits (James, 2023). Future research may also consider using other, similar, platforms that have gained popularity since this analysis was conducted, including META’s Threads, if META develops an API for research, or Mastodon, a federated social network with open-access APIs (API Guidelines and best practices, 2024). Since these platforms operate on the same principle of mostly text-based posts, this article’s approach could be easily adapted to them. Assuming appropriate data access, below, we discuss a few pathways for further research.
One path for future research is to test and improve the model presented in this article. As mentioned earlier, the training set for the model consisted of only 6,365 tweets, and only one researcher labeled most tweets. An easy way to improve model performance will be to increase the size of the training set and have labeling done by more people to further prevent errors. Researchers can also add different keywords to the training set to improve performance and catch more issues. Removing the requirement for geolocated tweets will also drastically increase the data available.
There are also ways to parse tweets for location information available in the text itself. For example, Twitter runs its own algorithms to look for “entities” inside the text of tweets, including references to location, that are available via the API. Additionally, work in other fields such as traffic detection has used data science methods to geocode tweets based on references to street names and landmarks inside the text of tweets (Gu et al., 2016). Finally, there is also an opportunity to fine-tune other large language models, such as the original BERT, RoBERTa, and GPT-3, which, while not explicitly trained on tweets, have much larger training sets and may offer competitive performance (Liu et al., 2019; Sanh et al., 2019).
Other future work may focus on applying this model to questions in political science. For example, do some states regularly have more reported issues than others? Do issue reports on Twitter correlate with surveys or polls of issues done during and after elections? Do issue reports correlate with demographics such as race and socioeconomic status? Since previous work on line length has found disparities in wait times in minority communities, researchers can test if those disparities exist for all types of polling place issue reports (Highton, 2006; Spencer & Markovits, 2010).
The results of this article’s BERTweet model also serve as a proof-of-concept for how machine learning methods can be used to tackle previously unanswered questions in political science. While issues at U.S. polling places have surely been occurring since the beginning of American democracy, the lack of work counting and publishing these issues shows the difficulty of the task. Just as Chen et al. (2020) show that using location data from polling sites can offer estimates of line length that are more generalizable than sending human observers to a few polling sites, this article shows the potential for using social media platforms for understanding where all types of polling place issues occur. In the past, research on polling place issues would have to rely on self-report surveys, a human observer, or data about issues reported to voter protection hotlines. Now, this article’s model can quickly and accurately parse through thousands of tweets to estimate where and how frequently polling place issues occur. Even outside the subject of polling place issues, natural language processing algorithms on social media platforms may offer political scientists an opportunity to study questions that were previously unanswerable due to difficult or impossible data gathering tasks.
Apart from further research, the BERTweet classification approach shown in this article shows great promise as a method to help with existing voter protection efforts. In recent years, groups such as “866-OUR-VOTE” have had teams of volunteer monitors “that tracked voting problems reported on various platforms and flagged misleading or intimidating content” (Grace & Conley, 2018, p. 3). With cooperation from Twitter, only slight modifications to the work presented in this article would be necessary to use this model for voter protection efforts. Supplemental Material
Supplemental Material
Supplemental Material – Using Twitter to Detect Polling Place Issue Reports on U.S. Election Days
Supplemental Material for Using Twitter to Detect Polling Place Issue Reports on U.S. Election Days by Prathm Juneja and Luciano Floridi in Social Science Computer Review.
Footnotes
Declaration of Conflicting Interests
The author(s) declared no potential conflicts of interest with respect to the research, authorship, and/or publication of this article.
Funding
The author(s) disclosed receipt of the following financial support for the research, authorship, and/or publication of this article: Prathm Juneja’s DPhil at the University of Oxford is funded by the Rhodes Scholarship, which had no role in this research.
Ethical Statement
Supplemental Material
Supplemental material for this article is available online
Notes
Author Biographies
References
Supplementary Material
Please find the following supplemental material available below.
For Open Access articles published under a Creative Commons License, all supplemental material carries the same license as the article it is associated with.
For non-Open Access articles published, all supplemental material carries a non-exclusive license, and permission requests for re-use of supplemental material or any part of supplemental material shall be sent directly to the copyright owner as specified in the copyright notice associated with the article.