
Abstract
Large-scale data from private companies offer new opportunities to examine topics of scientific and social significance, such as racial inequality, partisan polarization, and activity-based segregation. However, because such data are often generated through automated processes, their accuracy and reliability for social science research remain unclear. The present study examines how quality issues in large-scale data from private companies can afflict the reporting of even ostensibly uncomplicated values. We assess the reliability with which an often-used device tracking data source, SafeGraph, sorted data it acquired on financial institutions into categories, such as banks and payday lenders, based on a standard classification system. We find major classification problems that vary by type of institution, and remarkably high rates of unidentified closures and duplicate records. We suggest that classification problems can affect research based on large-scale private data in four ways: detection, efficiency, validity, and bias. We discuss the implications of our findings, and list a set of problems researchers should consider when using large-scale data from companies.
Introduction
In recent years, researchers have increasingly exploited large-scale data from private companies to generate social science, studying issues such as disparities in COVID-19 infection rates (Chang et al., 2021), gender differences in labor force participation (Hansen et al., 2022), heterogeneity in consumer preferences (Athey et al., 2018), political polarization (Chen & Rohla, 2018), and neighborhood isolation (Prestby et al., 2020). However, many such data are automatically generated by algorithms whose details are unknown to researchers. And because the companies produce the data not to generate science but to pursue their own interests, the data’s accuracy and reliability remain in question (Grigoropoulou & Small, 2022; Zhao et al., 2019).
The present study probes the extent to which quality issues in large-scale data from private companies can undermine social science research. It focuses on the classification problem—how companies sort data inputs into variables and values—and considers a best-case scenario: when a company, instead of creating its own classification scheme, simply sorts data into a standardized classification system widely used by researchers. The study resulted from our efforts to understand the distribution of different kinds of financial establishments across neighborhoods in the U.S., and we use the need for reliable data for that research as our case here. We ask whether the company’s algorithms classified financial institutions reliably—that is, the extent to which every establishment the company classified as, say, a credit union, was in fact a credit union and not a conventional bank, payday lender, or something else.
For our case, we use data from SafeGraph, a popular device-tracking company that provides the locations of financial establishments in the U.S. and that has informed many important recent studies (Benzell et al., 2020; Chang et al., 2021; Chen & Rohla, 2018; Huang et al., 2023; Jay et al., 2020; Levy et al., 2022; Massenkoff & Chalfin, 2022; Weill et al., 2020). For each establishment, SafeGraph provides, among many other variables, the establishment’s name (e.g., “Bank of America”), addresses (e.g., “215 W 125th St, New York, NY”), and classification code. For the latter, SafeGraph uses the 6-digit North American Industry Classification System (NAICS), a widely-used standard that assigns different codes to different establishments based on precise descriptions of their primary business activities. Informed by those descriptions, and based on both field and online research, we independently classified the financial establishments provided by SafeGraph, and compared the NAICS codes we assigned to the ones SafeGraph did. We also examined the possibility of other problems, such as duplicate or outdated records.
We find evidence of major classification problems that vary by type of institution, and considerably high rates of unidentified closures and duplicate records. The problems are of sufficient magnitude to have affected the conclusions drawn in our empirical research. Moreover, the processes through which the company produced the data suggest that similar problems are likely to affect other data sources where algorithms play a major role in classification systems. We conclude with recommendations for scholars working with company data. We begin by describing the classification problem.
The Classification Problem
In recent years, several companies have made mobility data collected from mobile devices freely available to researchers, resulting in a large number of studies (Chang et al., 2021; Elarde et al., 2021; Levin et al., 2021; Levy et al., 2022; Li et al., 2022; Prestby et al., 2020; Sparks et al., 2022). Studies using such data have relied on the companies’ classification of establishments to examine industry-specific research questions or to compare phenomena across business sectors (Brelsford et al., 2022; Gao et al., 2019; Li & Yang, 2021). For example, Athey et al. (2018) used the industry codes in SafeGraph to examine heterogeneity in consumer preferences for restaurant locations. Hansen et al. (2022) used the classifications to examine how school closures and re-openings affected the employment rates of married mothers versus other demographic groups. Benzell et al. (2020) used them to assess the risk of COVID-19 transmission in different industry categories, and to propose reopening policies. Others have used these classifications to understand inequality in visits across retail subsectors (Ballantyne et al., 2021), parks (Jay et al., 2022), and alcohol vendors (Hu et al., 2021).
Studies of this kind have largely assumed that locations designated as restaurants, parks, or banks in the datasets are in fact restaurants, parks, or banks. However, because large-scale administrative data are often derived algorithmically, their accuracy and reliability require assessment, particularly given that the interests of the companies may not align with those of researchers (Grigoropoulou & Small, 2022). For a business, an algorithmic model that accurately predicts the location of 80% of establishments in a short period of time may be satisfactory (Nisbet et al., 2018). Indeed, there are practical limits to prediction, and for complex tasks, such as classifying a large number of industry categories, even 80% may be higher than one can hope for (Hofman et al., 2017). For a social scientist, however, such a rate may undermine the reliability of many kinds of analyses.
The current study uses SafeGraph data to examine how classification into industry codes can affect the reporting of an ostensibly uncomplicated value, the locations of financial institutions such as banks across the U.S. For our purposes, classification is the process of assigning values to discrete categories based on correspondence to a known typology (Bailey, 2005; Nisbet et al., 2018). From a statistical perspective, the main objective of reliable classification is to reduce heterogeneity within each class by identifying similar members of the class and to increase heterogeneity between classes (Bailey, 1994). In the era of large-scale data, researchers and data scientists have tackled the task of classification through supervised machine learning methods, in which a smaller set of labeled data is used to train a model that classifies a larger set of unlabeled data (Kotsiantis et al., 2006; Nisbet et al., 2018). The model uses the information in the labeled data to generate the probability that each case in the unlabeled data belongs to one of the categories (see also Tharwat, 2020).
Supervised learning methods are widely used to classify establishment data (Choi et al., 2014; Giannopoulos & Meimaris, 2019; Milias & Psyllidis, 2021). Supervised learning was used by SafeGraph, which has developed a database of more than 18M Points-of-Interest (POI) in the United States by extracting information about establishments via web crawlers. Web crawlers scour various open Internet sources, most commonly store locators, government websites, and location platforms such as Google Maps, Yelp, MapQuest, and others (Bonack, 2021). Once the establishment data are collected, SafeGraph deploys its proprietary machine learning algorithm to classify them into nearly 1000 NAICS categories. The categories increase in granularity hierarchically, from 2 to 6 digits. For example, the general code 52 includes all types of “Finance and Insurance” establishments; the granular code 522130 captures “Credit Unions.” Because SafeGraph’s algorithm is proprietary, we only know that it classifies each establishment into an NAICS category by determining its primary activity based on its location name and other unspecified metadata (SafeGraph, 2022).
Classification into NAICS codes is an instance of multi-class classification, that is, into more than two categories (Grandini et al., 2020). Previous research notes that multi-class classification can pose particular difficulties when the sample size is small or sparse, the classification structure has unclear category boundaries, or the characteristics of the categories are insufficiently specified (Grandini et al., 2020; Ho & Basu, 2002; Moral et al., 2022). Such problems should be of lesser concern for NAICS. NAICS was created by the governments of the United States, Canada, and Mexico to offer a standard model for gathering, analyzing, and reporting data for different industries in North America (U.S. Census Bureau, 2022c). Its classification manual contains clear descriptions, index entries of the types of businesses included, and illustrative examples for each industry category leaving little space for ambiguity. Moreover, the establishment volume is large and dense. NAICS is commonly used in academic, governmental, and business contexts because it allows scientists to produce consistent, comparable, and replicable research.
Even without these challenges, text classification into ∼1000 NAICS categories remains a formidable task. It is further complicated by the fact that the categories are imbalanced in size: some categories contain hundreds of thousands of cases (e.g.,722511 Full-Service Restaurants), while others, only a few hundred. When an algorithm is trained to classify imbalanced data, it often assigns disproportionate importance to the dominant categories; as a result, the model selects information from the classes unevenly and performs poorly on the classification of the less frequent ones (Liu et al., 2009). Given the complexity of the multi-classification, it is reasonable to be wary of the ways potential inaccuracies in data classification can affect our research. Classification into NAICS codes can offer a near best-case scenario for such a complex task to examine how potential classification errors, if left unnoticed, can affect the quality of large-scale data obtained from third-party sources.
Data
In early 2022, we acquired location data for financial service establishments in the U.S. from SafeGraph’s Core Places. Places is a commercial dataset that contains location records, geographic coordinates, brand and establishment characteristics, and algorithmically derived NAICS codes. At the time, this dataset was freely available for academics through SafeGraph’s digital shop. 1 In the digital shop, researchers could query and select data by geographic location and NAICS category. We downloaded location data solely for establishments classified in the six 6-digit NAICS codes that most closely matched our research interest in consumer-facing conventional versus alternative financial institutions in the U.S. The industry categories were as follows (NAICS codes in parenthesis): “Commercial banks” (522110), “Savings institutions” (522120), “Credit unions” (522130), “Consumer lending” (522291), “All other nondepository credit intermediation” (522298), and “Other activities related to credit intermediation” (522390). Thus, our dataset consisted of the 202,750 establishments that had been classified into these six industry categories by SafeGraph. 2
Methods
Procedure
Our data quality concerns were driven by an empirical interest in racial inequality in access to financial services in the United States. We acquired data on the location of financial establishments from SafeGraph to examine differences across racial groups in travel to traditional financial institutions, such as banks and credit unions, versus travel to what are commonly known as alternative financial institutions (AFI), such as payday lenders and check cashers. AFIs tend to offer costlier services than federally insured financial institutions, costs that can exacerbate the difficulties of low-income customers (Bradley et al., 2009; Faber, 2019; Small et al., 2021).
Our study required the ability to identify specific types of establishments, namely, (1) banks, (2) credit unions, and (3) alternative financial institutions (AFI). For AFIs, we also required a more granular classification to identify (a) payday lenders, (b) check cashers, (c) car title lenders, and (d) pawnshops, for a total of three broad categories plus four subcategories. The first three are mutually exclusive, as they describe types of institutions; the four subcategories are not, as they describe services offered by AFIs. For example, an AFI may offer both check cashing and payday lending, and many do. Still, when an AFI offers only one of the four services, such as payday lending, it may be thought of as a type of institution (payday lender).
Descriptions and Index Entries for NAICS Codes, U.S. Census Bureau.
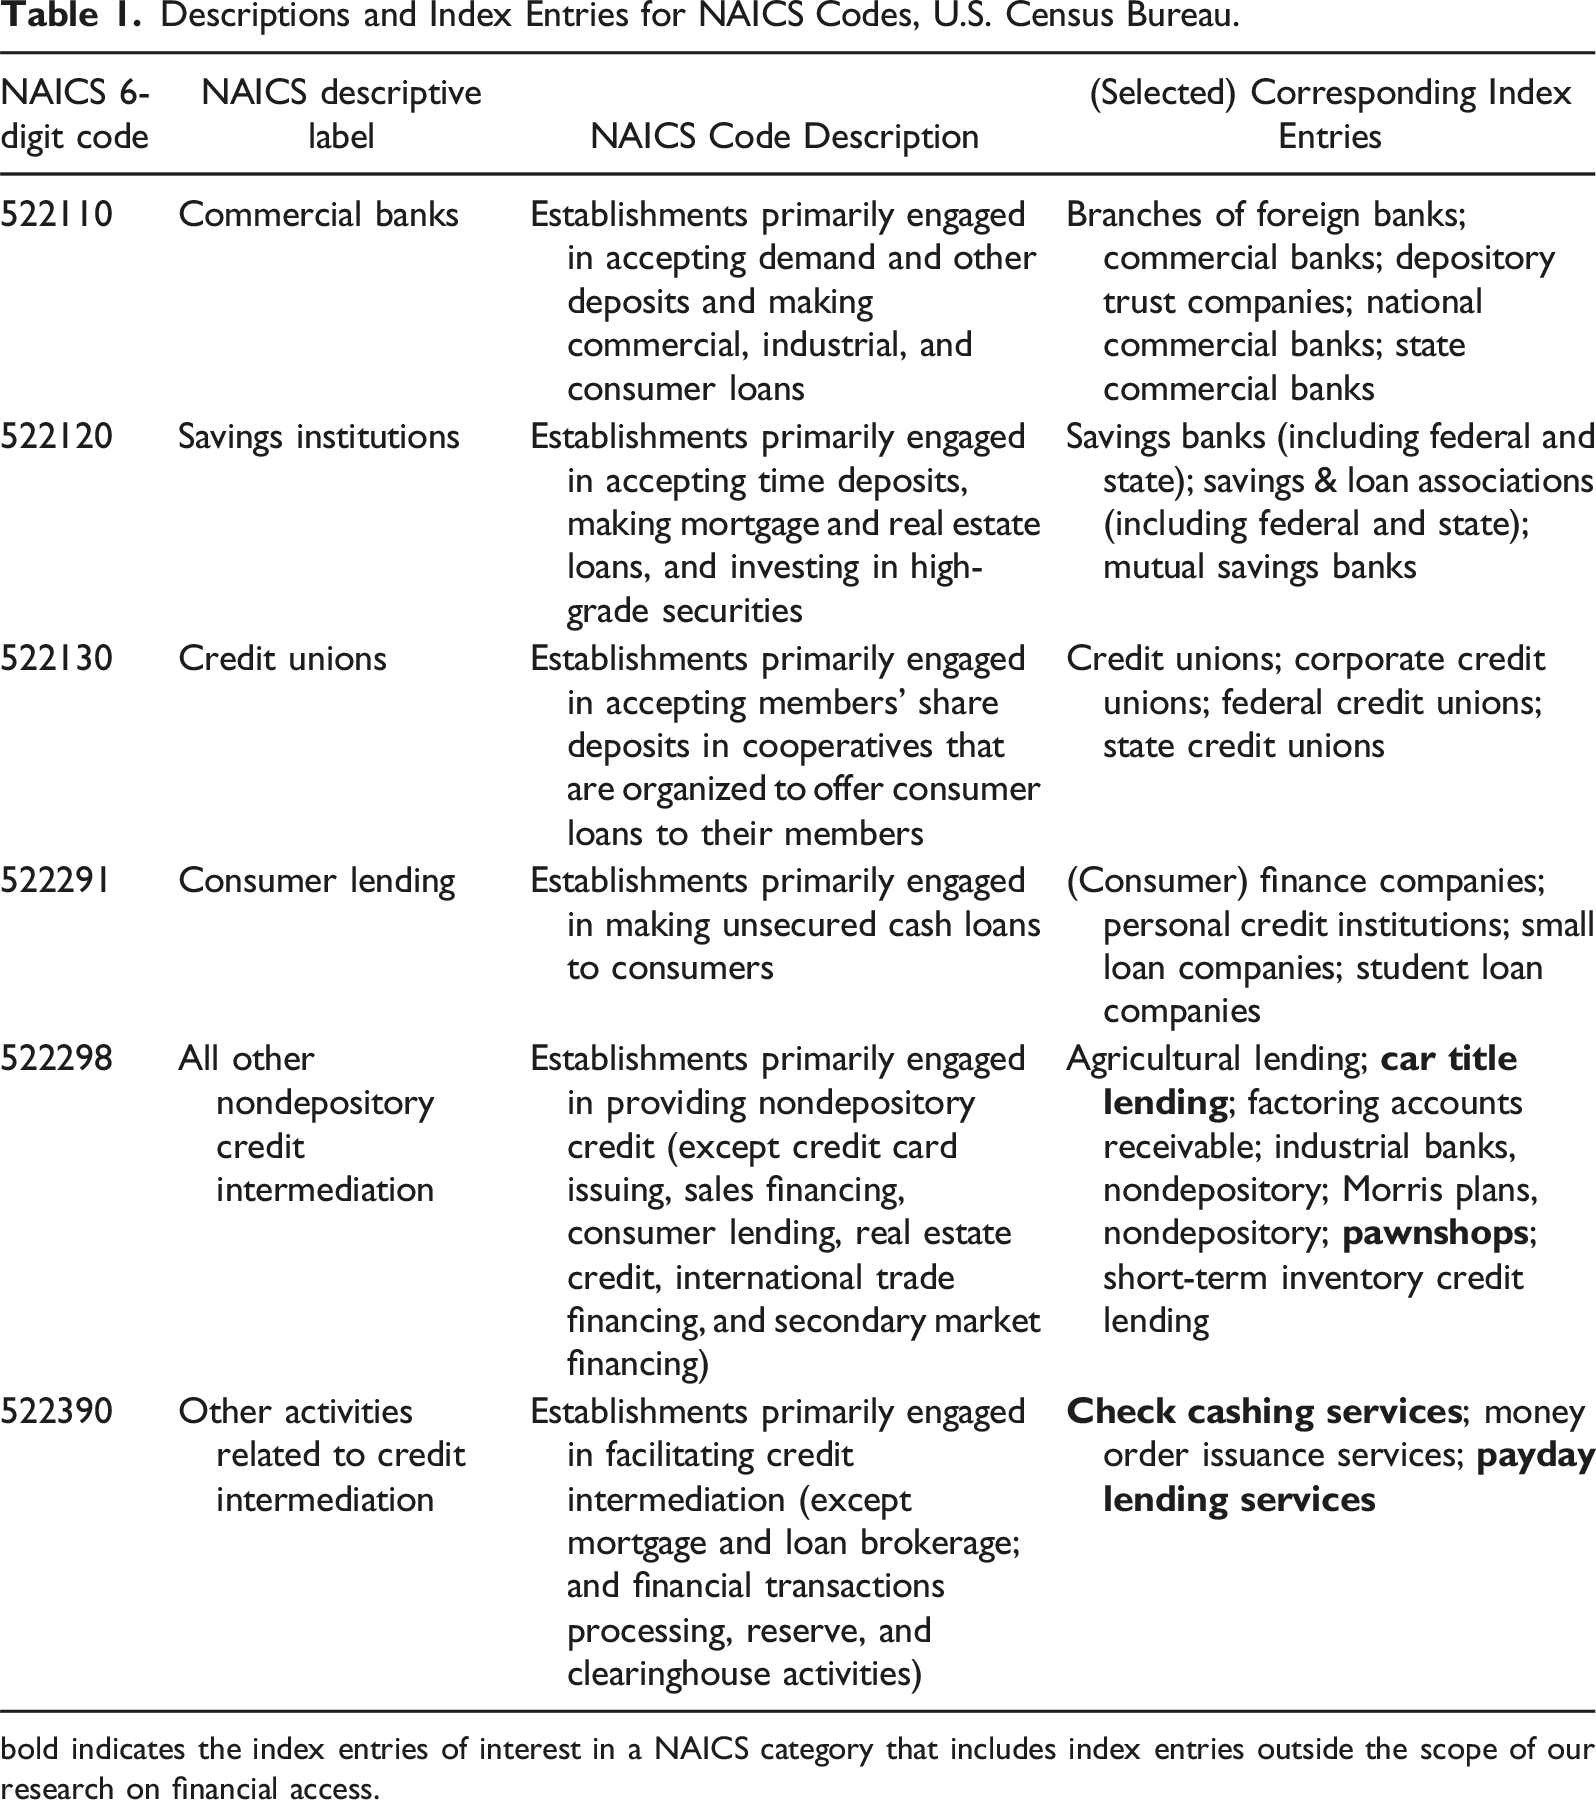
bold indicates the index entries of interest in a NAICS category that includes index entries outside the scope of our research on financial access.
The bottom three categories on Table 1 are nondepository financial institutions that offer short-term loans and limited types of credit services (U.S. Census Bureau, 2022d). The index entries indicate that these three categories subsume finer classifications of AFIs, including payday lenders, check cashers, car title lenders, and pawnshops, which we seek to extract into separate categories. Payday lenders offer immediate, short-term loans based on proof of income, typically without a credit check, for a high fee. Check cashers cash checks for a fee, typically without requiring a bank account. Car title lenders do not provide loans for purchasing a car; instead, they provide short-term loans that are secured by the borrower’s car title. Pawnshops provide short-term loans secured with personal high-value items, such as jewelry.
Our objective for the present study was to assess how well SafeGraph’s algorithm classified its establishment data, by independently classifying the 202,750 establishments ourselves and comparing results. 3 Our process was as follows:
Step 1: Assign Based on Descriptive Keywords
First, we classified each establishment based on keyword searching. Based on the assumption that, for many financial establishments, the firm’s name (labeled “location name” in the SafeGraph dataset) will indicate its primary activity, we searched for specific keywords in the list of names and automatically assigned establishments to categories when the name included the keyword. For example, based on this process, we automatically assigned “Alliance Credit Union” to the category “credit union.” To develop a preliminary list of keywords, we relied on our knowledge of the domain, including what we understood to be the appropriate keywords based on terms from the corresponding NAICS index entries from the U.S. Census Bureau (see Table 1). For this first step, we only included the eight keywords for which we had high confidence in their ability to accurately distinguish establishments: “credit union,” “savings bank,” “savings* loan,” “pawn,” “payday,” “car title loan,” “auto title loan,” and “check* cash*.” That is, we had high confidence that a firm with the name “payday” in its title was not a credit union, and vice versa. This approach helped identify first-order problems in SafeGraph’s algorithm—for example, whether it wrongly classified “Alliant Credit Union” as a “commercial bank” (522110) instead of a “credit union” (522130).
Step 2: Assign Based on Company Information
Companies With the Largest Number of Branches in the Data, by Number of Branches.
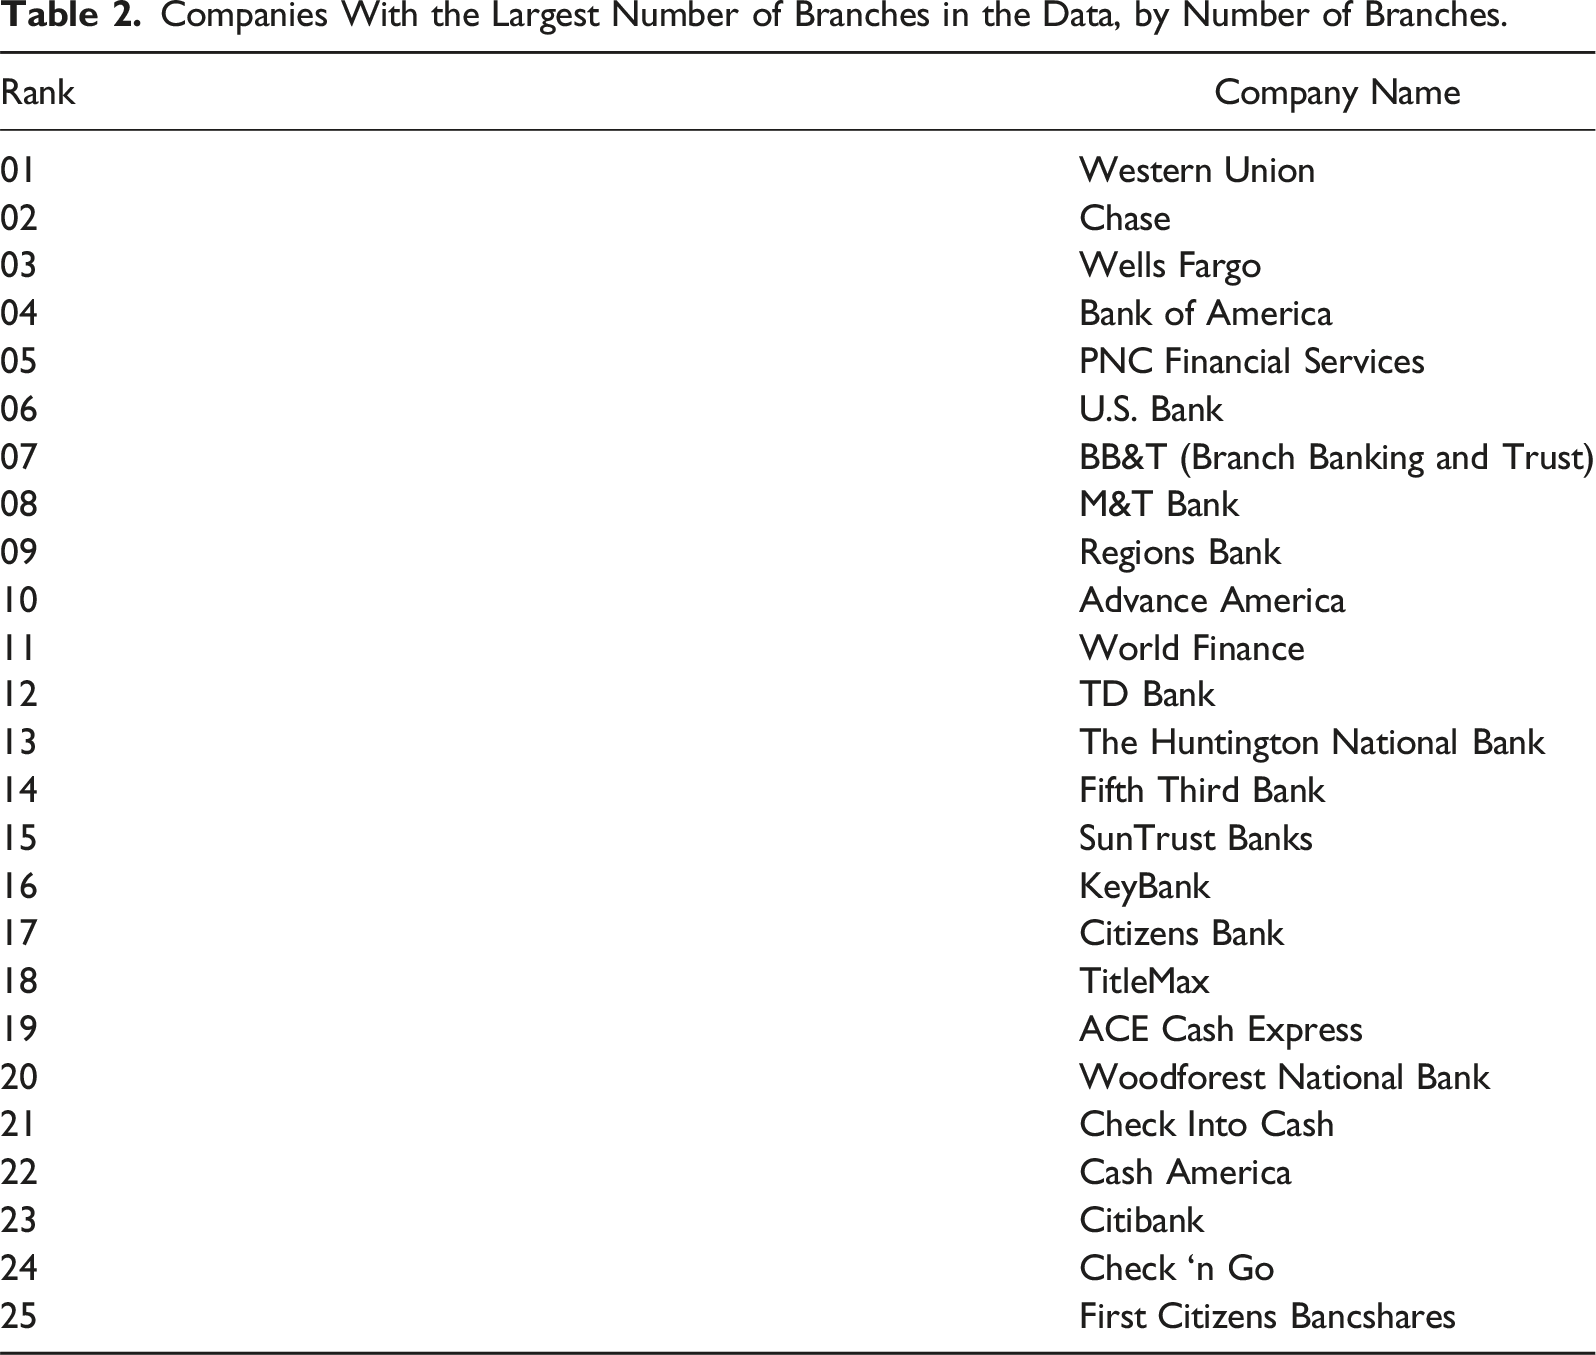
Matching based on company information was not always straightforward, for several reasons. First, SafeGraph records location names as they appear in the storefronts and online sources it uses to scrape POI data, without necessarily aligning them with the official company name. Thus, many establishments that were part of the same company were listed under different names on the dataset. An egregious example is the large check cashing company, Community Financial Services Center, which appeared in the dataset not only under that name but also under “CFSC All Checks Cashed,” “CFSC Check Cashing,” and many others, for a total of 134 unique names.
Second, at times, different and unrelated companies operate under the same name. 5 For example, the 96 establishments operating under the name “Southern Bank” seemed to belong to three different banks, judging from the different Web site domain names and interfaces. While the Southern Banks example does not affect our classification—they are all banks—in multiple other cases the alternative companies represented distinct industry categories, such as credit reporting companies versus loan agencies or payday lenders versus mortgage lenders. The problem was particularly common among smaller AFI companies and independent, family-owned stores.
To address these issues, we conducted multiple online searches for selected establishments operating under the same name to verify whether they belonged to the presumed company, and adjusted our classifications accordingly.
While doing so, we also performed a small-scale (non-systematic) check of our Step 1 process. We searched online for several of the companies with descriptive names we had already classified during Step 1, and compared the classification to that obtained manually. We encountered almost no classification mismatches for company names that included the small, highly specific set of descriptive keywords we used in Step 1. However, online searches based on company names often provided information on additional financial services the company offered. For example, some companies that used the term “check cashing” in their name also provided payday loans. Thus, we often combined the two methods to get a fuller account of the financial services these companies offer, which was important for our substantive research on financial access.
Step 3: Assign Based on Query Expansion Mining
Top Discriminant and Non-Discriminant Keywords Identified Through Query Expansion Mining (With Associated NAICS Codes in Parenthesis).
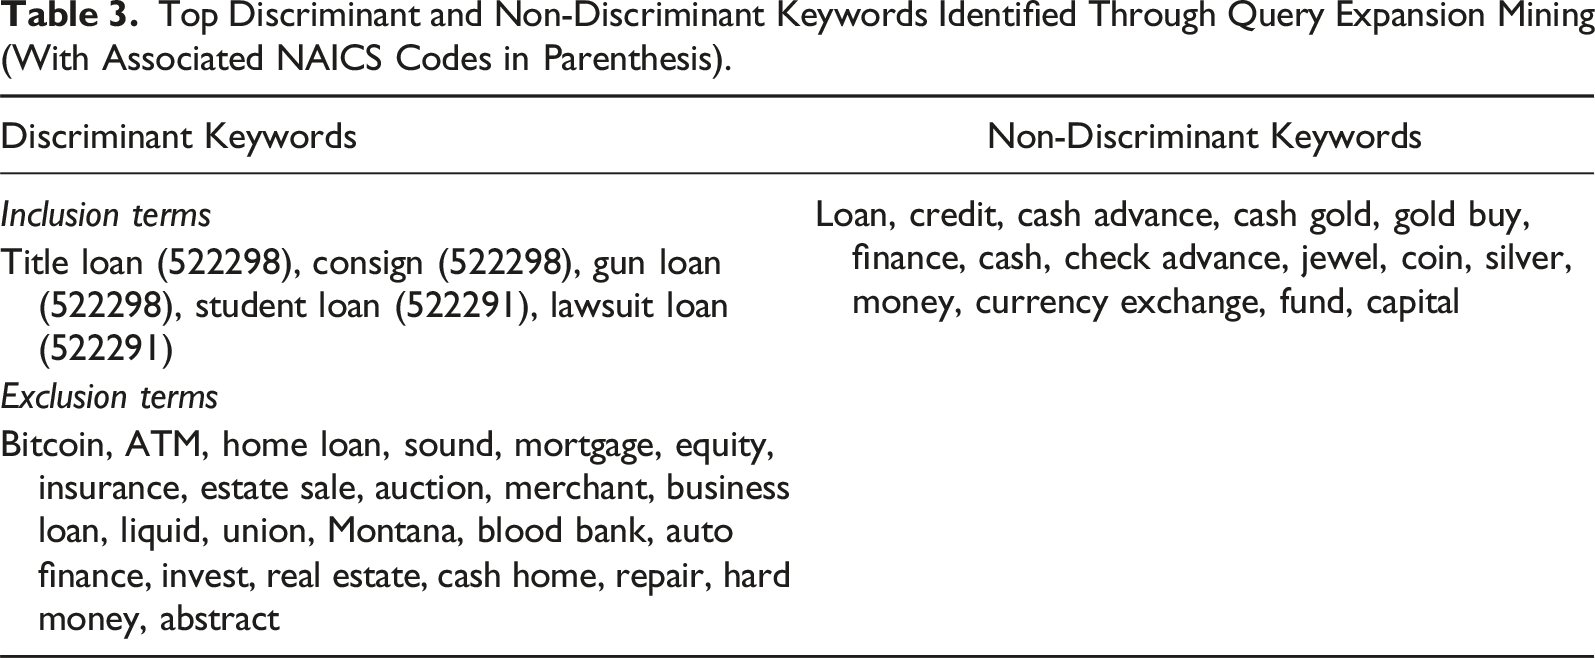
We updated our keywords iteratively, adding new high-confidence terms or dropping terms that either produced errors or proved more ambiguous than we originally believed, until we could not identify new useful keywords. The iterative process required deep qualitative probing and the deepening of domain expertise. For example, we first learned that the term “cash advance” is often used in the AFI industry to refer to or advertise payday loans, such that firms with that title were often payday lenders. However, we soon noticed that establishments operating in U.S. states where payday lending is explicitly prohibited were also using the term in their location name. Some of these were merely legacy institution names. But further investigation suggested that an establishment may also use “cash advance” in its title when it offers other types of short-term, unsecured cash loans, which reduced our confidence that the term consistently classified a payday lender. 7 Thus, for such ambiguous terms, we searched for each establishment’s services online and classified them on a case-by-case basis.
Step 4: Assign Based on One-By-One Manual Search
Step 3 allowed us to classify an additional ∼5% of the data. The ∼15% of establishments that remained unclassified had either ambiguous or unique terms in their location names, or were branches of small companies (<6 stores). Therefore, we searched online for information on each, one by one, on the specific services the establishment provided, and classified it on that basis.
To assure the quality of our coding, for each online search, we consulted multiple sources. We relied primarily on company websites to identify or confirm the types of services offered by the establishment. Unfortunately, many establishments did not have an active Web site. Less often, websites were ambiguous about the kind of financial products provided. Payday lending, in particular, was at times difficult to evaluate. Because the practice has received extensive negative coverage and is often described as “predatory” by scholars and news media, payday lenders have an incentive to be more circumspect about their services. Many marketed their products with other, more innocuous names, such as “unsecured loans,” “signature loans,” “bad credit loans,” “short-term loans,” “cash advances,” and more. As before, we erred on the side of caution and classified establishments as payday lenders, check cashers, car title lenders, and pawnshops only when the services were explicitly mentioned, or when we could infer such service provision from the examination of fine prints, terms and conditions of the services, and APR specifications. Otherwise, we classified establishments that offered unspecified short-term, small, or personal loans, excluding auto financing, 8 generically as AFIs. (For this and other reasons, the total number of AFIs we present below will differ from the sum of establishments across all four AFI categories.) Still, such ambiguity was less common, since non-payday lenders often described their loan products as “traditional installment loans” and specified their APR rates or rollover policies, information that allows us to classify them as consumer lenders (522291). In the absence of a business Web site or a Facebook page, we consulted Google Maps, Yelp, MapQuest, and the online version of Yellow Pages. After company websites, the second most informative source was storefront images, often with accompanying Google Maps entries, since owners often use them to advertise their primary activities to the physical neighborhood they serve.
Step 5: Check Reliability
We checked the reliability of our procedures in two ways, one informal and one formal.
Preliminary check: First, we conducted field observations (Grigoropoulou & Small, 2022). We know that SafeGraph uses online sources with publicly open APIs, such as Yelp, MapQuest, and Yellow Pages, to collect and likely train the data we obtained (Bonack, 2021). Online sources were also the foundation of our main procedures. To minimize the risk of a “feedback loop”—relying on the same online information to confirm our classification decisions that our data provider used to produce theirs—we searched for specific establishments offline, doing fieldwork in New York City for a week in late November and early December 2021. 9 We selected a random sample of 243 establishments located in NYC, mainly in Manhattan and Brooklyn, extracting them from our corresponding Patterns data, which we had obtained a few weeks earlier than our Core Places data. We classified the establishments using the strategies we described above. Then, we either visited or telephoned each of the purported locations to validate our classifications and reclassify when necessary.
Final check: Second, we selected a random sample of 3050 establishments, stratified by NAICS category, for independent classification. A research assistant not involved in Steps 1–4 was assigned to classify the establishments independently and following a more stringent procedure. 10 We first trained the research assistant by providing (a) descriptions of the six NAICS categories we examined; (b) definitions of banks, credit unions, payday loans, check cashing, car title lending, and pawning, as well as related concepts, such as “unsecured loans” and “collaterals,”; and (c) a coding scheme. We then asked the research assistant to classify the establishments based on a more painstaking process: by searching online for each individual establishment in the sample and assigning a code based on the exact services it offered, rather than automatically coding by keyword (as we had done in Steps 1–3). Thus, if a large company provided different services in different establishments (e.g., if it provided payday loans in some locations but not others), then the research assistant’s process would ensure that the different establishments by the same company where accurately coded under different financial services. After the research assistant’s coding was completed, we compared those results to ours by calculating an inter-coder reliability metric, ICR = total agreements/total establishments, for each establishment type. We confirmed that our classification approach was highly reliable, with ICR ranging from 94.2% for auto title lenders to 99.9% for credit unions. (For full results, see Appendix Table A.2. The Appendix also contains results comparing estimates of classification agreement across each of the methods in Steps 1–4.)
Step 6: Assign to a Primary NAICS Code
After confirming the reliability of our classification approach, we performed the last step of our procedure: deciding on a primary NAICS code. This step was necessary for three reasons. First, as noted earlier, our study on financial access did not require differentiation between commercial banks and savings institutions. In Steps 1–4, we coded all banks that accept deposits as “banks.” In Step 6, we separated these establishments to their respective NAICS codes, “Commercial banks” (522110) and “Savings institutions” (522120). Second, check cashing, payday lending, and car title lending are not mutually exclusive categories; many AFIs provide more than one of these financial services. Thus, an establishment that offers payday lending and car title lending could be classified as both 522390 and 522298. However, SafeGraph’s algorithm assigns establishments to a single NAICS category based on their presumed primary activity, regardless of the other services they may provide. Third, some of the NAICS codes include services beyond those of interest. For example, 522298, includes agricultural lending. We needed to account for these establishments to get a comprehensive estimate of the reliability of these six 6-digit NAICS categories provided by SafeGraph. Thus, as a final step, we assigned a single primary NAICS code to all 202,750 establishments on our dataset based on the likely primary activity of the establishment (instead of assigning codes based on each financial service).
For these assignments, we followed rules as conservative as those of our initial classification, favoring (1) clear industry markers, such as “savings bank,” “car title loan,” “check* cash*,” and “payday loan”, in the location name, and (2) information on company profiles, Web site descriptions, and selected government documents, such as the U.S. Securities and Exchange Commission (SEC) filings or reports from the Consumer Financial Protection Bureau (CFPB). For savings institutions, we also used an up-to-date, publicly available list of federal savings associations from the U.S. Office of the Comptroller of the Currency (OCC) (2023). As in Steps 1–4, when an establishment’s primary activity was not one of the indexed services in any of the six 6-digit categories of our dataset, we classified it as “Other.”
Figure 1 exhibits a graphical depiction of our classification process. Schematic representation of independent classification procedure.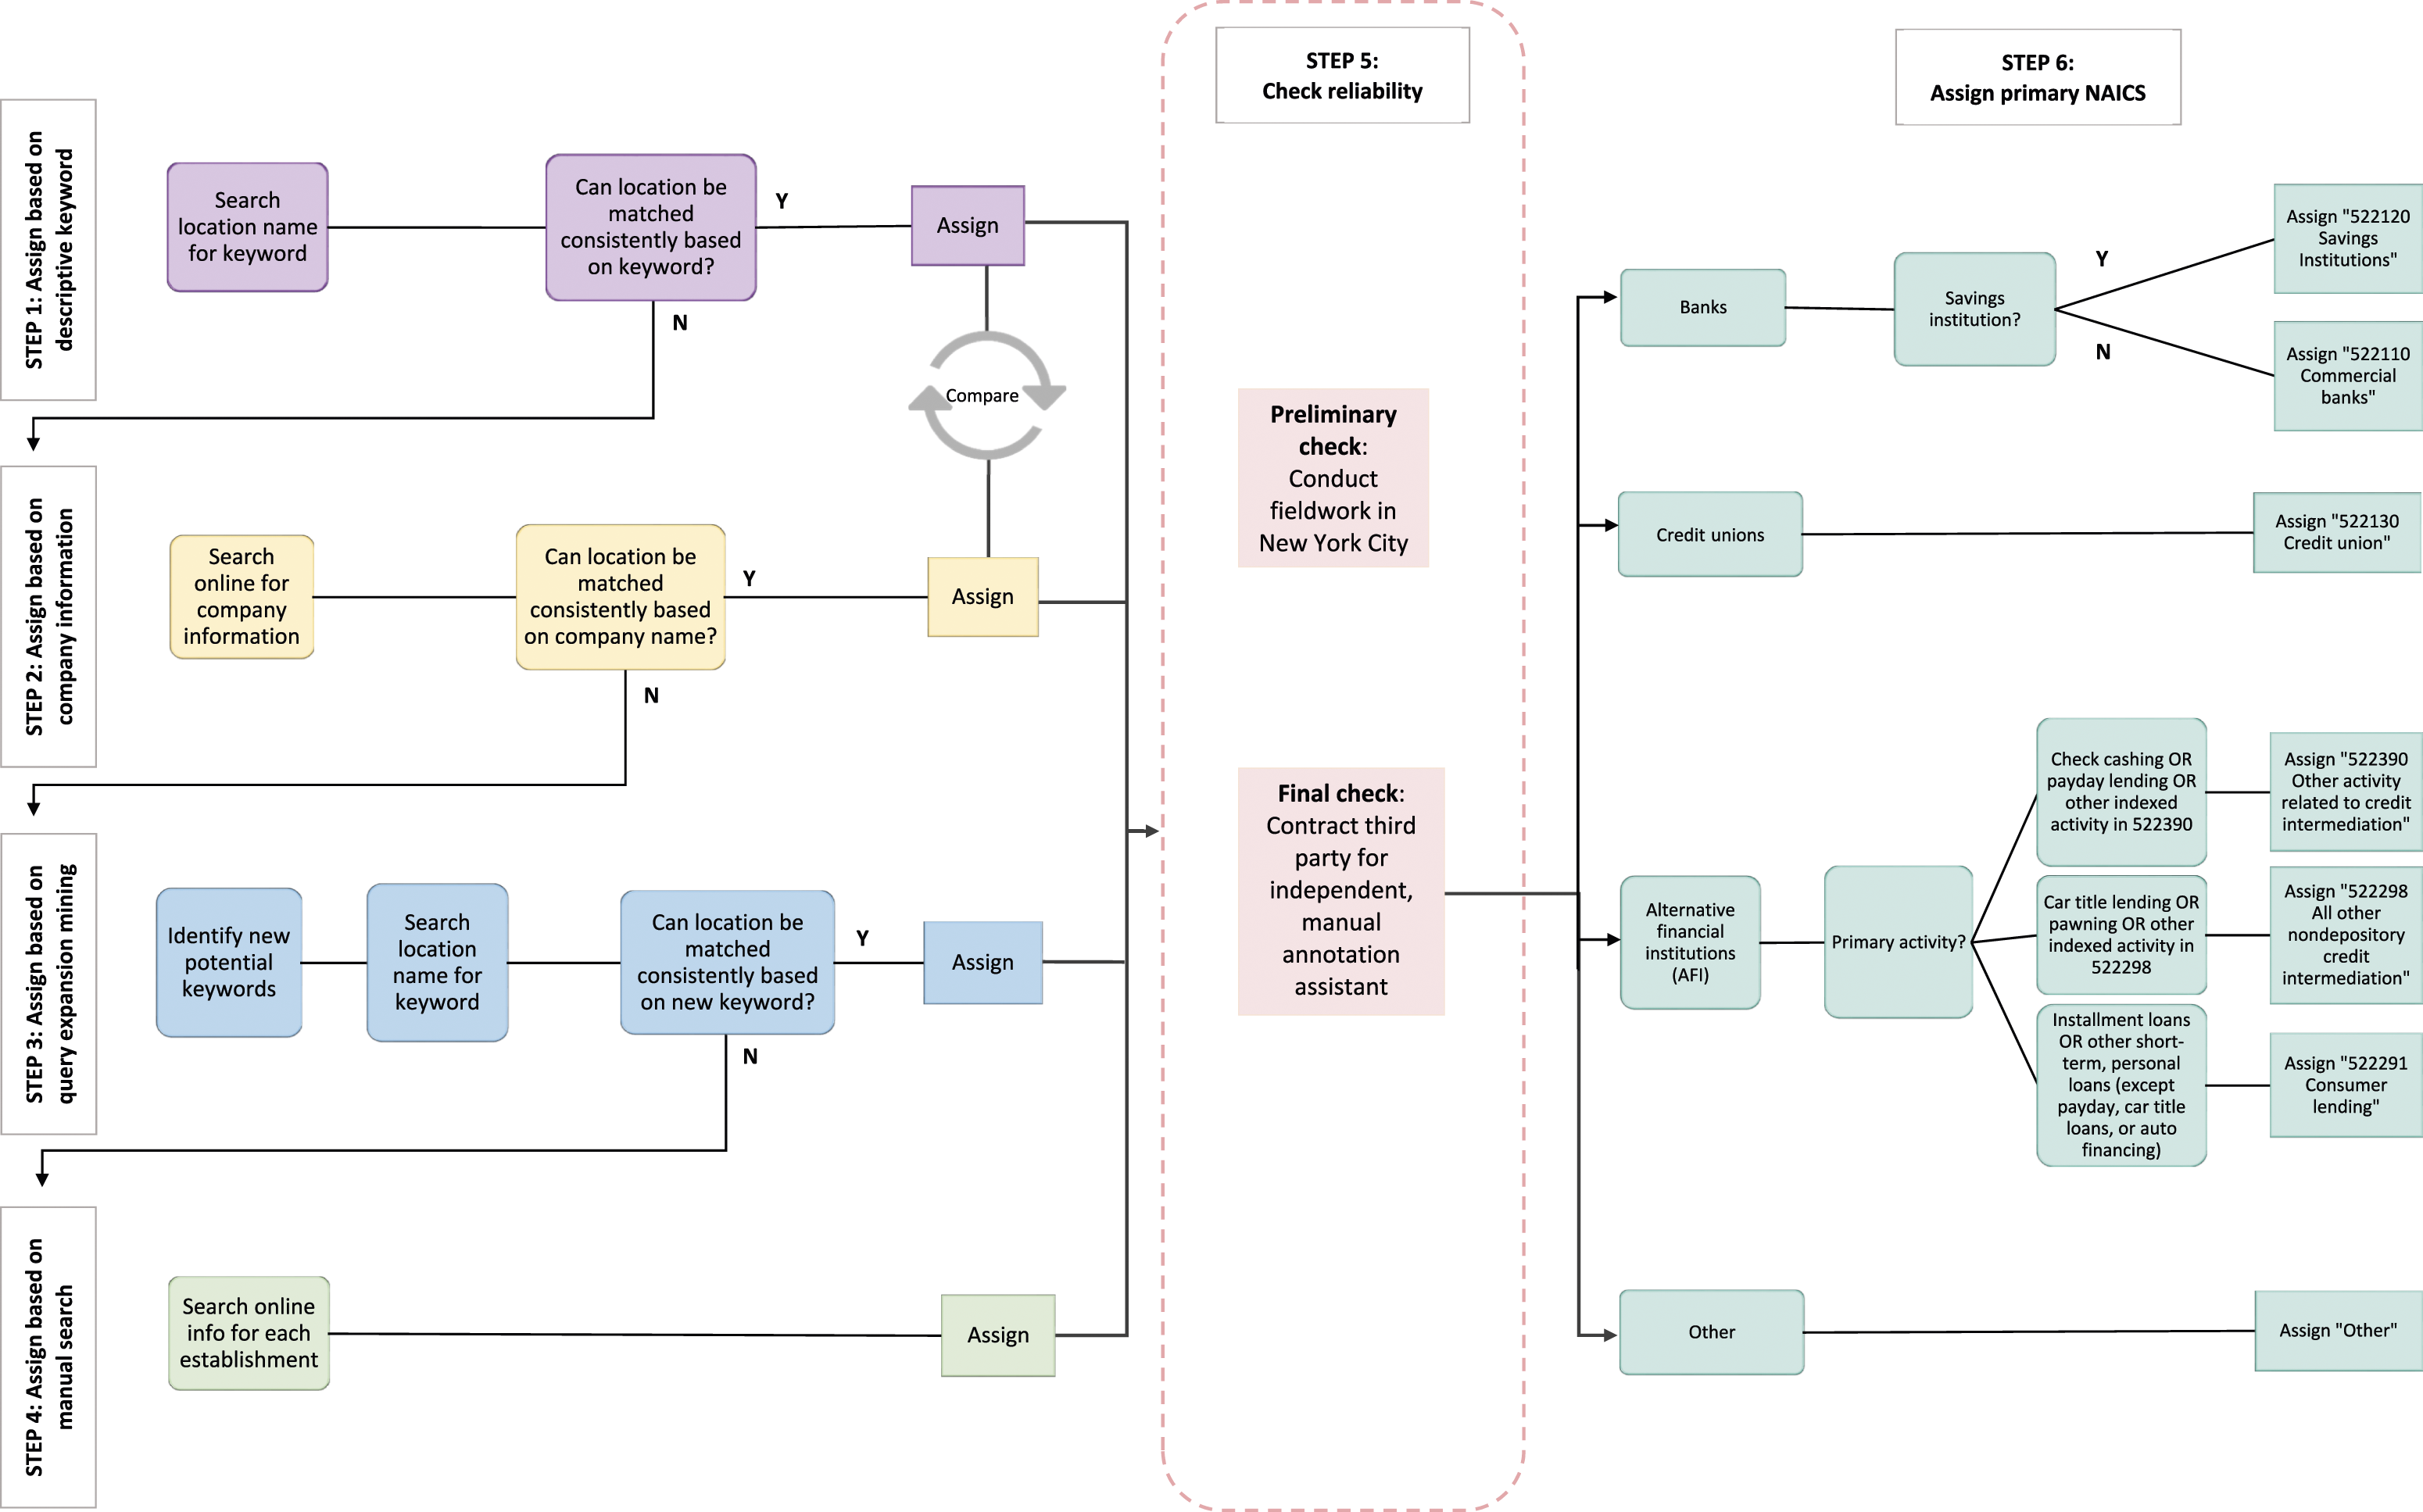
Probing for Data Sourcing Problems
In addition to classification problems, we examined the possibility of duplicate records or overlooked establishment closures. We asked our research assistant to note whether an establishment in the random stratified sample was closed or open. We considered an establishment as closed only when (a) it did not appear in the store locator for a large corporation, (b) when Google Maps reported it as permanently closed, or (c) when Yelp noted that “Yelpers report this location has closed.” Researchers have shown that Google Maps establishment operation data are increasingly likely to be accurate, given the combination of administrative, image-based, and crowdsourced quality control it relies on (Payne, 2021; Small et al., 2021; Zamir & Shah, 2010). Yelp also relies on crowdsourcing. We included a fourth criterion: (d) following SafeGraph Policy, 11 we recorded an establishment as closed when it began operating under a different corporate name, as when a bank is acquired by or merges with another bank.
Finally, we examined the possibility of duplicate records. We used the establishment address in this process. It is possible for more than one establishment to occupy a single geographic location, as when different stores are located in the same multi-story building. However, such duplicates can also result from unidentified closures or ambiguity in the establishment name across the different sources SafeGraph uses to collect the data. To account for potential duplicates, we pulled all records of establishments with identical street address, city, state, and zip code in our dataset. We then randomly sampled every 20th record of the 27,679 duplicate locations we found (approx. 10%), and inspected the corresponding pairs, or occasionally triples, to assess whether they were justifiably listed in the location or if the inclusion of one or more of them was due to errors.
We report all findings regarding classification, closures, and duplicates below.
Results
Coverage of Financial Establishments
Establishment Counts by NAICS Code and Source.
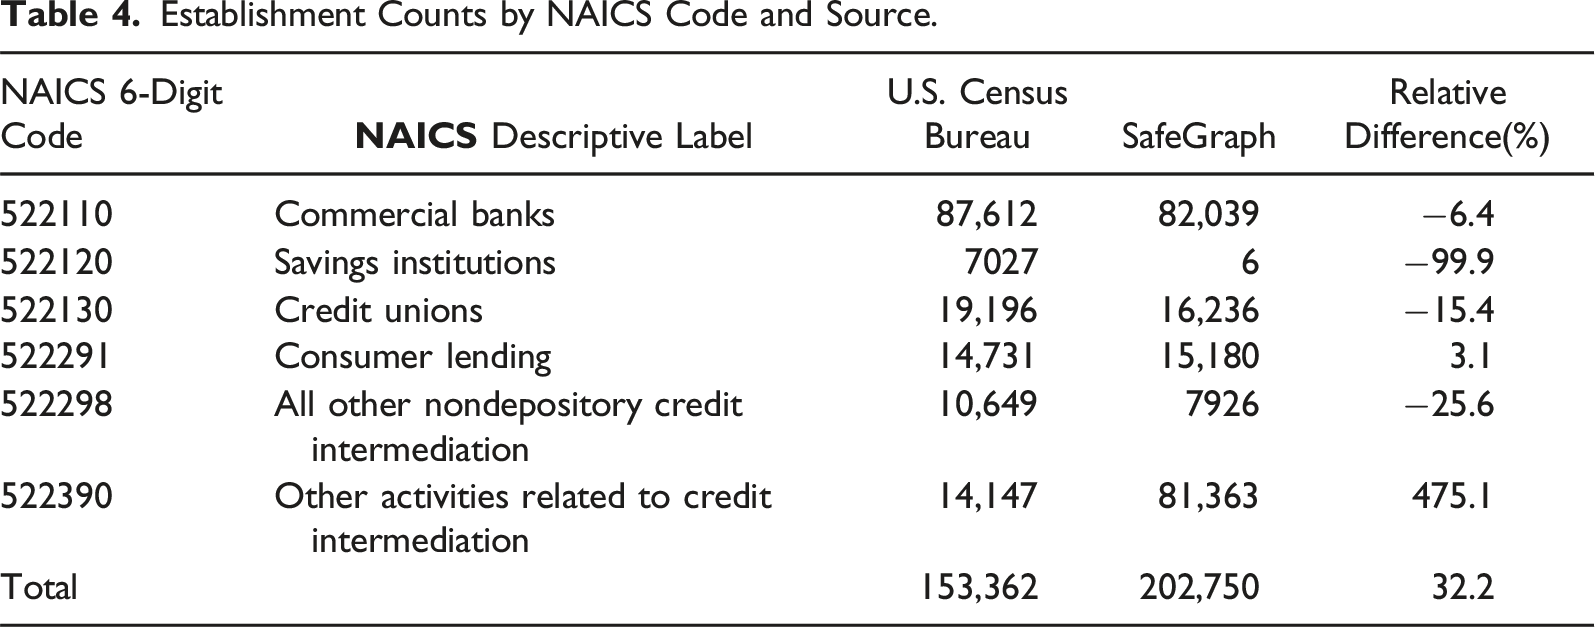
In many cases, the SafeGraph counts match the CBP’s. For example, the company reports 15,180 “consumer lenders,” or only 3.1% more than the CBP. At the other extreme lie “savings institutions,” for which SafeGraph reports substantially lower numbers. It appears that, for every 100 savings institutions that CBP reports, SafeGraph identifies 0.09 establishments, a 99.9% deficit. In theory, the difference could have resulted because the SafeGraph data were produced two years later, and well into the COVID-19 pandemic, which resulted in many establishment closures. However, such patterns are unlikely to have affected savings institutions at rates so dramatically higher than those of other financial establishments. We believe this particular difference is due to the fact that “savings institutions” and “commercial banks” currently offer similar services. However, it may also be due to insufficient attention by the company to the index entries of this NAICS category. 13
SafeGraph also appears to undercount establishments on “all other nondepository credit intermediation,” “credit unions,” and “commercial banks,” by 25.6%, 15.4%, and 6.4%, respectively. We believe these differences may be due to either flaws in the data collection strategy or misclassification to a NAICS category outside the six we examine. For example, some “commercial banks” may have been classified as “investment banks” (523110), even though the latter are nondepository institutions. SafeGraph also specifies that they avoid assigning 6-digit NAICS codes to establishments when they are not very confident of the classification; instead, they only classify these establishments into the hierarchically broader 2-digit or 4-digit NAICS categories (SafeGraph, 2023). Many “credit unions” and “commercial banks” may have been only assigned to the more general, 4-digit NAICS category “Depository credit intermediation” (5221).
In contrast, SafeGraph reports an extraordinary 475.1% more establishments offering “other activities related to credit intermediation” than CBP. We uncovered that this difference is nearly entirely the product of classifying 75,610 stores from a single brand, Western Union, under 522390 14 . This assignment is not entirely implausible. Western Union stores offer “money transmission services,” which are indexed in 522390 (see Table 1). However, we believe those establishments should have been classified as “Financial transactions processing, reserve, and clearinghouse activities” (522320) because the NAICS code indicates “electronic funds transfer services” and “electronic financial payment services” as descriptors, and Western Union describes itself as “a leader in global money movement and payment services” in a letter commenting the amendment of the Electronic Fund Transfer Act (EFTA) (Western Union, 2011). 15
Classification Assessment
To probe further, we assess whether SafeGraph classified each establishment into what we determined to be the appropriate, primary NAICS code based on our classification procedures, which assumed a strict reading of the descriptors of the NAICS classification system (U.S. Census Bureau, 2022d). We calculate two metrics of reliability of SafeGraph’s classification in the six 6-digit categories we examined. First, we assess SafeGraph’s probability of detection 16 by calculating the proportion of agreed establishments among the number we identified: total agreements/total establishments assigned by authors. Second, we assess of precision 17 , or how many of the establishments SafeGraph has classified in a given category we can confirm as members of that category: total agreements/total establishments assigned by SafeGraph.
Estimates of Classification Agreement Between SafeGraph and Authors.
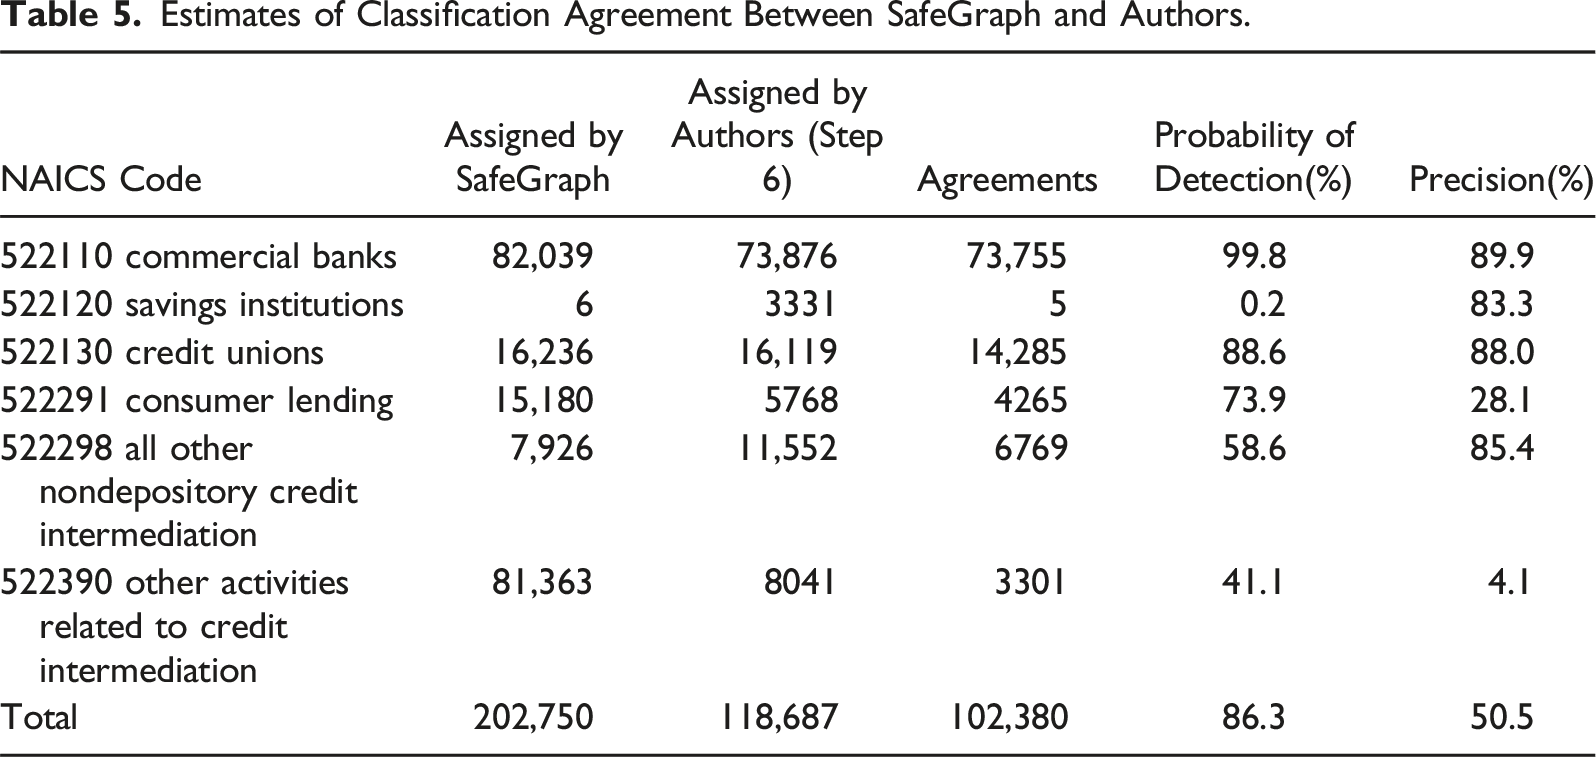
The fourth column suggests that a researcher using the data would detect almost all (99.8%) banks, and a vast majority of credit unions (88.6%), while missing a large portion, or a majority, among the other four industry categories. Still, even the relatively small gap for credit unions (11.6%) is particularly surprising, since 1664 of the 1834 credit unions SafeGraph had assigned to something other than the expected code had the words “credit union,” or an abbreviation, in their names. The lowest probability of detection was for savings institutions (0.2%); nearly all of them were instead classified as commercial banks by SafeGraph.
The fifth column shows that, with respect to precision, results vary. For some categories, the results are too unreliable for research. However, even NAICS categories with higher precision rates could be improved considerably with proper attention to types of establishments that would fit best under other categories. For example, 12% of the establishments classified by SafeGraph in 522130 were not credit unions. In fact, 6.6% of them were bitcoin selling points (523130, instead), and at least 1.0% were credit repair services (which should have been assigned into 541990).
With the exception of savings institutions, the classification inconsistencies were most pronounced among the three NAICS codes associated with AFIs. Given their importance to our empirical study, we further inspected how the classification inconsistencies would affect the analysis of check cashing, payday lending, and other AFI services. As noted earlier, many establishments provide more than one of these services. For this part of the assessment, each establishment is classified in every category of service we determined it offers, but only to a single NAICS code based on presumed primary activity. For example, if an establishment offers both payday lending and car title lending, we classify it as providing both services, but assign it only to either 522390 or 522298 based on its primary activity.
Assignment to NAICS Code by Primary Service, for AFIs Offering One or More Services, by SafeGraph and Authors (Steps 1–4).
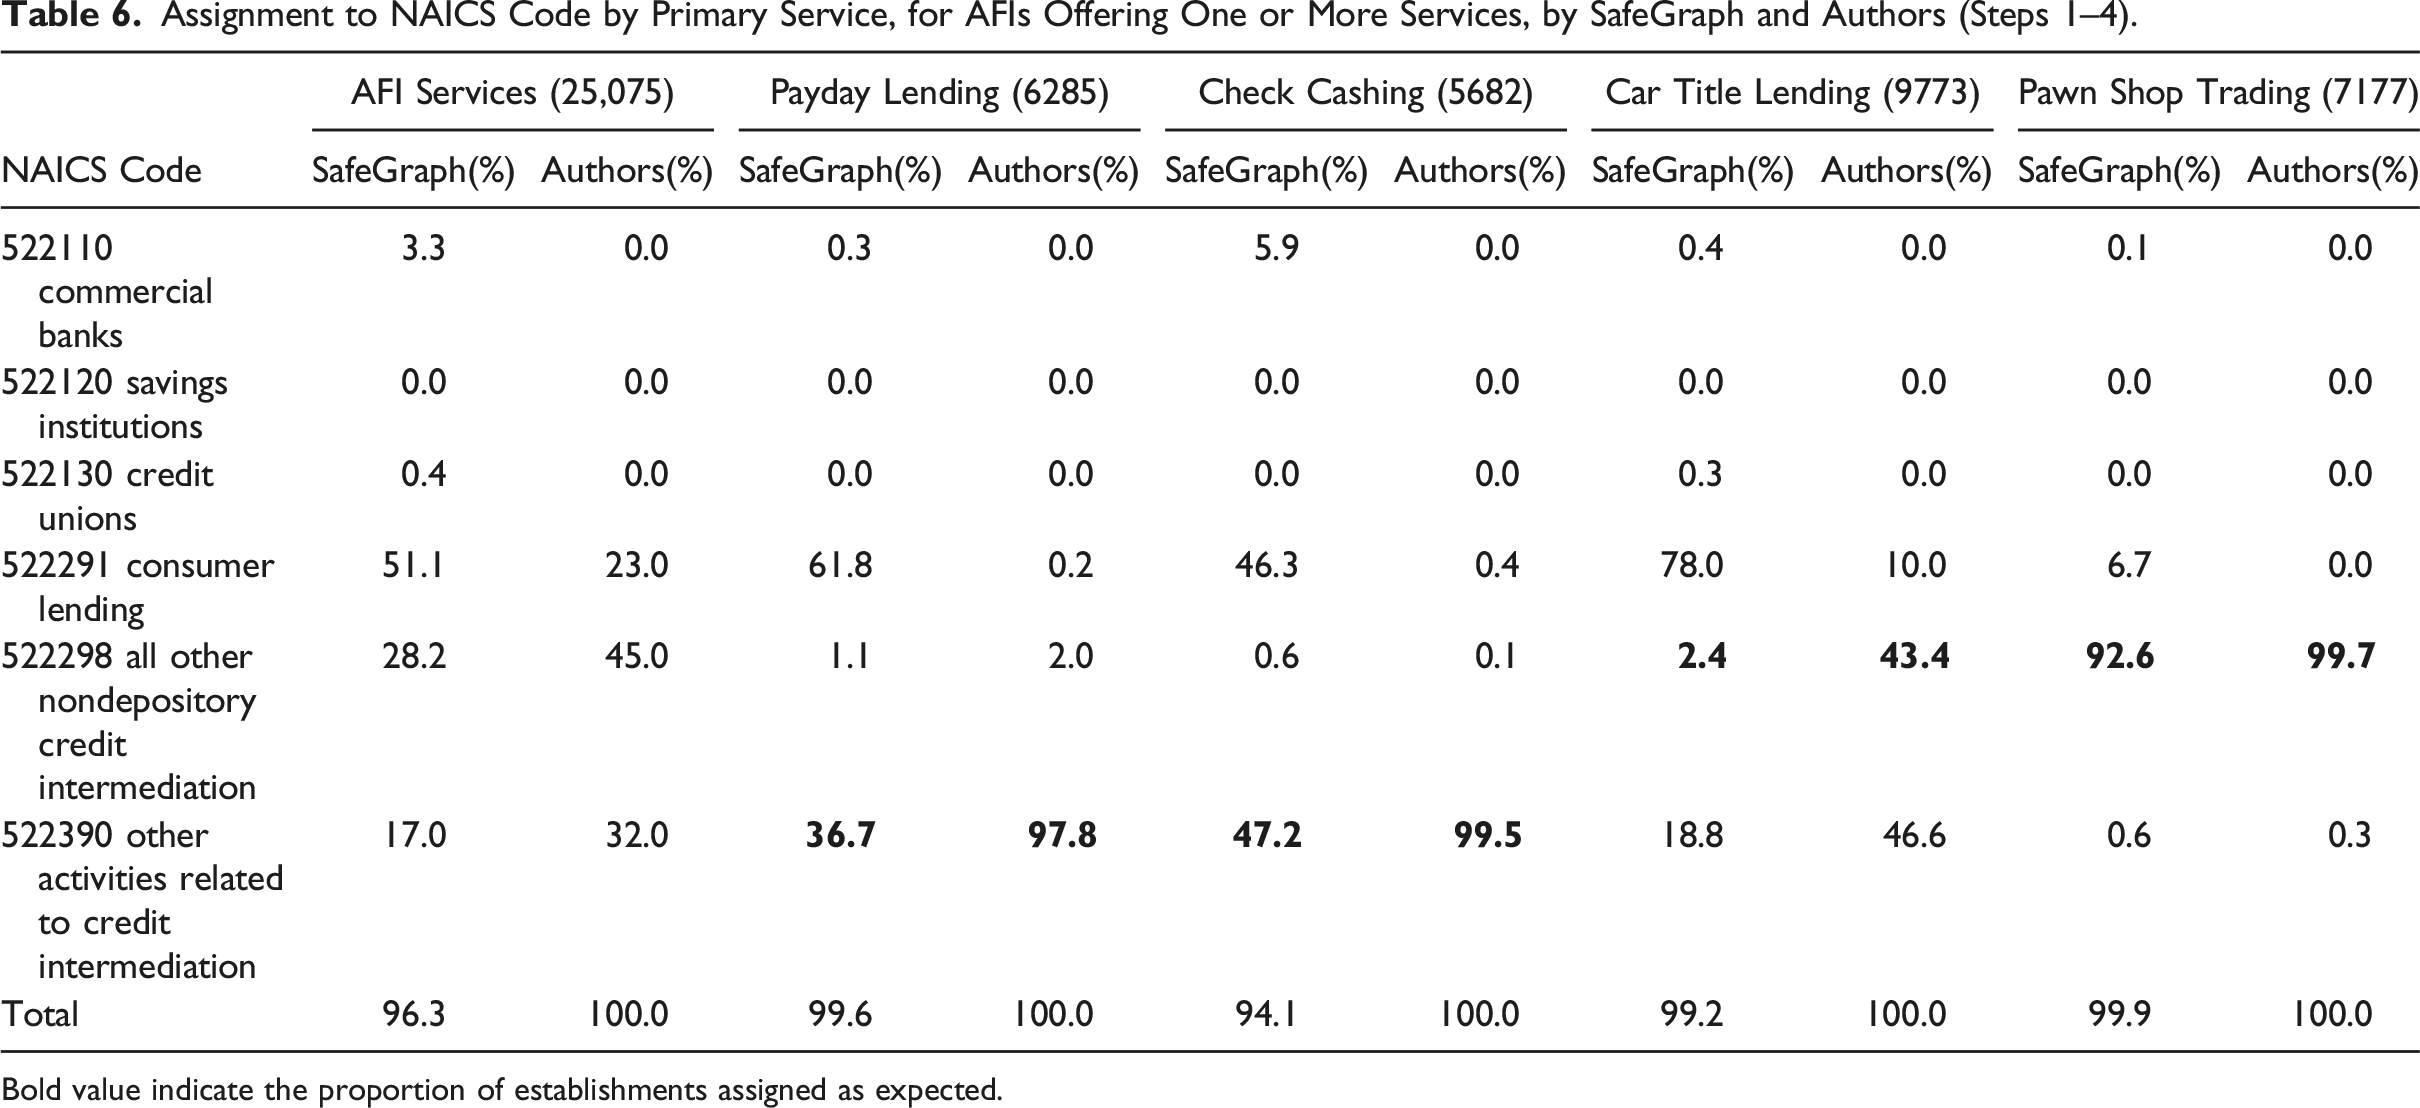
Bold value indicate the proportion of establishments assigned as expected.
The situation is more complicated for car title lenders. The eighth column shows that 43.4% of establishments offering car title loans are primarily car title lenders (522298). Another 46.6% of them have payday lending and/or check cashing as their primary activity, and, thus should be classified in 522390 “other activities related to credit intermediation.” Nevertheless, SafeGraph classifies only 2.4% and 18.8% of car title lenders in these in these two NAICS categories, respectively (seventh column). It appears that the SafeGraph algorithm favors the assignment of alternative financial institutions, such as payday lenders, check cashing stores, and car title lenders, into “Consumer lending” (522291).
Data Sourcing Problems
Proportion of Financial Establishments Reported as Open by SafeGraph Places That We Documented to be Permanently Closed, by NAICS Category, With Confidence Intervals. Stratified Random Sample of Establishments.
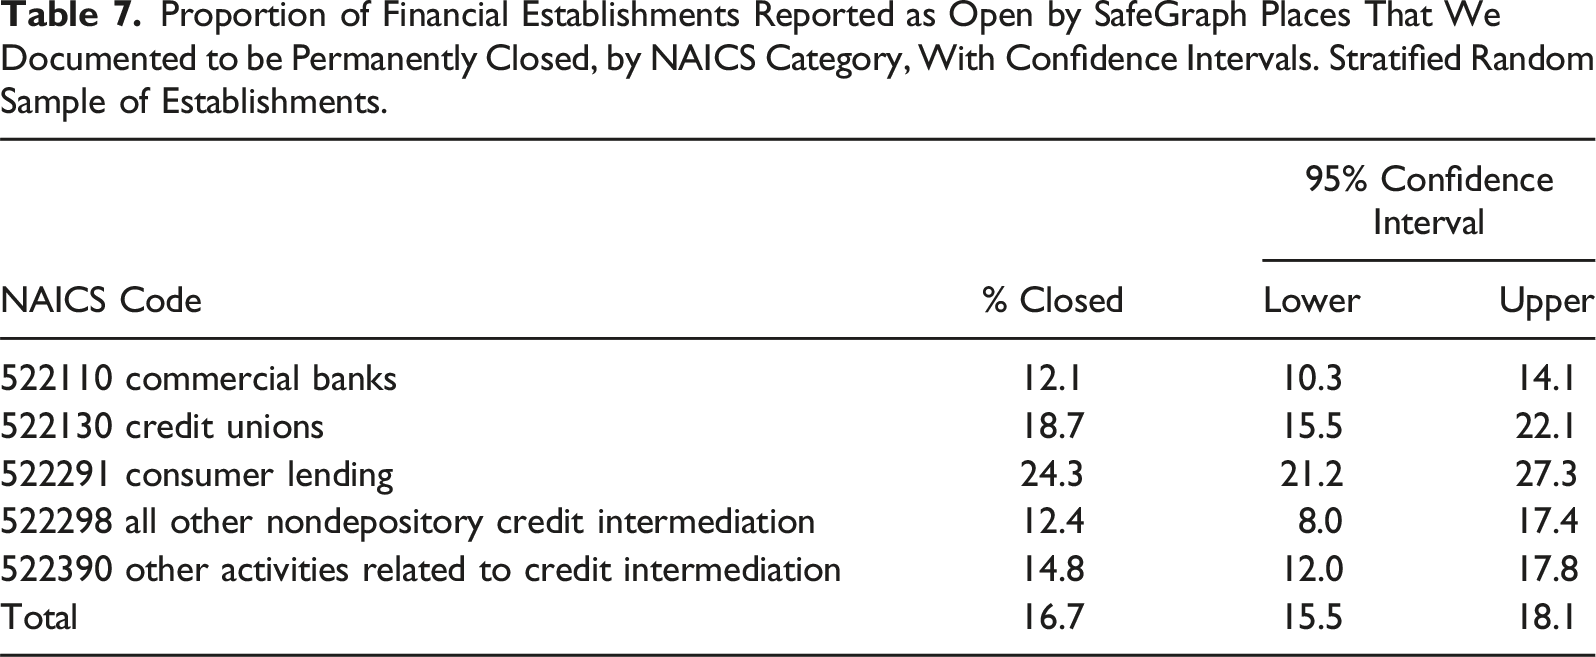
The first was unidentified closures, wherein one establishment had closed and another one had opened at the same location. Online sources such as Yelp and Yellow Pages update their records with openings far faster than they do with closures. And even after being notified that an establishment has closed, platforms may retain the record for an unspecified period. We encountered records for establishments that had been closed as many as seven years. Often, unidentified closures were the product of a company merger or acquisition. For example, though “M & I Bank” merged with “BMO Harris” in 2011, one location had both establishments listed as active. We found 25 company-wide mergers responsible for duplicates, 22 of which took place between 1998 and 2019. These affected the listing of 12.8% of duplicate establishments in our data.
The second factor was name ambiguity. At times, different online sources listed a single establishment under slightly different names, such as “Hancock and Whitney Bank” versus “Hancock Whitney Bank.” When the establishments are larger chains, the error appears systematically; for example, “Hancock Whitney Bank” appears in 178 locations as a duplicate. Similar ambiguity results from spelling errors, or the use of abbreviations instead of the full name of the establishment.
The third factor was that SafeGraph often failed to consider that certain establishments offer Western Union services on their premises, instead of Western Union as a separate establishment. Thus, for many “Regions Bank” branches in our data, SafeGraph lists a Western Union establishment in the same location. For some analyses, it will be useful to know that certain establishments offer additional services; however, additional services do not actually constitute a separate establishment. This third factor accounted for 36.5% of the duplicates. 21
Discussion
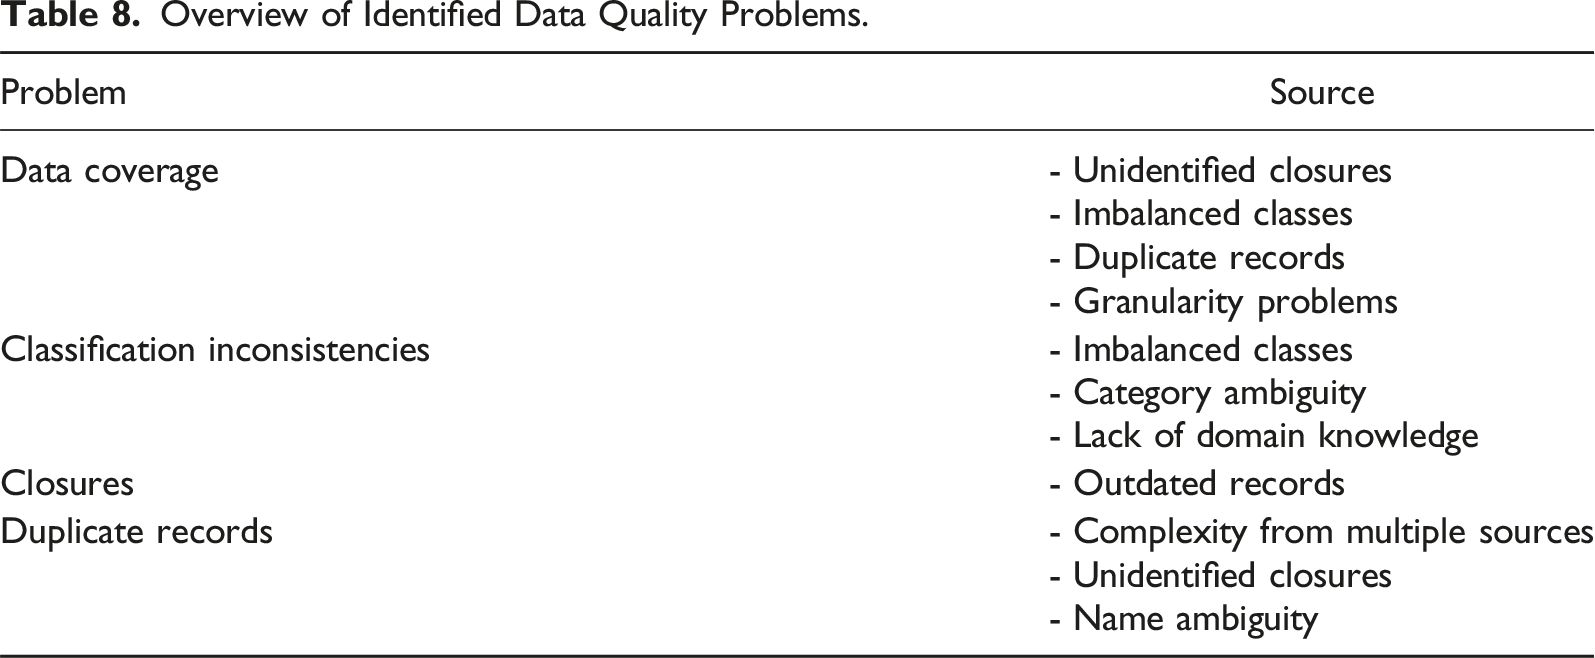
Our study reveals extensive and systematic problems in the classification of large-scale location and human mobility data in one commonly used dataset. First, SafeGraph’s reports of the total number of establishments were often inconsistent with those from the U.S. Census. Some of these discrepancies resulted from challenges in determining the most suitable level of granularity for the data. This challenge occurred either because SafeGraph hesitated to assign 6-digit NAICS codes to establishments when they lacked sufficient confidence in the accuracy of the classification or because it assigned 6-digit NAICS codes when broader 2-digit or 4-digit codes would have been more appropriate given limits in the available information for these establishments. Other discrepancies resulted from the issues in the data sourcing process, such as missed unidentified closures and duplicate records. Second, we found that the classification problems were not randomly distributed across categories; instead, they were more likely to affect AFIs, in part because several of these establishments offer multiple financial services. Still, SafeGraph often failed to classify establishments into what would seem the most appropriate NAICS code based on primary activity, as when establishments identified themselves as “car title lenders” or “credit unions” in their name. Thus, we believe a major reason the data had classification problems is the absence of sufficient domain expertise in the production or evaluation of the algorithm.
We also found that some of the sources used by SafeGraph may not be fully reliable with respect to closures, in part because they often retain traces of establishments long after closure. It is possible the changes following COVID-19 were particularly harmful to this form of data quality; however, we also presented evidence that unidentified closures included establishments closed many years, not just months, before early 2022. In addition, we found that the approach to sourcing may be a double-edged sword. While extracting data from multiple web sources produces wider data coverage, it also increases data complexity, which, in turn, tends to magnify data quality errors (Becker et al., 2015). Here, it resulted in a considerable number of duplicate records due to name ambiguity, spelling errors, and abbreviations.
Overview of Identified Data Quality Problems.
Limitations and Future Research
Our study has important limitations. We conducted our classification analysis in only six 6-digit NAICS categories out of nearly 1,000, given that these were relevant for the scope of our research in racial inequality in access to financial institutions in the United States. We do not know whether other NAICS industries would exhibit the problems we identify to a lesser or a greater extent. Still, given what we uncovered about the sources of the problems, it is unlikely that the serious issues we observed are unique to research on financial establishments.
Moreover, we acquired our establishment data from SafeGraph in January 2022, and inspected the establishments for closures between September and December 2022. Establishment closures between January and the fall account for some portion of the differences we observed. Still, we expect this portion to be small. One, we accounted for likely increases in closures during our inspection period between September and December 2022. We found no effect of the passage of time in the percentage of closures we identified over those four months. Two, we draw evidence from the inspection of duplicates, which suggests that many duplicate locations are the result of unidentified closures that happened several years ago.
We note that our strategy for identifying duplicates cannot capture unidentified closures when a financial establishment of the categories we have been examining has closed and has been replaced by an establishment of a category outside of these six. Although in some cases (e.g., for banks), zoning restrictions would prevent the replacement of establishments from an entirely different business sector, these restrictions do not apply in all regions or across all industries.
Conclusion
The wide availability of large-scale, administrative data from private companies has transformed researchers’ ability to study human behavior. However, such data are typically not produced with the intention of generating social science. Classification problems represent a prime example of this discord, wherein private companies construe them as a predictive task that will allow them to order the chaos of large-scale, unstructured data into meaningful categories efficiently, while social scientists repurpose the outputs of these classifications to examine human behavior (Grigoropoulou & Small, 2022). A classification can be sufficiently accurate from a predictive perspective, given the practical limits to prediction (Hofman et al., 2017), while being inappropriately inaccurate from a measurement perspective, given the needs of scientific research (Bailey, 1994).
We suggest that classification problems can affect the research based on large-scale private data in four particular ways. First is detection. Given the volume of the data and, often, the cost of acquiring them, researchers must rely on classification categories to identify the units of interest. A large number of false negatives would mean that, while establishments of interest are in the database, researchers cannot effectively locate them. Researchers will often not even know that they do not know of missing units. Second is efficiency. Researchers rely on classification schemes such as NAICS to examine patterns or infer relationships. As the number of false positives increases, heterogeneity within the classification increases, leading to less precision in estimates. Third is validity. Misclassification also undermines empirically the validity of any given category, as one is less certain of measuring what one intends to measure, as when a large number of what one believes to be banks are in fact credit unions. Fourth is bias. When classification problems vary systematically by category—as when banks are observed more reliably than payday lenders—everything from basic descriptions about distributions to relationships between category types and other variables is affected. This problem is especially pernicious when the variation is related to a variable of interest, as when the less reliably measured types of financial institutions are more likely to be located in low-income neighborhoods. Estimates of inequality may be wildly over- or understated. All four problems affect studies in which the location of establishments or mobility patterns to and from them play a role.
We note that our process for identifying the problems in classification and sourcing was labor-intensive—indeed, qualitative fieldwork proved crucial (Grigoropoulou & Small, 2022). For researchers without the resources to perform extensive quality controls at this level of granularity, the results at a minimum should call for both caution and humility about results. A better solution is to not trust any single dataset, instead seeking for multiple datasets produced by different companies, governments, or entities and with different sources or processes for generating the data. An even better and complimentary approach is to sample a subset of entities of interest and perform at least minimal quality audits.
Finally, we encourage researchers employing any large-scale data from private companies to develop or acquire domain expertise. Researchers should either study the specifications, descriptors, and index entries of the classification scheme or find collaborators who have such knowledge. (Indeed, companies producing such data might benefit from doing so as well. In our study, many classification problems would have been prevented with a basic understanding of the kinds of services the establishments provide.) An important component of this process is fully understanding the original sources of the data produced by the companies and the process through which those sources classified the data. As companies increasingly gather data from multiple sources to sell to others, the complexities and resulting classification problems are likely to increase. Researchers will thus need to be more, not less, attentive to these issues in the coming years.
Footnotes
Acknowledgments
This research is funded by the Deutsche Forschungsgemeinschaft (DFG, German Research Foundation) under Germany’s Excellence Strategy (University Allowance, EXC 2077, University of Bremen). We gratefully acknowledge the support received from the U Bremen Excellence Chair Program and from all those involved in the project, particularly the host, Betina Hollstein.
Declaration of Conflicting Interests
The author(s) declared no potential conflicts of interest with respect to research, authorship, and/or publication of this article.
Funding
The author(s) disclosed receipt of the following financial support for the research, authorship, and/or publication of this article: This work was supported by the Deutsche Forschungsgemeinschaft (DFG, German Research Foundation) under Germany’s Excellence Strategy (University Allowance, EXC 2077, University of Bremen). Small, a full-time faculty member at Columbia, received a U Bremen Excellence Chair grant (2020-25).
Data Availability Statement
Notes
Appendix
This appendix presents several tables comparing the reliability of several methods.
Table A.1 compares our main approach to fieldwork (first reliability check, Step 5). 22 After classifying all establishments in New York City in the dataset based on Steps 1–4, we randomly sampled 243 of them. As discussed above, we separately conducted in-person visits or calls to those 243. For the 243, we calculate the classification agreement between the two methods. Please note that payday lending and car title lending are prohibited by law in New York State; thus, the table does not report estimates for these categories.
Estimates of Classification Agreement by Category of Financial Establishments.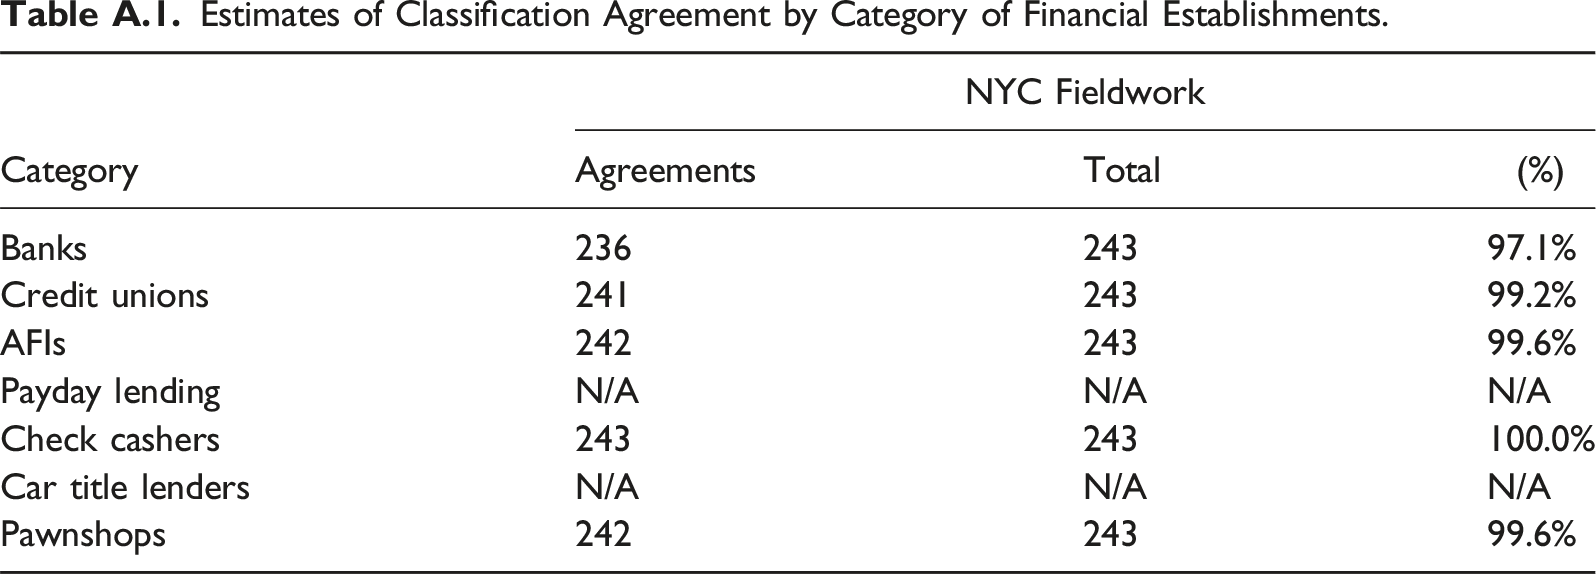
Category
NYC Fieldwork
Agreements
Total
(%)
Banks
236
243
97.1%
Credit unions
241
243
99.2%
AFIs
242
243
99.6%
Payday lending
N/A
N/A
N/A
Check cashers
243
243
100.0%
Car title lenders
N/A
N/A
N/A
Pawnshops
242
243
99.6%
The table shows that the classification agreement across the different establishment categories is exceptionally high. For banks, the classification agreement is slightly lower because in our original coding (Steps 1–4), we wrongly coded as commercial banks some establishments that instead did trade financing, a type of financial service outside the range of institutions that should be included in our SafeGraph data in the first place (see 522293 International Trade Financing). This initial misclassification was particularly prevalent among establishments representing foreign banks. While foreign banks constituted a relatively small portion of all banks in the dataset, we sought more information about them as we scaled our classification to the entire dataset. Still, there are limits to identifying such establishments through online searches. For that reason, the estimate of classification agreement between our scheme and SafeGraph’s reported in Table 5 may in reality be lower than shown.
Table A.2 presents the second reliability check discussed in Step 5. It compares the results of our classification (Steps 1–4) for the full data to those of the classification conducted independently by a research assistant on a stratified random sample of establishments.
Estimates of Classification Agreement by Category of Financial Establishments.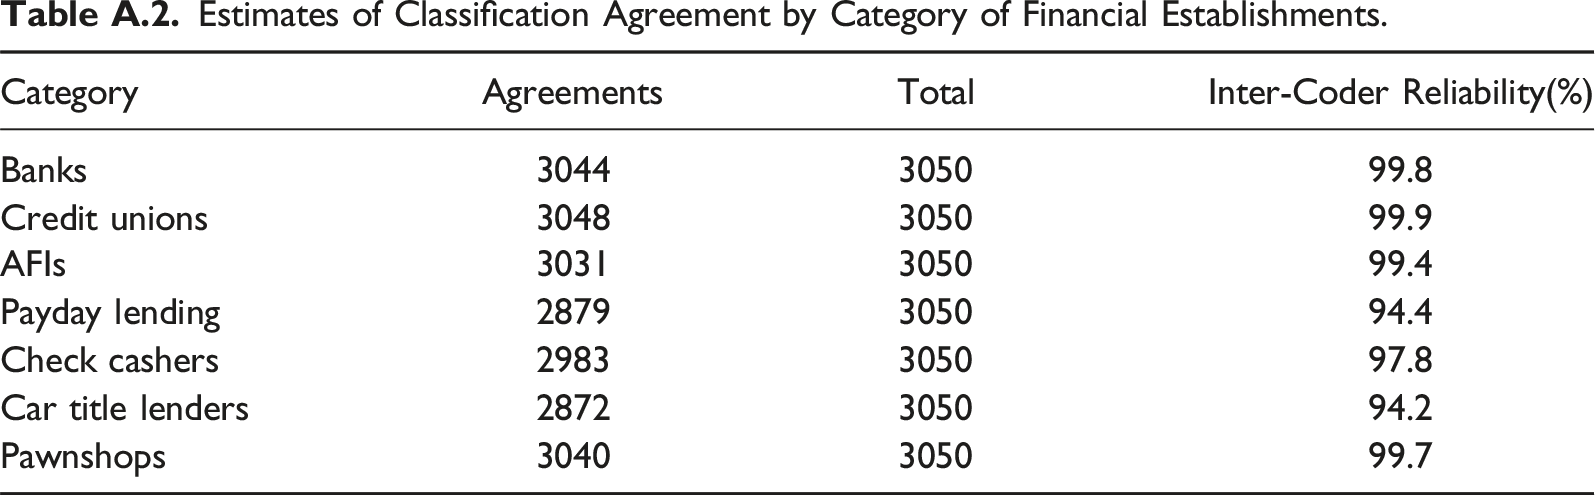
Category
Agreements
Total
Inter-Coder Reliability(%)
Banks
3044
3050
99.8
Credit unions
3048
3050
99.9
AFIs
3031
3050
99.4
Payday lending
2879
3050
94.4
Check cashers
2983
3050
97.8
Car title lenders
2872
3050
94.2
Pawnshops
3040
3050
99.7
We probed more to understand if our approach missed something important that resulted in lower reliability rates for payday lenders and car title lenders. Specifically, we found that we tended to identify more establishments as offering payday loans and car title loans when, in fact, they did not. As discussed earlier, we consider our coding approach conservative. While we expect that a close inspection at the establishment level will recognize more establishments that offer specific alternative financial services, than our heuristic methods, we were particularly invested in not classifying establishments into service categories we could not verify. Upon inspection, we discovered that all establishments we identified as offering payday lending, while they did not, and 92.9% of them for car title lenders were for branches of large corporations. For example, while Advance America is one of the largest payday lenders in the United States, not all of its branches offer in-store payday lending. 23 This type of service heterogeneity across establishments within corporations is nearly impossible to account for in automatic or semi-automatic classification systems, a fact that makes clear the need for a more targeted, qualitative approach to coding to tease out differences at the establishment level, when such differences are important in a study.
Nonetheless, this variation should not impact considerably the classification into NAICS codes in this case for two reasons: (1) The corporations that exhibited heterogeneity across establishments in payday lending, which resulted in false positives, were primarily check cashers and payday lenders, and invariably offered check cashing. These two types of alternative financial services fall under the same NAICS category (see Table 1). (2) The companies associated with at least 92.9% of eventually unconfirmed services in car title lending were corporations whose primary activity was payday lending and check cashing, not car title lending.
As discussed in the Methods section, because our initial objective was not to assess the efficacy of given methods but to improve the quality of our data for empirical analysis, our classification process was iterative. We used some information from later steps to return and refine classifications in earlier steps. Thus, some establishments have been classified based on information from more than one of these methods.
Nevertheless, it is valuable to assess the efficacy of each of the given methods. Thus, in Table A.3 we present the results of our reliability check for each method in Steps 1–4 separately. For these calculations, we removed those establishments that we had classified iteratively—that is, based on information from more than one method. Thus, in Table A.3 each column set exhibits the reliability of a given method based only on those establishments classified with that method. As the table shows, the intercoder reliability is exceptionally high across financial categories for our two primary classification methods: assignments based on descriptive keywords and based company information. However, for our most labor-intensive method, the manual search, the reliability was lower for payday lenders (89.1%), check cashers (84.5%), and car title lenders (91.5%).
To understand why, we probed further. During the annotation process, both the researcher and the research assistant, who coded the data independently, were required to note how confident they were about the accuracy of the assigned code for a given establishment, and to make notes regarding any ambiguous entries. We found that many of the coding discrepancies were rooted in the issues we discussed above in our presentation of Step 4. For example, in 15 of the 20 discrepant annotations for check cashers, either the researcher, the research assistant, or both had indicated low confidence in their classification. The limited confidence was often due to limited information from the expected source, such as an active company Web site, which was frequently attributable to the establishment having been closed for some time. In addition, establishments were at times ambiguous in the description of financial services. The procedure reinforces the idea that researchers employing manual classification include indicators of their subjective confidence in the classification.
Estimates of Classification Agreement by Category of Financial Establishments Across Classification Methods.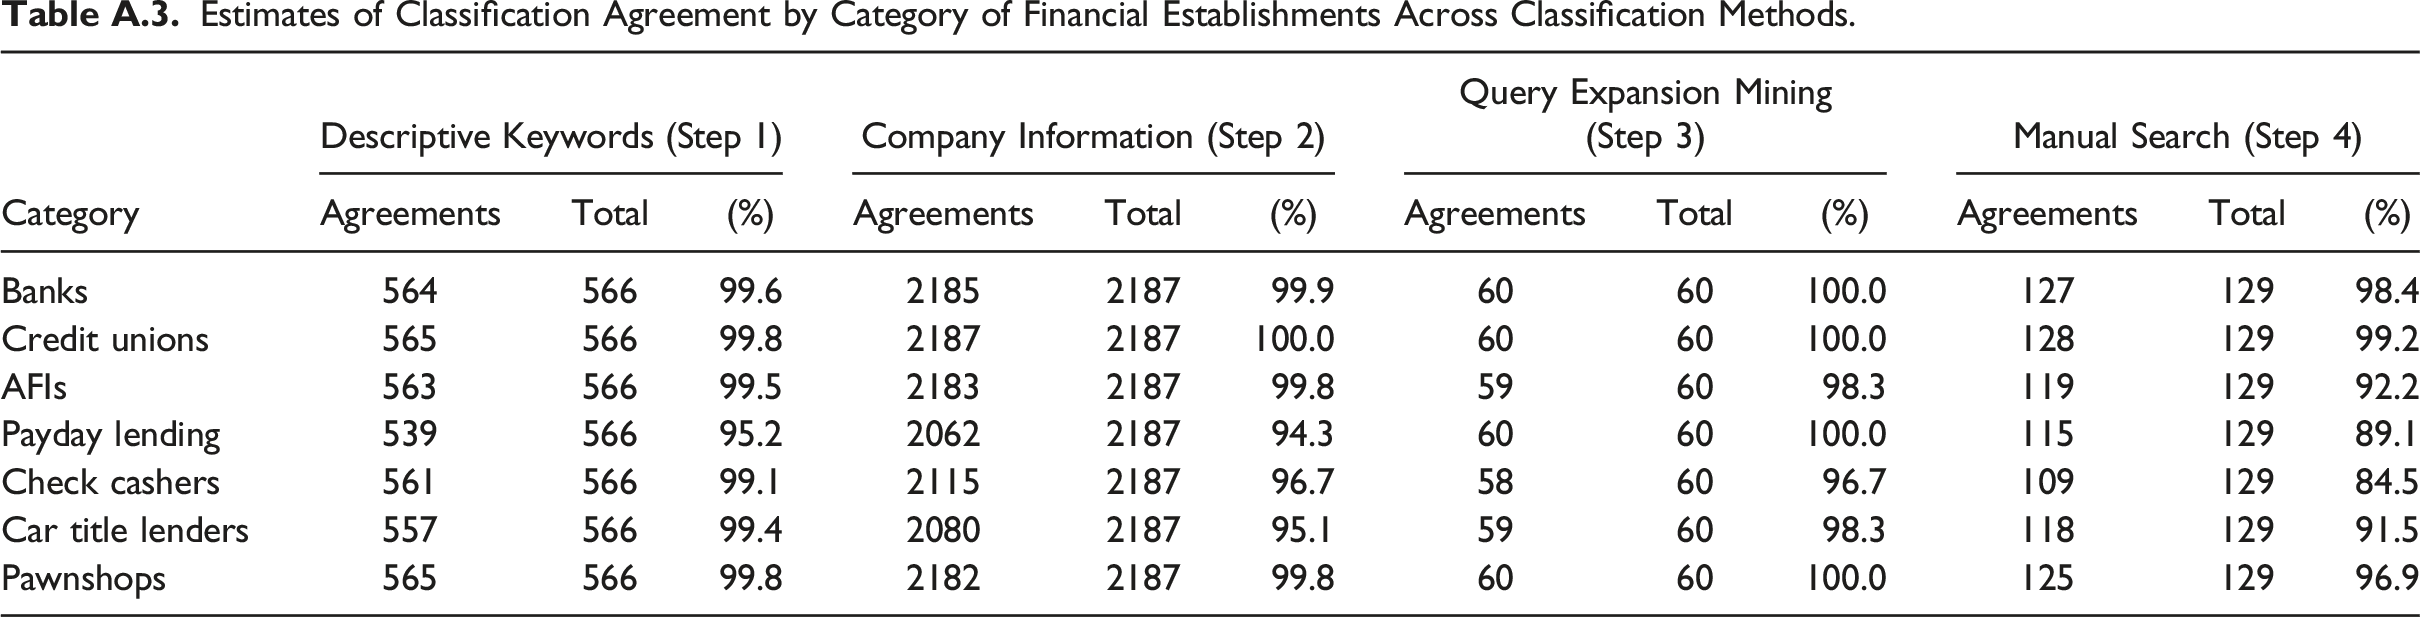
Category
Descriptive Keywords (Step 1)
Company Information (Step 2)
Query Expansion Mining (Step 3)
Manual Search (Step 4)
Agreements
Total
(%)
Agreements
Total
(%)
Agreements
Total
(%)
Agreements
Total
(%)
Banks
564
566
99.6
2185
2187
99.9
60
60
100.0
127
129
98.4
Credit unions
565
566
99.8
2187
2187
100.0
60
60
100.0
128
129
99.2
AFIs
563
566
99.5
2183
2187
99.8
59
60
98.3
119
129
92.2
Payday lending
539
566
95.2
2062
2187
94.3
60
60
100.0
115
129
89.1
Check cashers
561
566
99.1
2115
2187
96.7
58
60
96.7
109
129
84.5
Car title lenders
557
566
99.4
2080
2187
95.1
59
60
98.3
118
129
91.5
Pawnshops
565
566
99.8
2182
2187
99.8
60
60
100.0
125
129
96.9