
Abstract
Street views, satellite imageries and remote sensing data have been integrated into a wide spectrum of topics in the social sciences. Computer vision methods not only help analysts and policymakers make better decisions and produce more effective solutions but they also enable models to achieve more precise predictions and greater interpretability. In this paper, we review the growing literature applying such methods to economic issues and the social sciences, in which social scientists employ deep learning approaches to utilise image data to retrieve additional information. Typically, image data produce better results than traditional approaches and can provide detailed results and helpful insights to improve society and people’s well-being.
Keywords
Introduction
Recent years have witnessed intense cross-disciplinary research in computer science, information science and the social sciences. From a broad perspective, the influx of multi-methodologies can be seen as the advancement of computing power, big data databases and artificial intelligence. In short, these integrations help researchers in economics, business and social science fields retrieve information from disparate resources, which were not fully exploited in recent years. In particular, street views and satellite imageries have recently gained much momentum in economics studies (Donaldson & Storeygard, 2016), criminological research (Vandeviver, 2014), urban analytics (Biljecki & Ito, 2021; Li et al., 2015) and sustainable development (Burke et al., 2021).
In the past, to obtain built environmental, geographical and social information about an area, researchers had to conduct costly and time-consuming on-site inspections. Manually classifying and processing the data or imageries collected from actual on-site visits are inefficient activities. Virtually auditing a particular neighbourhood can be a reliable and effective alternative that provides abundant detailed information (Badland et al., 2010; Berland & Lange, 2017; Goel et al., 2018). Through such an alternative method, we can not only deal with unresolved issues by providing further evidence but also trigger new research questions by attaining various data resources.
To date, the Google Street View service has covered half of the world’s population (Goel et al., 2018) and a vast range of streets in developed countries by examining visual features and providing a valuable large-scale source of landscape and urban data. Meanwhile, satellite imageries from Google Earth Engine could provide another perspective from a bird’s eye view with 24/7 real-time surveillance, aiding investigations of the daily routines of areas and changes in cityscapes. Google has been considered a convenient and reliable tool to reduce the costs and expertise needed to conduct research (Rzotkiewicz et al., 2018). In general, the characteristics and information about streets, neighbourhoods and the Earth at a distance without making physical contact are so-called remote sensing data, which represent a contrast to on-site observations. Information retrieved from street views and satellite imagery can be seen as one of the remote sensing data.
Beyond image data, some companies pre-process street views or satellite imageries for use by scientists. Social scientists and economists can significantly improve the quality of their research and experiments and investigate the feasibility of further assessments for policy and social welfare without fully understanding computer vision methodologies in processing image data. For that reason, the main purpose of this article is to introduce current research topics and data resources to put forward positive proposals without focusing on demonstrating the innovation of machine learning techniques. 1 As street views and satellite imageries have been employed to enrich a wide spectrum of studies in disparate disciplines, in this paper, we hope to provide a comprehensive review of current applications, along with various aspects of research limitations and opportunities or knowledge gaps.
The rest of this paper is structured as follows. The review methodology is presented in the next section. Then, we briefly describe the major data sources considered (Google Street Views, Google Earth Engine, Orbital Insight and RS Metrics), and summarise statistics of screened manuscripts, developed computer vision techniques and the research methodological framework. Next, we overview the state-of-the-art applications of using street views and satellite imageries in economics and social science fields. Finally, we discuss the obstacles and opportunities and draw a conclusion.
Review Methodology
The methodology of this review is mainly divided into two parts: 1) manuscripts are identified from Web of Science, Scopus and Google Scholar that contain relevant keywords: street views, aerial images, satellite imageries, Google Street View, Google Earth Engine, Orbital Insight and RS Metrics. It can also be searched via a combination of keywords such as Google satellite, aerial views or RS Metrics imageries; 2) manuscripts are collected that mainly reflect the application of deep learning and computer vision in understanding neighbourhood, society and world, not concentrating on techniques per se. In total, 652 manuscripts were collected under the foregoing criteria. In addition, collected manuscripts need to be conducted within the context of human behaviour, economics and the social sciences. Therefore, research aiming to advance machine learning methods was further excluded.
Within paradigm shifts in artificial intelligence across different fields, the applications of computer vision in economics and the social sciences may be published in various journals, not just domain-specific journals. Using these generic keywords enables researchers to capture diverse applications in miscellaneous fields in social sciences. Although it is inevitable to unintentionally exclude some relevant manuscripts, we hope this paper investigates the state-of-the-art applications and provides a comprehensive note on this current trend in understanding the realistic dynamics of the world.
Major Data Sources
Street Views: Google Street View
Google Street View Static Application Programming Interface (API)
2
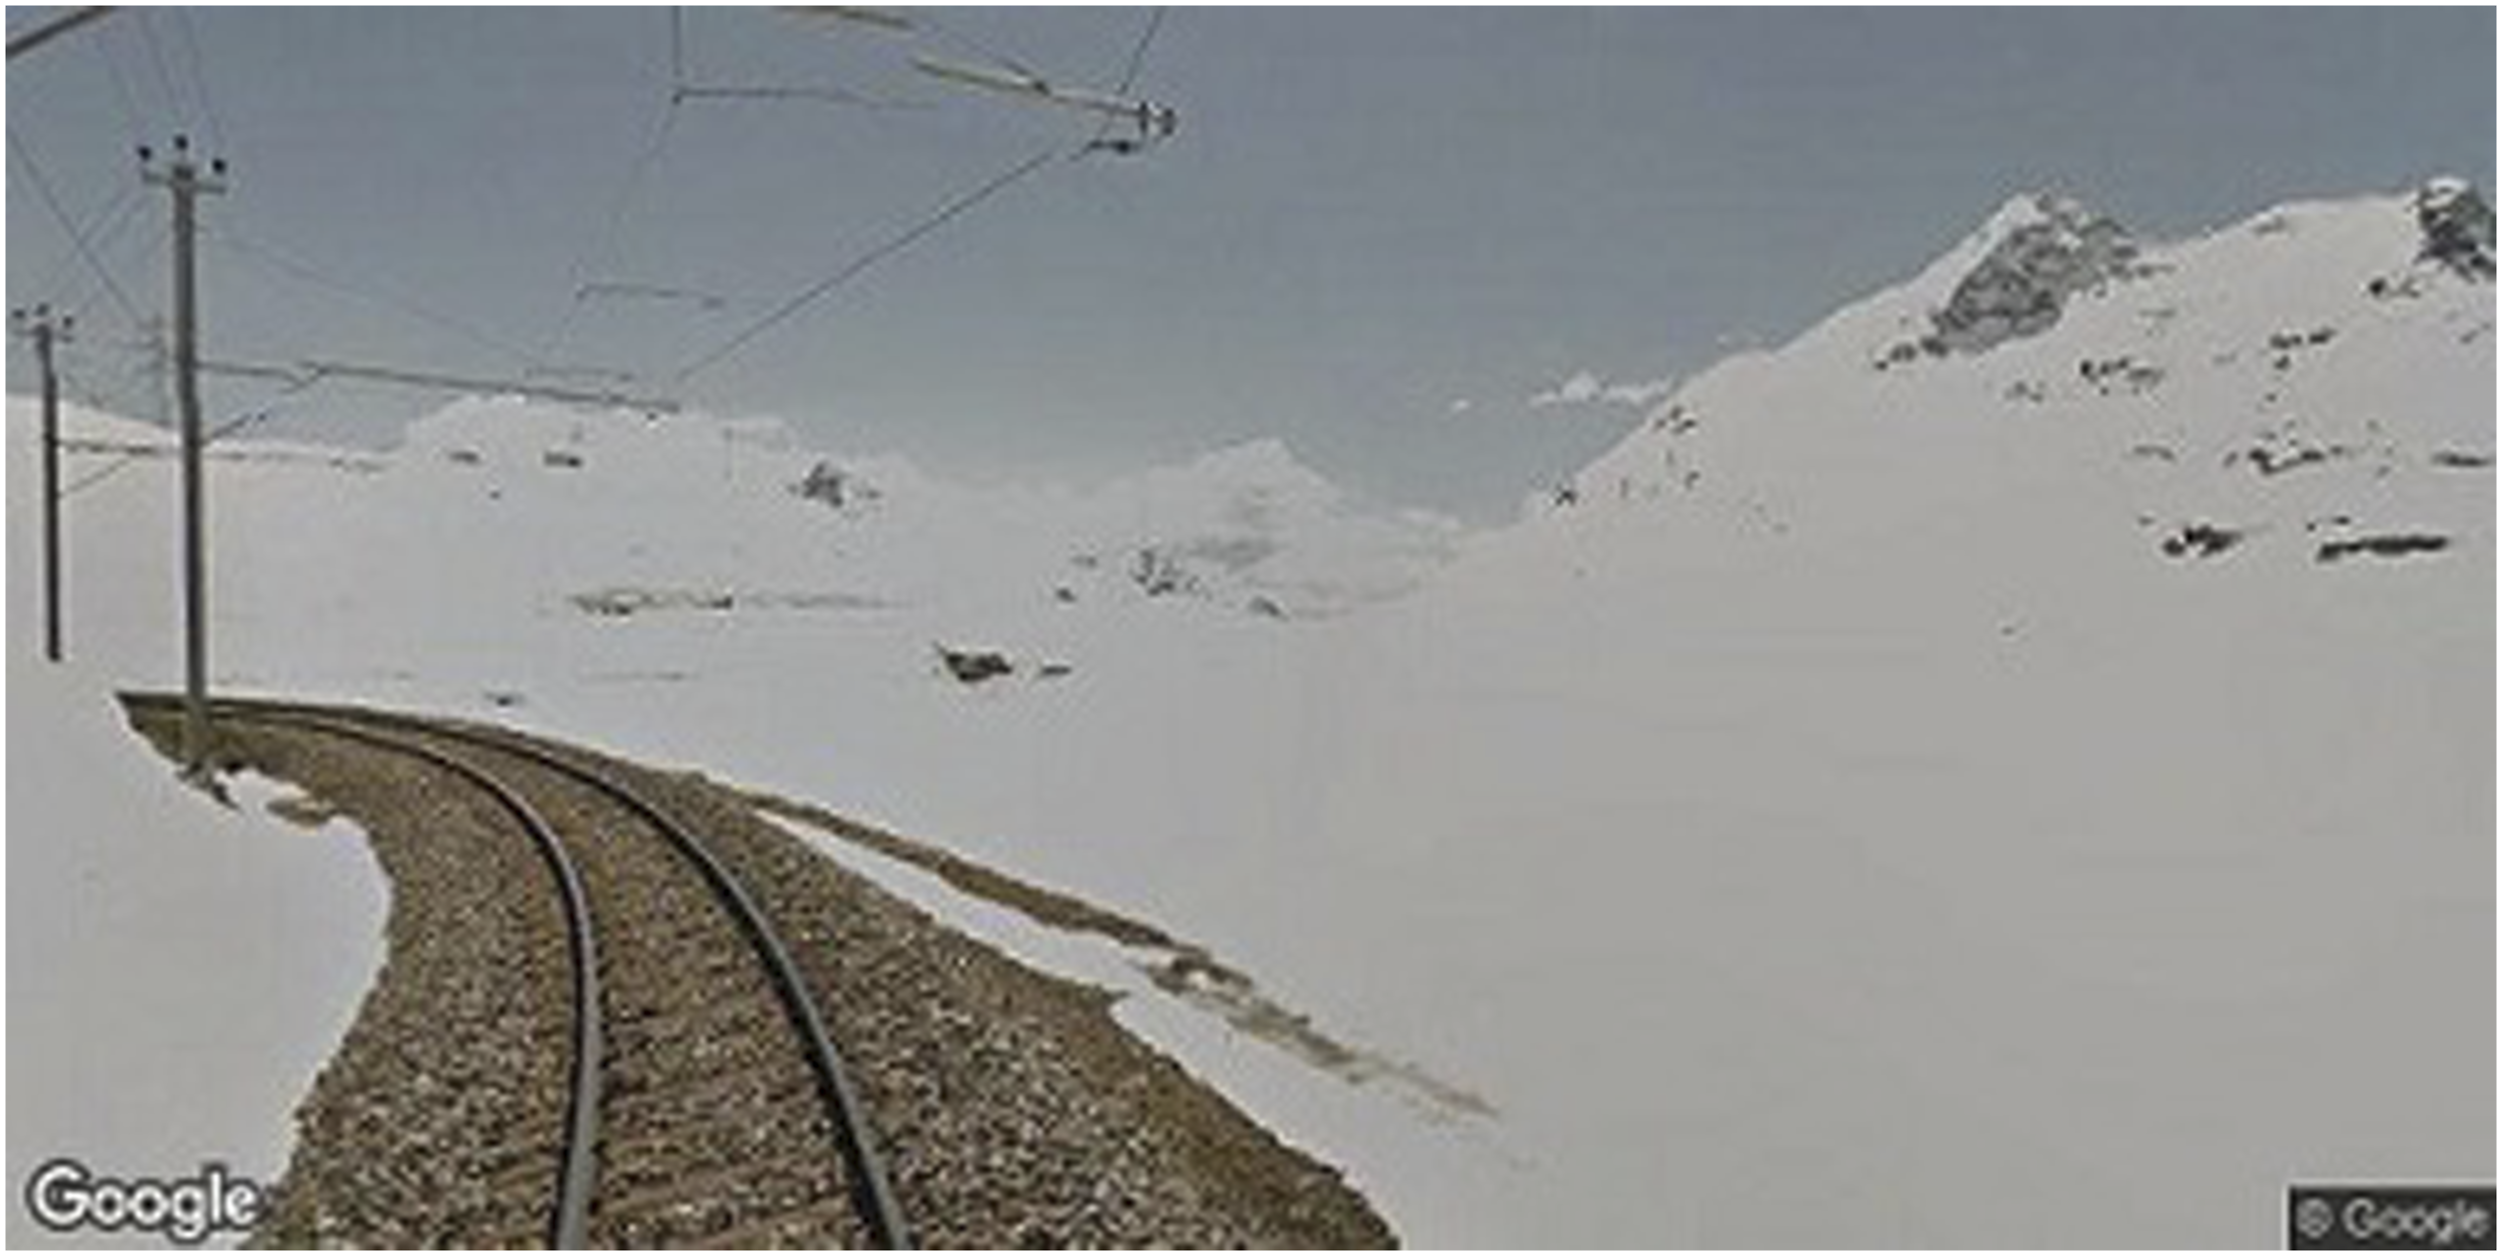
provides convenient access to street view images using a simple Hypertext Transfer Protocol (HTTP) request, with no need for any other code. We only need to apply for the Street View Static API-enabled key and set it up in the uniform resource locator parameters sent through a standard HTTP request. Each request returns a static street view image. For each image data point, there are multiple parameters we can adjust to obtain the expected street view imageries. For example, we can determine the size of the view, as in the differences in Figures 1 and 2. In addition, when dealing with a fixed-size viewport, as shown in Figure 1, we can indicate the degree of zoom either at a higher or lower level. Examples of Google Street View images. Source: Google Maps Platform. An example of a Google Street View image. Source: Google Maps Platform.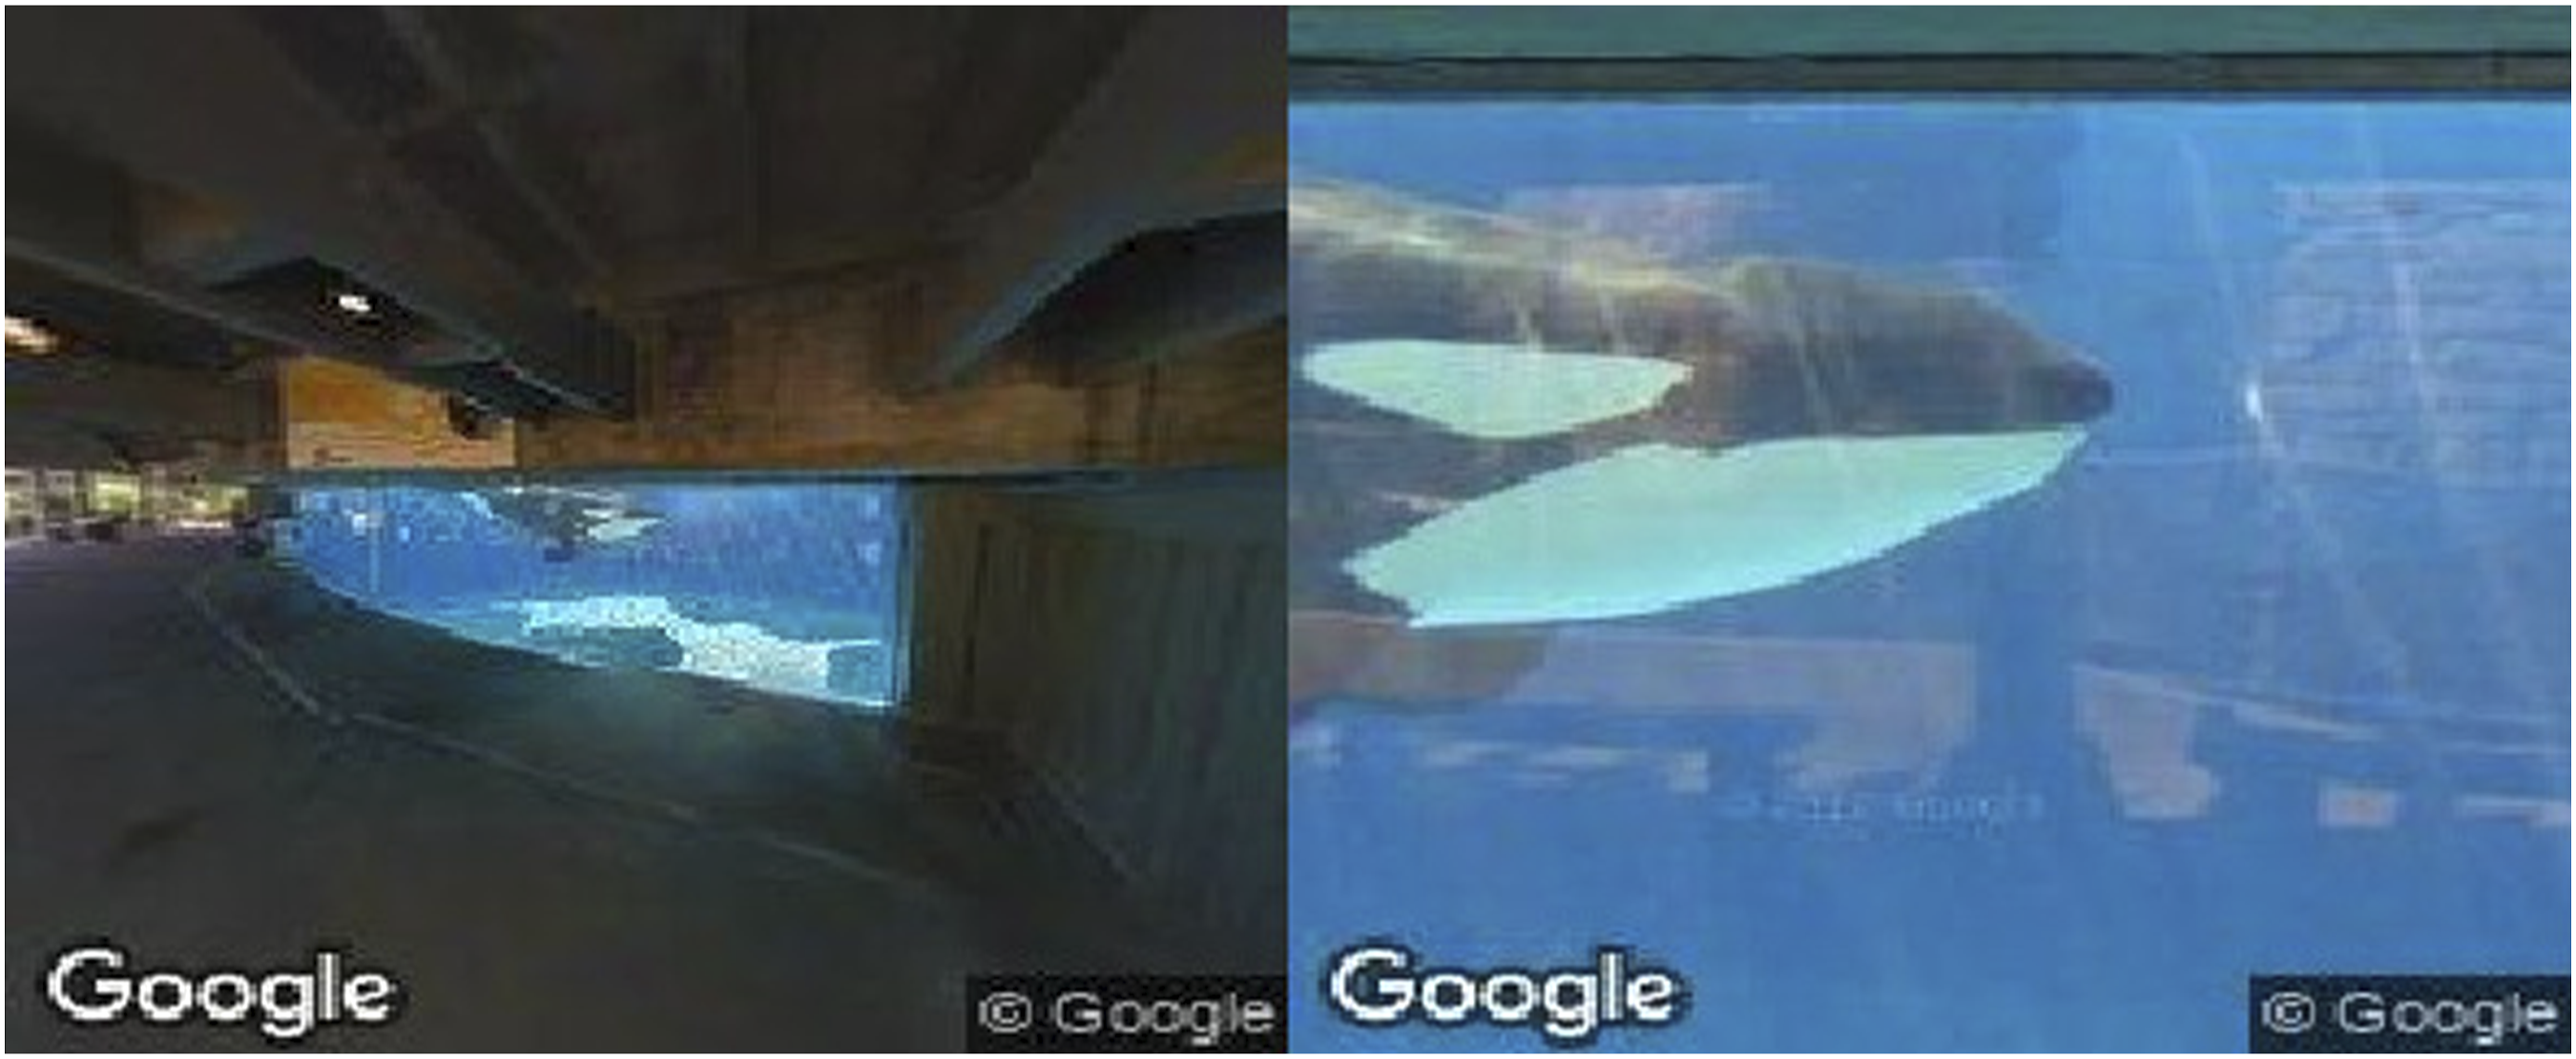
Satellite Imageries: Google Earth Engine
Google Earth Engine is a geospatial processing service. Unlike Google Street View, researchers mainly use JavaScript and Python for calling the Google Earth Engine API
3
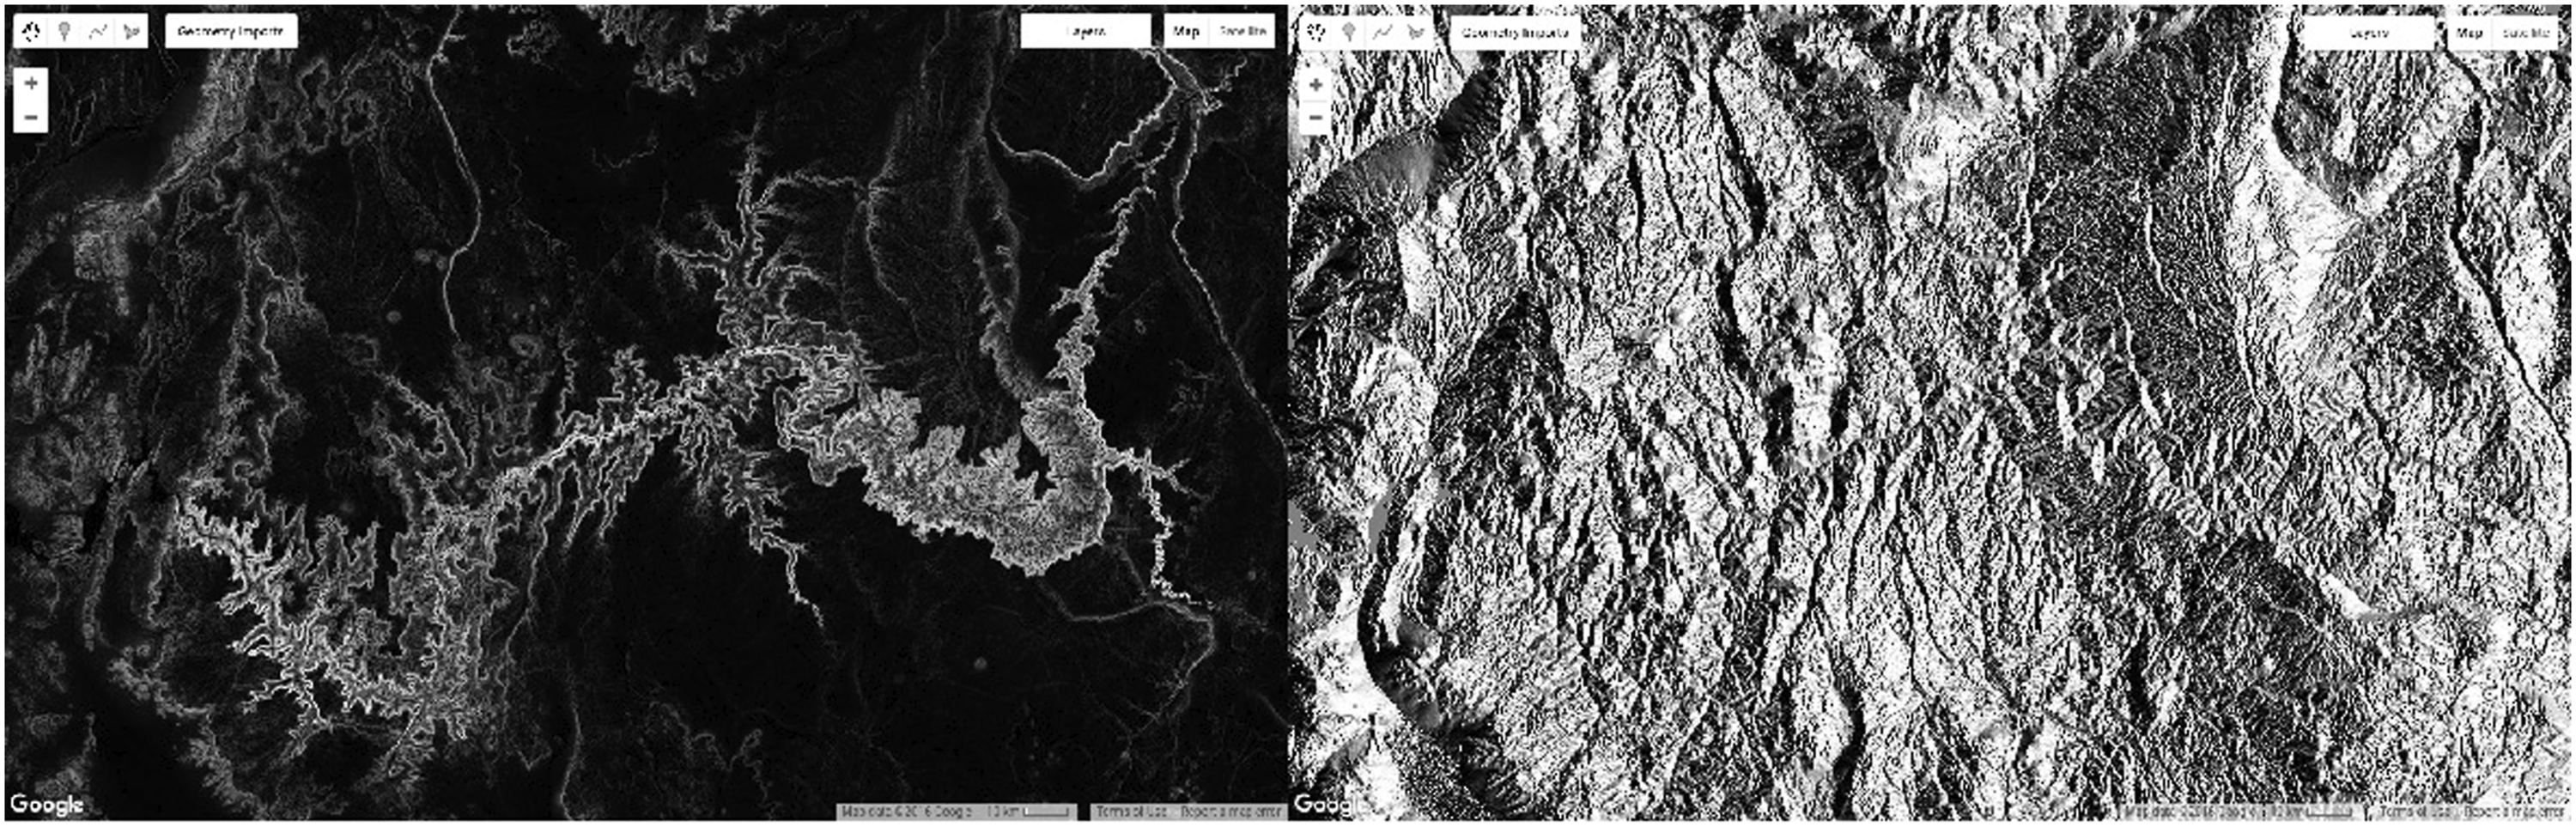
; however, the official website provides basic concepts and detailed guidelines to help beginning researchers become familiar with the workflow. Similarly, there are various parameters we can adjust to obtain our expected satellite data. For example, Figure 3 shows the data in grayscale or a colour ramp from blue to red. Furthermore, we can apply computation to recently retrieved image data. The left image of Figure 4 shows the slope of the terrain; the right image shows trigonometric operations such as the sine of terrain aspect. We can even composite, mask and mosaic image data to address some interesting unsolved questions which will be introduced in the review and application section. Examples of elevation images. Source: Google Earth Engine. Examples of computed elevation images. Source: Google Earth Engine.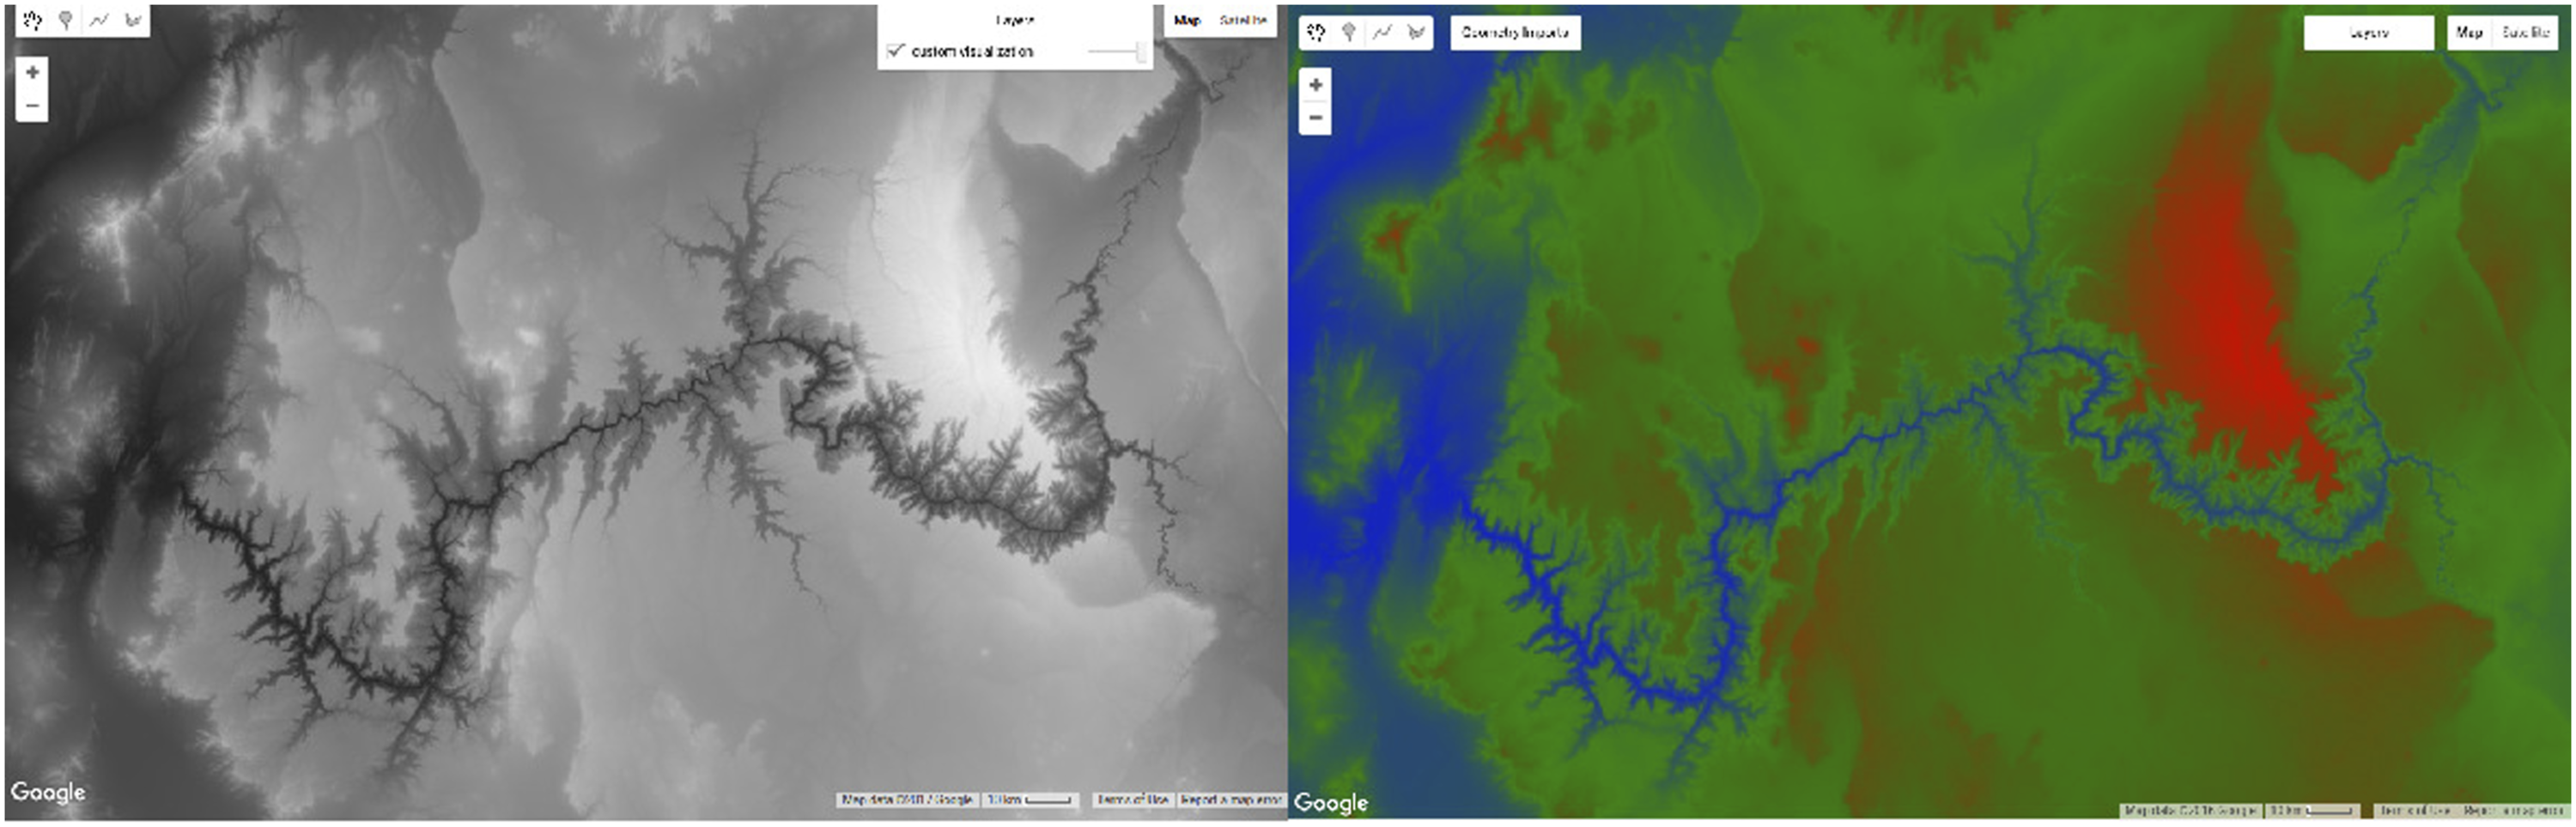
Remote Sensing Data
Orbital Insight
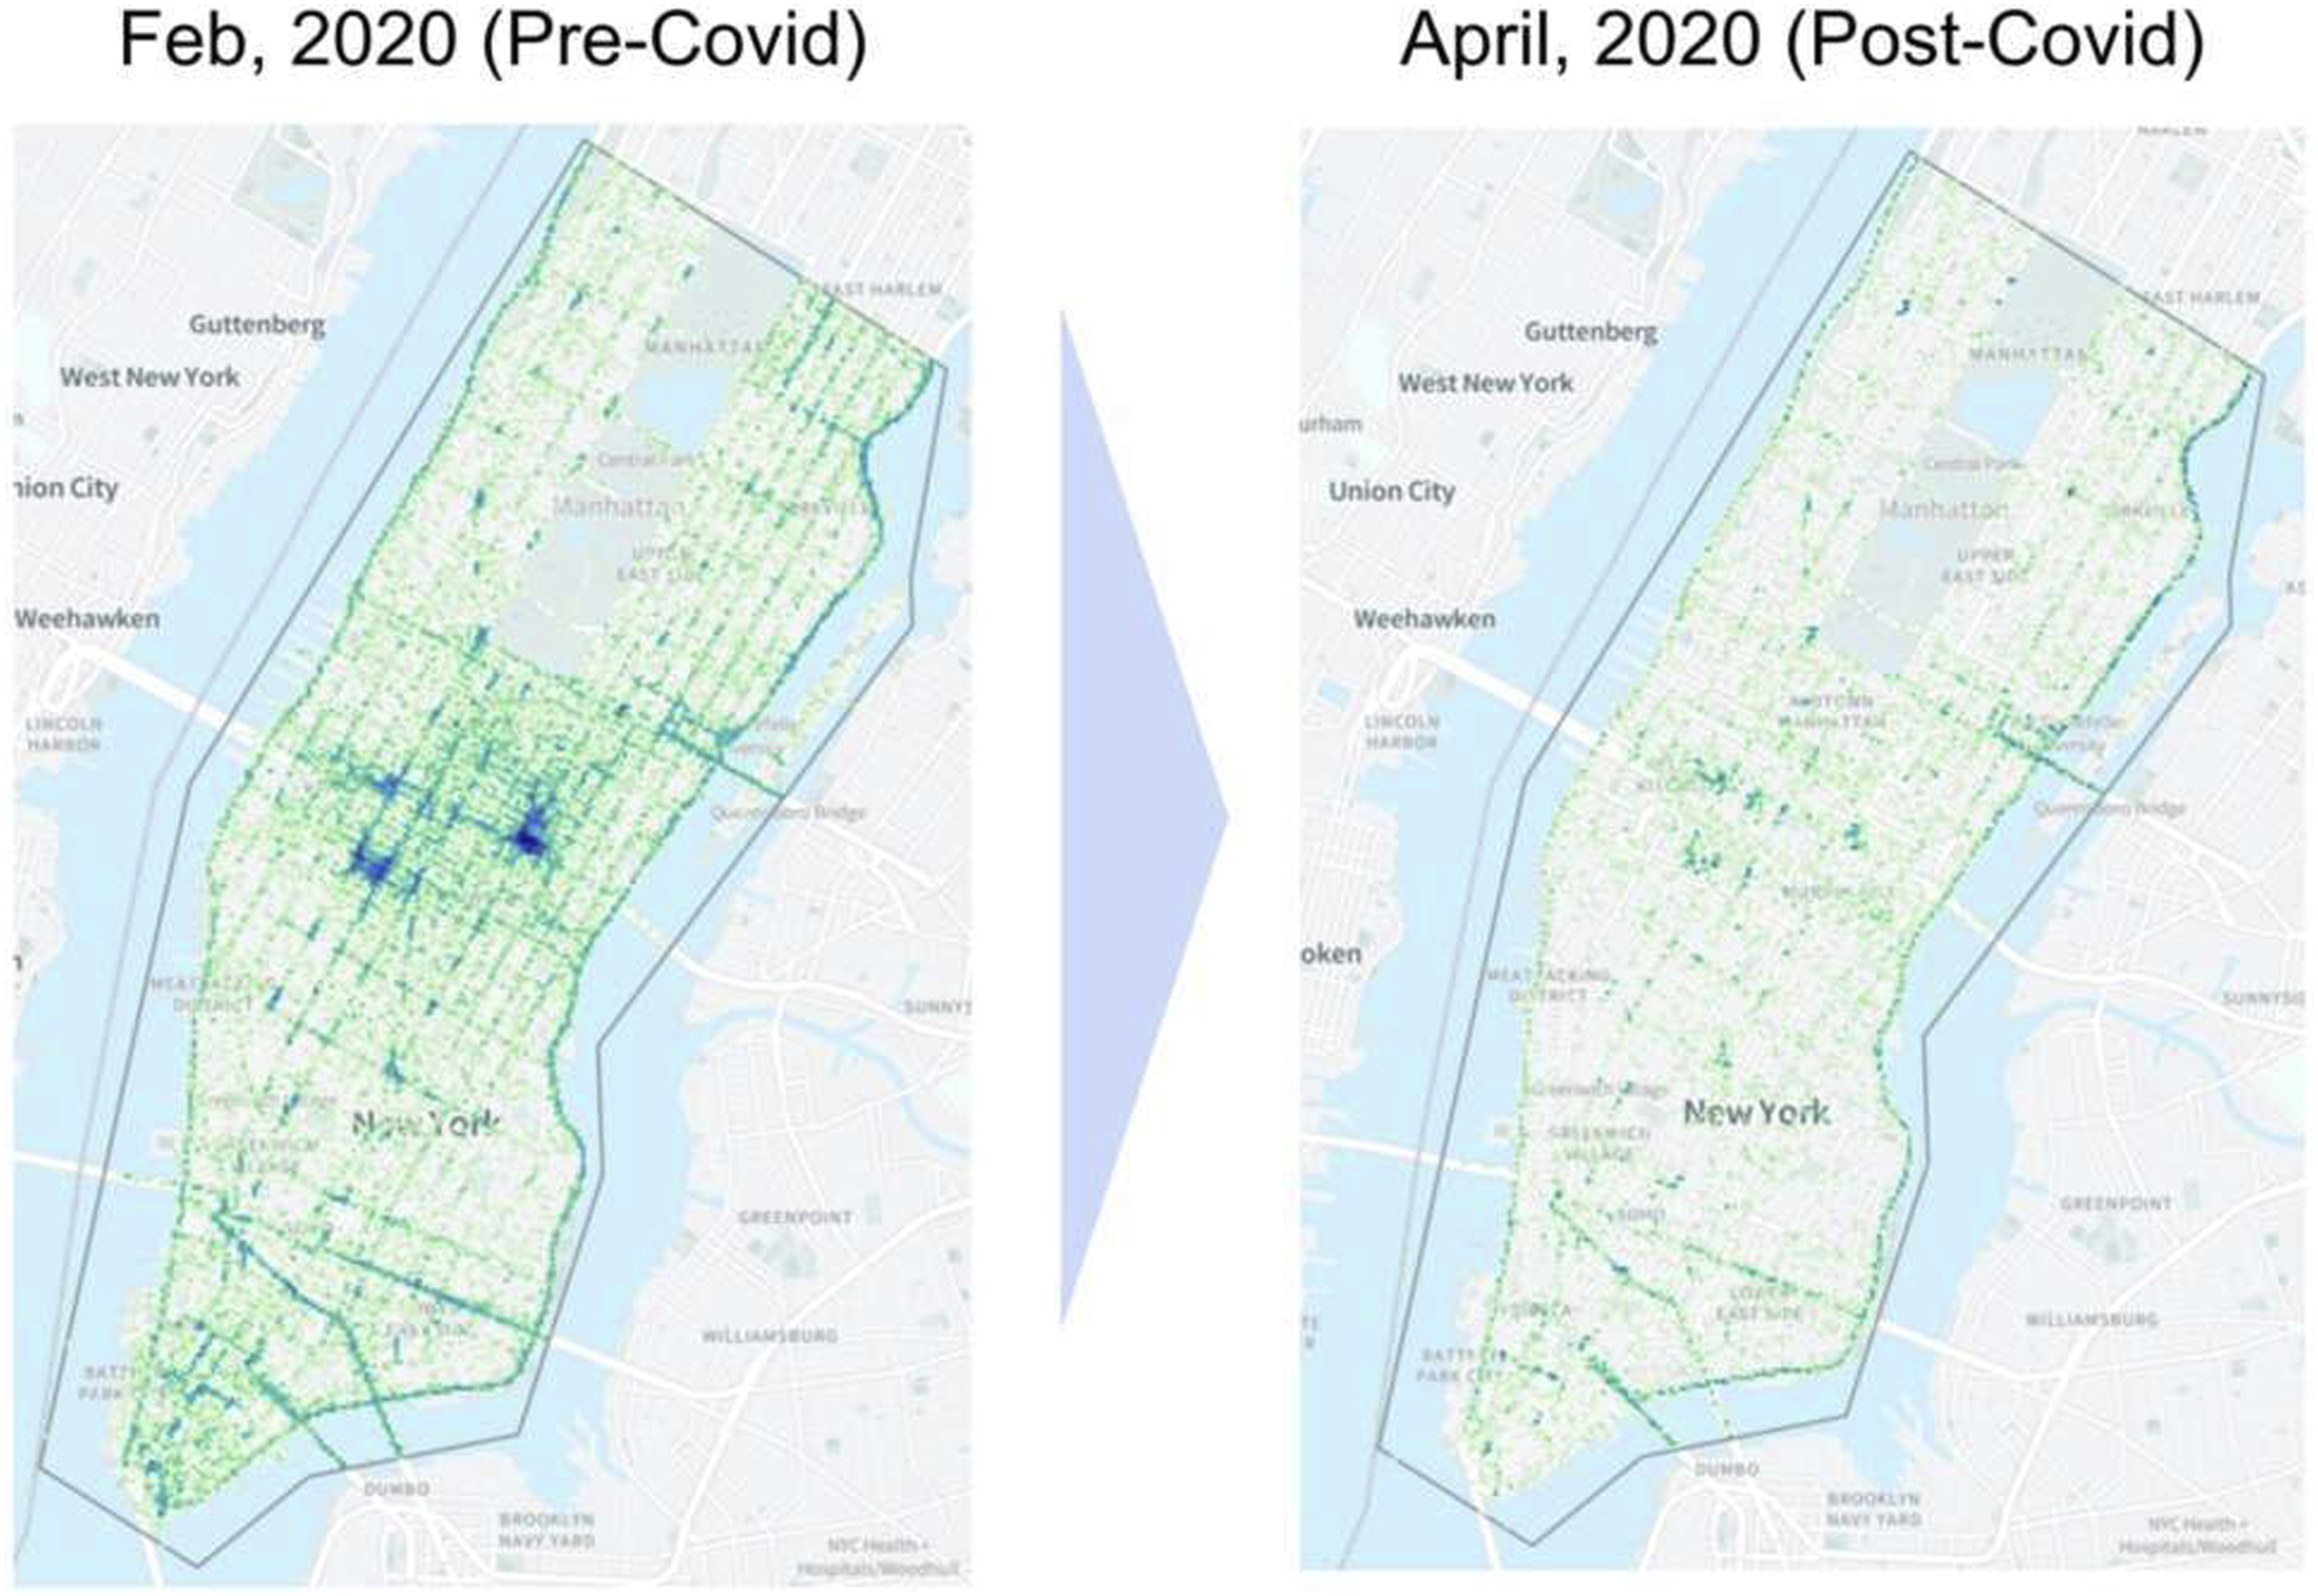
Orbital Insight conducts deep learning techniques with computer vision to extract information from images taken by satellites, drones and other unmanned aerial vehicles. By using the launched analytics platform, Orbital Insight GO, social scientists can effectively deal with satellite imageries and geospatial data without deeply understanding deep learning methodologies. Researchers can focus on real-world issues and integrate image data into their decisions based on artificial intelligence (AI)-assisted analysis approaches. With the aid of Orbital Insight services, we can visualise the end-to-end supply chain of competitors (Figure 5) for example, which helps us find vulnerabilities and drive us to launch our new products, source alternatives and utilise location intelligence to formulate better business solutions. In Figure 6, we have mapped the daily foot traffic activity during the COVID lockdown period, which provides further insights to support policy development and epidemic disease prevention and control. A case study from Orbital Insight. Source: Orbital Insight: Case Studies (2022). A case study from Orbital Insight. Source: Orbital Insight: Case Studies (2022).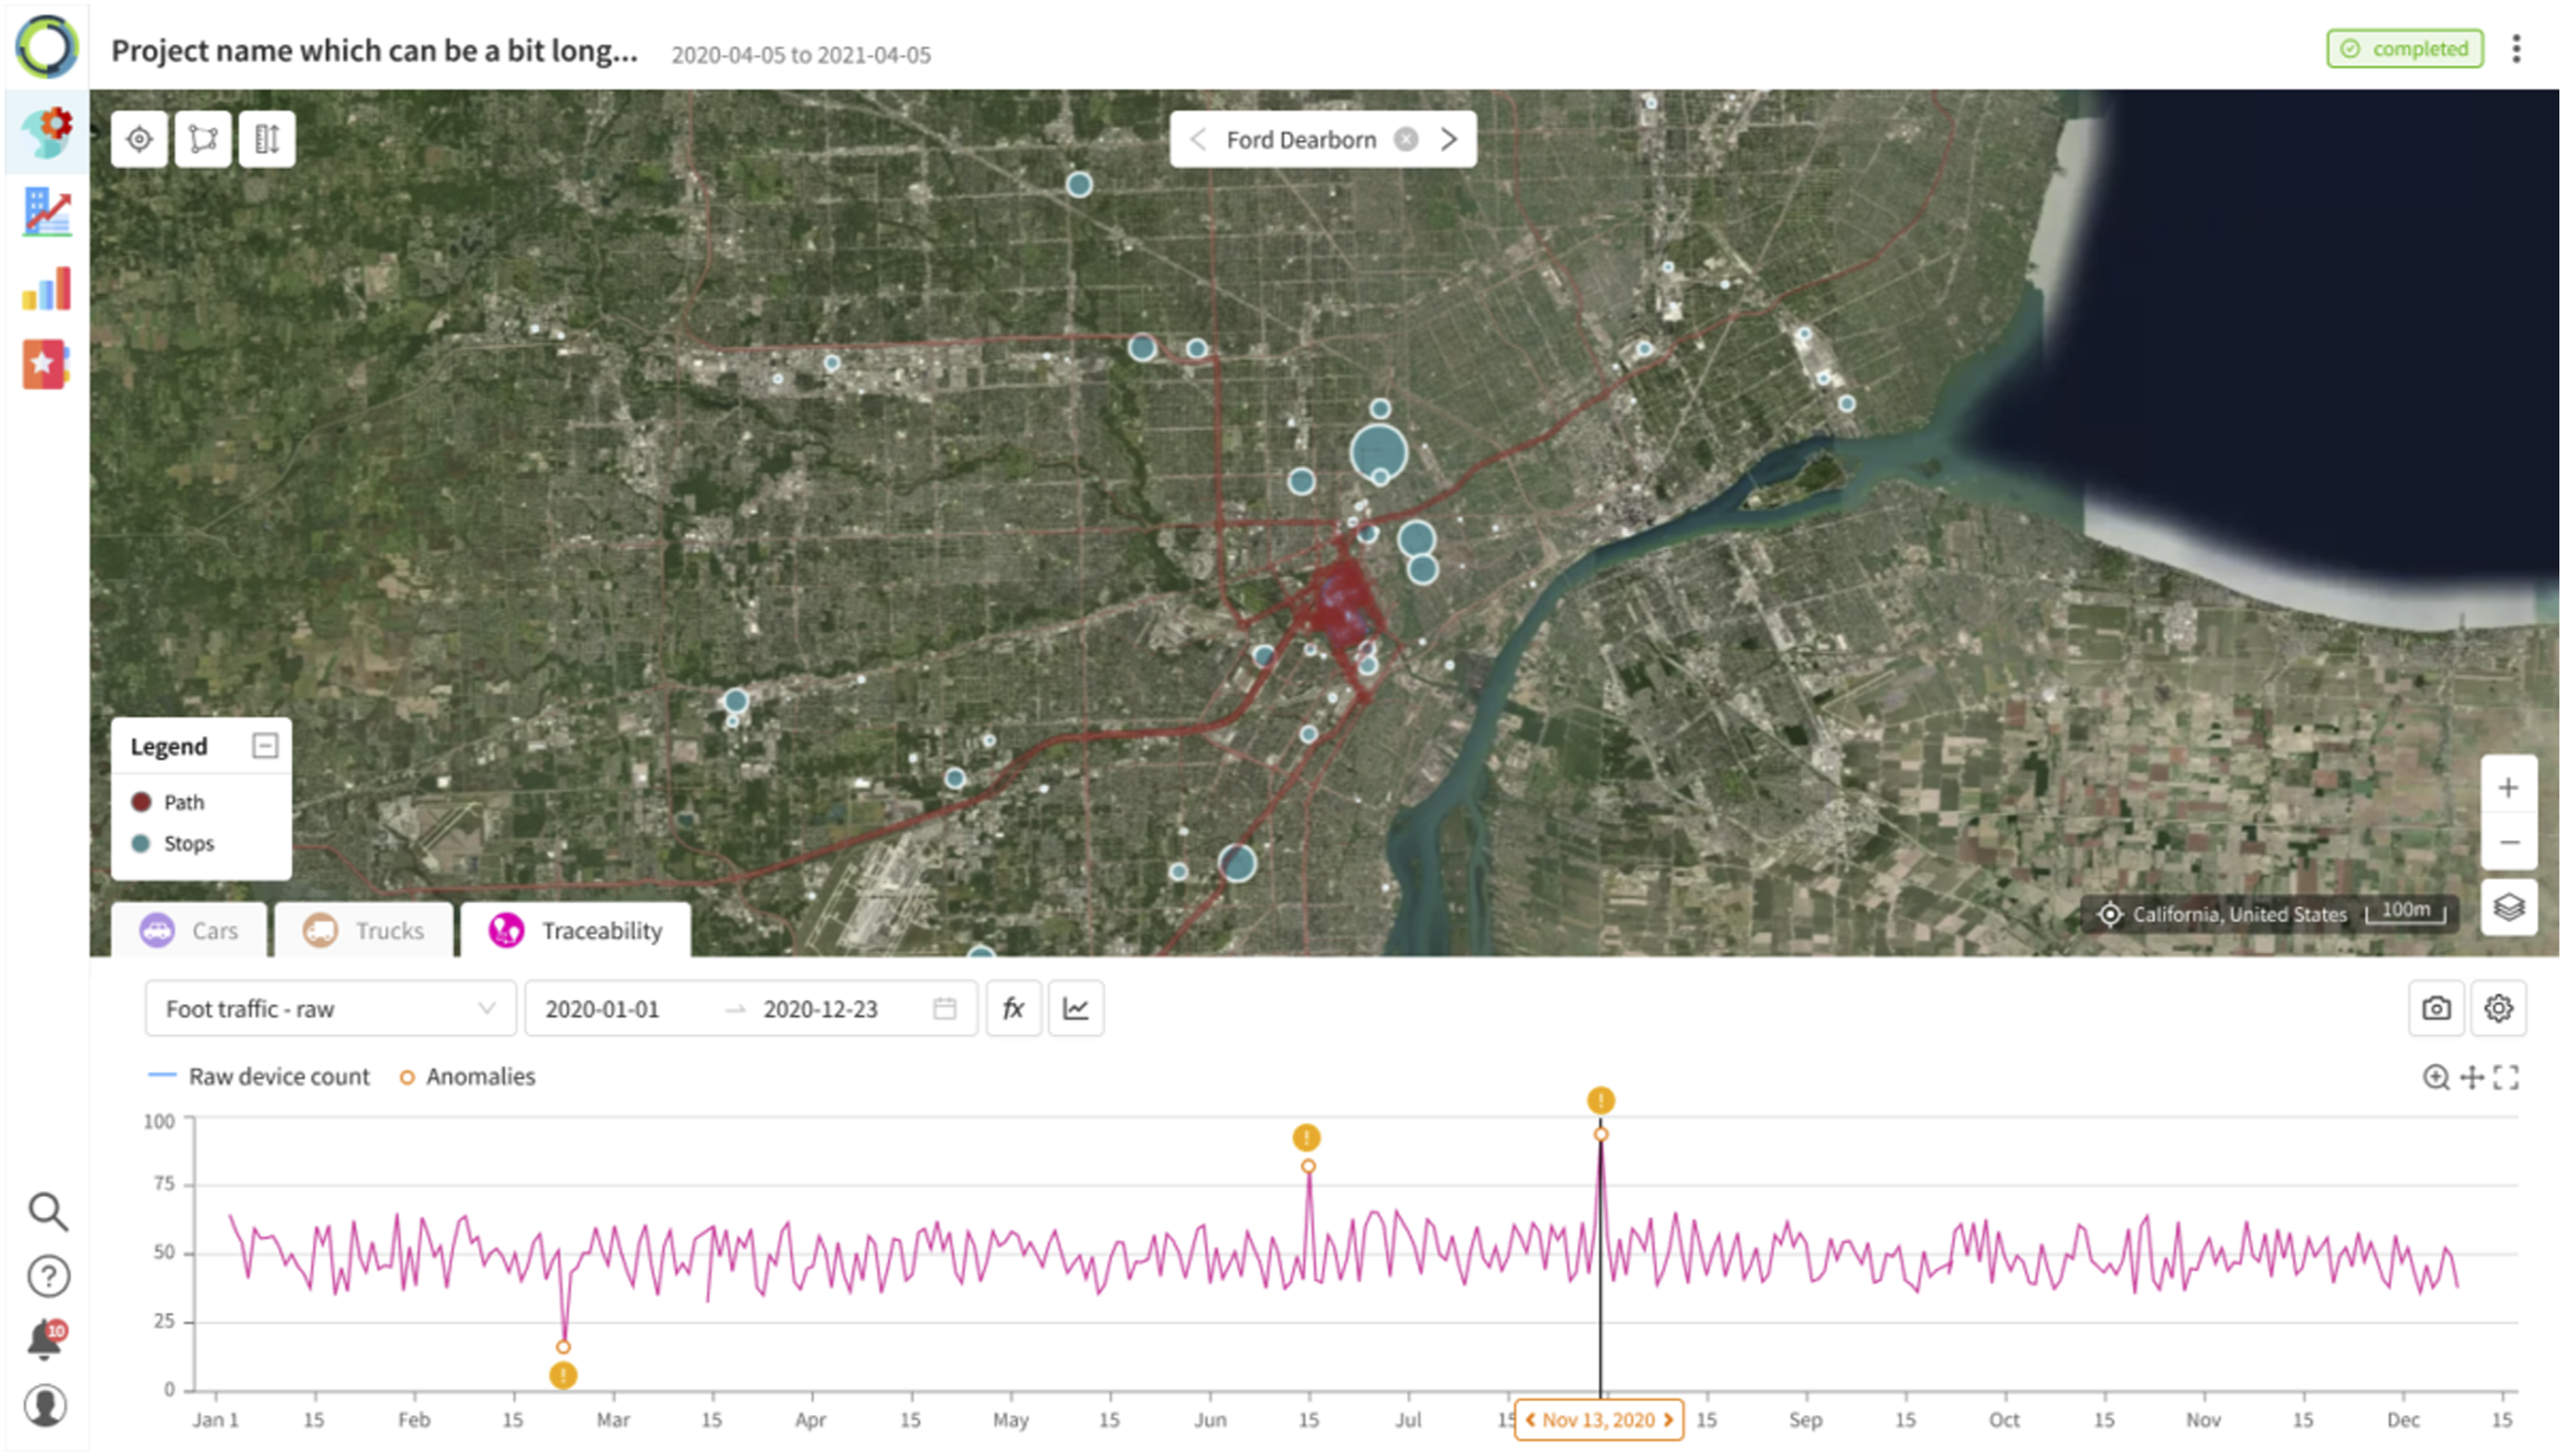
RS Metrics
RS Metrics is the market leader in the large-scale analysis of satellite imageries for businesses and investors. Its main data products produce valuable insights and actionable signals that can be used to enhance our decision and reporting processes. For example, an application and reporting tool, TrafficSignals, measures the parking lot availability of stores as a proxy of the growth of customers showing up at stores. As customers usually shop with friends, family and colleagues, we may consider a group as a unit of consumers. Thus, traffic (as estimated as the number of cars) can be used to some extent to track the relationship between actual visits and transactions. Figure 7 shows that RS Metrics leverages advanced computer vision and machine learning to extract information and provides meaningful insights and ready-to-use data from a variety of types of stores. A case study from RS Metrics. Source: RS Metrics: TrafficSignals TM (2022).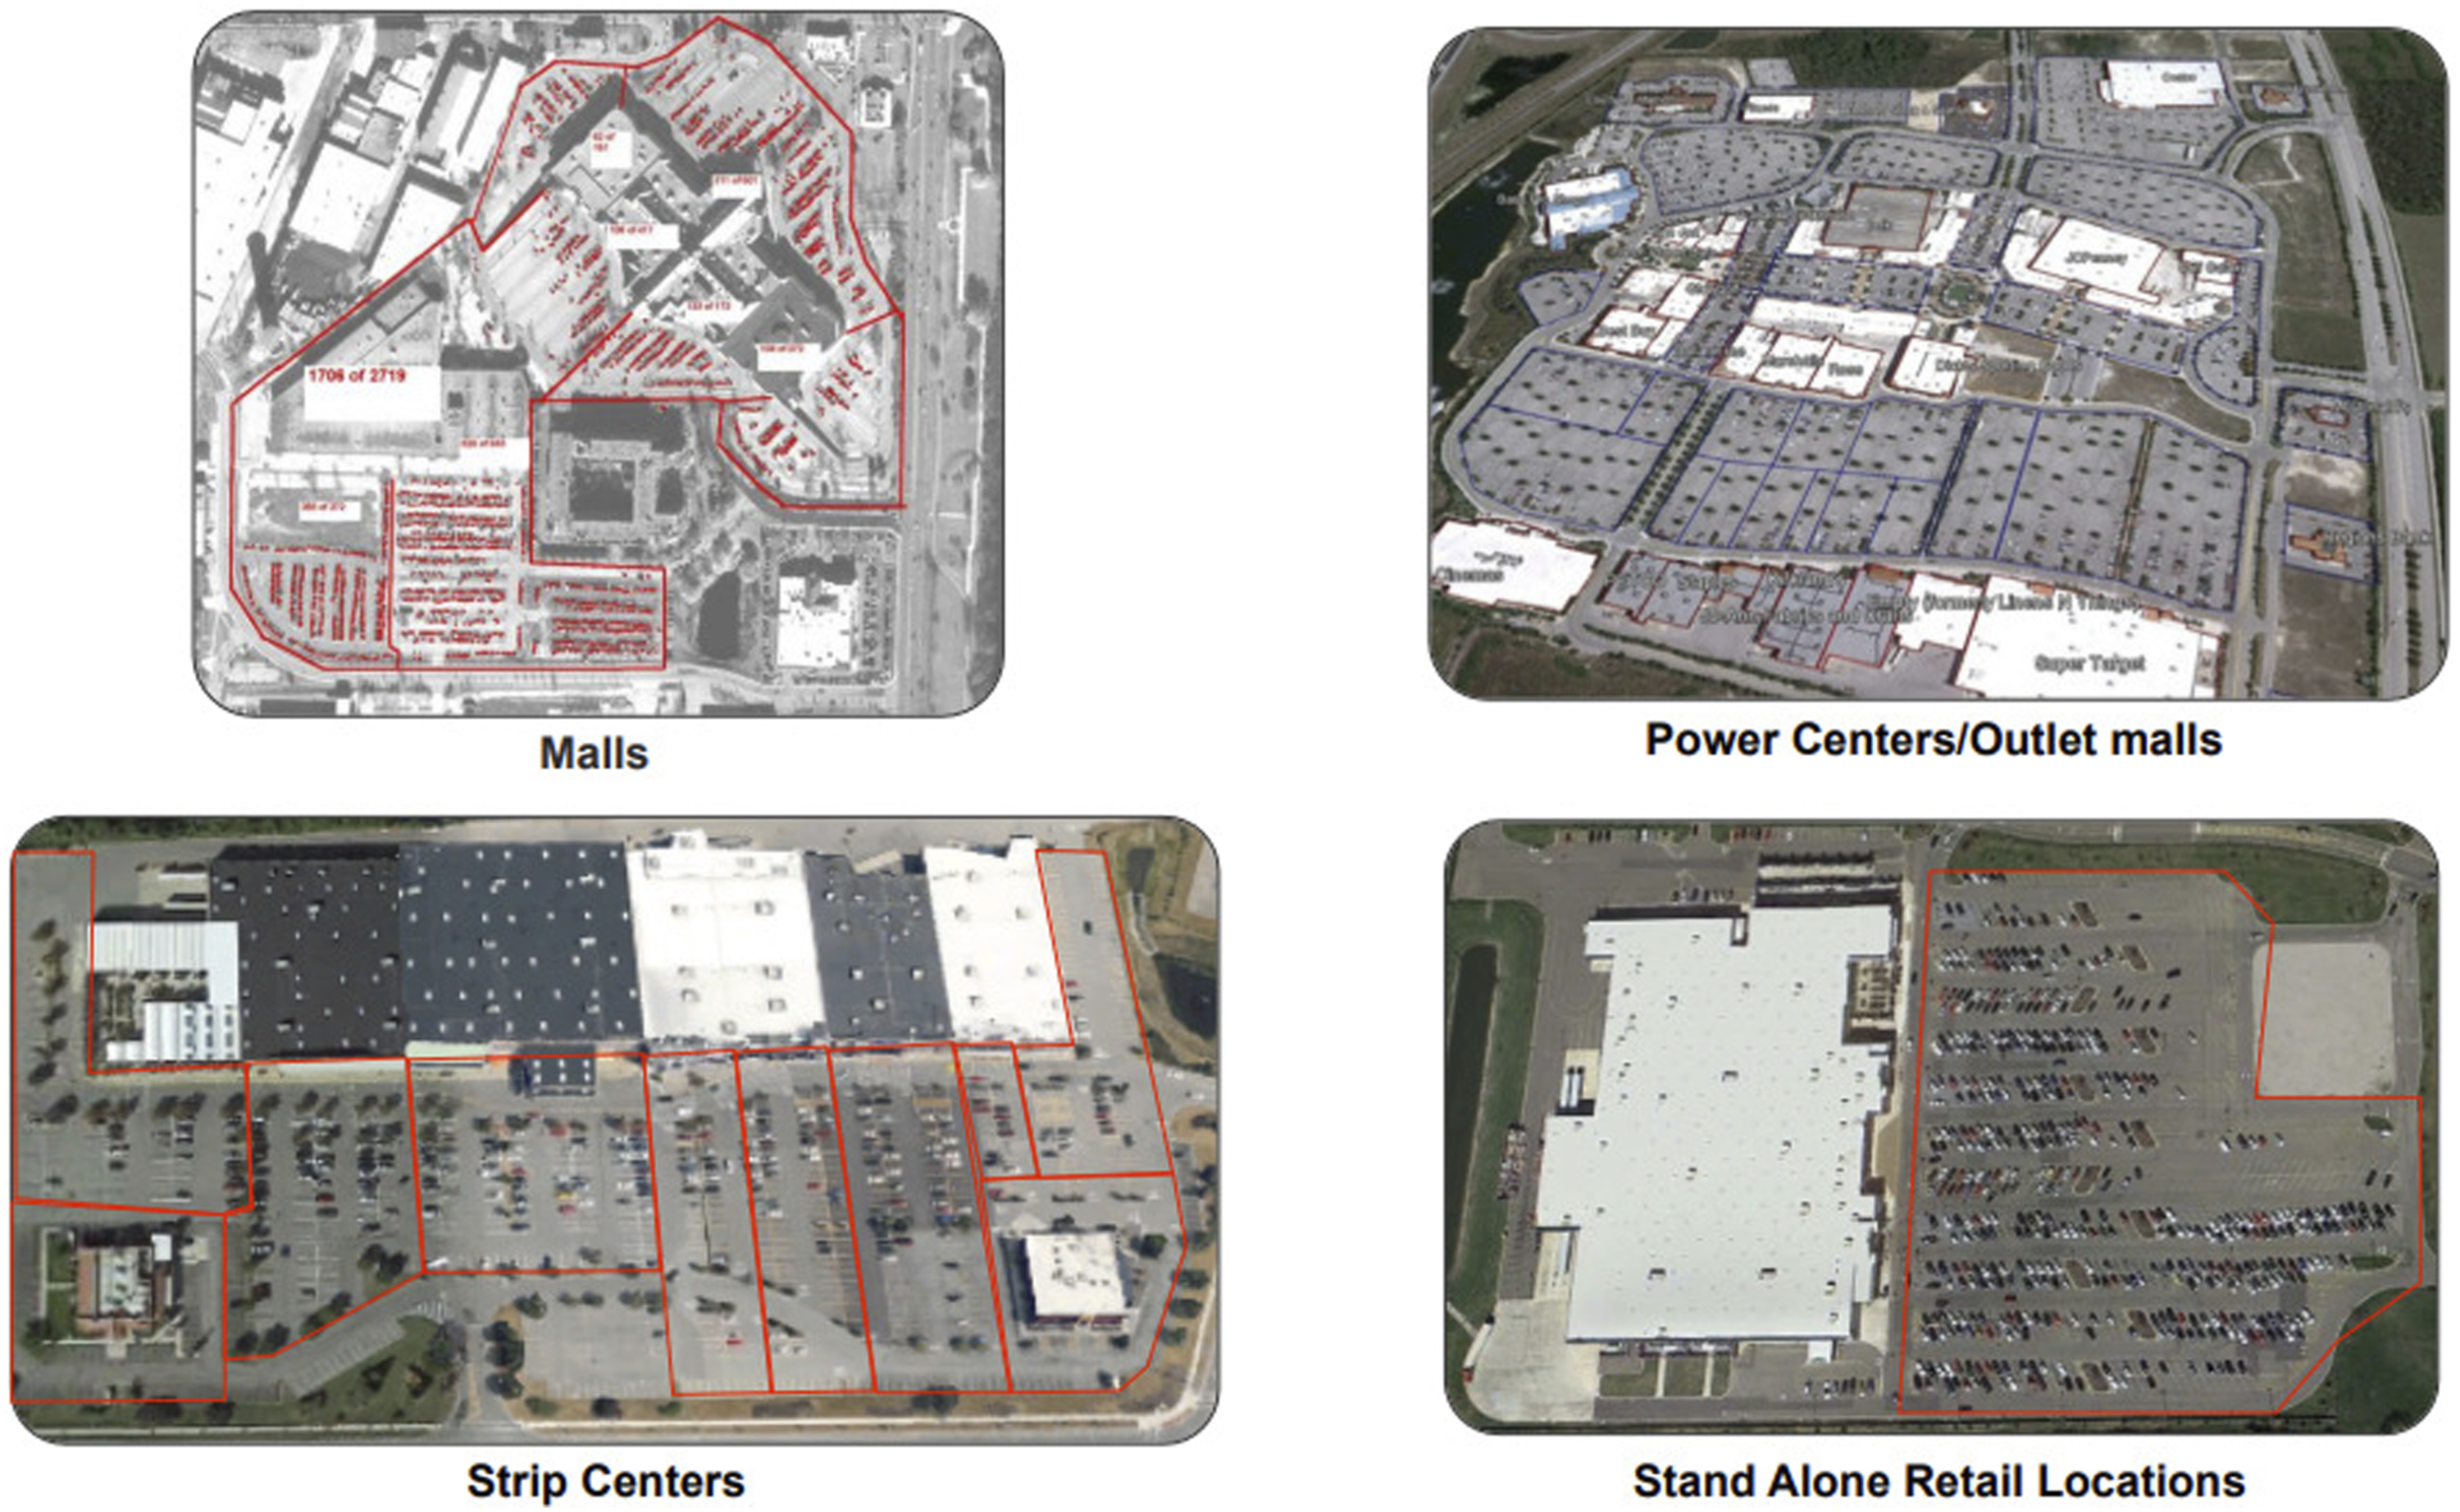
Results
Screened Manuscripts
In this section, we provide a general description of initially collected manuscripts. Figure 8 indicates the evolution of the number of articles in the last decade, showing a steady upward trend in adopting street view or satellite imagery data. It can be expected that deep learning and computer vision techniques will progressively help researchers to tackle a variety of visual tasks in understanding cities and the world. Total numbers of collected manuscripts over the years.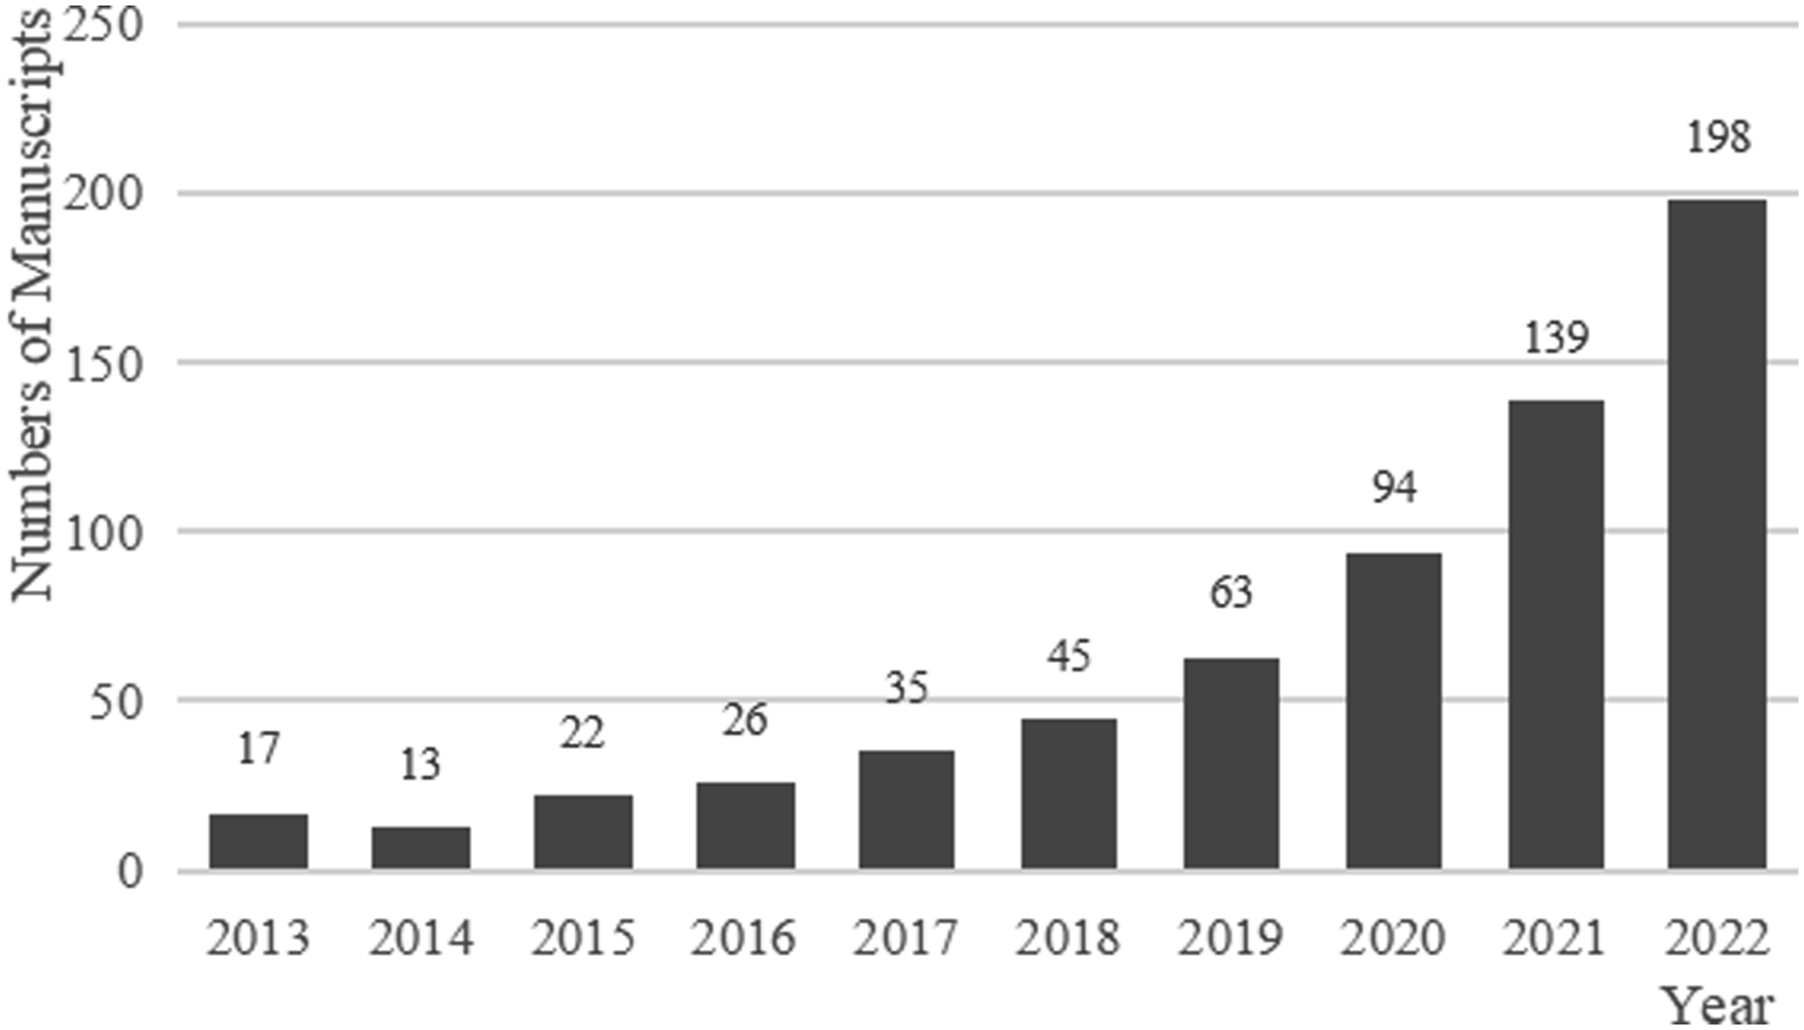
Before going to the formal literature review, Figure 9 further graphically explore how the number of research employing different data sources changes over the years. It can be seen that studies using street views and satellite imageries have significantly increased in recent five years, whereas research with image data from global providers remains at the roughly same level. Numbers of collected manuscripts using different data sources over the years.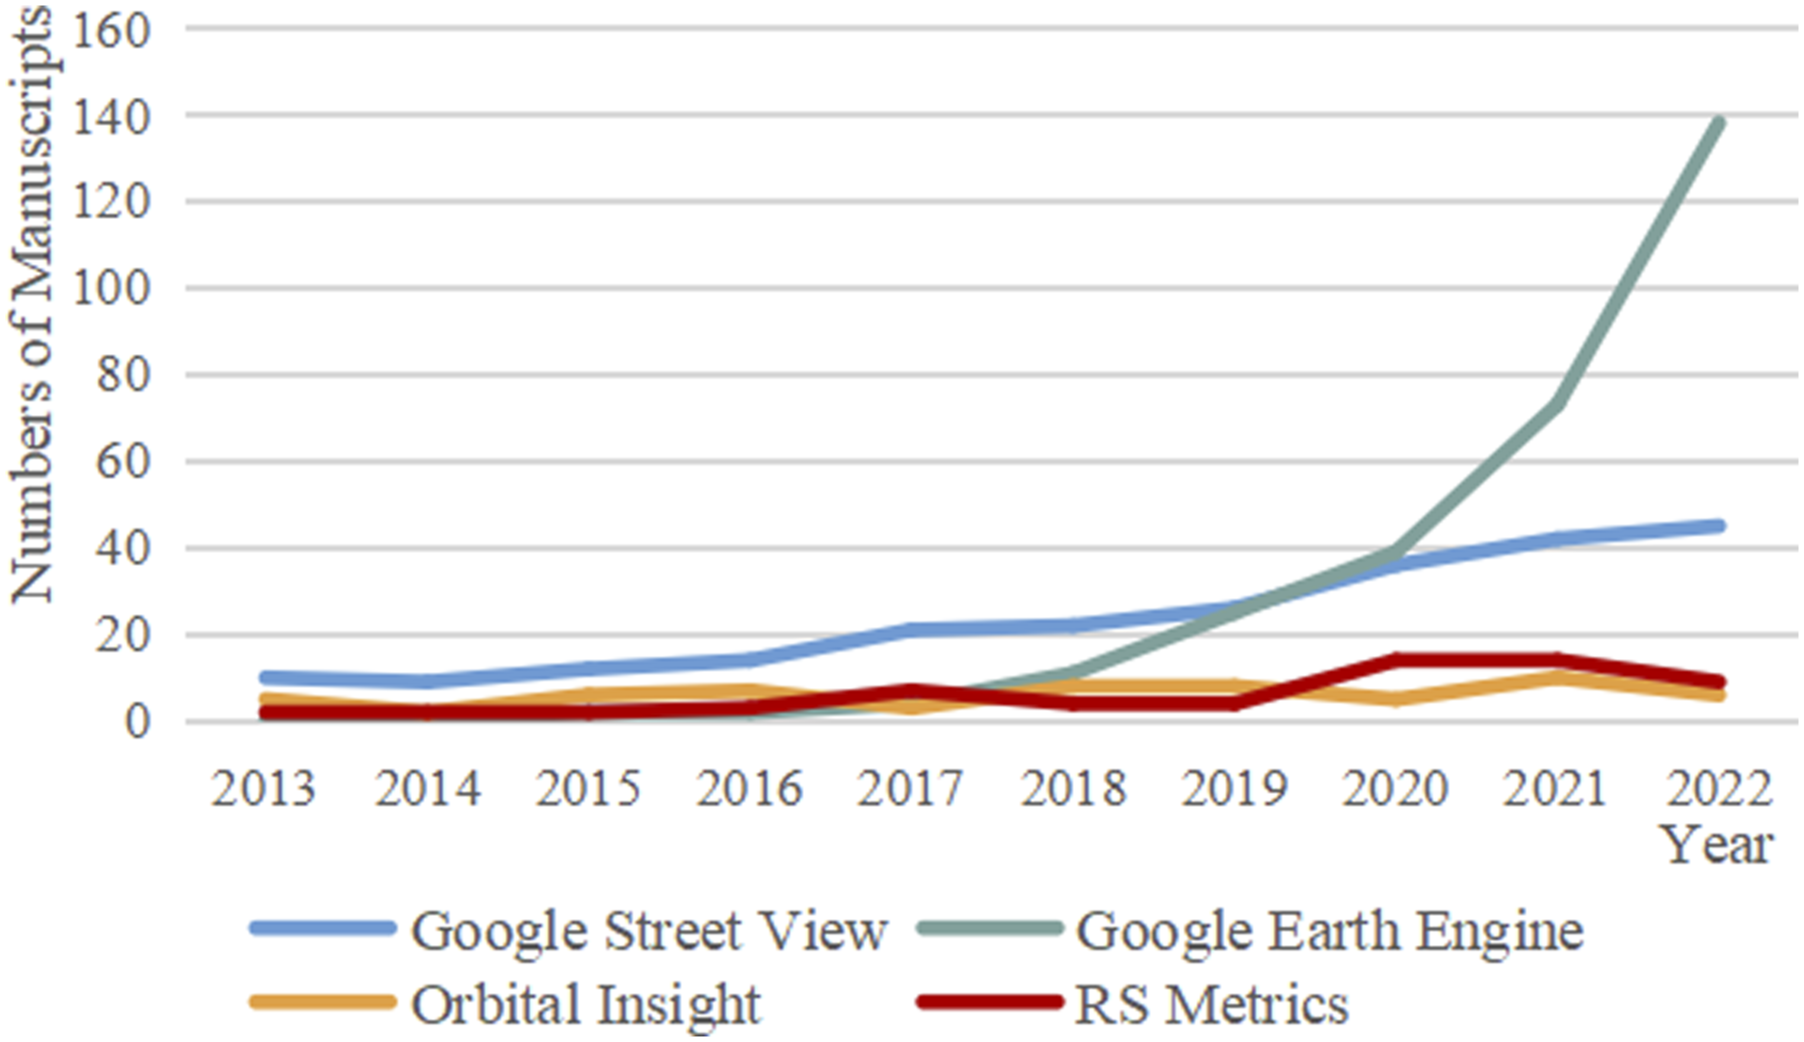
In general, research has improved by using information from remote sensing data. After examining collected manuscripts, the papers are first categorised into three genres according to data sources: Street Views, Satellite Imageries and Processed Street, Aerial and Satellite Imageries (from Orbital Insight and RS Metrics). To rightly emphasise the obtained socioeconomic values from integrating image data, we further establish six thematic clusters for classified manuscripts: Housing and Real Estate Economics, Urban Planning and Public Policy, Criminology and Criminal Justice, Urban Development Analysis and Environmental Impact Assessment, Economic Growth and Development and Reflection of Economic Activities. In such a scheme, it would be clear to understand why these studies stood out from other works.
Computer Vision Techniques
In this section, the basic tasks and algorithms of deep learning and computer vision methods used in screened manuscripts are introduced. 4 Generally, deep learning models are methods with multiple simple but non-linear models, then constructed numerous modules in the form of the multi-layers neural networks, as in Deep Neural Networks, Recurrent Neural Networks and Convolutional Neural Networks (LeCun et al., 2015). Computer vision algorithms, as one of the deep learning models, are capable of achieving from computational social sciences and applied econometrics perspectives (Zheng et al., 2023).
In order to quantify the impact of environmental characteristics and measure the visual feelings of street views, we need to utilise one of the following methods: Semantic Feature Extraction, Visual Perception Quantification, and Categorical Encoding. These computer vision algorithms include Densely connected convolutional networks (Huang et al., 2017), geometric layout algorithm (Naik et al., 2016), Deeplab (Chen et al., 2017), residual neural network (He et al., 2016), highway networks (Srivastava et al., 2015), pyramid scene parsing network (Zhao et al., 2017), Multi-path refinement networks (Lin et al., 2017), other segmentation methods (Peng et al., 2017; Yang et al., 2018; Yu & Koltun, 2015), object detection (Girshick et al., 2014; Redmon et al., 2016; Redmon & Farhadi, 2017, 2018; Ren et al., 2015) and generative modelling (Karras et al., 2017; Goodfellow et al., 2020; Radford et al., 2015). After retrieving information from image data, we integrated it into our primary core research questions to reinforce our findings with further objective evidence.
Conceptually, research approaches for classifying satellite imagery are equivalent to methods applied to street views. Deep learning models, including image recognition, segmentation, object detection and generative modelling, are also conducted to analyse satellite imageries. The core idea of the underlying mechanism behind algorithms is similar to human eyes. The computer captures digital features and creates a cognitive understanding of a realistic scene
In addition, some global providers (such as Orbital Insights and RS Metrics) already processed street, aerial or satellite imageries. Researchers directly benefit from this information advantage without handling image data.
Research Methodological Framework
This section summarises the general workflow of integrating street views and satellite imageries into economics and social science research, as shown in Figure 10. First, scientists obtain street views or satellite imageries from Google, for example. Second, depending on the research topics, researchers choose an appropriate feature engineering technique, such as semantic feature extraction, visual perception quantification and categorical encoding. Third, after the information is retrieved from image data, it can be combined with the original dataset. Fourth, the remaining research approaches regarding modelling processes would be the same as when there is no image data: It involves running regressions, choosing appropriate models, creating visualisations and interpreting the results. The last steps, based on the analysis, produce conclusions about the research question, discuss the implications of the findings and provide policy recommendations. Collaborating with computer scientists or organisations such as Orbital Insight and RS Metrics, economists and social scientists starts from the third step. The research scheme, therefore, would be equivalent to the previous workflow but with more useful and detailed datasets. General workflow of processing image data.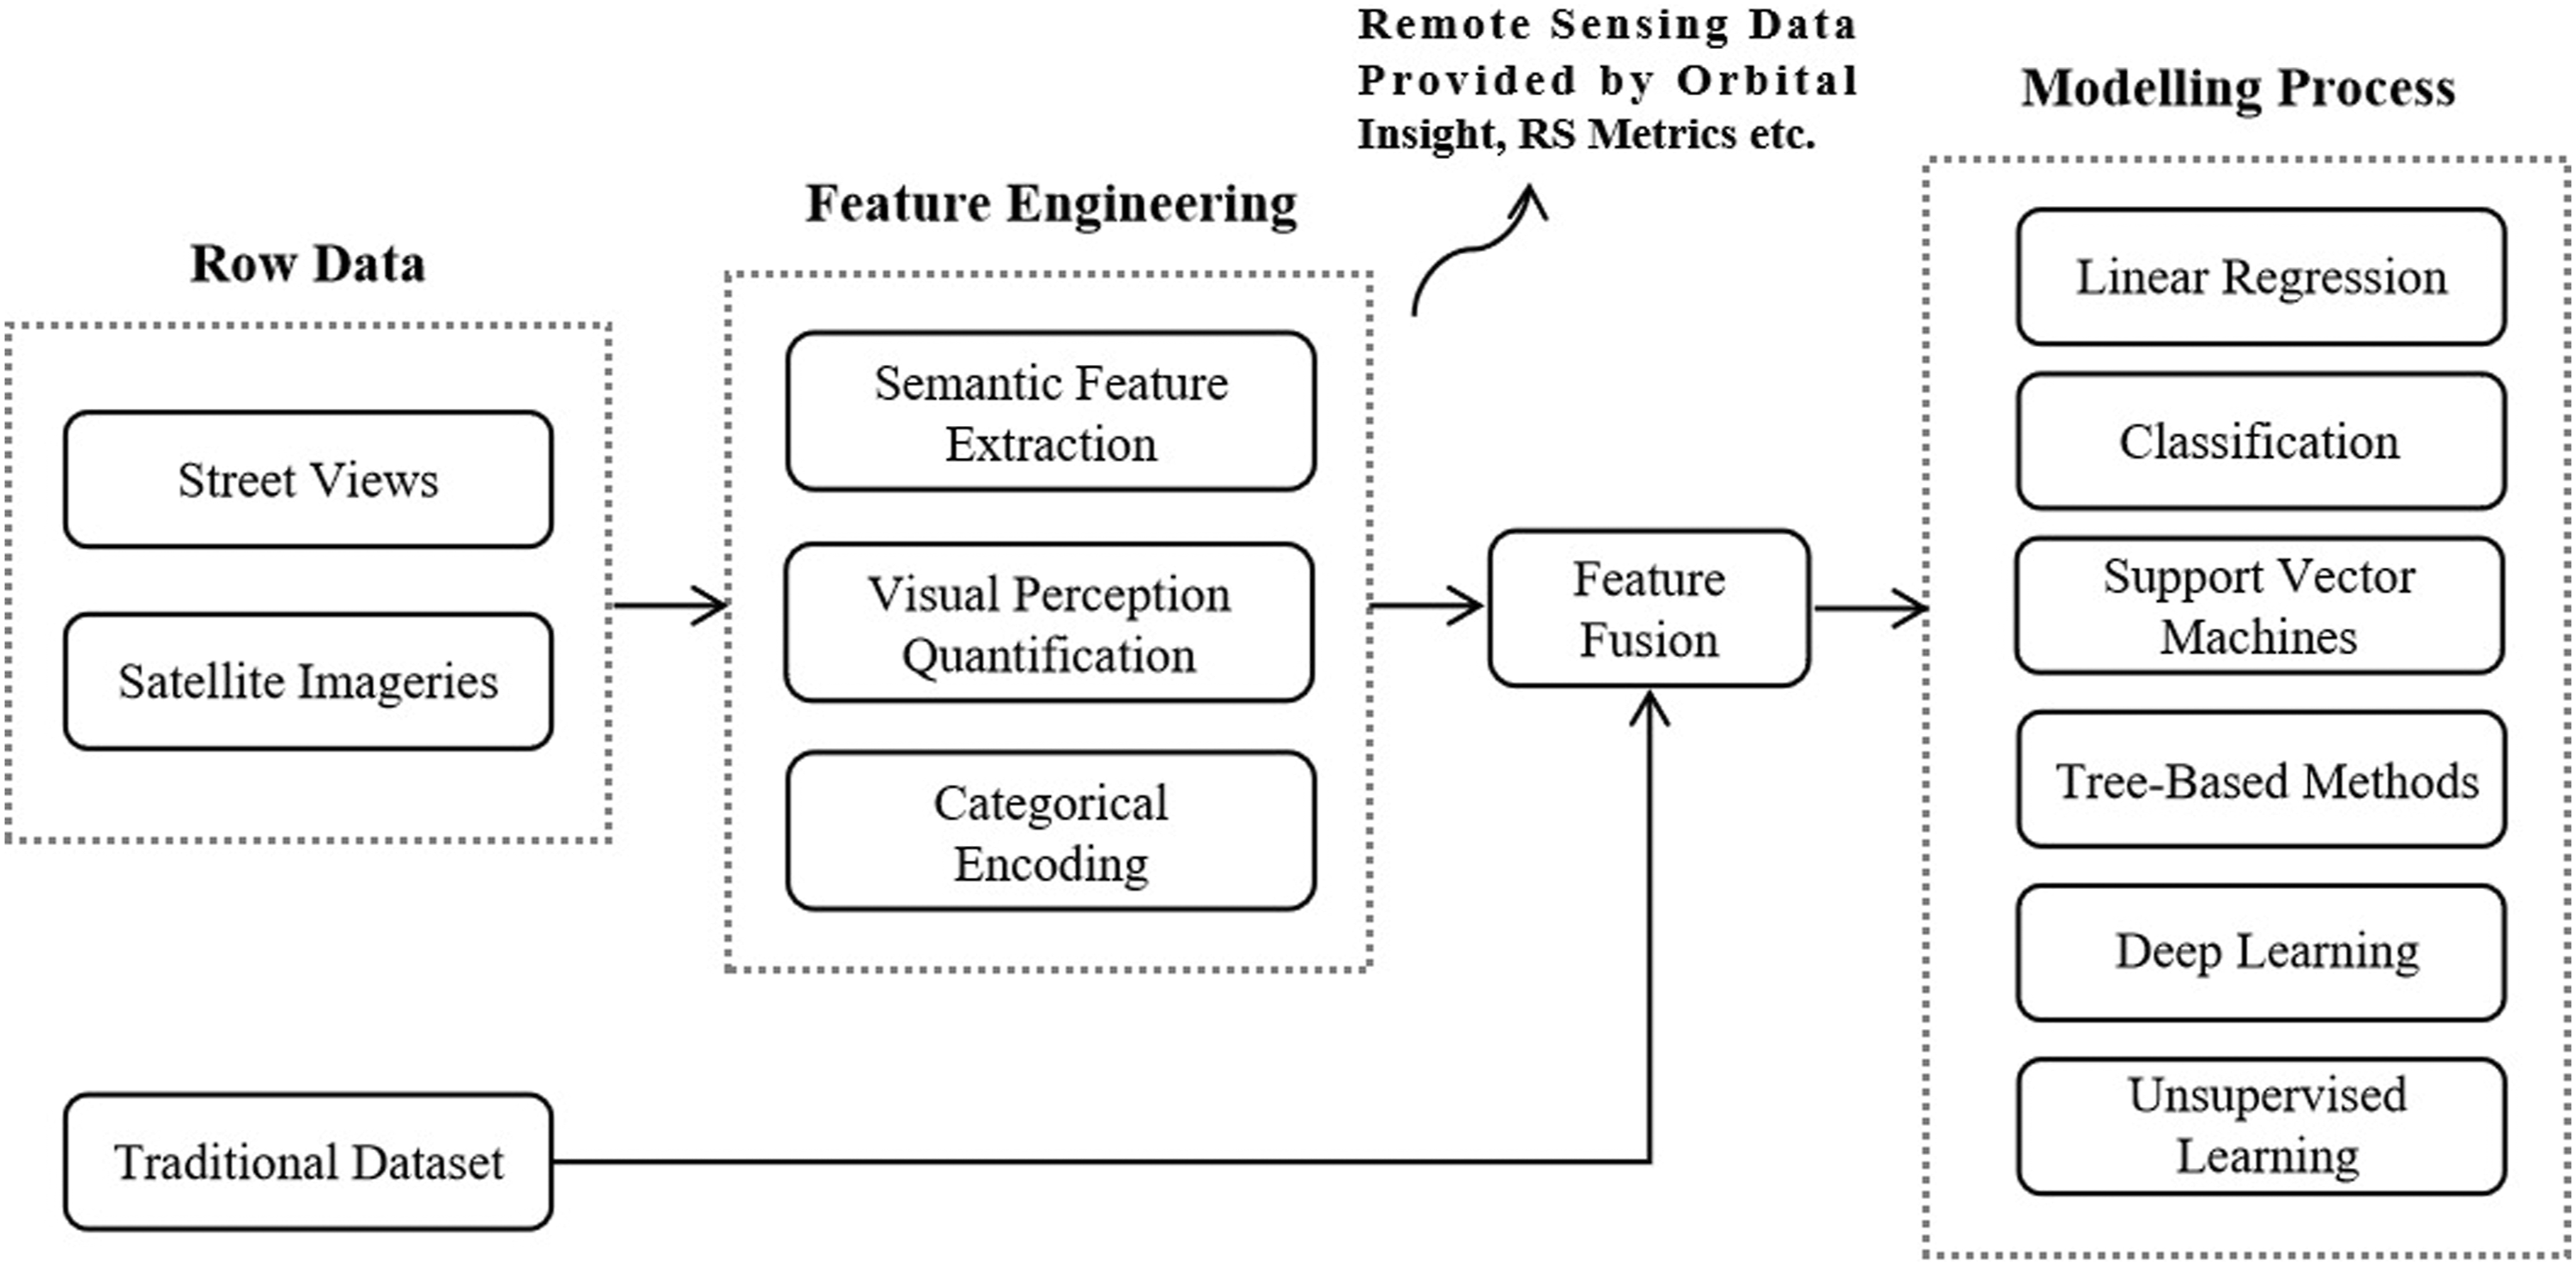
Previously, researchers did not have access to the large amounts of high-quality image data that are now available through satellite imageries, street views and other remote sensing technologies. However, in the last decade, which has been characterised by advances in computer vision and machine learning, combined with the availability of high-quality image data, it has been possible for economists and social scientists to more fully integrate image data into their research. Although it seems difficult for economists and social scientists to use computer vision methods, it is ideal to utilise computer vision techniques and algorithms with sufficient knowledge and understanding to ensure their research is sound and accurate. From a broader perspective, it can be seen as applied econometric approaches (Athey & Imbens, 2019; Mullainathan & Spiess, 2017; Zheng et al., 2023). Collaboration between social scientists and computer scientists can help ensure that the methods are applied correctly and that their results are properly interpreted.
Review and Applications
Street Views
Street views are important in analysing housing prices, urban planning and criminology. Such developments are mainly catalysed by the proliferation of street view resources and improved computer vision techniques. Furthermore, each street view can provide unique insights into the production of landscapes and the built environment. Carlsson (2022) discussed the development of computerised view analysis techniques that help us plan and control the appearance, functionality and symbolism of physical environments. Bader et al. (2017), Ben-Joseph et al. (2013), Bethlehem et al. (2014), Griew et al. (2013), Kelly et al. (2013), Less et al. (2015), Pliakas et al. (2017) and Vanwolleghem et al. (2014) showed that street view-based virtual neighbourhood audits are reliable and cost-effective for assessing neighbourhood conditions, indicating that the measured results by foot-based and street view-based audit tools are in good agreement. It is believed that analysing neighbourhoods and cities from imagery that delivers advanced geospatial knowledge will be the most common and practical strategy for planners (Chen et al., 2016).
Housing and Real Estate Economics
In housing research, it is crucial to explore the relationship between socioeconomic environments and human settlement. Bin et al. (2020), Chen et al. (2020), Fu et al. (2019), Kang, Stice-Lawrence, and Wong (2021), Law et al. (2019), Li et al. (2021), Lyu et al. (2022), Wang (2023), Wu et al. (2022), Xu et al. (2022), Yao et al. (2018) and Ye et al. (2019) utilised street views to estimate housing prices and proposed a neural networks-based methodology to address the issues that the economists had to manually categorise each view in the past and providing new insights into the assessment of human settlement values. Meanwhile, Johnson et al. (2020), Kostic and Jevremovic (2020) and Qiu et al. (2022) found that houses with better street or property design come at a price premium, meaning that proposed methods can efficiently describe visible characteristics. In short, these studies introduce perceived attractiveness as a quantitative measure index into the modelling process of housing issues. It significantly improves the quality of research and further determines which factors of socioeconomic environments affect the suitability of accommodations and prices of properties.
Urban Planning and Public Policy
In urban planning, greenspace and natural environments are associated with physical activity and mental health. Urban street greenery, as a critical landscape design element in the socio-environment, functions in peoples’ aesthetics and sensory feelings (Ulrich, 1984). In addition, neighbourhoods with higher socioeconomic status often have greater financial resources and political influences that support them in building and maintaining greenspace (Wolch et al., 2014). Therefore, a welcoming environment for residents can be seen as important for outside activities, relieving stress and benefiting health conditions (Arbogast et al., 2009; Grahn & Stigsdotter, 2010; Rzotkiewicz et al., 2018). Researchers have conducted surveys, interviews and on-site visits to measure residents’ attitudes and perspectives on urban greenery. Therefore, it is subjective to assess the visual aesthetics of urban environments.
The previous methodologies are costly and time-consuming, and the results may be inconsistent due to different questionnaire designs, disparate interviewers and researchers (Gupta et al., 2012). Objective assessments for measuring urban greenery and environmental characteristics would be more appropriate, efficient and accurate. Feuillet et al. (2016), Han et al. (2022), Helbich et al. (2019), Ki and Lee (2021), Koo et al. (2022), Larkin and Hystad (2019), Lauko et al. (2020), Lu (2019), Lu et al. (2018), Nguyen et al. (2019), Pelgrims et al. (2021), Stubbings et al. (2019), Toikka et al. (2020), Wang et al. (2021), Wu et al., (2020) and Zhou et al. (2019) used imageries based on a neural network-based approach and virtual audit and offered further detailed support for contributing to the development and implementation of healthy cities by evaluating street views for greenery (Green View Index proposed by Yang et al. (2009)), quality and built environment characteristics. A range of above-mentioned applications conducted object-based detection, semantic segmentation and visual perception estimation approaches for understanding the components of an urban scene. These findings foster the development of public policies to stimulate physical activity, promote pedestrian walking environments and relieve the burden of depressive disorders. Street views also provide researchers with a unique and accessible tool to better understand the built environment and its impact on various social, economic and health outcomes (Hoffmann et al., 2019; Javanmardi et al., 2019; Jiang et al., 2020; Keralis et al., 2020; Nguyen et al., 2022; Phan et al., 2020; Wang et al., 2019; Xiao et al., 2020; Yue, Xie, et al., 2022).
Criminology and Criminal Justice
In criminology, opportunity theories emphasise that offenders are increasingly aware of the importance of places of crime to identify criminal opportunities and targets (Eck & Weisburd, 2015). Militants select possible targets for terrorist attacks with the aid of mapping applications (Vandeviver, 2014). Graffiti writers and shoplifters seek new targets via street view applications (Kindynis, 2014). Meanwhile, police forces use computer-aided crime mapping techniques to promote social justice (Chainey & Tompson, 2008).
Researchers are increasingly studying the relationship between the built environment and crime, such as the impact of street lighting and surveillance cameras on crime rates. Street view applications make it efficient to address various issues related to on-site crime. Deng et al. (2022), He et al. (2017), Jing et al. (2021), Khorshidi et al. (2021), Kondo et al. (2017), Naik et al. (2014), Sas et al. (2022), Sytsma et al. (2021), Zhou et al. (2021) and Yue, Antonietti, et al. (2022) utilised street view images to discern the characteristics of the built environment for drug activities and street robberies. These studies empirically support the broken window theory and reveal that built environments induce crime and violence. Places lacking place management (e.g. places with abandoned cars on streets, graffiti and decayed street lighting) represent built environments for crimes. In practice, these findings encourage the police to patrol neighbourhoods with signs of the foregoing disordered characteristics and policymakers to plan crime prevention and urban renewal projects.
Satellite Imageries
Scientists and researchers have recently employed satellite imageries to analyse changes in, for example, the cityscapes and map trends of an area and to measure differences in the Earth’s surface. Owing to powerful computer science methodologies, it is now possible to rapidly and accurately process vast amounts of satellite imagery, providing further information to support current analysis (Jain, 2020; Pandey et al., 2021; Patino & Duque, 2013; Rashed et al., 2005).
Satellite imagery provides researchers with a more comprehensive view of the Earth’s surface than was previously possible. In the past, researchers had to rely on ground-level observations and surveys, which were limited in scope and scale. With satellite imagery, researchers now can study large areas of land and city, which can be especially useful in studying global phenomena such as climate change, economic trends and business cycles. Additionally, satellite imagery has made it easier to study changes, as researchers can compare images taken at different times to identify patterns and trends.
Urban Development Analysis and Environmental Impact Assessment
To better understand human life and environmental changes, Andries et al. (2019), Burke et al. (2021), Engstrom et al. (2022), Hargreaves and Watmough (2021), Hersh et al. (2021), Huang et al. (2021) and Watmough et al. (2019) extracted additional information (such as the number and density of buildings, length of roads, housing quality and vegetation patterns) from satellite data, predicting and explaining variances in household wealth to support sustainable development and improve socioeconomic conditions. These findings aid the mapping of homestead characteristics, local land uses and agricultural productivity. Adhikari & Dhital (2021), Chanda & Kabiraj (2020) and Lessmann & Seidel ( 2017) combined spatial demographic data at the district level with satellite data to analyse regional inequality, convergence and growth.
Abd-Elmabod et al. (2022), Baydogan and Sarp (2022), Iheaturu et al. (2022), Malah and Bahi (2022), Mushore et al. (2022) and Zhu et al. (2022) utilised satellite imageries and remote sensing data for urban development analysis as reliable urban land use, land cover and land surface temperature. Such data are crucial for land use planning that can help us solve the increasing pressures of rapid urbanisation and environmental problems. Satellite imagery can be used to study changes in the environment, inform agricultural practices and policies, understand the impact of human activities on the environment and track the expansion of cities and the associated changes in land use patterns (Harari, 2020; Luo & Wu, 2021; Olivia et al., 2018).
Economic Growth and Development
Nighttime lights emitted by cities, towns and other human settlements can be detected and measured using satellite imagery. The brightness and distribution of nighttime lights can be used as a proxy for economic activity and development, as cities and urban areas tend to have higher levels of economic activity than rural areas (Doll et al., 2006). Satellite imagery provides a way to monitor changes in nighttime lights over time, allowing researchers to track trends in economic growth and development. For example, researchers have used satellite imagery to examine the relationship between nighttime lights and economic growth, finding that the percentage of nighttime light-covered areas strongly correlates with economic growth.
Bickenbach et al., 2016; Bluhm & Krause, 2022; Cauwels et al., 2014; Chanda & Cook, 2022; Chen et al., 2022; Elvidge et al., 2012; Henderson et al., 2012; Hu & Yao, 2022; Liu et al., 2021; McCallum et al., 2022; McCord & Rodriguez-Heredia, 2022; Pérez-Sindín et al., 2021; Weidmann & Schutte, 2017; Xu et al., 2021; Yeh et al., 2020 used nighttime light estimations to construct a wealth index to measure economic well-being and provide a decision-making basis for areas facing impoverishment. Similarly, Gibson et al. (2020), Gibson et al. (2021), Goldblatt et al. (2020), Luu et al. (2019), Maldonado (2022), Mellander et al. (2015) and Proville et al. (2017) explored the relationship between nighttime lights and economic activity, finding that differences in lights intensity relate to variations in economic activity. Dasgupta (2022) used nighttime lights, electricity usage and precipitation to predict the short-term impact of economic shocks during the outbreak of COVID-19. Castells-Quintana et al. (2021) established a global non-linear effect of climate on urbanisation with climatic, census and satellite data.
Overall, nighttime lights and satellite imagery provide valuable data for studying economic growth and development, as well as their impacts on the environment and society (Deng et al., 2008). By analysing patterns and trends in satellite imagery, researchers can gain insights into the complex relationships among economic activity, urbanisation and environmental change (Sutton & Costanza, 2002).
Reflection of Economic Activities
Various economic activities can also be indirectly captured and observed in satellite imageries, thereby helping analysts and policymakers make better decisions. Zhao et al. (2011) examined the interactions between economic development and environmental change through the Chinese GDP change map produced by nighttime satellite imageries. Hendricks et al. (2014) estimated the response of corn and soybean acreage to price shocks by using satellite imagery. Elliott et al. (2015) examined the impact of typhoons on local economic activity by historical typhoon track data along with satellite-derived nightlight intensity data. Henao-Cespedes et al. (2022) and Minetto et al. (2020) analysed how human and economic activity changed during the COVID-19 pandemic on a city scale. Go et al. (2022) measured local economic activities using vehicle counts in satellite imageries, estimating the impact of the new infrastructure on the local economy. Mothobi & Grzybowski (2017) measured the level of infrastructure deficiency by nighttime light intensity to analyse the effects on mobile telecommunications, hoping to overcome the poor adoption of mobile money and deficient financial services in Africa. Baragwanath et al. (2021) identified the spatial distribution of economic activity and urban markets with satellite imageries. Mukherjee et al. (2021) assessed the impact of satellite estimates on macro uncertainty, finding that satellite estimates are so effective in obtaining information that we do not need to rely heavily on government announcements for macro information. Chodorow-Reich et al. (2020) used cross-sectional differences in nighttime light growth to measure the effects of Indian banknote demonetisation in 2016.
Processed Street, Aerial and Satellite Imageries
In addition, there are some global providers of signals and big data derived from large-scale analysis of satellite and aerial imageries, as well as other geospatial data sources. Knudsen et al. (2021) argued that businesses with a competitive advantage have access to unique and valuable data, such as satellite imageries, and the best available technologies to exploit structured and unstructured data. Investors and business managers directly benefit from this information advantage by utilising already processed satellite imagery data to measure the performances of stores without handling image data. Gerken and Painter (2019), Kang, Zhang et al. (2021), Katona et al. (2018) and Zhu (2019) identified that institutional investors incorporate the information signals retrieved from remote sensing data into their trades by analysing parking lots in front of store outlets to predict their sales. Feng and Fay (2022) studied the effect of parking lot traffic derived from satellite images on forward-looking retailer performance.
Moreover, Tang et al. (2022) predicted future-period consumption expenditure at the community level by using the vegetation index downloaded from Google Earth Engine and then converted it to monthly remote sensing data. Guo (2021) estimated the effects of straw burning on urban air quality by using satellite data obtained from the Ministry of Ecology and Environment of China. Lai et al. (2022) examined the impact of air pollution on human cognitive health by using household health surveys along with PM2.5 emissions derived from remote sensing data. Jiang et al. (2021) explored the relationship between sulphur dioxide pollution control and rapid economic growth by using satellite observations and economic model simulations.
Discussion
Street views and satellite imageries cover many areas and could help us retrieve information from built environments, neighbourhoods and cities. Recent studies integrate these image datasets with other data sources, such as housing transactions, healthy investigations and criminal records, to further explore topics that had not been investigated due to the limitations of computing power or image data availability. By using image data, researchers can usually validate theories and policy results or enhance their predictive power.
General Observations
Overall, the use of satellite imagery provides several benefits. First, satellite imagery can cover large areas of the Earth’s surface quickly and efficiently. This makes it easier for researchers to study large-scale phenomena and identify patterns and trends. Second, satellite imagery can be used to study areas that are difficult or dangerous to access, such as remote regions or disaster-stricken areas. Finally, satellite imagery provides researchers with a detailed and accurate view of the Earth’s surface, which can be used to inform policy decisions and guide future research efforts. Unsurprisingly, the use of satellite imagery has revolutionised many fields of research, providing researchers with a powerful tool for studying and understanding complex associations among economic systems, environmental change and sociocultural evolution processes.
Obstacles
Although researchers focus on economic and sociological issues (as opposed to computer vision and deep learning methodologies themselves), most have applied these techniques in their work without detailed explanations about how to process image data. We found some research interesting and useful, but the authors commonly did not describe technical details or share their developments of trained models, which inhibits reproducibility and replication. In addition, the street views, satellite imageries and remote sensing data that researchers currently use are not openly available in general, and some are from commercial services with a restrictive licence. This also restricts reproducibility and replication and constrains the further development of such analyses.
Limitations
To the best of our knowledge, no research has used panel image data. This is because most services are not allowed to grasp historical image data (e.g. Google Street Views data). We could only retrieve the current street views by their API, but we do not know exactly when the images were generated. Hence, unless we periodically download the street view data over a long period, we will not be able to obtain such panel data. This also leads to another issue: In some regards, our control variables for the case studies cannot match the streetscape feature regarding time dimensions.
Another limitation is that street views in some places are not available or usable, and Street View Static API oddly returns grey generic images, invalid street view images such as the interior of buildings, imageries that are too dark for features to be discerned and places that are under construction and, consequently, should not be included in studies. In addition, Google unfortunately has not fully covered developing countries yet, it is therefore impossible to conduct similar research in the least developed countries.
Implications
In this field, various research gaps can be explored because image analysis brings another insight that can support decision-making. Recent developments in computer vision and deep learning have enabled social scientists to utilise new and more readily available data sources to solve old problems. Importantly, as in the foregoing discussion, we do not have to manually classify images or scrutinise the characteristics in imageries as computer vision techniques aid in retrieving information and detecting features. It is now possible to further understand human spatial perception and sensory feedback on environments through deep learning algorithms. Meanwhile, it would be interesting to make cross-country comparisons to analyse and compare the effect of policies. Such efforts would make it possible to compare the effect of environments on disparate cities or different races under the same policy.
Future Directions
First, we can utilise imagery data to find which objects on the streets affect housing prices, which can help us understand the human aesthetic perception objectively for urban planning and aid policymakers in imposing regional policies to enhance residential living quality. Second, we can calculate the use of daytime and nighttime lights to measure economic activities as a proxy of consumer traffic and infrastructure deficiency to further provide insights into inventory and delivery problems in operation management. Of note, the relationship between consumer traffic/level of infrastructure deficiency and daytime/nighttime lights is similar to that between wealth and nighttime lights, which is worth exploring from our viewpoint. Next, by remoting sensing data, we could employ parking lot availability retrieved from image data to measure a proxy of the growth of customers showing up at stores. We may then further explore the competition relationship among disparate stores in an area or even construct a consumer network to determine the flow and, consequently, the best time to promote and advertise products.
Conclusion
Satellite- and street view-based methods represent significant advantages in recent research owing to their reasonable cost and broad ranges of use. As shown in various studies, remote sensing data can provide additional information, leading to better decisions and solutions. Nevertheless, these image data cannot completely replace the original data used to address certain questions. This suggests that we should integrate these data to train our model to achieve more precise predictions and greater interpretability. Therefore, transparency of trained models and data availability are vital to guiding the follow-up research being operationalised. Since there is an overwhelming number of ways by which researchers can process image data, we hope social scientists will increasingly adopt such a methodology to a wide spectrum of topics because the focal points of much research remain limited to specific topics in the social sciences.
Overall, integrating street views, satellite imagery and remote sensing data into economics and social science research has some benefits. First, it can help us better understand the complex interplay between human activity, environmental change and socioeconomic development. Second, by leveraging these powerful technologies and image data, we can gain new insights into some of the most pressing challenges facing society today and work towards creating a more sustainable and promising future.
Footnotes
Declaration of Conflicting Interests
The author(s) declared no potential conflicts of interest with respect to the research, authorship, and/or publication of this article.
Funding
The author(s) received no financial support for the research, authorship, and/or publication of this article.