
Abstract
The increasing volume of “Big Data” produced by sensors and smart devices can transform the social and behavioral sciences. Several successful studies used digital data to provide new insights into social reality. This special issue argues that the true power of these data for the social sciences lies in connecting new data sources with surveys. While new digital data are rich in volume, they seldomly cover the full population nor do they provide insights into individuals’ feelings, motivations, and attitudes. Conversely, survey data, while well suited for measuring people’s internal states, are relatively poor at measuring behaviors and facts. Developing a methodology for integrating the two data sources can mitigate their respective weaknesses. Sensors and apps on smartphones are useful for collecting both survey data and digital data. For example, smartphones can track people’s travel behavior and ask questions about its motives. A general methodology on the augmentation of surveys with data from sensors and apps is currently missing. Issues of representativeness, processing, storage, data linkage, and how to combine survey data with sensor and app data to produce one statistic of interest pertain. This editorial to the special issue on “Using Mobile Apps and Sensors in Surveys” provides an introduction to this new field, presents an overview of challenges, opportunities, and sets a research agenda. We introduce the four papers in this special issue that focus on these opportunities and challenges and provide practical applications and solutions for integrating sensor- and app-based data collection into surveys.
Our everyday activities increasingly involve being connected: writing and receiving emails, communicating through messengers, filling out electronic forms, making electronic payments, and connecting to friends on social networks. Smartphones that are often used for these activities are rich with sensors that continuously collect data about us. In recent years, the number of sensors in common smartphones has grown continuously (Figure 1). Those sensors count the steps we take, guide us by using the geolocation of our smartphones, and allow us to take photos and videos. Voice-activated digital assistants such as Alexa or Siri, smart fridges, and smart energy meters are increasingly becoming part of everyday life. Sensors on the streets guide traffic, collect video footage, and measure weather conditions. The breadth and richness of the sensor data that have previously been accessible to exclusive groups of researchers but now can be collected and shared by everyone who owns a smartphone, provide social scientists with ample opportunities to gain insights into human behavior. Psychological science has utilized the passively collected data, that is, data collected without the active involvement of an individual, to answer various research questions (Harari et al., 2016). Other social sciences also have immense potential to utilize these sensor data and to integrate them with self-report data to gain a better understanding of individual and group behavior, thereby transforming our understanding of individuals, organizations, and societies (Lazar et al., 2009).
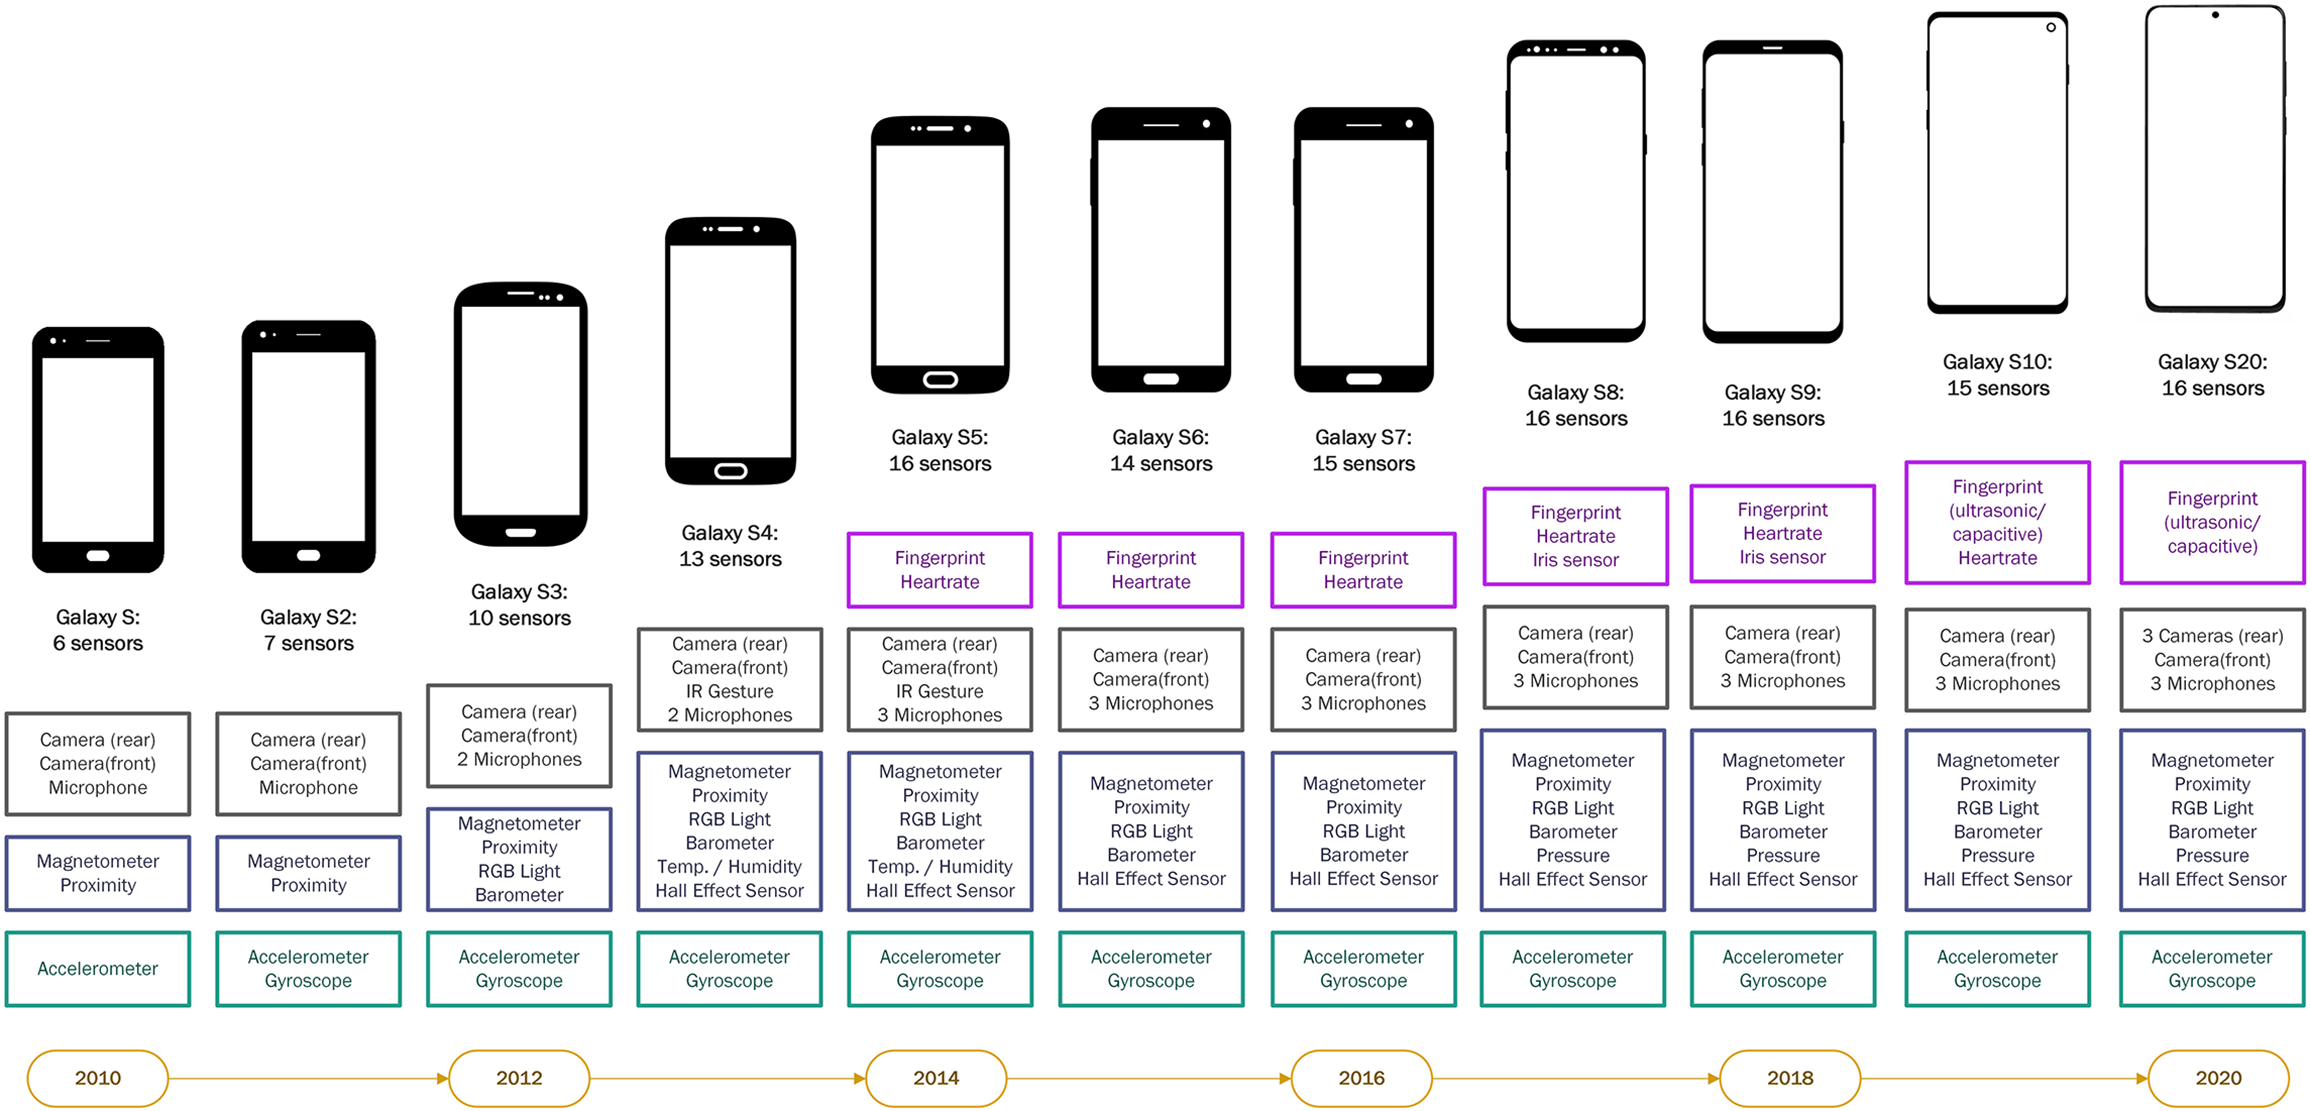
The number of embedded smartphone sensors has been continuously increasing.
Social science research is gradually transitioning to digital research methods. It is becoming standard practice to observe behavior, ask questions, and conduct experiments online (Salganik, 2018), and linkage of self-report data to passively collected data is becoming more common (Stier et al., 2020). Many of these new digital research opportunities are due to the widespread use of technology, its increased affordability, and integration in the daily practices of individuals. Smartphone adoption and engagement in activities that are performed on smartphones have recently risen worldwide and are projected to further increase (GSM Association, 2020). Most likely, the activities performed on smartphones will also diversify. These developments allow social scientists to transform studies that have traditionally been carried out on paper or through infrequent interviewing (e.g., diary studies about food consumption, spending, or travel behavior) to be performed in situ. The combination of passively collected sensor data and self-reports allows coupling objective information about the behavior with subjective attitudes about the reasons for or perceptions of the behavior. Information about structures of relationships and interactions collected from call records or physical proximity measures can be supplemented with information about the content of these relationships that is collected through longer self-report questionnaires or short in-the-moment questions, the so-called experience sampling method (ESM) or ecological momentary assessments (EMAs).
Early studies that utilized sensor data have focused on issues of practical implementation and exploration of the new methodologies, more so than issues of representation and measurement quality. Conversely, representation and measurement have been in the focus of survey methodology for a long time. The application of well-established frameworks such as the total survey error framework (Groves, 2010) can provide a useful tool to guide methodological and practical decisions in sensor-based data collection. Advancements in survey methods have always been coupled with technological progress (Groves, 2011). Survey researchers have used mobile phones for conducting telephone surveys (e.g., Häder, 2012; Kühne & Häder, 2012), text messaging surveys with and without interviewers (Schober et al., 2015), mobile web surveys (Couper et al., 2017), and chatbot-administered messenger-like web surveys (Toepoel et al., 2020). A large body of empirical evidence has accumulated about the opportunities and issues that are faced by the surveys completed via mobile devices. This body of evidence serves as a basis for practical recommendations for survey implementation on mobile devices (see, e.g., Antoun et al., 2018). Similar developments should take place for collecting sensor data about human behavior and integrating sensor data with self-reports.
In this special issue, we have compiled studies on state-of-the-art applications that combine the collection of sensor data with surveys demonstrating the scope of what research questions can be answered, how the study design can be implemented, and address the issues of designing studies with sensor components. The studies also identify pitfalls for selection and measurement when combining the two data sources. Compiling such evidence allows us to identify gaps in the knowledge on how to effectively implement sensor data collection in the social sciences and to set the research agenda for future studies. In this editorial, we first provide some clarification about the terminology on sensors and apps and then focus on opportunities for measurement and benefits of utilizing sensors for social science research. Next, we review potential challenges of such data collection. Finally, we identify knowledge gaps and points that should shape future studies.
Smart Devices, Sensors, and Apps: Terminology and Delineation
The new modalities for data collection can include smartphones, other wearable smart devices (e.g., fitness trackers), nonwearables connecting through Bluetooth (e.g., smart home appliances), and other sensors (e.g., environmental sensors). Smartphones and other smart devices offer a rich tool for social research going beyond surveys. Research studies may access smartphones’ functions that individuals use for communication or to take photos, audios, and videos to better understand an individual. Furthermore, different functions on smartphones as well as different sources of sensor data can be combined. For example, Wang et al. (2014) combined light sensors, sound sensors, and accelerometry to detect sleep patterns of students. The contribution by Sepulvado et al. (2020) in this special issue uses fitness trackers and social network data of students obtained from students’ smartphones using communication logs (calling, texting, or WhatsApp messages) to better understand students’ network structures.
Central to smartphones and smart devices are apps. Apps are pieces of software installed on devices that allow interaction with the functions on the device. For example, an app can be used for asking participants survey questions, but it can also be used to collect information already stored on the smartphone or assemble information that is recorded with one of many sensors that are built into the smartphone. Apps can aggregate and process this information, store it, and transfer the data to a database outside the phone. For example, studies by Bähr et al. (2020) and English et al. (2020) in this special issue use apps that administered questions to respondents at different moments throughout the day.
Another reason why smart devices are so useful for social research is that they are equipped with a range of different sensors. Common sensors include those that detect movement (such as accelerometer or gyroscope) and location (such as Global Positioning System [GPS]), communication sensors (such as Bluetooth, Wi-Fi, cellular), and sensors measuring the environment (such as barometer, temperature, light, camera, microphone). Smartphone apps can be used to collect and process data from these sensors. Wrist-worn or waist-worn devices or pedometers include similar types of movement sensors and are often better positioned to study movement of the individual rather than movement of the smartphone device. Because both smartphones and other smart devices are generally “always-on,” they can also be used to collect and process data almost continuously.
In general, there are two ways to collect sensor data from mobile devices for social science research. Sensor data can be collected via apps that are installed on the participants’ device or via Internet browsers (e.g., in a mobile web survey). The app-based approach allows for a relatively continuous data collection during a comparatively long time period (e.g., Bähr et al., 2020). For instance, for GPS data, researchers can track geographical motion profiles of participants to infer their travel behavior. Conversely, in the browser-based approach, participants do not have to download an app or a software to take part in a study. Data are collected via program codes that are implemented, for example, in the pages of web surveys (Schlosser & Höhne, 2020). Such an approach is compatible with many existing major national and international web-based social surveys. However, data collection is restricted to the browser that hosts the web survey, which only allows for the collection of data while respondents are using the browser rather than a continuous data collection. Moreover, sensors whose data are combined with self-report data do not have to be embedded on smartphones and can be used as stand-alone data sources. For example, English et al. (2020) in this issue integrate data collected from environmental sensors placed throughout different parts of the city with participants’ self-report data.
Benefits and Opportunities Offered Through Sensor and App-Based Data Collection
Integrating sensor measurement and self-reports has many benefits for measurement. First, passively collected data allow us to employ new forms of measurement that include in-situ data collection. Examples of in situ measurements are EMA, passive measurement of geolocation and physical activity, and active measurement when participants are using their cameras to take photos or videos or measuring blood pressure with a Bluetooth-enabled external device.
Second, the data collected through (smartphone) sensors are very detailed: an accelerometer sensor with 60 Hz frequency collects 60 measurements along three axes per second. Apart from being rich in terms of intensity of collection, sensor data can be rich in their breadth. For example, the project described in English et al. (2020) in this special issue used environmental sensors that collected information about temperature, pressure, humidity, and air pollutants, and some sensors collected information about sound, vibration, and imagery. Bähr et al.’s (2020) app described in this special issue collected data on geolocation, physical activity, device use, communication patterns, and ethnic composition of social networks of the participants based on name classifiers.
Third, sensor data can potentially reduce measurement errors by providing more objective data without recall and other errors known from self-reports. For example, previous studies compared conventional travel diary studies in which participants had to self-report all their trips with passive tracking of geolocation and other sensors for trip detection. In conventional travel surveys, trips were often not recalled (Lynch, 2017; Scherpenzeel, 2017; Stopher et al., 2007). Smartphone activities are often overestimated by smartphone users compared with passively collected data on calls and text messaging (Boase & Ling, 2013), use of maps, news, and online music (De Reuver & Bouwman, 2015). Moreover, in situ measurement of geolocation can act as a prompt to aid recall in a time use diary (Haas et al., in press; Yan & Conrad, 2019). Sensor data collection could reduce social desirability bias, to which self-reports are susceptible.
Collecting data at scale is a fourth benefit of sensor measurement. Observational data that were previously gathered from small samples in a lab can now be collected directly from participants’ devices at unprecedented numbers. For example, MacKerron and Murrato (2013) collected data from over 22,000 volunteers who downloaded an app with EMA questions on happiness and passively measured physical activity in various locations. Lathia et al. (2017) collected data from over 12,000 volunteers who downloaded an app with questions on their mood and passively measured physical activity. These examples of mass participation broaden the range of people who can participate in research helping researchers quicken data collection for the social and natural sciences to answer research questions that previously were unattainable due to the lack of resources (e.g., taking pictures of insects and other living organisms and uploading them for the analysis by researchers, see Van Vliet and Moore, 2016, for an extensive review of citizen science projects). Observational studies can also be scaled up. For example, research on (un)employment, poverty, and job search would have required in-field observations by humans, but Kreuter et al. (2020) recruited over 650 Android users from a probability-based panel and passively collected data from participants’ smartphones coupled with questionnaires about labor market behavior and demographics over 6 months.
Finally, passive sensor data collection and certain active tasks such as taking pictures or videos using smartphones can potentially reduce the burden associated with answering questions, especially if the task is complicated. Taking a picture of a meal can be easier than typing in its detailed description. Surveys can be shortened if some questions can be replaced by sensor measures.
The first two articles in this special issue demonstrate ample opportunities of combining sensor and self-report data by integrating objective measures on physical and/or the social environment with subjective measures of attitudes and opinions. In the first article, “Making Sense of Sensor Data: How Local Environmental Conditions Add Value to Social Science Research,” English and colleagues (2020) combine data on weather and air quality collected from environmental sensors and survey data on household characteristics, social support, and health issues of elderly residents of Chicago. They linked the two data sources and created heat maps to understand the relationship between air pollution and health outcomes. Exposure to pollutants together with having lived in the neighborhood for a longer period of time is significantly related to respiratory health issues. The study has limited generalizability since it focuses on the specific population (i.e., adults aged 65 and older in purposefully selected neighborhoods), but it demonstrates how auxiliary sensor data that are not collected by respondents can be linked to the survey outcomes, providing previously unknown insights.
In the second article, “Investigating the Co-evolution of Tie Quality and Dyad Activity Similarity With Surveys, Smartphones, and Activity Trackers,” Sepulvado and colleagues (2020) explore communication patterns that are recorded with smartphones and activity patterns that are measured by wearing fitness trackers to understand the formation of students’ social networks. The social network data are collected over several months, allowing the researchers to study the development of social ties over time. While a group of college students is specific and may differ from how activity and communication patterns codevelop in other networks, the article shows how data from smartphones and accelerometers can be combined with demographic data.
Challenges of Sensor and App-Based Data Collection
Sensor and app measurement poses challenges for study design, execution, and analysis of the resulting data. These challenges pertain to representativeness and measurement.
Most existing studies that use sensor and app data are based on volunteers, which creates coverage and self-selection problems. The difference between individuals who have access to digital technology and those who do not is referred to as the digital divide, and the so-called second-level digital divide reflects that there are differences between how individuals use the technology (Hargittai, 2002). Antoun (2015) documents the existence of a group of mobile Internet users and a group of mobile-mostly Internet users along with PC users and nonusers. The growing rate of smartphone adoption does not solve the coverage problem if those who use smartphones are different from those who do not in the characteristics of interest and if individuals do not have the smartphone skills required to install apps or share smartphone sensor data in browser. For example, in Germany, smartphone ownership correlates with age, educational attainment, immigrant status, nationality, region, and community size (Keusch, Bähr, et al., 2020). These variables are related to many concepts of interest in the social sciences. Moreover, among those who use smartphones, there is an operating system divide: iOS users (i.e., iPhone owners) differ significantly from smartphone owners whose phones run on the Android OS in attitudinal and behavioral characteristics; and these differences cannot be corrected by weighting based on sociodemographic information (Keusch, Bähr, et al., 2020). Researchers implementing their studies with sensors on smartphones should be cognizant of possible existence of such biases.
Measurement differs by operating system. While iPhones and Android devices usually have the same or very similar embedded sensors, the way these sensors interact with the operating system (e.g., how often measurements are taken with a sensor) and whether and how external apps are allowed to interact with the sensors differs by OS. The Android OS, as an open-source platform, offers app developers broader access to passive data collection on the smartphone than iOS. In practice, it is very difficult to develop research apps that work exactly the same across all brands of devices. Similarly, it is difficult to standardize in-browser sensor measurement. One way to have more control over the measurement process is to provide participants with devices. For example, Sugie (2018) provided Android smartphones and a data plan to parolees recently released from prison to study their job search behavior. In a systematic review of studies that used the ESM, Van Berkel et al. (2017) found that 45% of studies reported the use of devices provided by researchers, 42% of studies used respondent-owned devices, and 4% employed a combination of respondent-owned and provided devices. However, when implementing such a strategy in the general population, there might be issues of noncompliance (e.g., de Bruijne & Wijnant, 2013; Mavletova, 2013; Wells et al., 2014).
Ownership of the device or providing it, however, does not guarantee participation. Completely relying on volunteers introduces selection effects about which researchers potentially are unaware or cannot control. If researchers wish to generalize to a larger population, they should consider that willingness, consent, and participation rates may differ by groups and some groups will be underrepresented or not represented in a study. Willingness and consent rates vary by task (Keusch, Struminskaya, et al., 2020; Revilla et al., 2016; Struminskaya et al., in press; Wenz et al., 2019). For example, 25%–52% of respondents of different nonprobability online panels were willing to take pictures, while 19%–37% were willing to share GPS location (Revilla et al., 2016). However, Struminskaya et al. (under review) found the opposite for willingness to share GPS location (67%) and photos of house, self, and receipts (12%–18%) in the Dutch general population, suggesting that the content of pictures matters. The order in which requests to share smartphone sensor data are made influences willingness as well with the first request usually eliciting greater willingness (Keusch et al., 2019; Struminskaya et al., in press). The task of downloading an app for data collection might involve further potential self-selection effects as it requires additional steps from participants. Studies recruiting their participants from population-based panels report download rates of under 20% (Bähr et al., 2020; Jäckle et al., 2019; Kreuter et al., 2020). For a cross-sectional study using the Dutch CBS Travel App, participants were recruited using the population register, and 35% of the invited sample members downloaded the app (McCool et al., forthcoming).
Studies on the mechanisms of willingness to share sensor data find that respondents’ control over data collection, study sponsor, smartphone ability, and privacy concerns significantly influence willingness. Willingness to share is higher for tasks in which participants have control over what data are collected and when (e.g., a participant can switch off the data collection, Keusch et al., 2019) or perceive to have control (e.g., would rather perform active tasks such as taking pictures than allow passive tracking, e.g., Revilla et al., 2019; Wenz et al., 2019). Studies sponsored by universities yield higher willingness than studies sponsored by commercial entities or governmental organizations (Keusch et al., 2019; Struminskaya et al., in press). Smartphone skills, intensity of use, and smartphone experience including prior research app download show a positive correlation with willingness, whereas privacy concerns correspond to lower willingness (Keusch et al., 2019; Struminskaya et al., in press; Wenz et al., 2019). It is not clear whether willingness to share data is situational or a stable attitude: Experiments on framing of requests so far have not shown that emphasizing benefits of data sharing significantly influences willingness, while repeated requests to share data showed that willingness is moderately stable (Struminskaya et al., in press).
Studies that recruit participants from existing probability-based surveys or population registries in countries where registers are available allow for estimation of the selection probabilities and nonparticipation bias. Simultaneously, resulting app and sensor data from such studies have great volume and detail and are collected at high speed, sharing these characteristics with big data. Combining the design typical for surveys with the richness and volume of sensor data offers opportunities for mitigating errors of representation while enjoying the benefits for measurement. The third and fourth articles, “The Effects of Personalized Feedback on Participation and Reporting in Mobile App Data Collection” (Wenz et al., 2020) and “Missing Data and Other Measurement Quality Issues in Mobile Geolocation Sensor Data” (Bähr et al., 2020), in this special issue have recruited participants from existing probability-based studies, partly overcoming the selection issue since a lot is known about the participants from the previous data collections in those panels.
In psychological studies employing smartphone sensor data collection participants can be motivated by personalized feedback, for example, information about their personality or behavior (Gosling & Mason, 2015; Kosinski et al., 2015). Personalized feedback is commonly used in intervention applications where the ultimate goal is to alter specific habits and behaviors (e.g., quit smoking, eat more healthy food, work out more, use the smartphone less) and in commercial apps to keep users motivated and engaged. However, if the aim of a study is to collect unbiased data through an app, the question arises whether receiving direct feedback on one’s own behavior changes this very behavior (the so-called measurement reactivity). Such behavior changes would bias study results since the measured behavior would be an artifact of the study setting. Reactivity has not received much attention in the literature to date. The third contribution of this special issue, “The Effects of Personalized Feedback on Participation and Reporting in Mobile App Data Collection” by Wenz and colleagues (2020) addresses this research gap by studying the effect of personalized feedback in a UK-based spending study where participants were asked to download an app to their smartphone and to report all their spending for 31 days. The experimental results show that announcing personalized feedback in the study invitation did not increase people’s motivation to download and use the app nor did actually receiving feedback in the app change engagement with the app. More importantly, the feedback did not alter the spending participants reported in the app.
Along with the design decisions that researchers have to make about sensor and app studies, there are a number of steps that need to be taken to generate information that is ready to use by researchers from sensor and app data. Processing sensor data can be challenging. The volume of data is often large, implying the need for data processing strategies (such as aggregating or sampling) before they can be used in practice (e.g., Mulder et al., 2019). Sensor data contain measurement error too, and filtering or smoothing methods are often used to accommodate these errors. Finally, sensor data are often far from complete. Data are sometimes missing for short periods of time due to communication loss or technical issues. Often, sensor data are missing for longer periods. The reasons for missing data vary from smartphone batteries running empty, or a particular sensor, an app, or the device itself being switched off by the participant. Furthermore, the missing data problem is aggravated by measurement challenges, for example, when participants install the apps but fail to carry a smartphone everywhere: The collected data will not reflect the true behavior of an individual.
The strategies of dealing with missing data vary across sensors, the extent and nature of the missingness patterns, and the phenomena under study. No one solution exists to “fix” the missing data problem. Some principled methods help mitigate missing GPS location data (e.g., Barnett & Onnela, 2020) and accelerometer data (e.g., Höhne et al., 2019; Lee & Gill, 2018). However, how to deal with missing sensor data as a whole, beyond the individual sensors, is still an open issue. In the fourth article, “Missing Data and Other Measurement Quality Issues in Mobile Geolocation Sensor Data” by Bähr and colleagues (2020) in this special issue, the authors investigate the quality of GPS data in terms of missing data. The authors use data that were collected in a probability-based smartphone app study (IAB-SMART Study; see Kreuter et al., 2020) in Germany in 2018. Overall, they identify five different sources that can introduce measurement error (or missing data) when collecting GPS data: (1) device turned off, (2) no measurement at all, (3) no geolocation measurement, (4) geolocation failed, and (5) geo-coordinates invalid. Interestingly, the authors find that the actual number of GPS data measurements is substantially lower (more than 50%) than the expected number of GPS data measurements.
Research Agenda
The papers included in this special issue address important gaps in our knowledge about the design of sensor and app-based studies and the measurement challenges when collecting these data. Studies combining survey and sensor data, however, are still rare, and we are only beginning to generate best practices and understanding possible shortcomings of the method in terms of measurement, representation, sampling, and combining sources in producing statistics. The analytical challenges pertaining to sensor data involving processing in order to extract the behavioral patterns from the raw data are unusual for the social sciences. Whether the processing of data happens on the device or on the researcher’s server, the researcher has to make decisions on how the individual measures correspond to the construct under study. For example, latitude, longitude, and time stamps for location data need to be processed and matched to external databases to identify what type of space the participant has visited; the data from activity trackers need to be classified as different activity patterns; accessing participants’ call records is a long way away from understanding their interactions.
The current social and behavioral science paradigms were not developed with those issues of dealing with detailed, rich, and voluminous data in mind (Lazar et al., 2009). Modeling is needed to capture the intended behavior with an aim to answer the research question. There are no guidelines on how to process raw sensor data to extract meaningful behavioral components. One way to do so for physical activity, for example, is by using volunteers who would perform predefined physical activities such as walking, running, climbing the stairs and the like, and then using feature engineering to label these activities (Mulder et al., 2019). The algorithms that process raw sensor data so that they are interpretable by social science researchers require modeling with making subjective decisions by the researchers or the algorithms themselves. As a result, more specification errors can occur. This issue has not received much attention so far.
Moreover, sensor data themselves are not always accurate. For example, the data from respondents of a probability-based U.S. online panel who were asked to wear accelerometers and answer EMA questions, showed implausible sleeping and waking patterns that most likely relate to the errors of measurement (Kapteyn et al., 2019). Furthermore, different sensor-equipped devices can produce different results, raising the issues of comparability. Further studies are needed to understand the extent of measurement differences that can be caused by devices with embedded sensors. The speed of innovation in sensor measurement poses further threats to comparability of measurement over time, as participants of longitudinal studies update their devices or replace the devices accompanied by a switch in operating systems.
Lastly, there are ethical and legal considerations that go along with collecting sensor data that are yet to be understood. Participants’ privacy concerns differ by the type and content of sensor data (Keusch, Struminskaya, et al., 2020) and can prevent them from participation. The promise of lower burden that is assumed to occur with the necessity to answer fewer questions might actually be perceived by individuals as a higher barrier to participation in sensor-based data collection. Privacy issues are not restricted to participation. Sampling from sensor data (e.g., using geolocation of participants at a certain time point near a point of interest, i.e., geofencing) to send them a survey request might be perceived as being intrusive to privacy. Gaining insights into behaviors that people might otherwise not have reported in a survey because they would like to keep them private (e.g., attending a church, dropping kids at day care, or skipping school) raises further need for understanding by researchers how sensor data collection should be designed and how its specifics should be communicated to study participants. Linking sensor data with other data sources to gain insights about people’s behavior presupposes informed consent and might further raise privacy concerns. Without knowing what kind of inference is possible when linked to auxiliary data, it is difficult for participants to make an informed decision about participation and challenging for the researchers to make decisions about how to make the data available for replication by other researchers without compromising participants’ privacy (Stier et al., 2020).
Footnotes
Authors’ Note
The authors thank the participants of the first Mobile Apps and Sensors in Surveys (MASS) Workshop for fruitful discussions that shaped many ideas in this editorial and Céline Henneveld for research assistance. Sources of smartphone graphics in Figure 1: S & S2: https://www.pngegg.com/en/png-yguwu">https://www.pngegg.com/en/png-yguwu">https://www.pngegg.com/en/png-yguwu (noncommercial use); S3: https://thenounproject.com/search/?q=galaxy+s3&i=11967 (Public domain); S4 & S5: https://thenounproject.com/search/?q=galaxy+s5&i=252184 by Anthony Keal, Royalty Free License obtained November 3, 2020; S6 & S7: https://thenounproject.com/search/?q=galaxy+s7&i=1099080 by Anthony Keal, Royalty Free License obtained on November 3, 2020; S8: https://thenounproject.com/search/?q=galaxy+s8&i=1600582 by Sri Teja Telukuntla, Royalty Free License obtained on November 3, 2020; S9: https://thenounproject.com/search/?q=galaxy+s9&i=1642515 by Stepan Voevodin, Royalty Free License obtained on November 3, 2020; S10: ![]() MIO from Noun Project, Royalty Free License obtained on November 11, 2020; S20: created by Céline Henneveld.
MIO from Noun Project, Royalty Free License obtained on November 11, 2020; S20: created by Céline Henneveld.
Declaration of Conflicting Interests
The author(s) declared no potential conflicts of interest with respect to the research, authorship, and/or publication of this article.
Funding
The author(s) received no financial support for the research, authorship, and/or publication of this article.