
Abstract
Traditional survey research faces declining response rates due to changing cultural habits and technological developments. Researchers have developed novel approaches to increase respondents’ likelihood of participating in web surveys. However, we lack information about whether these methods indeed increase response rates and, if so, whether they bias the resulting data. This article focuses on the use of nonmaterial incentives in the form of a video that provides the invitees with information tailored to their life situation. Analysis of our experimental data shows that instead of increasing respondents’ probability of starting the survey, the video treatments actually decrease it. We provide evidence that the lower salience of the intrinsic benefits of survey participation in the invitation email significantly contributes to this reduction. Additionally, the effect of the nonmaterial incentive differs across subgroups, affecting nonresponse biases in line with employment status, gender, and migration background. We therefore conclude that using additional information in the form of a video as a nonmaterial survey incentive is only suitable under specific conditions.
Keywords
Web-based surveys are becoming increasingly popular. They are cheaper and enable faster data processing than traditional survey modes. Furthermore, the widespread use of the internet has substantially reduced the initially high coverage error of the mode (Toepoel & Hendriks, 2016; Tourangeau et al., 2013, pp. 20–23). However, web surveys suffer from lower response rates than more traditional methods of data collection (Manfreda et al., 2008; Shih & Fan, 2008). Nonresponse might introduce a bias to the data if the probability of participation in the survey is distributed disproportionately among the target group and correlates with one or more variables of interest (Groves, 2006). The goal—and challenge—is thus to evenly (instead of selectively) boost potential respondents’ willingness to participate in web surveys.
Recruitment for list-based web surveys usually takes place via email and therefore lacks the motivational component of human interviewers (Manfreda et al., 2008; Tourangeau et al., 2013, p. 36). As a result, email invitations play a central role in highlighting the benefits of participation and attracting a maximum number of respondents. At the same time, these email invitations should not increase nonresponse bias or—ideally—should reduce bias by stimulating participation among groups that are usually reluctant to comply with survey requests (Couper, 2008, p. 485).
As financial incentives are costly and difficult or even impossible to administrate in web survey settings, researchers increasingly resort to offering nonmonetary benefits for participation, such as providing new information to participants or stressing how participation will help others (Dillman et al., 2014, p. 28). Information incentives are cheap and can be transmitted using the same medium as the web survey. Thus, this approach is very practicable and easy to implement. Recent advancements in (landline and mobile) internet speeds have made it easier to use survey-integrated information videos as incentives. A video clip is well suited to conveying a message in a compact and comprehensible way, as the combination of images and spoken language facilitates its comprehension (cf. Conrad et al., 2015). However, while highlighting certain benefits of participation may reduce nonresponse, this approach could also increase nonresponse bias and thus negatively affect survey quality. A single survey design attribute can have different “leverages” on the cooperation decisions of different individuals (Groves et al., 2000). Hence, the question of how much salience (e.g., in terms of visibility) the invitation should attribute to different aspects of the survey in order to balance the overall nonresponse of the relevant subgroups is far from trivial.
There are two main sources of unit nonresponse in web surveys: failure to start the survey and failure to finish it. Web survey researchers have emphasized that these two aspects differ in their form and that the causes of each source of nonresponse might be different (Crawford et al., 2001; Göritz, 2014). Thus, although the efficacy of an incentive can only be judged by using the response rate and response bias of the completed surveys, researchers have to disentangle the specific effects of failure to respond and survey break-off in order to be able to test the mechanisms involved in the participation decision. While break-off has been studied in various ways in the last couple of years (Keusch, 2011; Peytchev, 2009; Yan et al., 2011), limited a priori information about the composition of the target sample has often prevented analyses of biases resulting from failure to start the survey. In order to fill this gap in the literature, this article analyzes how focusing on nonmaterial incentives in the email invitation affects the probability of starting the survey, that is, the “click rate.” However, we also study response rates, defined as the probability of completing the survey. Both click rates and response rates are of crucial interest to practitioners who need to know whether providing video incentives is a viable strategy for increasing survey participation. To address these questions, we draw on data from a recent study among young unemployed adults in Austria (Mühlböck et al., 2018) that experimentally varies the combination of web questionnaire and video incentive. Importantly, we draw on extensive information from official register data, which enables us to not only study the overall response probability but the potential response bias of key variables as well. This should increase our understanding of the mechanisms involved in respondents’ decisions to participate in surveys. We especially focus on topic interest, survey benefit framing, and cognitive burden.
The following section introduces the theoretical approach and the state of the art in the field of nonmaterial incentives. The method section describes the experimental approach and the data. The analysis proceeds in two steps. First, we show the effects of different framings of the invitation email on click and response rates. Second, we test for heterogeneous treatment effects and ask whether the inclusion of the video affects subgroups differently, which might increase or decrease nonresponse bias. In contrast to expectations, we find that the click rate and, as a result, the response rate is highest when the video is not included. Our results reveal that using a video as a nonmaterial incentive for survey participation may introduce a substantial nonresponse bias to the data if the target group is the general population. However, videos can be used effectively in more narrowly focused research that target specific subgroups of interest to the researcher.
Theory and Hypotheses
To understand the mechanisms at play in survey participation decisions, we follow Dillman et al.’s (2014) tailored design method that relies primarily on social exchange theory (SET; see, Blau, 1964; Homans, 1961; Thibaut & Kelley, 1959). SET assumes that people are more likely to comply with a request if they believe that the rewards will eventually exceed the costs of complying. Going beyond simple cost–benefit analysis, the theory stipulates that individuals reciprocate when others make a special effort to provide benefits (Dillman et al., 2014, p. 28). However, these benefits differ in the type of motivation they stimulate. In line with self-determination theory (Deci & Ryan, 1985), we differentiate between extrinsic and intrinsic motivations. Rewards like monetary or information incentives focus on the stimulation of extrinsic motivation. Yet respondents are also motivated by the intrinsic aspects of participating in a survey. They feel a sense of reward from knowing that they are helping others, appreciate the possibility of being heard, or simply find it interesting or fun to participate in a survey (Wenemark et al., 2010).
A best practice for emphasizing reciprocity and increasing the extrinsic benefits in self-administered surveys is the supply of unconditional (prepaid) monetary incentives such as cash, gift cards, or lotteries (Keusch, 2015; Singer & Ye, 2012). However, such incentives are difficult to administrate in web surveys if contact with the potential interviewees is only established by email (Göritz et al., 2008). Apart from administrative hurdles, emails promising a financial reward might raise suspicion among recipients and may easily be perceived as spam (Manfreda et al., 2008; Manzo & Burke, 2012). This undermines the applicability of monetary incentives to web surveys.
Researchers have thus tried to attract respondents for web surveys with nonmaterial incentives. A popular approach is to provide information that is valuable to the targeted sample (Göritz, 2006; Tuten et al., 2004). For example, researchers have used study results or study reports to provide respondents with immediate feedback on their own results (Edwards et al., 2009; Kühne & Kroh, 2018). However, offering information incentives might also increase the cognitive burden by increasing the complexity of the survey invitation. The judgment process of weighing the pros and cons of survey participation and the video may cause both to appear less attractive than if they had been offered alone (Medway & Fulton, 2012). Furthermore, an information incentive may also add to the time burden associated with survey participation. Hence, it is important that the information is presented in a short and easily accessible way. This is achieved by using a video for information transmission. This medium reaches the audience on both an audio and a visual level, allowing for the transmission of information without much cognitive burden for the recipients (Sweller, 2011). While videos are difficult to implement in other survey settings, they are ideally suited for web surveys and offer a welcome diversion for survey participants (Scherpenzeel & Toepoel, 2014; Wright, 2005).
When highlighting the extrinsic or intrinsic benefits of participation, the focus of the emailed invitation letter is fundamentally important. The decision whether to participate or not is usually taken within seconds and, therefore, first impressions of the survey requests are crucial (Dillman et al., 2014, p. 25). According to SET, a focus on an extrinsic nonmaterial incentive, such as an information video, should increase the perceived utility of participating in a survey and increase the likelihood that respondents reciprocate by participating in the web survey (see Hypothesis 1a at the end of this section).
At the same time, capitalizing mainly on the informational benefit of the video could undermine the salience of the intrinsic benefits of survey participation such as helping others or contributing to scientific advancement (Göritz & Neumann, 2016). This relates to the notion, highlighted by SET, that participants evaluate not only the costs and benefits but also participate because they consider this appropriate (Dillman et al., 2014, p. 25). In line with this prediction, studies have found that a “plea” subject line results in larger response rates than an “offer” subject line (Trouteaud, 2004). Therefore, focusing on a nonmaterial incentive such as an information video could reduce the salience of intrinsic benefits and thus decrease the probability of participation in the web survey (see Hypothesis 1b).
Compared to other strategies to improve response rates, there has been little research on the effect of nonmaterial incentives (Manzo & Burke, 2012). Furthermore, studies on the effectiveness of nonmaterial incentives mostly rely on panels or add nonmaterial incentives to monetary ones, which might crowd out the effect of the former. This might be one reason why, thus far, the empirical evidence for the effect of supplying information as a nonmaterial incentive to foster survey participation has been mixed. Batinic and Moser (2005) argue that offering an automated result report increases participation when respondents feel that they might benefit from a summary of the survey outcome. Indeed, in their meta-analysis of medical web surveys, Edwards et al. (2009) find that offering survey results can increase the odds of participation—but their results are derived from a small study sample. Positive effects of information provision have also been found by Tuten et al. (2004) and Marcus et al. (2007). However, several studies have also shown that offering a summary report has no effect (Galesic, 2006; Göritz, 2014; Göritz & Luthe, 2013; Sax et al., 2003; Scherpenzeel & Toepoel, 2014) or even a negative effect on the response probability (Batinic & Moser, 2005; Göritz & Luthe, 2013; Göritz & Neumann, 2016). At the same time, Kühne and Kroh (2018) find that personalized feedback positively affects satisfaction with the survey, which helps reducing attrition.
So far, studies on the effects of videos in web surveys have focused mainly on experimental surveys that integrate videos as their main research object (Mendelson et al., 2017; Shapiro-Luft & Capella, 2013). Scherpenzeel and Toepoel (2014) is the only study we are aware of that has used an information video as an incentive to increase response propensity. Their research on the online longitudinal internet studies for the social sciences (LISS) panel found no or inconclusive effects of traditional (cards, letters, and newsletters) and innovative (videos and graphs) forms of information on response rates. But their videos were not closely tailored to the needs of the sample and featured researcher interviews, which might only be salient for highly educated individuals. Hence, there is much space for further exploration of the potential effects of nonmaterial incentives in the form of information videos on response probability.
While different aspects of the survey design (like incentives) may augment overall survey response, they may at the same time introduce an additional bias to the data. Nonresponse bias is one of the most common methodological problems in survey research. It can distort descriptive and inferential statistics and thus lead to inaccurate conclusions (Groves et al., 2004). Detecting nonresponse bias is often impossible because detailed information about the target population is rarely available and, when it is, only for very specific characteristics. Consequently, researchers simply try to reduce nonresponse in the hope that this will simultaneously reduce bias. However, invasive attempts to increase response rates can lead to reduced data quality in terms of nonresponse bias and measurement error when the strength of their effects depends on the characteristics of the individuals in the target group (Fricker & Tourangeau, 2010). Hence, even if nonmaterial incentives increase the response rate, they may nevertheless impair data quality.
To understand this process, we rely on “leverage salience theory” (LST), a conceptual framework of survey participation developed by Groves (1998). LST differentiates between three ways how survey presentation affects the willingness to participate in a survey: Firstly, how important a certain feature is for a specific respondent (leverage), secondly, whether this person perceives this feature as positive or negative, and thirdly, how salient the feature becomes to this person during the presentation of the survey request (Groves et al., 2000). It is therefore crucial to not only test the general effect of the information video on the response rate but also study the potential interaction effects with subgroup characteristics related to leverage, cost–benefit perception, and salience.
Previous research has found that sample members perceive the rewards of participating as especially high in situations where researchers can link participation to the personal interests of potential respondents (Esser, 1986). Hence, those faced with a survey request on a topic of interest to them should be more likely to respond than those less interested in the topic (Edwards et al., 2009; Galesic, 2006; Keusch, 2015). Nonresponse bias may increase when topic interest and study goals are correlated (Groves et al., 2004). Thus, it is important to consider the relationship between topic interest and the effect of incentives. The positive effects of material incentives on survey response have been found to be less pronounced for those interested in the survey topic (Groves et al., 2004; Marcus et al., 2007). However, the situation is different when using an information video as a nonmaterial incentive, which should be of special interest to those strongly engaged with the topic (Shapiro-Luft & Cappella, 2013, however, see Marcus et al., 2007). We therefore expect the positive extrinsic effect of the video incentive on response probability to be more pronounced for potential respondents who are more interested in the topic than for those who are less interested (see Hypothesis 2).
The leverage of benefits might also depend on the gender of potential respondents. In general, men are less likely to participate in web surveys than women (Busby & Yoshida, 2015; Keusch, 2015; Porter & Whitcomb, 2005; Sax et al., 2003). Role congruity theory states that communal characteristics are ascribed more strongly to women, while agentic attributes are ascribed more strongly to men (Eagly, 1987). These social roles promote gender differences in behavior (Eagly et al., 2000). In line with this argument, Smith (2008) and England (1989) contend that women are less focused on self-interest and more on interpersonal utility than men and tend to value characteristics more consistent with connective selves, like empathy. Supporting these expectations, laboratory experiments show that men choose more efficient allocations, while women are more inequality averse (Croson & Gneezy, 2009). This gender differentiated social-distance thesis, which is closely related to SET, could be a possible explanation for the different response rates of men and women (Tu & Liao, 2007). Thus, we expect that the intrinsic benefits of survey participation will have a greater leverage on women than men who should prefer information gaining more than women. This mechanism should lead to higher response rates for women overall and reduced gender differences in treatments that highlight the personal benefits of the video because the extrinsic benefits of the video should be more appreciated by men and the salience of intrinsic benefits of survey participation preferred by women would be reduced (see Hypothesis 3).
Not only the (perceived) benefits but also the (perceived) burden of participation may depend on the personal characteristics of the respondents. Compared to surveys that require individuals to understand and process the question wording, reflect on it, and be able to sort their reactions into answer schemes, a video is easier to consume. Hence, focusing on a video instead of on the survey in the invitation email should reduce the perceived cognitive burden normally associated with survey questions. This may be especially relevant for individuals who find surveys challenging. For example, individuals with a different mother tongue or weaker literacy skills may strongly benefit from a video’s multimode nature of information transmission (Sweller, 2011). Accordingly, migrants (see Hypothesis 4) and those with lower levels of education (see Hypothesis 5) should respond more strongly to the nonmaterial incentive than citizens and participants with higher levels of education.
In sum, these considerations lead to the following hypotheses regarding the effects of including a video information incentive on web survey participation:
Method
Sample Composition
To test our hypotheses, we draw on data from an experiment on young adults (aged 18–35) who were registered as unemployed at the Austrian labor market service during the 6 months prior to the field phase (with most of them still unemployed at the time of the survey in May 2017). We use a list-based sample consisting of those individuals within the target group who provided their email addresses upon registration at the employment office (N = 28,000). Because the sample is drawn from official register data, we have extensive information on characteristics that have been shown to impact survey response probability, such as gender, level of education, migration status, and topic involvement for all individuals in the sampling frame. This enables us to examine the effects of different survey settings on the response probability of key subgroups.
Experimental Design
The sample was randomly split into four groups. The first group received an email invitation containing a link to a survey about job search strategies. The second group received a similar email in which potential participants were not only invited to participate in the survey but also advised that they would be provided with a short information video about job searching at the end of the survey. The 2-min info clip was tailored to the needs of the target group and contained information on various successful job search strategies. It was embedded in the online questionnaire so that participants did not need to click on a separate link. The third group also received an email invitation for both the survey and the info clip. For this group, however, the invitation email focused on the video instead of the survey and the video preceded the questionnaire. The fourth group received an email containing a link to the video inviting participants to watch the info clip and provide feedback. This group did not participate in the survey. The links to the different treatments remained active for 4 weeks after sending the email invitations. No reminder was sent.
The subject line of the invitation letter varied between groups to either highlight the nonmaterial incentive (i.e., the video) or the questionnaire itself. In the questionnaire-only group and in the questionnaire-video group, the subject line read “Job search survey of the University of Vienna.” The third (video questionnaire) and the fourth (video only) group received emails with the subject line “Job search video of the University of Vienna.” The framing of the invitation letter varies accordingly (see Appendix A in the Online Supplemental Material for the full wordings of the invitation letters; see Appendix B in the Online Supplemental Material for screenshots of the invitation letters on a mobile device). Other factors that could influence click rates were held constant (e.g., placement of the URL, length of the invitation, sender, salutation, and valediction; Kaplowitz et al., 2012; Tourangeau et al., 2013). Furthermore, the topic of the study (i.e., job search) was revealed in the invitation letters of all four treatments. Because all participants were recently registered as unemployed and received the email regarding job search from a government agency (the Ministry for Social Affairs), we expected a low probability that the email would be misperceived as spam.
In line with the theoretical considerations laid out in the theory section, this approach leads to differences between the individual treatments regarding the benefits of survey participation. The questionnaire-only treatment offers little reward in terms of information but instead capitalizes on the intrinsic reward of participating in a survey. The invitation to the questionnaire-video treatment likewise focuses on the intrinsic reward but additionally mentions the information reward. While the video-questionnaire treatment contains the same elements as the questionnaire-video treatment, the invitation highlights the video treatment, while the benefit of contributing to a survey is only secondary, thereby decreasing the intrinsic reward. Finally, the video-only treatment offers the same information reward as the video-questionnaire treatment, but the intrinsic reward is low.
Yet not only benefits but also the (cognitive and time) burden differs between the treatments. The cognitive burden associated with a survey should be higher than that associated with a video. Therefore, the perceived cognitive burden should be higher in the treatments containing the questionnaire than in the video-only treatment. The prospective durations of the questionnaire (5 min), the video (2 min), and their combination (5 + 2 min) are announced in the email invitations. 1 Since questionnaire length increases the burden of participation, announced questionnaire length correlates negatively with the probability of starting a web survey (Keusch, 2015; Yan et al., 2011). Hence, differences in survey length can distort the effect of the incentive (see Göritz & Neumann, 2016). We therefore rely on the differences between questionnaire-video and video-questionnaire to test the framing effects of the invitation email, as these two treatments do not vary in terms of announced duration.
Unit nonresponse is a central issue because it often accounts for most of the total nonresponse in list-based web surveys (see e.g., Heerwegh & Loosveldt, 2008; Kaplowitz et al., 2012). Nevertheless, the potential bias introduced by different propensities to react to invitation emails is still underresearched because information on all list members is seldom available in nonpanel research. Hence, this study focuses specifically on the effect of invitation framing on the click rate and the bias introduced when invitees decide whether to start a survey. The click rate is defined as the number of individuals who started the survey divided by the number of all contacted list members. While focusing on click rates, we also provide results on response rates and overall nonresponse bias. We define the response rate as the number of individuals who completed the survey divided by the number of all contacted list members (this corresponds to the RR1 specification, see American Association for Public Opinion Research, 2016). Because the sample data are randomly drawn from the official registry and not stratified, we do not weight click or response rates in our analyses.
To estimate the effect on nonresponse bias, we calculate the relative nonclick and the relative nonresponse bias defined as the difference between the estimated mean (or proportion) derived from respondents (click:
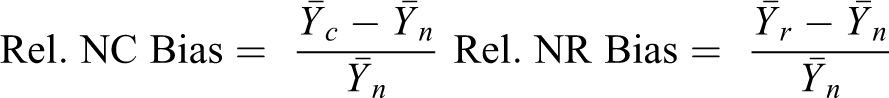
To summarize the relative bias estimates within the experimental treatments, we also report the average of the absolute relative nonresponse bias across all variables (for a similar approach, refer to Sakshaug et al., 2018).
To test Hypotheses 2–4, we estimate binary logistic regression models in which starting the survey is the dependent variable, including interaction effects between the treatments and several independent variables. We operationalize topic interest (i.e., interest in job search) by topic involvement (i.e., being unemployed at the time of receiving the invitation email). Further independent variables used to estimate the expected differences in response propensity between treatments include the potential participant’s gender (male/female), the highest level of education (measured in four categories), and the invitee’s migration background operationalized by citizenship status (Austrian or non-Austrian). To account for the possible age effects found elsewhere (Felderer et al., 2019; Shapiro-Luft & Cappella, 2013), we also include age in years as a control variable. 2
Results
Of the 28,000 invited unemployed young adults, a total of 3,290 (11.8%) clicked on the link in the email invitation. Of all the individuals in the sample, 7.8% finished the questionnaire. The response rates are lower than in other list-based web surveys (Keusch, 2011; Shin et al., 2012). Three factors may have reduced participation: First, our setting did not enable us to send a reminder, which typically significantly boosts response (Van Mol, 2017); second, our sample consists mainly of groups that are difficult to reach (the less educated, migrants, and the unemployed; Manfreda et al., 2011); and third, our list members were less dependent on the sampling institution than the invitees in the often-used company or university lists in survey research.
The results reported in Figure 1 show that Hypothesis 1a is rejected by the data. Instead of increasing the participation as stipulated by the hypothesis, the inclusion of the video as an information incentive decreases click and in turn response propensity. Compared to the baseline questionnaire treatment, the click rate in the questionnaire-video treatment is 5.7 percentage points lower (χ2 = 99.5, df = 1, p < .001). In fact, the treatment consisting only of the questionnaire exhibited the highest overall click and response rates of all treatments, even higher than the treatment consisting only of the video, which supposedly placed the lowest time and cognitive burden on participants.
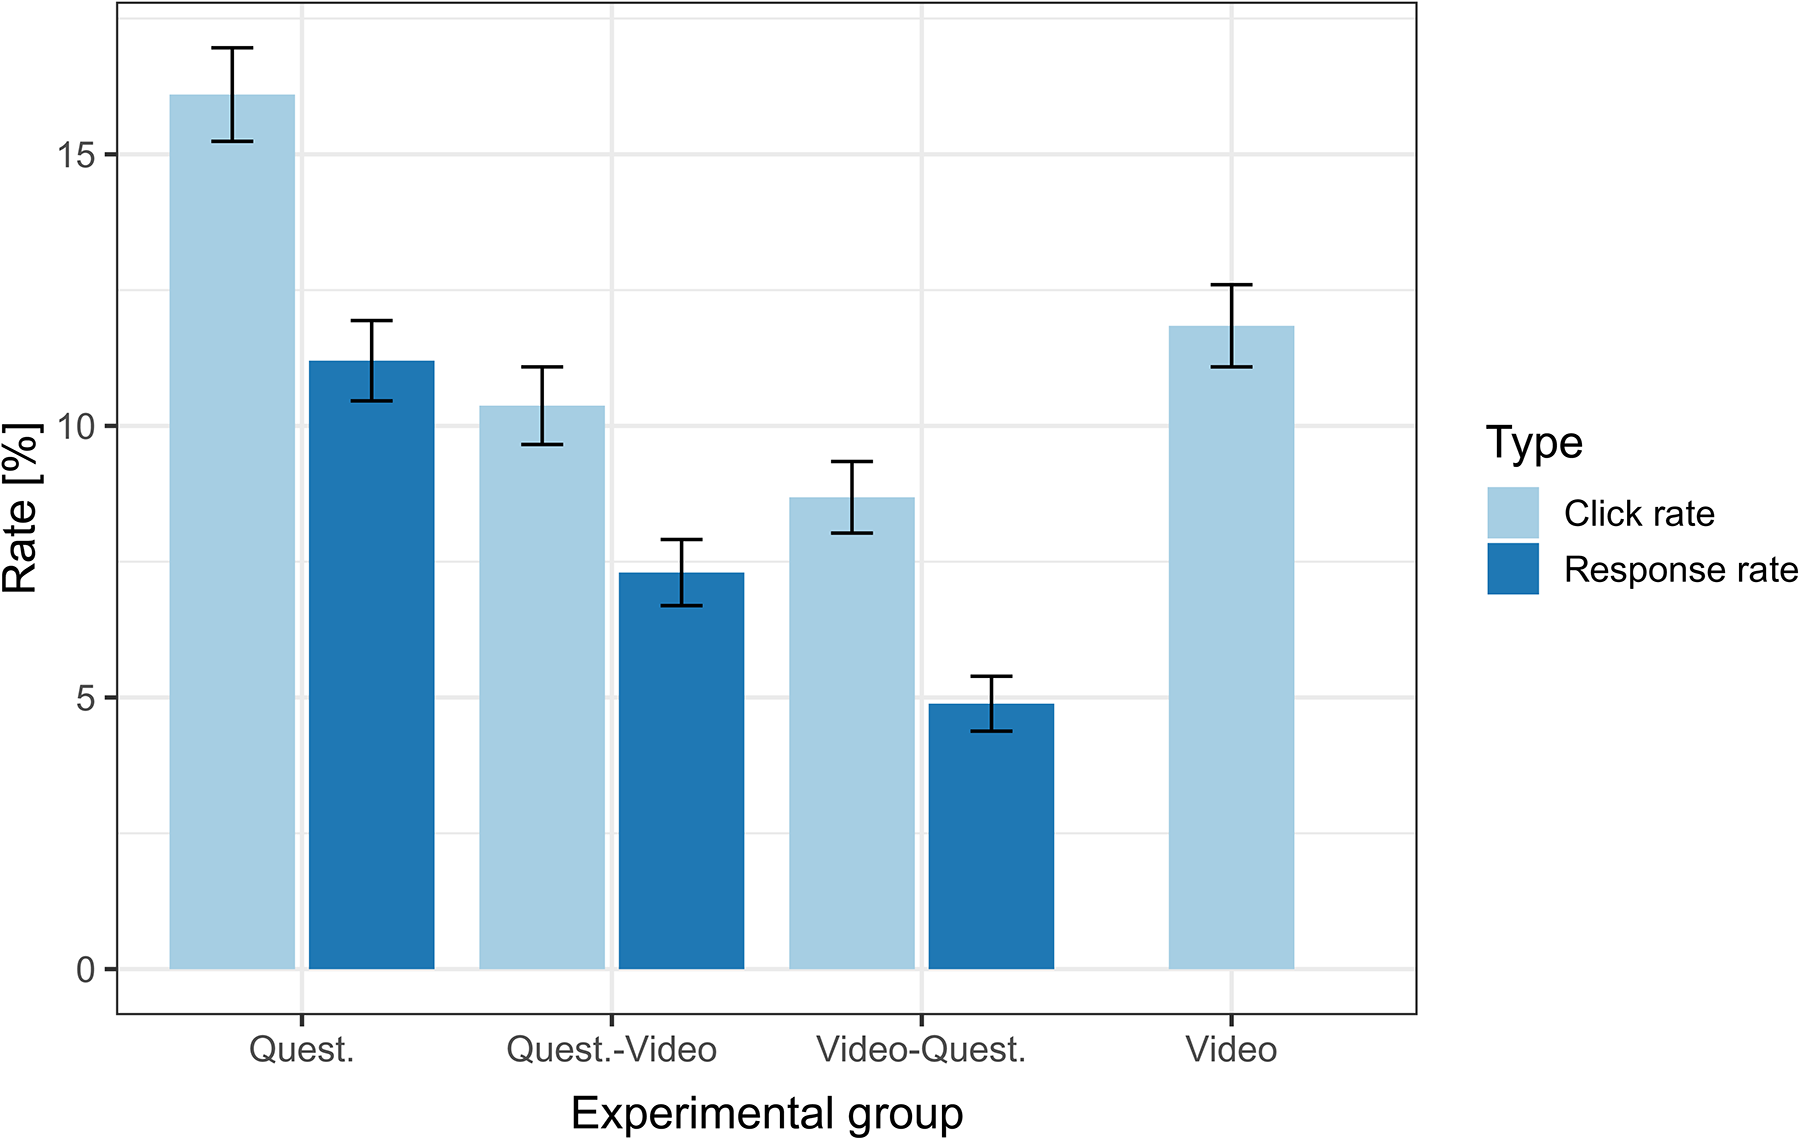
Click and response rates by experimental group. Note. Whiskers indicate 95% confidence intervals. N(click rate) = 28,000. N(response rate) = 21,000.
The empirical findings are in line with Hypothesis 1b, which implies that intrinsic motivation is highly important for survey participation. Thus, an excessive focus on the information incentive is counterproductive. This conclusion is also supported when looking at the most similar treatments in terms of burden: Contrary to Hypothesis 1a and in agreement with Hypothesis 1b, the video-questionnaire treatment resulted in 2.4 percentage points lower click rates than the questionnaire-video treatment (χ2 = 11.3, df = 1, p < .001). Response rates are significantly lower than click rates, but the response differences between the treatments resemble those of click rates. About 70% of those individuals who clicked on the link also finished the questionnaire in the questionnaire-only and in the questionnaire-video treatment. Only the video-questionnaire treatment suffers from a lower questionnaire completion propensity (56%), due to an increased break-off after watching the video.
Further evidence supporting Hypothesis 1b is provided by a comparison of actual answers to the survey questions. Due to the random allocation of respondents to the treatment groups, we would expect similar responses to our survey questions across groups. The questionnaire included an item asking to what extent respondents would prefer a job that allows them to help other people. 3 We use this as a proxy for altruism, which should result in more leverage for the intrinsic rewards of survey participation. Respondents in the questionnaire-video treatment displayed a slightly but significantly higher average rating for this item than respondents in the video-questionnaire group (3.14 compared to 3.04, one-sided t test, t = 1.87, df = 739, p < .05). This result suggests that respondents who score higher on the altruism proxy more often clicked on the link to our questionnaire if the invitation did not highlight the nonmaterial incentive but focused on the intrinsic benefits of participating in the survey. Furthermore, it indicates that the focus on the video not only affects the overall click and response rates but also changes the resulting sample composition—which may either increase or decrease bias. Hence, while the video does not increase participation, it may intensify or level out differences in the response probability of different subgroups.
Table 1 shows the relative nonclick bias of our key variables of interest (gender, employment status, citizenship, and education) for the four treatments. The results indicate that women are overrepresented in the questionnaire treatment by 10% relative to the actual share of women in the target group. The opposite is the case for the video treatment where women are underrepresented by 12.6%. Focusing on the average of the absolute values of relative nonclick bias between treatments across variables (last row in Table 1), we see that the treatments focusing on the questionnaire (questionnaire-only and questionnaire-video) produced less nonclick bias than the video-questionnaire and video-only treatments. This stems from a larger overestimation of non-Austrians and individuals with higher education in treatments focusing on the video.
Relative Nonclick Bias.
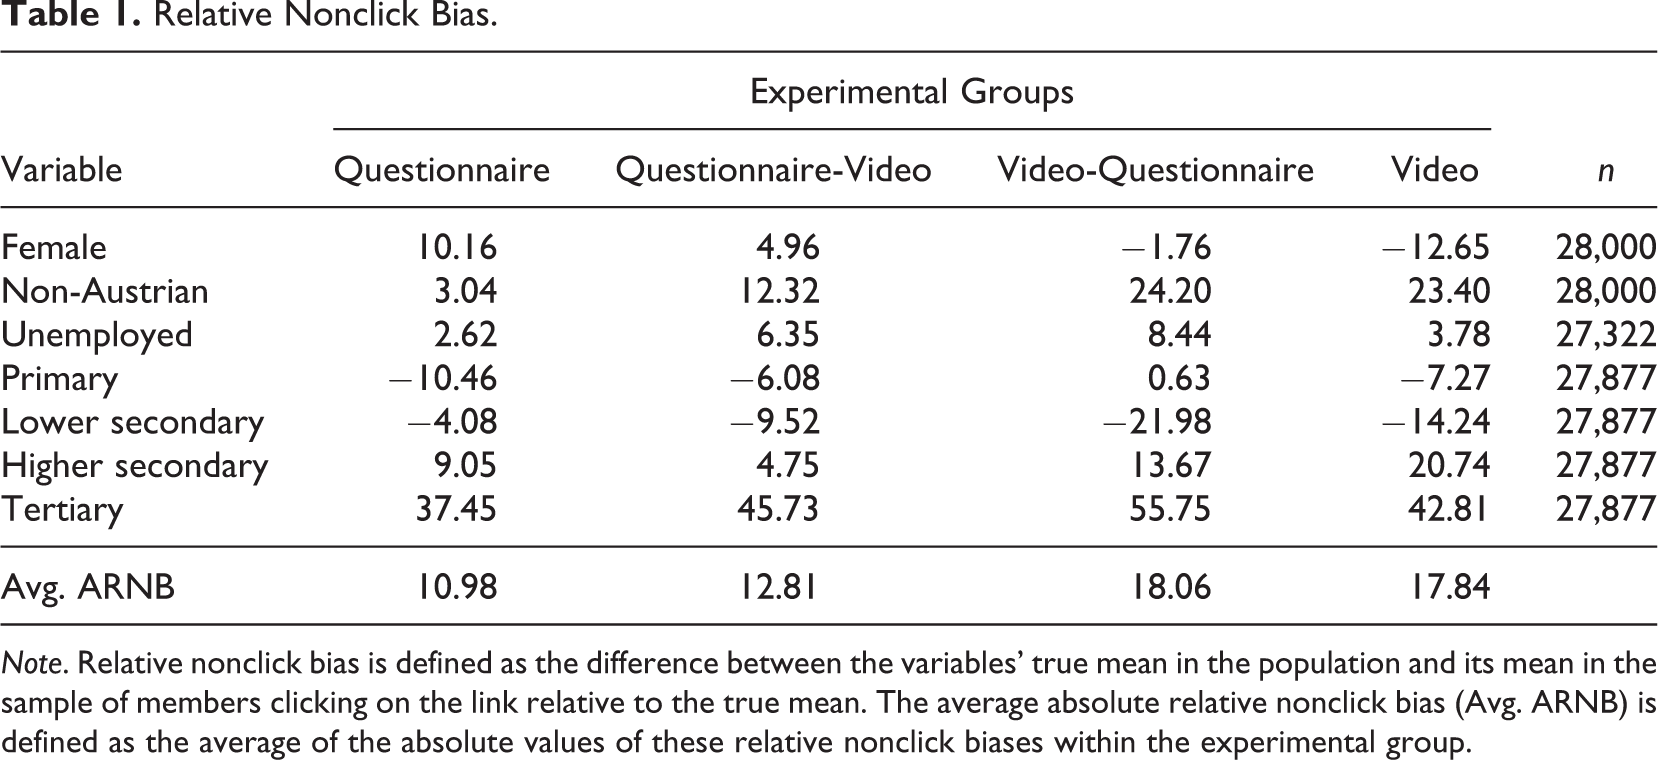
Note. Relative nonclick bias is defined as the difference between the variables’ true mean in the population and its mean in the sample of members clicking on the link relative to the true mean. The average absolute relative nonclick bias (Avg. ARNB) is defined as the average of the absolute values of these relative nonclick biases within the experimental group.
Table 2 shows the relative nonresponse bias of the four variables. The patterns closely resemble those of the nonclick bias, that is, groups with a high nonclick bias also display a high nonresponse bias. An exception are the non-Austrians. Within this group, initial high click rates in treatments involving the video mitigated the effect of high break-off rates and thus resulted in a smaller bias for this group compared to the questionnaire-only treatment. The opposite is the case for individuals with a higher education. Due to lower break-off rates among this group, the nonresponse bias is considerably higher than the nonclick bias, resulting in increased overrepresentation. On average, the nonresponse bias is higher than the nonclick bias, especially for the video-questionnaire treatment. In general, however, the comparison between Tables 1 and 2 shows that the differences between nonclick bias and nonresponse bias originate mainly due to differences in break-off propensity between subgroups and not between treatments.
Relative Nonresponse Bias.
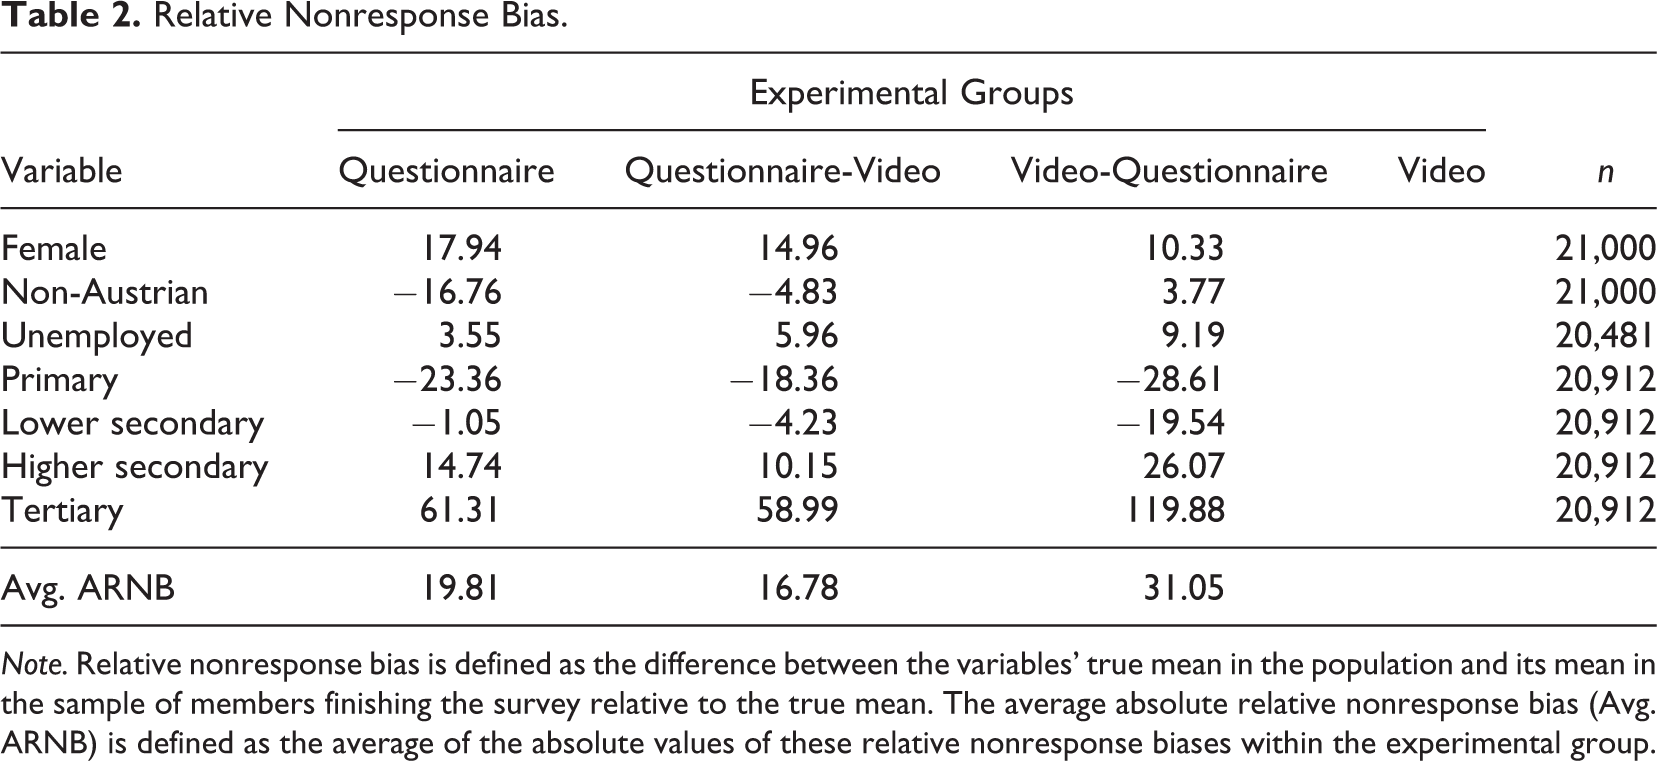
Note. Relative nonresponse bias is defined as the difference between the variables’ true mean in the population and its mean in the sample of members finishing the survey relative to the true mean. The average absolute relative nonresponse bias (Avg. ARNB) is defined as the average of the absolute values of these relative nonresponse biases within the experimental group.
To specifically test our hypotheses regarding treatment effects differentiated by gender, citizenship, education, and employment status (Hypotheses 2–5), while controlling for possible confounding factors, we estimated logistic regression models with interaction terms. The predicted click probabilities for the respective groups of respondents based on the regression results are depicted in Figure 2. As the patterns for predicted response probabilities are highly similar, we report them in the Online Supplementary only, together with the full regression estimates (see Figure 1 and Table 1 of Appendix D in Online Supplemental Material; we also provide unadjusted mean differences in click and response rates in Appendix C in Online Supplemental Material). In the following description of results, we will use the term “participation” if the findings pertain to both click and response rates.
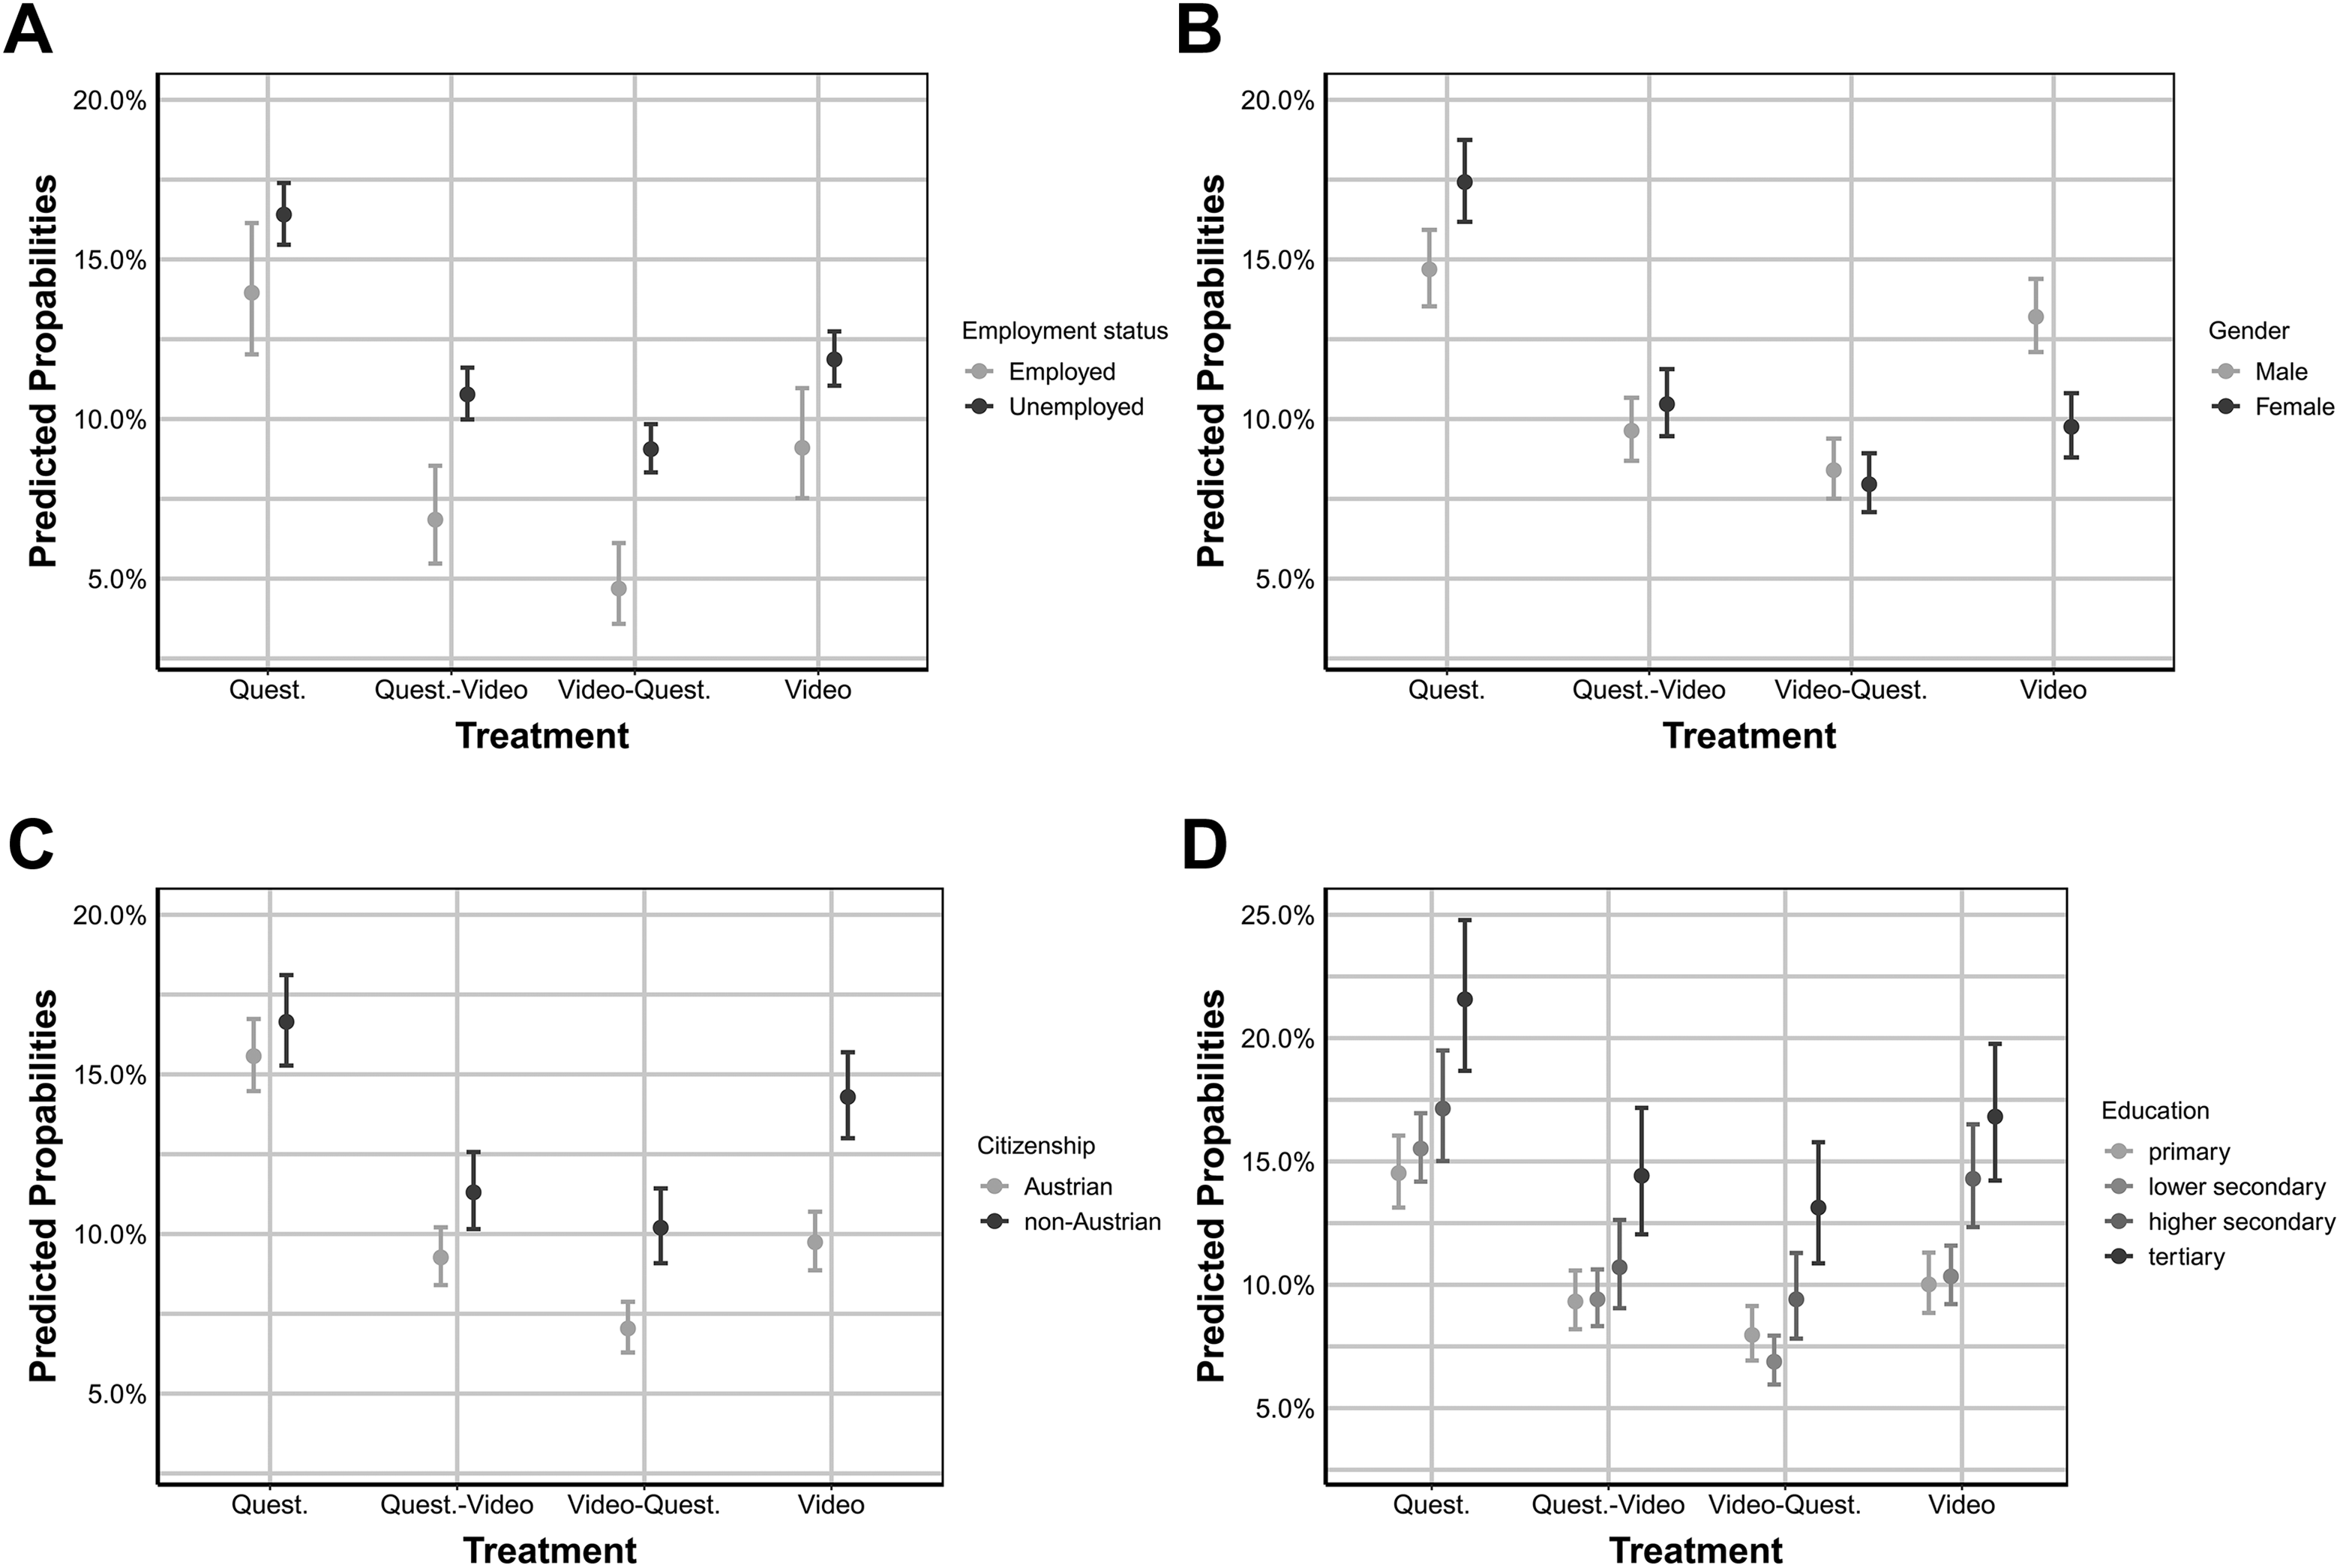
Predicted click probabilities for different treatments by A) employment status (indicating topic interest), B) gender, C) citizenship, and D) education. Note. Estimates are based on Model 2 in Table 1 of Appendix D in the Online Supplementary Material. Predicted probabilities with 95% confidence intervals are calculated holding other variables at their mean.
The higher predicted participation probabilities for the unemployed indicate that the survey topic has increased leverage for those still seeking a job. As expected (Hypothesis 2), the two treatments combining the questionnaire and the information incentive further increase the positive relationship between topic interest and survey participation. This is clearly indicated by the larger differences in predicted probabilities between employed and unemployed in the combined treatments compared to the differences in the survey treatment in Figure 2A. While the interaction effect between questionnaire-video treatment and unemployment is only weakly significant (log odds = .305, p < .1), the interaction effect between the video-questionnaire treatment (highlighting the video in the invitation letter) and unemployment shows a strong and significant effect (log odds = .514, p < .01). The interaction effect between the video-only treatment and unemployment is also positive but not as strong and not significant. This suggests that topic interest operationalized as topic involvement is indeed positively related to survey participation, and this effect is moderated by survey length and the nonmaterial incentive. When the burden is increased with survey length and the topic is emphasized by the video, participation differences between individuals with high and low topic involvement increase.
Regarding gender differences, the regression estimates indicate a higher probability of survey participation for women. In the treatments emphasizing extrinsic participation benefits (video-questionnaire and video), the participation propensity of women is lower compared to men (log odds −.262, p < .05; log odds −.545, p < .001). Figure 2B shows that the counteracting effects of gender and video treatment lead to nearly indistinguishable predicted probabilities between women and men in the combined treatments. While women have higher probabilities of participating in the questionnaire-only treatment than men, this relationship is reversed in the video treatment. In sum, the estimates suggest a greater leverage of intrinsic benefits for women (questionnaire treatment) and greater leverage of extrinsic benefits (video treatment) for men. This result is consistent with our expectations in Hypothesis 3. Thus, our information incentive manages to equalize participation probabilities between genders, but this comes at the considerable cost of overall lower response rates.
The results depicted in Figure 2C support Hypothesis 4 insofar as non-Austrians have higher predicted click probabilities than Austrians in the two treatments that focus on the video (log odds = .326, p < .01 for the video-questionnaire treatment and log odds = .356, p < .001 for the video treatment). However, as non-Austrians also display a higher break-off propensity than Austrians, the response probabilities of the two groups in the video-questionnaire treatment are very similar; that is, as discussed above, the video incentive helps to reduce response bias regarding migration background.
The results in Figure 2D indicate that education has a strong effect on participation probability. The higher the level of education, the higher the probability of clicking on the link and the lower the probability of break-off (see Figure 1D in the Online Appendix D). However, contrary to Hypothesis 5, we could not detect the expected positive effect of the video on less educated individuals. Hence, the video treatment did not result in a reduction of the response gap between highly and less educated individuals in the sample.
Discussion
Offering material incentives is often not practicable in web-based surveys. Researchers therefore have to find other ways to boost the benefit of survey participation. In this study, we assessed the effects of a sample-tailored information video on the click and response rates in a list-based web survey. At the same time, however, we consider that a focus on the incentive might be unrewarding due to the decreased salience of the intrinsic benefits of survey participation. Our results point out that nonmaterial incentives cannot easily increase the response probability and that the effect of the incentive differs across subgroups because of characteristics like topic interest, survey benefit framing, and cognitive burden. Hence, our findings should prove insightful for researchers intending to increase response rates in list-based web surveys.
However, some aspects of our study design need further discussion. First, in our study, the topic of the survey does not differ from the topic of the info treatment. Thus, the additional salience of job-search information in the video might not have increased interest in the survey for those who are disinterested in the survey itself. We encourage more research that varies the topic of the nonmaterial incentive. However, the task will be challenging as our results and those of others (Batinic & Moser, 2005; Marcus et al., 2007) demonstrate that the incentive should tend to the needs of the respective target group. Furthermore, mentioning two different topics in the invitation letter may also turn out to be counterproductive as this may further increase the burden associated with making the participation decision (Medway & Fulton, 2012; Schwartz, 2004).
Second, videos may, by their nature, reduce the response rate. They require a higher bandwidth and more sophisticated smartphones if the survey is answered with a mobile device. This might discourage sample members from participating in the survey (Mendelson et al., 2017; Shapiro-Luft & Cappella, 2013). Moreover, those who access the recruitment email on a mobile device in a situation where they feel unable to watch a video, for example, in a public place, may not click on the link. Thus, the video could affect response by discouraging some users from participating in a survey. This effect could explain our finding of lower response rates for the video-questionnaire treatment in comparison to the questionnaire-video group. However, if videos discourage mobile users from responding to survey requests, we would expect to find lower shares of mobile users in the video treatments compared to the survey-only treatment. We have calculated the relative shares of mobile users in the group of respondents and do not find substantial differences between treatments (for details refer to Appendix E in the Online Supplemental Material). Thus, we find no evidence that technical insufficiencies depending on mobile usage explain the differences in nonresponse.
Third, as the subject line in the invitation for the video-questionnaire treatment and the video-only treatment contained the word “video,” which is a medium often used for online advertisements, this might have led some individuals in the target group to perceive the email as spam. Hence, the differences in click rates between the questionnaire-video and video-questionnaire treatments can be caused by a combination of the subject line and the main text of the invitation. However, we did not change the subject line between the questionnaire-only and the questionnaire-video treatment. Therefore, the lower response rate in the latter cannot be the result of individuals perceiving the email to be spam, meaning the 5.7 percentage points difference between these two treatments can only be due to the increased perception of burden and the crowding out of intrinsic rewards.
Summary and Conclusion
Our results indicate that using a video as a nonmaterial incentive decreases the click and response rates compared to a standard survey. Thus, an information video does not necessarily function as a cost-effective technique to raise survey participation. As our sample of young and mostly less educated individuals should benefit more from the video than the general population, we believe that our results should also hold in general population surveys. We show that the negative effects of the video are not simply due to an increased time burden. Even when holding the total survey time constant and just varying the framing of the invitation email, we observe a significant decrease in response probability when the invitation focuses on the video instead of the questionnaire. We attribute this finding to a framing effect where the emphasis on the extrinsic benefits of the video reduces the salience of intrinsic benefits like being heard or helping others. Hence, researchers should be aware of unintended side effects when highlighting nonmaterial incentives in survey invitations.
Following LST, we recognize the possibility that our nonmaterial incentive might have different leverages on several subgroups in our sample, depending on the salience of cognitive burden, research topic, and benefit framing. Our results indicate that the effect of nonmaterial incentives is strongly moderated by gender, citizenship, and topic interest. Information incentives increase nonclick and nonresponse bias depending on topic interest. While this effect is undesirable when the target group is the general population, it might be valuable for more narrowly focused research, especially if the target group is strongly involved in the research topic. Thus, subgroup targeting with nonmaterial incentives might be an effective way to reduce response bias in web surveys if the email invitation can be tailored to specific subgroups. This supports previous evidence on the effectiveness of invitation personalization and subgroup targeting (Dillman et al., 2014; Keusch, 2015; Marcus et al., 2007).
In line with the idea of subgroup targeting, we have shown that the reduced cognitive burden of a survey that includes nonmaterial incentives and focuses less on intrinsic motivation for participation may help to motivate subgroups like migrants who are usually underrepresented in surveys. Our results indicate that the higher click rates of migrants balanced out their higher break-off propensity and led to less nonresponse bias in the video treatments than the treatments with a simple questionnaire. Presumably, the multimode nature of a video encourages more individuals who have language difficulties to respond to the survey request. This advantage of the video can be important for future surveys because migrants are usually underrepresented and successful strategies to increase their participation are valuable. Future research, however, would need to test whether the positive effect of the video treatment for migrants is solely caused by the reduced cognitive burden of needing lower levels of language proficiency or whether it is also due to an increased need for labor-market related information within this group. Similarly, the video also reduces response differences between men and women. In line with the overall effect of the nonmaterial incentive on response probability, this effect can be attributed to the increased salience of extrinsic benefits in the treatments with the information incentive. Thus, our results provide further evidence that women value intrinsic benefits more than men and that this explains some of the resulting differences in survey participation between genders. Hence, while lowering overall response, the video reduces gender nonresponse bias due to the increased salience of the extrinsic benefits of participation.
In sum, the results contribute to the growing literature on survey participation and the potential biasing effects of invitation framing. However, our findings also provide important insights for studies with videos as their prime research object, like ad research. Mentioning a video in the invitation may considerably increase nonresponse bias in these studies. Our results also speak to survey research in general by highlighting the importance of intrinsic benefits for survey participation. This underlines the recently emphasized issue of nonresponse as a common pool resource problem (Leeper, 2019). Because increasingly more surveys are being conducted, respondents might get tired of being asked to participate and intrinsic benefits might lose value for potential participants. As our results indicate that these intrinsic benefits are precisely the main drivers of participation, this could be highly problematic for future survey-based research. However, our results also suggest that—at least for the moment—focusing on respondents’ desires to be heard and their intention to help researchers is a valuable strategy when inviting individuals to participate in a web survey and far from obsolete. We thus encourage further research on the relationship between the intrinsic and extrinsic motivations of individuals for responding to survey requests.
Supplemental Material
sj-doc-1-ssc-10.1177_0894439320918318 – Supplemental Material for What’s the Benefit of a Video? The Effect of Nonmaterial Incentives on Response Rate and Bias in Web Surveys
Supplemental Material, sj-doc-1-ssc-10.1177_0894439320918318 for What’s the Benefit of a Video? The Effect of Nonmaterial Incentives on Response Rate and Bias in Web Surveys by Fabian Kalleitner, Monika Mühlböck and Bernhard Kittel in Social Science Computer Review
Footnotes
Declaration of Conflicting Interests
The authors declared no potential conflicts of interest with respect to the research, authorship, and/or publication of this article.
Funding
The authors disclosed receipt of the following financial support for the research, authorship, and/or publication of this article: the authors gratefully acknowledge funding from the Austrian Federal Ministry of Employment, Social Affairs, and Consumer Protection.
Software Information
Supplemental Material
The supplemental material is available in the online version of the article.
Notes
Author Biographies
References
Supplementary Material
Please find the following supplemental material available below.
For Open Access articles published under a Creative Commons License, all supplemental material carries the same license as the article it is associated with.
For non-Open Access articles published, all supplemental material carries a non-exclusive license, and permission requests for re-use of supplemental material or any part of supplemental material shall be sent directly to the copyright owner as specified in the copyright notice associated with the article.