
Abstract
In social science research, unipolar and bipolar scales are commonly used methods in measuring respondents’ attitudes and opinions. Compared to other rating scale characteristics, scale polarity (unipolar and bipolar) and its effects on response behavior have rarely been addressed in previous research. To fill this gap in the literature, we investigate whether and to what extent fully verbalized unipolar and bipolar scales influence response behavior by analyzing observed and latent response distributions and latent thresholds of response categories. For this purpose, we conducted a survey experiment in a probability-based online panel and randomly assigned respondents to a unipolar or bipolar scale condition. The results reveal substantial differences between the two rating scales. They show significantly different response distributions and measurement non-invariance. In addition, response categories (and latent thresholds) of unipolar and bipolar scales are not equally distributed. The findings show that responses to unipolar and bipolar scales differ not only on the observational level but also on the latent level. Both rating scales vary with respect to their measurement properties, so that the responses obtained using each scale are not easily comparable. We recommend not considering unipolar and bipolar scales as interchangeable.
Keywords
Introduction and Background
Many major national and international surveys, such as the CROss National Online Survey, which is part of the European Social Survey, regularly measure respondents’ attitudes and opinions on a variety of political and social topics, such as income (in)equality. To measure this kind of information, researchers usually employ rating scales (i.e., closed response formats with a list of ordered response categories). Several design aspects must be considered by researchers when designing rating scales because these aspects can have a profound impact on response behavior and data quality (see DeCastellarnau, 2018; Höhne & Krebs, 2018; Krosnick & Presser, 2010).
Researchers must decide whether to have a midpoint or not (i.e., whether to have an even or uneven number of scale points). Other scale characteristics that must be decided include the actual number of scale points (i.e., length of the scale), the inclusion of numeric values (i.e., whether the scale points are provided with or without numbers), the scale direction (i.e., decremental or incremental), the scale alignment (i.e., horizontal or vertical), and the extent of scale verbalization (e.g., fully or end verbalized). The aspect of scale verbalization is associated with the aspect of scale polarity (i.e., unipolar or bipolar).
Verbal labels for all categories (i.e., fully verbalized) or only for the end categories (i.e., end verbalized) of a rating scale convey information on the polarity of the scale. Unipolar and bipolar scales differ with respect to their request for an evaluation from respondents. Unipolar scales consist of categories that are organized along a continuum, such as the degree of agreement. In the case of decremental scales, response categories run from the uppermost point to the lowermost point. Bipolar scales, in contrast, consist of categories that are organized along a continuum with two opposite (positive and negative) ends, such as the degree of both agreement and disagreement. The response categories commonly run from the uppermost positive point through a “transition point” (Schaeffer & Presser, 2003) that is located in the middle of the scale (e.g., “neither/nor” in fully verbalized scales; see Wang & Krosnick, 2019) to the uppermost negative point. Unipolar and bipolar scales are sometimes accompanied by numeric values underlining the scale polarity and the equidistance between the scale points (Kennedy, 2008; Klockars & Yamagishi, 1988; Krebs, 2012; Menold, 2019; Schwarz et al., 1991). Accordingly, unipolar scales have positive values, and bipolar scales have both positive and negative values. Table 1 displays a survey question on income differences based on 5-point, fully verbalized unipolar and bipolar scales without numeric values.
Example of a Survey Question on Income Differences Based on 5-Point, Fully Verbalized Unipolar and Bipolar Scales Without Numeric Values.
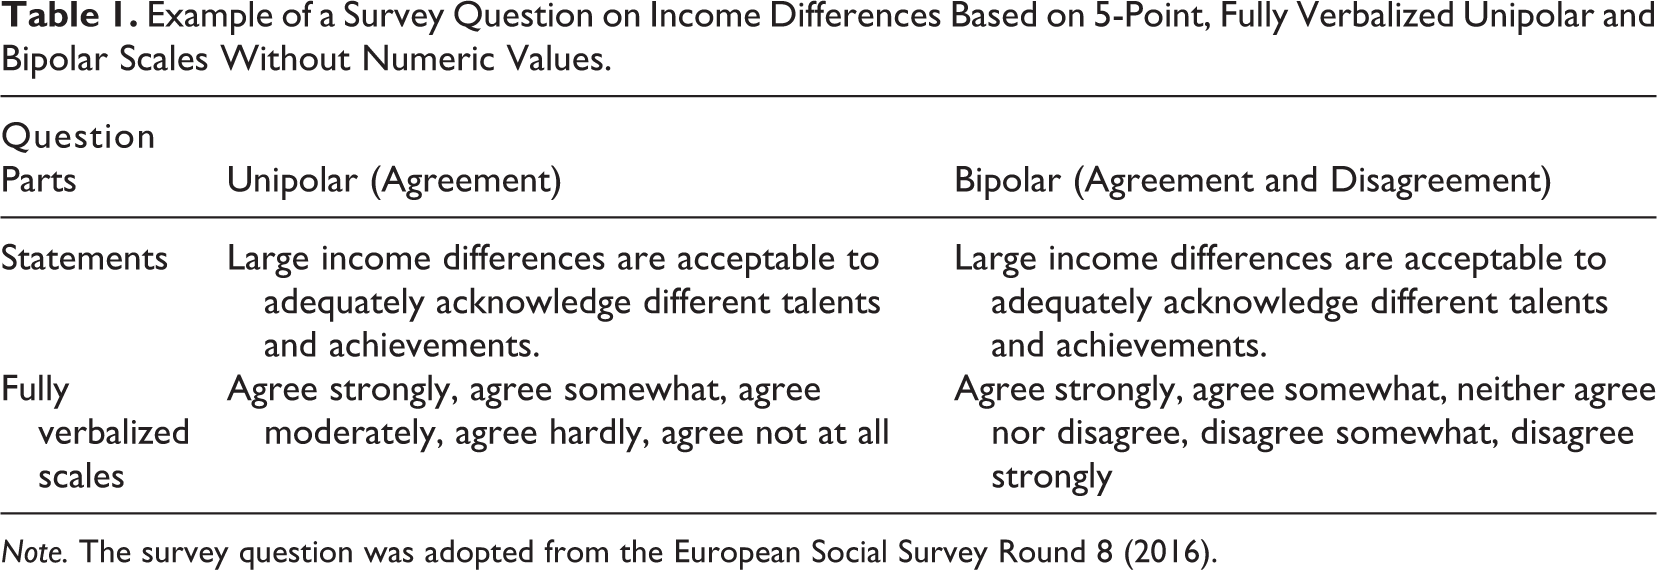
Note. The survey question was adopted from the European Social Survey Round 8 (2016).
The decision of whether to measure respondents’ attitudes and opinions with unipolar or bipolar scales is somewhat controversial (see, for instance, Alwin, 2007, 2010; DeCastellarnau, 2018; Krosnick & Fabrigar, 1997; Menold, 2019; Menold & Raykov, 2015; Schaeffer & Presser, 2003; Thomas & Barlas, 2018). Some researchers recommend the use of unipolar scales (e.g., running along an agreement continuum), and some others recommend the use of bipolar scales (e.g., running along an agreement and disagreement continuum). However, previous research has shown that the polarity of rating scales can affect response behavior. For instance, verbal labels—whether on a unipolar or bipolar scale—convey information that respondents, as “cooperative communicators” (Schwarz, 1996), use to comprehend and answer survey questions meaningfully (Höhne et al., 2019; Höhne & Yan, 2019; Parducci, 1983; Sudman et al., 1996; Toepoel & Dillman, 2011a, 2011b; Tourangeau et al., 2004, 2007).
As shown by Rohrmann (1978) in Germany and by Mohler et al. (1998) in Germany and the United States, verbal labels of unipolar and bipolar scales that might appear equivalent at first glance can substantially differ in terms of their literal meaning, which violates the criterion of equidistance (Stevens, 1946). 1 This might impede the comparability of responses to identical survey questions with (slightly) different verbally labeled rating scales. For instance, the fully verbalized unipolar and bipolar scales in Table 1 consist of the same starting points (i.e., “agree strongly” and “agree somewhat”) but differ with respect to the midpoints (i.e., “agree moderately” vs. “neither agree nor disagree”) and with respect to the second part of the scale (i.e., “agree hardly” and “agree not at all” vs. “disagree somewhat” and “disagree strongly”).
The problem of comparability is especially associated with fully verbalized scales in which the bipolar labels of the midpoint and the negative (or opposite) part of the scale differ from the unipolar labels. While the unipolar midpoint (usually) indicates a moderate level of agreement, the bipolar midpoint can have different meanings depending on the respective wording (see Menold, 2019; Wang & Krosnick, 2019). For instance, it can be conceived as indicating ambivalence or indifference (Kennedy, 2008; Menold, 2019; O’Muircheartaigh et al., 1995; Schaeffer & Presser, 2003; Schneider & Schwarz, 2017). Ambivalence implies that respondents have positive and negative feelings preventing them from having a clear attitude or opinion toward the object under consideration (Menold, 2019; Schaeffer & Presser, 2003; Schneider & Schwarz, 2017). This particularly applies when using middle categories that consist of “partly/partly” formulations. In contrast, indifference implies that respondents either have a neutral or no position at all toward the object under consideration (Krosnick & Fabrigar, 1997; Menold, 2019; Sturgis et al., 2014). This particularly applies when using middle categories that consist of neither/nor formulations. While partly/partly formulations allow respondents to admit having a conflicting position, neither/nor formulations might force respondents to one of the two opposing parts of bipolar scales. These (linguistic/logical) differences between unipolar and bipolar scales may change not only the evaluative character of the scales but also the substantial position of each verbal label (or response category) in comparison to the other ones.
In contrast to other scale design aspects, such as the number of scale points and scale direction, research on the impact of scale polarity on response behavior and data quality is scarce. This impression is corroborated by the results of an extensive literature review on scale characteristics by DeCastellarnau (2018).
It seems that responses to bipolar scales, compared to responses to unipolar scales, are characterized by a shift toward the positive end of the scale (Kennedy, 2008; Krebs, 2012; Kunz, 2015; Menold, 2019). This shift manifests itself in a higher selection of positive (agree) response categories in bipolar scales than in unipolar ones (Kennedy, 2008; Menold, 2019; O’Muircheartaigh et al., 1995; Schaeffer & Presser, 2003). In contrast, it seems that responses to unipolar scales, compared to those to bipolar scales, are characterized by a shift toward the middle of the scale, which manifests itself in a higher selection of the middle category (O’Muircheartaigh et al., 1995). Thus, unipolar and bipolar scales can influence the comprehension of survey questions in different ways, which might have an effect on scale properties, such as the equidistance between scale points (or response categories). This effect impedes the comparability of responses to identical survey questions that are measured with unipolar or bipolar scales.
In this study, we systematically investigate whether and to what extent fully verbalized unipolar and bipolar scales affect response behavior in a probability-based online panel. For this purpose, we analyze observed and latent response distributions and compare latent thresholds to get insight on the equidistance between response categories. By comparing unipolar and bipolar scales at this level of analysis, our study contributes to the survey literature by advancing our knowledge on rating scales that differ in terms of polarity.
Research Hypotheses
As shown by previous research, unipolar scales frequently yield response distributions that differ from those obtained from bipolar scales. Respondents seem to be more reluctant to select categories that indicate disagreement than to select categories that indicate no agreement. Therefore, respondents may produce more positive responses in bipolar than in unipolar scales (Kennedy, 2008; Krebs, 2012; Kunz, 2015; Menold, 2019; O’Muircheartaigh et al., 1995; Schaeffer & Presser, 2003). In accordance with previous research, we expect higher proportions of positive “agreeing” responses in bipolar than in unipolar scales (Hypothesis 1a).
The middle response category of bipolar scales (i.e., neither agree nor disagree) can be interpreted in different ways (Kennedy, 2008; O’Muircheartaigh et al., 1995; Schaeffer & Presser, 2003; Schneider & Schwarz, 2017). One particular way is to interpret it as a neutral point that suggests the absence of both opposite parts of the continuum. According to O’Muircheartaigh et al. (1995), respondents commonly wish to avoid selecting “neutral” appearing response categories in bipolar scales, but they find it acceptable to select “moderate” appearing response categories in unipolar scales. We therefore expect higher proportions of responses to the middle category in unipolar than in bipolar scales (Hypothesis 1b).
Since previous research shows differences in response behavior between unipolar and bipolar scales, it is unclear whether these differences only occur on the observational level or whether they also occur on the latent level. Latent measurement invariance between unipolar and bipolar scales has rarely been tested in survey research. We therefore test measurement invariance between unipolar and bipolar scales. Consistent with our previous hypotheses on the observational level and the findings reported in the survey literature on the differences between the two types of rating scales, we expect to obtain measurement non-invariance between unipolar and bipolar scales on the latent level (Hypothesis 2).
For the next hypothesis, we switch from the multiple indicator factor level to the survey question-level focusing on response categories and their latent thresholds. Applying an item response theory (IRT) approach, the probability of selecting a specific response category is a function of respondents’ position on the latent factor (or latent trait) and survey question characteristics (Wetzel & Carstensen, 2014). This approach accounts for each category of a rating scale using threshold parameters. A threshold parameter marks the point on a latent continuum where a response to a response category x is more likely than a response to a response category x − 1 (Wetzel & Carstensen, 2014, p. 766). It is generally assumed that response categories and their latent thresholds are equidistantly and normally distributed (Rost, 1988). However, as suggested by Rohrmann (1978), verbal labels of rating scales can have a profound effect on the equidistance between response categories. This applies to the observational and latent level. Since unipolar and bipolar scales differ with respect to scale verbalization, this might affect latent thresholds. While unipolar scales consistently run from the high to the low side (or vice versa), bipolar scales are divided into two opposite parts with an ambiguous midpoint that potentially affects the interpretation of the other response categories. Therefore, we expect the latent thresholds of unipolar scales to be more equidistantly distributed than those of bipolar scales (Hypothesis 3).
Method
Online Data Collection
The data were collected in the German Internet Panel, which is part of the Collaborative Research Center 884 “Political Economy of Reforms” at the University of Mannheim. The German Internet Panel is based on an initial recruitment in 2012 and two refresher recruitments in 2014 and 2018. While the recruitments in 2012 and 2014 are based on a three-stage stratified probability sample, the recruitment in 2018 is based on a two-stage stratified probability sample of the German population aged from 16 to 75 years. For a detailed methodological description of the German Internet Panel, we refer interested readers to Blom et al. (2015).
The German Internet Panel invites all panel members every 2 months to participate in a self-administered online survey that deals with a variety of economic, political, and social topics. Each online survey lasts about 20 min. For their participation in each wave, respondents receive a compensation of 4 euros.
At the beginning of each wave, panelists are directed to a short welcome page announcing the approximate length of the online survey and informing them that the compensation for their participation will be credited to their study account after survey completion. The survey questions used in this study were included at the beginning of the online survey limiting carryover effects from other panel modules.
Sample
In this article, we use data that were collected in Wave 40 of the German Internet Panel. This wave ran from March 1 to March 31, 2019, with a total of 4,890 respondents. Out of those, 2,427 (49.6%) respondents took part in the present study. 2 The mean age of these respondents is 49.4 (SD = 15.8), and 49.5% of them are female. In terms of education, 12.4% graduated from a lower secondary school, 31.5% from an intermediate secondary school, and 52.2% from a college preparatory secondary school or university. Furthermore, 1.4% were still attending school or left school without a diploma, and 2.6% reported having a different degree from those mentioned above.
Experimental Design
To investigate the effects of scale polarity (i.e., unipolar or bipolar) in a probability-based online panel, we conducted a split-ballot experiment and randomly assigned respondents to a scale condition. One group (n = 1,216) received survey questions with fully verbalized unipolar scales (unipolar condition). Another group (n = 1,211) received the same survey questions with fully verbalized bipolar scales (bipolar condition).
To evaluate the effectiveness of random assignment and the sample composition between the two experimental groups, we conducted χ2 tests. The results showed no statistically significant differences regarding age, gender, and education.
Survey Questions Used in This Study
In total, this study consisted of five survey questions, which were adopted from the German versions of the European Social Survey (2002 and 2016) dealing with different aspects of income (in)equality. We excluded one survey question from the analyses because it did not load on the same latent factor as the other four. 3 For each survey question adopted from the European Social Survey, we developed unipolar and bipolar scales keeping the phrasing of the original statements (or items) intact. To limit question order effects, we randomized the order of the survey questions. Each survey question was presented on a separate page using 5-point, vertically aligned rating scales (see Appendix A for English translations).
Analytical Strategy
In a first step, we test whether unipolar and bipolar scales differ in terms of response distributions. For this purpose, we conduct χ2 tests for each of the four survey questions used in this study. To test our expectations stated in Hypothesis 1a (selection of the unambiguously positive agree categories) and Hypothesis 1b (selection of the middle category), we conduct directed Z-tests for the proportions of the first two positive response categories and for the differing middle response categories, respectively.
In order to test Hypothesis 2 on measurement non-invariance between unipolar and bipolar scales, we conduct a confirmatory factor analysis (CFA) using one latent variable and four indicators for both unipolar and bipolar scales. We then conduct a multigroup confirmatory factor analysis (MG-CFA) to test for configural measurement invariance (with an identical dimensional structure for unipolar and bipolar scales). Subsequently, we successively apply increasing equality constraints on the parameters (Byrne, 2008; Davidov et al., 2014). First, by constraining the factor loadings to be equal (metric invariance) and second, by constraining the intercepts to be equal (scalar invariance). While metric invariance allows the comparison of correlations, scalar invariance allows the comparison of latent means. This analysis strategy tests whether the measurement of attitudes and opinions with unipolar and bipolar scales is equivalent.
In this study, we follow the notion of strong measurement invariance requiring scalar invariance. The main reason is that partial measurement invariance can lead to unstable and arbitrary results. For instance, Steinmetz (2013) found in a simulation study that violating scalar invariance remarkably affects the accuracy of (latent) mean comparisons. Even though the literature offers some methodological discussions on how to deal with partial measurement invariance (see, for instance, Chen, 2008; Jung & Yoon, 2016; Steenkamp & Baumgartner, 1998; Yoon & Kim, 2014), little is known about the statistical or conceptual implications of accepting partial measurement invariance (Putnick & Bornstein, 2016, p. 84).
Criteria for testing measurement invariance between models with increasing equality constraints are non-significant differences between χ2 values (Bryant & Satorra, 2012; Byrne, 2012) and differences between comparative fit index (CFI) and root mean square error of approximation (RMSEA) lower than 0.01 (Cheung & Rensvold, 2002). Opposing results imply measurement non-invariance supporting Hypothesis 2. Since the indicators of the latent variable are measured on 5-point rating scales, we assume a continuous scale level (see Rhemtulla et al., 2012) and use the robust maximum likelihood (MLR) discrepancy function.
In contrast to the analysis of measurement invariance, the analysis of survey questions refers to latent thresholds. The response categories of rating scales (and their thresholds) are approximate (ordinal) measures of a continuous latent variable. In order to test Hypothesis 3 on the equidistance of latent thresholds, we first compute unrestricted univariate probit models for each survey question assuming a standard normal distribution of the latent response categories. For these models, we use the weighted least squares (WLS) discrepancy function. Second, we compute linear regressions of the estimated unrestricted thresholds on ascending integers 1 to 4 and investigate the explained variances (R2 values) for unipolar and bipolar scales. In a further model, we constrain the latent thresholds to equal distances and compare the model fits of unipolar and bipolar scales. If Hypothesis 3 applies, the goodness of fit of the constrained threshold models should be better (i.e., lower RMSEA values) for unipolar than for bipolar scales.
The χ2 and Z-tests and the linear regressions are conducted using SPSS Version 24. The analyses on measurement invariance and the latent threshold models are conducted using Mplus Version 6.12 (see Appendix B for the Mplus commands).
Results
Response Distributions
To investigate how unipolar and bipolar scales affect response behavior, we first analyzed the response distributions of the four survey questions on income (in)equality. Table 2 displays the results. The table shows that the two rating scales produce significantly different response distributions. This applies to all four survey questions.
Response Distributions (in Proportions) of the Four Survey Questions With Unipolar and Bipolar Scales.
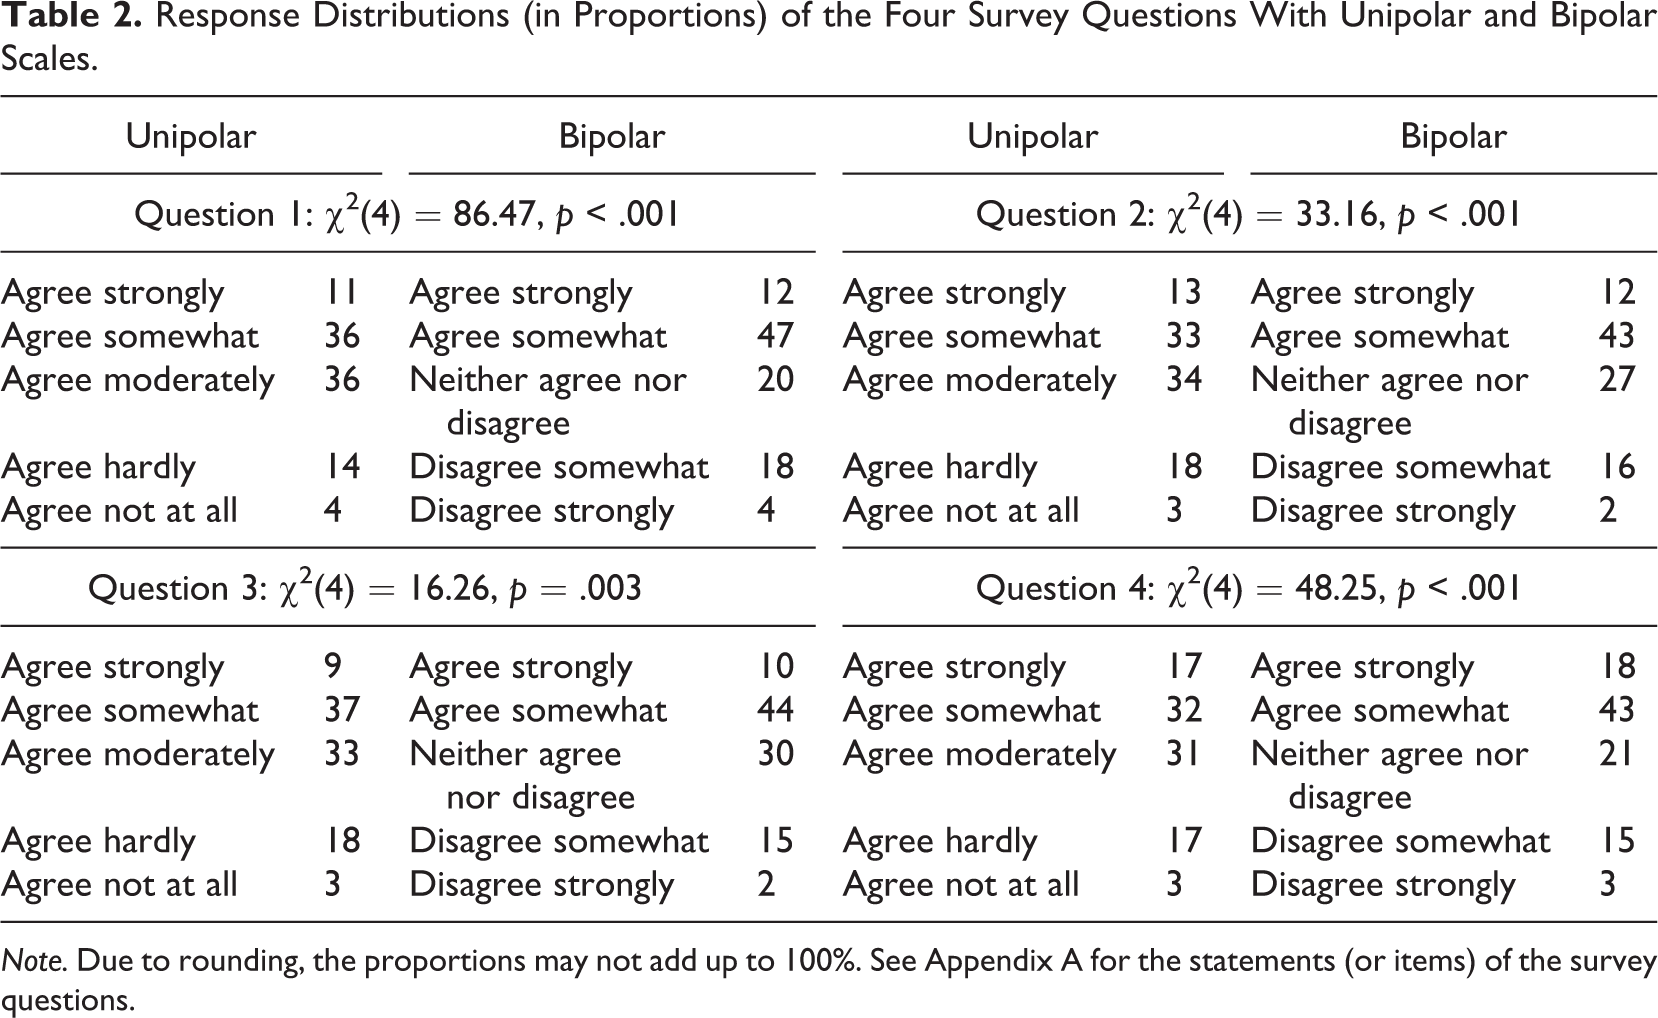
Note. Due to rounding, the proportions may not add up to 100%. See Appendix A for the statements (or items) of the survey questions.
In line with Hypothesis 1a and the results of previous research, bipolar scales indeed led to more positive agree responses than their unipolar counterparts. For appropriate statistical testing, we aggregated the identical two agree response categories of the 5-point unipolar and bipolar scales, respectively. We then conducted directed Z-tests (in accordance with the postulated direction in Hypothesis 1a: bipolar > unipolar) and tested for significant differences between unipolar and bipolar scales: Question 1 (Z = 5.92, p < .001), Question 2 (Z = 4.43, p < .001), Question 3 (Z = 3.40, p < .001), and Question 4 (Z = 5.93, p < .001). These results strongly support Hypothesis 1a, which postulated higher proportions of positive agree responses in bipolar than in unipolar scales.
In the next step, we tested Hypothesis 1b on the selection of the middle category. Again, we conducted directed Z-tests (in accordance with the postulated direction in Hypothesis 1b: unipolar > bipolar). The results are as follows: Question 1 (Z = 9.15, p < .001), Question 2 (Z = 3.69, p < .001), Question 3 (Z = 1.91, p = .03), and Question 4 (Z = 6.92, p < .001). These findings provide strong support for Hypothesis 1b, revealing that unipolar scales yield more middle responses than their bipolar counterparts. These findings also support the claim of O’Muircheartaigh et al. (1995) that respondents feel more comfortable selecting moderate appearing response categories than neutral appearing ones.
Measurement Invariance
In order to test Hypothesis 2 on measurement non-invariance between unipolar and bipolar scales, we first computed separate but identical CFA baseline models for each scale polarity. Each of these models included one latent variable with four indicators. We additionally set one error covariance between two survey questions. 4
In the next step, we tested for measurement invariance by computing a MG-CFA. To this end, we first tested for configural invariance by simultaneously analyzing the baseline models for the two scale polarities. Table 3 displays the results. Given that CFI values are higher than 0.95 and RMSEA values are lower than 0.05, configural invariance was accepted for survey questions with unipolar and bipolar scales. To test for metric invariance, factor loadings were constrained to equality between the two rating scales. The model goodness-of-fit statistics were satisfactory, and thus, we accepted metric invariance. In addition, no significant differences were found between the (mean-adjusted) χ2 values (Byrne, 2012). Finally, we tested for scalar invariance by imposing equality constraints on the intercepts. As indicated by the significant result of the χ2 difference test, scalar invariance cannot be accepted. This result suggests that the scalar model performs significantly worse than the metric model, which also implies that the latent factor means cannot be compared for unipolar and bipolar scales. These findings support Hypothesis 2, which postulated measurement non-invariance between the two rating scales.
Testing Measurement Invariance Between Unipolar and Bipolar Scales.
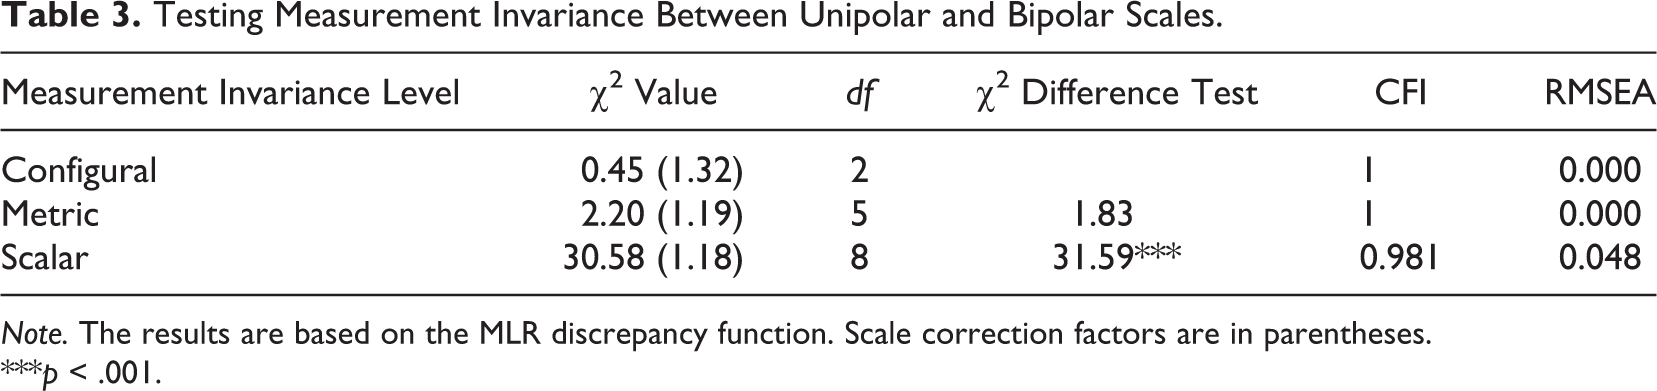
Note. The results are based on the MLR discrepancy function. Scale correction factors are in parentheses.
***p < .001.
Latent Thresholds
The lack of scalar invariance between unipolar and bipolar scales provides empirical evidence that the two rating scales cannot be used interchangeably. To dig deeper and to provide further evidence for the reasons of non-invariance, we now investigate response categories and their latent thresholds. This means that we switch our focus from the multiple indicator factor level to the survey question level.
In order to test Hypothesis 3 on the equidistance of latent thresholds, we first computed univariate probit models with unrestricted thresholds. 5 By using these model-estimated latent thresholds as dependent variables in a linear regression on ascending integers from 1 to 4, we investigate (using R2 values) whether the sequential order of latent thresholds is better represented in unipolar than bipolar scales. Table 4 displays the results. The R2 values reveal differences between the two rating scales. More specifically, the order of estimated unrestricted latent thresholds is better in unipolar than bipolar scales. This is evidenced by the consistently slightly higher R2 values, which indicates higher explained variances. These findings provide preliminary support for Hypothesis 3. The results displayed in Table 4 are also graphically illustrated in Appendix C. Figures C1 to C4 show the distances between the unrestricted thresholds for unipolar and bipolar scales.
R2 and Corrected R2 Values of Linear Regressions of Estimated Unrestricted Latent Thresholds (Y) on Ascending Integers (X = 1 to 4) for Unipolar and Bipolar Scales.
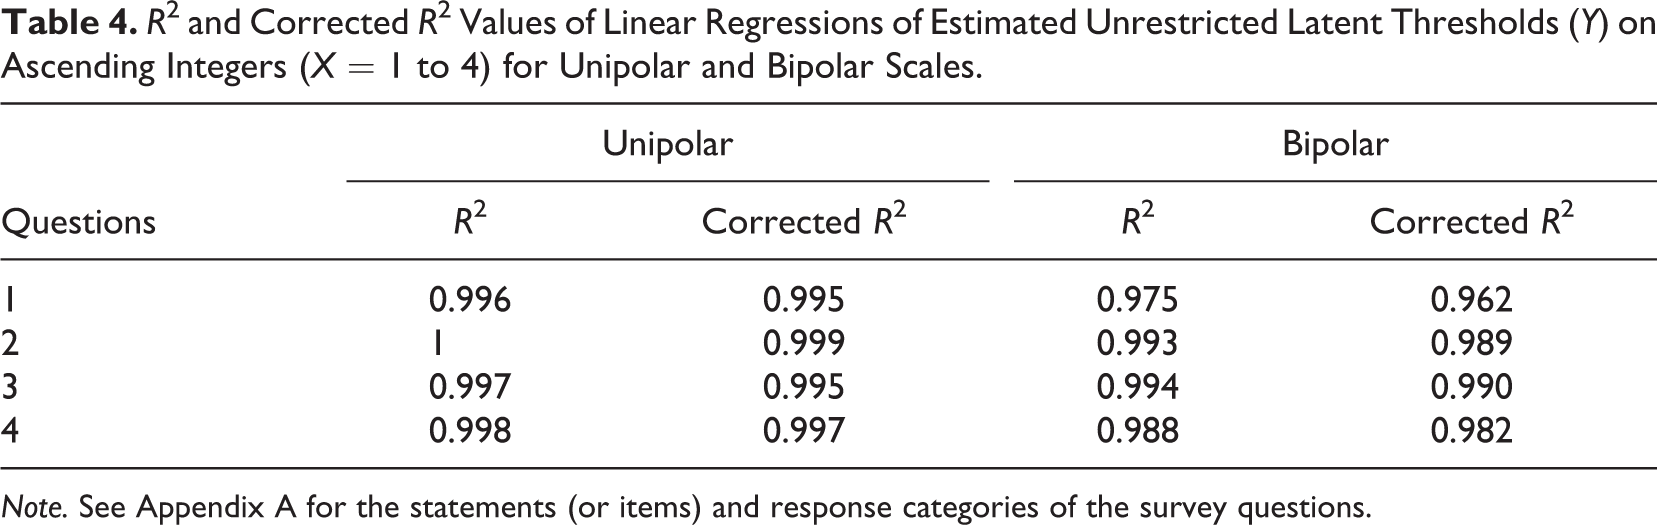
Note. See Appendix A for the statements (or items) and response categories of the survey questions.
In the next step, we computed univariate probit models in which the latent thresholds were constraint to equal distances. We then compared the goodness-of-fit indices. Table 5 displays the results. In line with the results of the regression analyses, the models with equality constraints on latent thresholds reveal that unipolar scales perform better than their bipolar counterparts. This is indicated by the consistently lower RMSEA values of the unipolar models. Altogether, the results reported in Tables 4 and 5 provide strong evidence for Hypothesis 3. In addition, they indicate that different verbal labels of rating scales substantially affect measurement properties.
Fit Indices of Univariate Probit Models With Latent Thresholds Constrained to Equal Distances for Unipolar and Bipolar Scales.
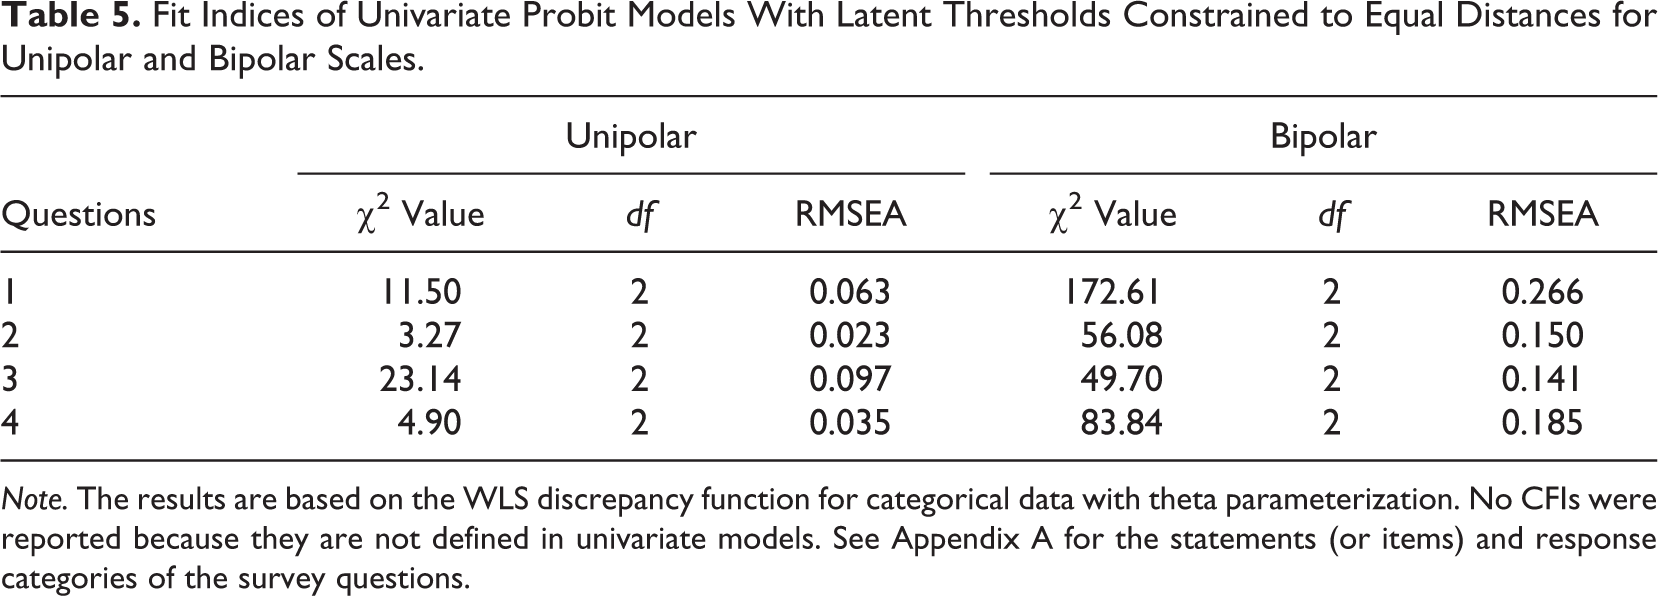
Note. The results are based on the WLS discrepancy function for categorical data with theta parameterization. No CFIs were reported because they are not defined in univariate models. See Appendix A for the statements (or items) and response categories of the survey questions.
Discussion and Conclusion
In this experimental study, we analyzed observed and latent response distributions and computed latent thresholds to infer the equidistance between response categories of unipolar and bipolar scales. The results clearly show that there are substantial differences between both rating scales. This means that scale polarity carries consequences for measurement properties.
With respect to Hypothesis 1a on the selection of unambiguous agree responses (agree strongly and agree somewhat), our findings corroborate those obtained in previous research on unipolar and bipolar scales (Kennedy, 2008; Krebs, 2012; Kunz, 2015; Menold, 2019; O’Muircheartaigh et al., 1995; Schaeffer & Presser, 2003). The results reveal that respondents indeed tend to prefer response categories of the positive (agree) part of bipolar scales. This particularly applies to agree somewhat, which is the most frequently selected response category across all four survey questions with bipolar scales. All in all, these findings hint at a positivity bias, implying that respondents may be attempted to avoid coming across as being overly negative or critical in their evaluations (Tourangeau et al., 2000, p. 241). However, this explanation needs to be empirically tested.
The results on Hypothesis 1b, which was on the selection of the middle response category, support our hypothesis. Proportions of responses to the middle category of unipolar scales (agree moderately) are significantly higher than proportions of responses to the middle category of bipolar scales (neither agree nor disagree). The findings are in line with O’Muircheartaigh et al. (1995) and suggest that respondents tend to prefer moderate responses over neutral or indifferent ones. In this study, however, we did not experimentally vary the middle response category of bipolar scales (e.g., partly/partly vs. neither/nor), and thus, it would be interesting to investigate whether our findings remain the same when differing the verbalization of the midpoints.
To investigate Hypothesis 2, we tested for measurement invariance between unipolar and bipolar scales. The results provide evidence for metric invariance, implying that the latent structure is not influenced by scale polarity. However, we did not obtain scalar invariance, implying that the intercepts of the two rating scales differ from each other. This finding may point to the presence of systematic measurement errors caused by differences in processing or comprehending unipolar and bipolar scales. The sources of this measurement error might be the middle attraction in unipolar scales and/or the positivity bias in bipolar scales. In addition, the lack of scalar invariance indicates that the frequently reported mean differences between unipolar and bipolar scales might be an artifact because mean values obtained by the two rating scales cannot be compared.
With respect to Hypothesis 3, we investigated whether the latent thresholds of unipolar and bipolar response categories are equidistantly distributed. This was done by computing threshold parameters for each response category of both rating scales across the four survey questions used in this study. The results reveal that the latent thresholds of unipolar scales are indeed more equidistantly distributed than those of bipolar scales. One reason might be related to the nature of the two rating scales: Unipolar scales consistently proceed from the high to the low side (or vice versa), but bipolar scales are separated into two opposite parts that have an unclear midpoint, which may influence the interpretation of the other response categories. To shed light on respondents’ perception of unipolar and bipolar scales and the consequences of scale polarity for measurement properties, more research is needed that is based on the IRT approach.
This study has three limitations that can be addressed in future research. First, we only compared 5-point, fully verbalized unipolar and bipolar scales with vertical alignment. However, there are numerous design aspects that can be varied when comparing unipolar and bipolar scales. In relation to this point, it would be interesting to compare end instead of fully verbalized scales that consist of less verbal labels that potentially influence the processing of survey questions with unipolar and bipolar scales. Second, we conducted our study in one country (Germany). It remains unclear whether our findings hold in a cross-national or cross-cultural comparison because linguistic differences may also have an impact on the measurement properties of unipolar and bipolar scales. We therefore suggest that future research goes a step further and compares the two rating scales in a cross-national or cross-cultural setting. Finally, we only employed survey questions on income (in)equality with rating scales that run along an agreement (unipolar) or agreement and disagreement (bipolar) continuum. Future research could vary the evaluation continuum and/or question topic to provide further supporting evidence for the effect of scale polarity on response behavior.
The aim of this study was to investigate the effects of fully verbalized unipolar and bipolar scales on response behavior in a probability-based online panel. For this purpose, we conducted a survey experiment on scale polarity. Our results successively replicated earlier findings on the differences between unipolar and bipolar scales and provided new evidence that the two rating scales substantially differ with respect to measurement properties. Since most of the existing studies on scale polarity remain on the observational level comparing response distributions, our analyses contribute to the survey literature by revealing measurement non-invariance between both rating scales. We could also show that response categories of unipolar scales are more equidistant than those of bipolar scales, and thus, we recommend preferring unipolar over bipolar scales when measuring different aspects of income (in)equality. Most importantly, our findings show that both rating scales are not interchangeable because they appear to measure different facets of the attitudes and opinions of interest. This also means that researchers should carefully consider their decisions about scale polarity and exercise caution when interpreting results obtained from unipolar and bipolar scales of the same survey questions.
Footnotes
Appendix A
Appendix B
Appendix C
Authors’ Note
The authors are grateful to Annelies Blom (University of Mannheim) and Stephan Schlosser (University of Göttingen) for their support in conducting this study.
Data Availability
The data used in this study will be available to the scientific community via the GESIS Data Archive for the Social Sciences.
Declaration of Conflicting Interests
The authors declared no potential conflicts of interest with respect to the research, authorship, and/or publication of this article.
Funding
The authors disclosed receipt of the following financial support for the research, authorship, and/or publication of this article: We acknowledge financial support by the German Science Foundation through the Collaborative Research Center 884 “Political Economy of Reforms” at the University of Mannheim (Germany).
Software Information
For data analyses, we used SPSS Version 24 and Mplus Version 6.12.