
Abstract
A major concern arising from ubiquitous tracking of individuals’ online activity is that algorithms may be trained to predict personal sensitive information, even for users who do not wish to reveal such information. Although previous research has shown that digital trace data can accurately predict sociodemographic characteristics, little is known about the potentials of such data to predict sensitive outcomes. Against this background, we investigate in this article whether we can accurately predict voting behavior, which is considered personal sensitive information in Germany and subject to strict privacy regulations. Using records of web browsing and mobile device usage of about 2,000 online users eligible to vote in the 2017 German federal election combined with survey data from the same individuals, we find that online activities do not predict (self-reported) voting well in this population. These findings add to the debate about users’ limited control over (inaccurate) personal information flows.
Keywords
Passively measured digital trace data are used for many purposes in academic and commercial research. In recent years, social science researchers have turned to data collected on Twitter, for example, to study political polarization (Conover, Goncalves, Ratkiewicz, Flammini, & Menczer, 2011) and predict election outcomes (see Gayo-Avello, 2013, for a review). Other studies used Facebook Likes to estimate a wide range of individuals’ personal attributes such as sexual orientation and political views (Kosinski, Stillwell, & Graepel, 2013) or analyzed weblogs to measure partisan polarization in political news consumption (Peterson, Goel, & Iyengar, 2018). Digital traces have received similar attention in political campaigns. In 2012, for example, the Obama election campaign used data on voters’ browsing behavior and services from data brokers like Acxiom to deliver personalized ads (Duhigg, 2012). Since then, digital trace data have been an essential element of political campaigns in the United States and elsewhere (Kruschinski & Haller, 2017; Nickerson & Rogers, 2013).
Online advertising, however, is likely the largest field where digital trace data have played a prominent role. While browsing the Internet, individuals leave massive amounts of data that companies collect through technologies like cookies and browser fingerprinting (Lerner, Kornfeld Simpson, Kohno, & Roesner, 2016). Based on demographics, personality attributes or interests inferred from users’ online activity (website visits), companies tailor search results, ads, social media, and prices to individuals (Christl, 2017; Dolin et al., 2018; Fourcade & Healy, 2013).
Even if Internet users are aware of online behavioral advertising and find tailored ads and personalized search results helpful, they often have a poor understanding of how and what companies can learn from their data (Dolin et al., 2018; Pew Research Center, 2019; Ur, Leon, Cranor, Shay, & Wang, 2012). Similarly, critics of such activities voice concerns about companies’ lack of transparency regarding the data collected: It is often unclear who collects what data, with whom the data are shared, and what analyses for the data are used for (e.g., Christl, 2017). The inner workings of the proprietary algorithms used to analyze the data are often hidden from the public, making it nearly impossible for users to examine the appropriateness of the information flow (Nissenbaum, 2010) and to maintain control over it (Christl, 2017; Pew Research Center, 2019; Simo, 2015). Moreover, although users are often more concerned about the accuracy of predicted attributes than the sensitivity of those attributes themselves, we know very little regarding how much predicted attributes overlap with the actual attributes (Dolin et al., 2018). In a rare example documenting the accuracy of interests inferred by Facebook, a recent study by Pew reports that more than one quarter of U.S. respondents do not find their predicted interests, including items such as political views, to be accurate (Pew Research Center, 2019). Lastly, extensive tracking of online behavior may be paired with privacy policies on websites that are too long to read and too complicated to understand, suggesting that users consent to privacy terms they neither know (because they did not read them) nor understand (because they are too complicated and vague; Christl, 2017; McDonald & Cranor, 2008; Milne & Culnan, 2004; Simo, 2015).
A major concern that arises from ubiquitous tracking of individuals’ online activity is that algorithms may be trained to predict sensitive information (Bischoff, Cygan, Münkel, & Schindler, 2018; Christl, 2017; Lecuyer et al., 2015). Previous work focusing on less sensitive information shows that demographic attributes can be predicted from users’ online activity with high accuracy (e.g., up to 82% accuracy/0.85 receiver operator characteristic–area under the curve [ROC-AUCs] in Goel, Hofman, & Sirer, 2012). Going beyond previous research, we ask in this article to what degree sensitive information can be inferred from users’ online activity through the use of web browsing histories and records of mobile device use. Moreover, we provide an estimate of the accuracy of such predictions.
We focus our analyses on political views, specifically voting behavior. In Germany, political views and voting behavior are considered sensitive personal data. Voting decisions are subject to strict privacy regulations and require special protection (Dienlin, 2015; Nebel, 2015). In addition, the General Data Protection Regulation (GDPR), implemented in 2018 for all countries of the European Union (EU), requires explicit consent for processing of personal data revealing political opinions (Regulation [EU], 2016, Art. 9). Using records of individuals’ online activity, we study how much such records reveal about voting decisions, that is, whether digital trace data may be (mis)used to infer sensitive information about individuals. For a better understanding of the performance of our algorithms, we compare performance evaluation metrics of several sensitive outcomes (voting) with those of less sensitive information (sociodemographic information). Data come from about 2,000 German Internet users who agreed to have their web browsing and mobile device use monitored for a period of 4 months, before and shortly after the German federal election in September 2017. In addition to the records of web browsing and mobile device use, we use survey data collected from the same individuals. Survey records inform us about individuals' political views and voting behavior in the 2017 German federal election. The combination of both data sources provides us with a unique data set, which allows us to examine if and how accurately sensitive personal information can be inferred from digital trace data. Moreover, we demonstrate how we can broaden our understanding of (digital) societies through the integration of digital traces and powerful machine learning algorithms in (computational) social sciences.
Background
A variety of techniques exist to follow individuals across the web and to record their online activities. We review some of the most popular ones in the following to give an overview of how third parties observe users’ online and mobile activities.
Third-Party Tracking Through Cookies and Other Techniques
Most tracking activities on the web operate through http cookies (Gomer, Rodrigues, Milic-Frayling, & Schraefel, 2013; Urban, Tatang, Degeling, Holz, & Pohlmann, 2018). Cookies are small text files placed on a user’s device when visiting a website, and we can distinguish between two general types. First-party cookies are mainly used to make the browsing experience more user-friendly. They are placed by the website visited (the so-called first party). Often, their purpose is to facilitate the functionality of a website by, for example, recording language preferences. Third-party cookies, by contrast, are embedded on (and by) the first-party site but refer to an object from a third-party site. Through this object, information (such as the website visited) is exchanged with a third-party domain, allowing the third party to record a user’s online activity. If a user visits another website that uses the same third-party cookie, a user can be reidentified through the cookie set on the first website and the information that the user visited both sites can be collected. Thereby, third-party cookies allow the collection of users’ online activity across the web.
A cookie can collect complete records of the websites visited by a user only if all of the sites contain that cookie. Given the number of websites on the Internet, placing the same cookie on every site is hardly feasible. To overcome this limitation, tracking companies often synchronize their cookies. That is, they share the (cookie-specific) IDs with each other and the data collected through them (for technical details, see e.g., Papadopoulos, Kourtellis, & Markatos, 2019). Thus, cookie synchronization allows trackers to collect a more complete picture of a user’s online activity.
Another step to recording complete records of users’ (and not devices’) online activity is cross-device tracking. While cross-device tracking is easy when users log into an e-mail or social media account on different devices (deterministic cross-device tracking), probabilistic cross-device tracking is more challenging. Yet, research (Brookman, Rouge, Alva, & Yeung, 2017; Solomos, Ilia, Ioannidis, & Kourtellis, 2018; Solomos, Ilia, Ioannidis, & Kourtellis, 2019; Zimmeck, Li, Kim, Bellovin, & Jebara, 2017) and work published by cross-device tracking companies themselves (Drawbridge, 2018; Tapad, Inc, 2015) suggest that users can be identified across devices with high levels of precision using, for example, their IP address and websites frequently visited. Thus, if companies operate cookies on both desktop and mobile devices, cross-device tracking allows them to collect a nearly complete picture of individuals’ online activities.
In recent years, other techniques such as browser and canvas fingerprinting have been developed to supplement and substitute cookies. Fingerprinting techniques allow third parties to identify users through recognizing unique combinations of characteristics such as the device, the browser used and fonts installed. Unlike cookies, which users can reject or delete (see above), it is difficult to hide a browser’s fingerprint (Libert, 2015), and individuals browsing the web can thereby easily be reidentified (identification rates for individuals based on fingerprints range between 81% and 90% as shown by Laperdrix, Rudametkin, & Baudry, 2016). Thus, fingerprinting is another, even more powerful technique to record users’ activity across the web.
Evidence of Tracking on the Web and on Mobile Devices
Unfortunately, it is difficult to measure the true amount of tracking due to discretion among trackers, but studies estimate that up to 99% of popular websites contain potential third-party trackers (Kontaxis & Chew, 2015; Libert, 2015). Fingerprinting technologies, although among the most powerful technologies with respect to tracking, are less popular, but more likely the more popular a website is (Englehardt & Narayanan, 2016). Moreover, the amount of tracking seems to differ by category, with news sites hosting the most third-party trackers. Tracking in apps is similarly spread: Between 60% and 90% of popular apps connect to third-party tracking services (Binns et al., 2018; Brandtzaeg, Pultier, & Moen, 2019; Vallina-Rodriguez et al., 2016).
Regarding the third parties collecting data, tracking on the web is heavily concentrated among a handful of key companies. More than half out of the top 20 trackers belong to Alphabet, the parent company of Google, closely followed by Facebook (Binns et al., 2018; Brandtzaeg et al., 2019; Englehardt & Narayanan, 2016). The share of a typical user’s browsing history that these companies can reconstruct is estimated between 62% and 73% (Englehardt et al., 2015; Yu, Macbeth, Modi, & Pujol, 2016).
Furthermore, cookie synchronization is a widespread phenomenon. Recent studies show that 97% of regular web users are exposed to cookie synchronization (Papadopoulos et al., 2019) on about 80% of popular websites (Englehardt & Narayanan, 2016). Thus, there is ample evidence for tracking through cookies and fingerprinting, both on the web and in apps on mobile devices.
One caveat of the studies mentioned above is that all were conducted prior to the introduction of the GDPR in the EU. In order to limit tracking of individuals in the online world, the GDPR requires that tracking companies explain what data are collected for which purpose (e.g., profiling) and with whom the data are shared (Urban et al., 2018). Thus, one might hypothesize that the GDPR led to a substantial decrease in online tracking. Yet, as Urban, Tatang, Degeling, Holz, and Pohlmann (2018) conclude, the GDPR “did not revolutionize the ad ecosystem” (p. 20). Although the GDPR led to a decrease in third-party tracking, Urban et al. find that tracking, especially among large advertisers, is still ubiquitous. Moreover, the risk that one third-party cookie results in data sharing among hundreds of additional companies has changed little after the introduction of the GDPR, and users can barely trace who gets access to their data. Similarly, several companies do not seem to take legal obligations seriously regarding informing users about the purposes of data collection, processing, and sharing (Urban et al., 2018).
To sum up, previous research demonstrates that tracking companies collect detailed records of users’ activities on the web and mobile devices through cookies, fingerprinting, and cross-device tracking. The true amount of tracking and the actual share of a user’s online history observable by a single organization remain, however, hidden to the public. Having reviewed how individuals’ online activity can be tracked, we next summarize work using records of online behavior and mobile device usage to infer user attributes.
Predicting User Attributes From Digital Trace Data
Previous research used many different sources of digital trace data to predict a variety of individual attributes (see e.g., Hinds & Joinson, 2018, for a recent literature review). Here, we focus on those studies that used data similar to ours, that is, records of browsing behavior and mobile device usage. With this review, we demonstrate the variety of information that can be learned from behavioral residue in digital traces about the data producers (Hinds & Joinson, 2018). To our knowledge, no study has attempted to predict users’ political behavior or preferences from such data yet. However, if using a dating app predicts whether somebody is in a relationship or not (Seneviratne, Seneviratne, Mohapatra, & Mahanti, 2014a), then spending a lot of time on (political) news websites may likewise predict a person’s degree of political interest and thus whether this person will vote in an upcoming election.
Studies using weblog data to infer user attributes were conducted as early as in 1999 (Murray & Durrell, 1999), but since then, the Internet and prediction algorithms have changed dramatically. More recent work demonstrates that age (De Bock & Van den Poel, 2010; Goel et al., 2012; Hu, Zeng, Li, Niu, & Chen, 2007; Zhang, Zhou, Tan, Bagheri, & Er, 2017), gender (De Bock & Van den Poel, 2010; Goel et al., 2012; Hu et al., 2007; Zhang et al., 2017), education (De Bock & Van den Poel, 2010; Goel et al., 2012), occupation (De Bock & Van den Poel, 2010), and income (Goel et al., 2012) can be predicted from weblogs with varying but often high performance levels. These include, for example, (multiclass) ROC-AUCs of 0.76 (age, 6 classes), 0.72 (gender), 0.70 (occupation, 10 classes), and 0.81 (education, 5 classes) in the study of De Bock and Van den Poel (2010) and accuracies of 0.55 (age, 4 classes) and 0.84 (gender), as reported by Zhang, Zhou, Tan, Bagheri, and Er (2017). Furthermore, a snapshot of the apps installed on a phone and other records of smartphone activity reveal users’ personality traits (Chittaranjan, Blom, & Gatica-Perez, 2013; Stachl et al., 2017), age (Malmi & Weber, 2016; Qin et al., 2018), gender (Malmi & Weber, 2016; Qin et al., 2018; Seneviratne, Seneviratne, Mohapatra, & Mahanti, 2014b), income (Malmi & Weber 2016), race (Malmi & Weber, 2016), country of origin and residence, language, relationship status, religion, and parenthood (Seneviratne et al., 2014a). App-based prediction models thereby often achieve similar or even higher performance levels when compared to predictions based on browsing histories, with, for example, accuracies/ROC-AUCs of 0.77/0.85, 0.82/0.90, and 0.72/0.80 for age (two classes), gender and race (two classes) in the study of Malmi and Weber (2016).
While the outlined studies indicate that records of users’ online activity and mobile device usage can be used to accurately infer many sociodemographic characteristics, it is worth noting that these studies draw on samples that widely differ in scale (Chittaranjan et al., 2013; Seneviratne et al., 2014a; Stachl et al., 2017). Furthermore, a common challenge of studies in this field is the multitude and dimensionality of data that can be derived from browsing histories and app usage, which typically results in a large number of (sparse) features. Common strategies to handle this type of data include implementing dimensionality reduction techniques prior to model building (e.g., singular value decomposition [SVD]; Qin et al., 2018) and/or utilizing supervised learning methods that are able to handle large sets of predictor variables (e.g., support vector machines; Goel et al., 2012, random forests; De Bock & Van den Poel, 2010). Notably, the results of Malmi and Weber (2016) indicate that decreasing the number of features by imposing (high) thresholds based on observed frequencies, aggregating apps into categories, or using SVD can worsen prediction performance compared to models that utilize the full list of apps installed.
Selective Exposure and Political Internet Use
Individuals use a plethora of websites and apps on a daily basis. While many of them are likely used by people with all kinds of political views, some may be visited more often by people with a strong interest in politics for reasons we review below. We provide a short summary of several explanations and findings regarding the question why online behavior and mobile activity may reveal users’ political interest, behaviors, and preferences.
Explanations focusing on selective exposure, for example, postulate such an association between preexisting beliefs and media preferences (Lazarsfeld, Berelson, & Gaudet, 1944). Users tend to consume news that align with their political views while avoiding news with opposing views in order to minimize cognitive dissonance (Festinger, 1957), thereby creating the so-called echo chambers or filter bubbles. Applied to the context of our study, browsing mainly conservative (liberal) news websites may indicate support of a conservative (liberal) party, for example.
Dvir-Gvirsman, Tsfati, and Menchen-Trevino (2016) present evidence for this perspective. They show that Israeli Internet users are more exposed to like-minded online content although overall exposure to ideological content on the web was low. Flaxman, Goel, and Rao (2016) and Peterson, Goel, and Iyengar (2018) demonstrate similar effects for U.S. Internet users, although the magnitude of the effects is rather small. Thus, there is some evidence that news exposure can, to a limited degree, predict political views. The strength of an ideological news media diet, however, seems to be country-specific.
Additionally, there is some evidence that the amount of political (news) content consumed may be indicative of users’ general political engagement. That is, users with low interest in politics, for example, may choose not to visit sites or use apps with political content, thereby introducing a relationship between online activity and political engagement. Empirical studies using various data sources find, for example, that the use of online news sites is associated with small increases in political knowledge and that using the websites of political parties increases political participation (Dimitrova, Shehata, Strömbäck, & Nord, 2014). Similarly, Kenski and Stroud (2006) report that Internet access and browsing websites related to presidential campaigns affect political knowledge and participation, and Kruikemeier, van Noort, Vliegenthart, and de Vreese (2014) demonstrate that “political Internet use” increases voter turnout and political interest. Furthermore, Boulianne (2009) provides a meta-analysis of 38 studies to test the hypothesis that Internet use has a negative impact on civic and political engagement. Her review identifies two streams of competing theories that both postulate an association between Internet use and engagement: While one side argues that engagement will decrease due to the Internet’s entertainment function, the other side predicts an increase in engagement due to facilitated information access and networking. On average, her meta-analysis reveals a small, but positive effect of Internet use on engagement. Nonetheless, both streams of theories and Boulianne’s results provide important insights for our study as they all postulate that Internet use is somewhat predictive of political and civic engagement.
Thus, to sum up, research from the social sciences demonstrates that Internet use and especially the content consumed (through selective choice of news media and browsing websites with political content) correlate with political interest, engagement, and a variety of political behaviors and attitudes. We therefore expect that records of browsing behavior and mobile device usage about the kind and frequency of (political news) content consumed allow us to infer users’ underlying political preferences and behaviors, as measured by users’ voting decisions. That is, we hypothesize that these records predict users’ political behaviors and preferences. How accurately those records describe users’ political behaviors and preferences, however, is yet unknown and will be the focus of this article.
Method
Data
We use data from 1,991 members of a German nonprobability online panel who were recruited for participation in several rounds of a longitudinal survey in the second half of 2017. Only individuals who were eligible to vote in the 2017 German federal election and consented to allow the vendor to track their online behavior and app use were eligible to participate. Age, gender, and education quotas were used to achieve a sample approximately representing the German electorate, but we note that our data do not allow us to infer population totals due to its noprobabilistic nature (Scherpenzeel & Bethlehem, 2011). Descriptive statistics of the respondent sample are reported in Table S1 of Appendix A located in the Online Supplement to this article.
Once recruited, panelists were asked to complete three surveys—one between August 21 and 28, 2017, one between September 4 and 11, 2017, and a final one between September 25 and October 2, 2017. The German federal election was held between the second and third survey on September 24, 2017. The first two surveys (conducted before the election) collected information whether respondents already had decided for which party they intended to vote (83.0% participation rate in Wave 1, 90.1% in Wave 2). The third one (after the election) collected information on whether respondents actually voted and for which party (86.1% participation rate). However, we note that those reports are likely biased because respondents often overreport voting in surveys due to social desirability (see e.g., Presser, 1990). Thus, reported voting behavior may in some cases not correspond with actual voting behavior. Ignoring respondents who did not respond to all questions in all three surveys, our sample consists of 1,991 respondents.
In addition to the survey data, the vendor collected digital trace data in two ways for us. First, respondents were asked to install an add-on in all their web browsers on their personal computers. This add-on kept track of their browsing histories on their PCs. Specifically, each time a respondent navigated to a website, the add-on recorded the complete URL of the website (e.g., https://en.wikipedia.org/wiki/URL), the domain (wikipedia.org), the current date and time, and the time spent on the website. Second, respondents downloaded an app on their mobile devices (i.e., smartphones and tablets). Similar to the browser add-on installed on PCs, the app recorded complete URLs, domains, dates/times, and time spent on the website, though only for a device’s native browser (i.e., Chrome on Android devices and Safari on Apple devices). In addition, the app collected information on the brand and model of the device used, the operating system and version installed, the type of network connection used and the type of device (e.g., smartphone or tablet) used. Moreover, the tracking app kept record of the apps that respondents used on their mobile devices. Every time a respondent opened an app on her device, the name of the app, the duration of use, and information about the device were logged. Information on what the individual did in the app was not recorded. Both tools are based on software provided by Wakoopa (www.wakoopa.com) and are implemented in the vendor’s online panel.
Respondents were invited for data collection starting July 1, 2017, and their digital traces were collected through October 31, 2017. However, users could turn off the data collection temporarily. We cannot observe when and how long users turned off data collection, but the prevalence of potentially sensitive records (e.g., visits to pornographic websites and illegal streaming platforms) suggests that users did not make use of this possibility very often. Finally, on mobile devices, we do not capture domains visited in browsers other than the native ones. Thus, it is possible that we do not record all online activities of each user. Although we do not know whether this introduces bias in the tracked online behavior, we believe that, in fact, this results in a realistic scenario of tracking in the online world. Our review above demonstrates that it is unlikely that a single company records the complete history of a user’s online activity.
To address our research questions (can online behavior predict political behaviors), we linked respondents’ survey data with their records of online behavior and mobile device usage using a unique ID available in all datasets. Political behaviors (the outcomes that we predict in our study) were taken from the survey data, and we created four variables (for descriptive statistics, see Table S1 of Appendix A located in the Online Supplement to this article): Undecided: In the second survey, respondents were asked which party they intended to vote for in the upcoming election. We created a binary variable from the responses, indicating whether individuals reported to have decided which party to vote for or not. Voted: In the third survey, individuals were asked whether they had voted in the German national election. Alternative für Deutschland (AfD): In the third survey, individuals were asked for which party or individual they voted. Individuals who reported voting for the AfD (a right-wing populist party founded in 2013) were coded as having voted for “AfD.” All other respondents who reported having voted for another party were coded as “other.” Greens: From the same question, we created a binary indicator on whether or not individuals voted for the Green party (“Bündnis 90/Die Grünen”), a progressive party formed in 1993, which focuses on ecological and social sustainability.
While other parties exist in the German political system, we focus our predictions on votes for these parties because they represent the populist-rightwing-conservative and left-wing/progressive extrema of the political spectrum in Germany. Moreover, both have gained notable increases in popularity in recent years and can be seen as major antagonists in many policy questions (e.g., regarding migration, gender, and environmental issues). We therefore hypothesize that identifying their voters based on digital traces should be easier (compared to the less polarized parties of the middle) because those voters may be more likely to visit distinct news websites or blogs that are homogeneous in the political attitudes of their readership.
In addition to our main dependent variables, the survey data provided us with respondents’ sociodemographic information including age, gender, personal net income, household net income, marital status, federal state, number of children, number of children in household, household size, type of accommodation respondent lives in, education, vocational training, employment status, occupation, occupational status, industry sector, reason for unemployment, and town size. These variables were included as independent variables in the models for which survey data were included. Moreover, we predict those shown in Table S1 (see Appendix A located in the Online Supplement to this article) using the same tracking information for benchmark purposes.
The information extracted from the records of online and mobile device activity was processed as follows. Due to the large number of predictors derived from the digital records (about 12,000), we cannot describe every variable in detail. Rather, we describe three blocks of variables that we used for categorization of the predictors and the general methodology used to derive the predictors within each block (for an overview, see Table S2 in Appendix B located in the Online Supplement to this article).
The first block contains variables with information on the general use of devices, such as the share of mobile Internet connection in total online time, the number of different devices used, and the use of the devices at night.
The second block includes variables that capture the duration and extent of usage of various news media sources. First, we collected a list of the 50 most used news media domains in Germany during the period of data collection (Schröder, 2017) and added the names of the corresponding apps, if available. For each individual, we calculated the total time spent across all of these domains/apps as well as the proportion of news media consumption in total online/app time. Second, we gathered information about respondents’ use of German public-service broadcasting by collecting the domains of the main public-service broadcasting stations in Germany, including radio stations and media centers. If available, we collected the names of the corresponding apps, too. We then calculated, for each individual, the total time spent across all of these domains and the total time spent across all of these apps as well as their proportions in total online time/app time. Third, we consider the usage of a collection of about 80 news domains or blogs that we labeled populist, propagandistic, or “alternative/fake” news. The criteria for inclusion of a site on our list were somewhat subjective, as there was neither a universal definition of such nonmainstream news nor a comprehensive list of such domains (for a list of the domains, see Appendix C located in the Online Supplement to this article). For each respondent, we calculated the total time spent across all of these domains as well as the proportion of time spent across all of these sites compared to the total online time.
The third block of predictors contains general information on domains visited and apps used by respondents (about 80,000 domains and about 12,000 apps). However, it would not make much sense to keep all domains and apps as many were visited/used only once by one participant and for a few seconds. Therefore, to keep the number of predictors at a reasonable number, but also exploit as much information as possible from the digital records, we restrict the pool of domains as follows. We consider only those domains/apps that were, calculated across the whole sample, visited/used at least 80 times, for a total time of at least 1 min and by at least 1% of respondents in our data. The choice of these thresholds was purely data-driven (i.e., determined through inspecting the resulting reduction in the number of predictors). Doing so reduces the number of domains and apps to about 11,700. We then calculate the time spent browsing each of the domains and the time spent using each of the apps for each respondent. These variables make up the largest set of predictors in our resulting dataset. Altogether, we create 11,999 predictors from the records of online behavior and mobile device usage.
Models
Predicting voting behavior and political attitudes with digital trace data constitutes a challenging prediction problem that cannot easily be tackled with parametric regression, given the dimensionality and sparsity of the data (i.e., more predictors than observations, many rare categories, many predictors that might be uninformative for the outcome of interest). Against this background, we opted for a nonparametric approach by using gradient boosting machines (Friedman, 2001; Friedman, Hastie, & Tibshirani, 2000) as implemented in XGBoost (T. Chen & Guestrin, 2016) to build the prediction models. XGBoost is a prominent boosting implementation that has been shown to give competitive results in machine-learning competitions. As part of the boosting family, XGBoost can learn complex relationships between the predictors and the outcome while also incorporating a built-in feature selection step. It allows the algorithm to extract the informative variables from a vast pool of predictors directly in the model building process. With nearly 12,000 potential predictors from individuals’ app usage and browsing behavior, this is an important feature as we expect that only a fraction of the available information is predictive of the outcomes studied.
Boosting is an ensemble method that builds a sequence of (i.e., multiple) lower level models that collectively represent the final prediction model (Hastie, Tibshirani, & Friedman, 2009). Typically, decision trees (Breiman, Friedman, Olshen, & Stone, 1984) are used as base learners to construct the ensemble, which approximate the relationship between the predictors and the outcome with a set of step functions. The individual trees are built by repeatedly splitting the predictor space (the set of values of all predictors) into smaller subregions, guided by searching for tree structures that minimize the objective function (e.g., negative binomial log-likelihood [log loss] for binary outcomes). On this basis, gradient tree boosting seeks to find a sequence of trees where each individual tree adds an improvement over its predecessor. This is achieved by updating the input for the next tree based on the “mistakes” of the respective previous tree and by repeating this process until a large number of consecutive trees is grown. The final tree ensemble can be used for predicting the outcome for a given (new) observation by summing the corresponding scores (predicted values) of the individual trees.
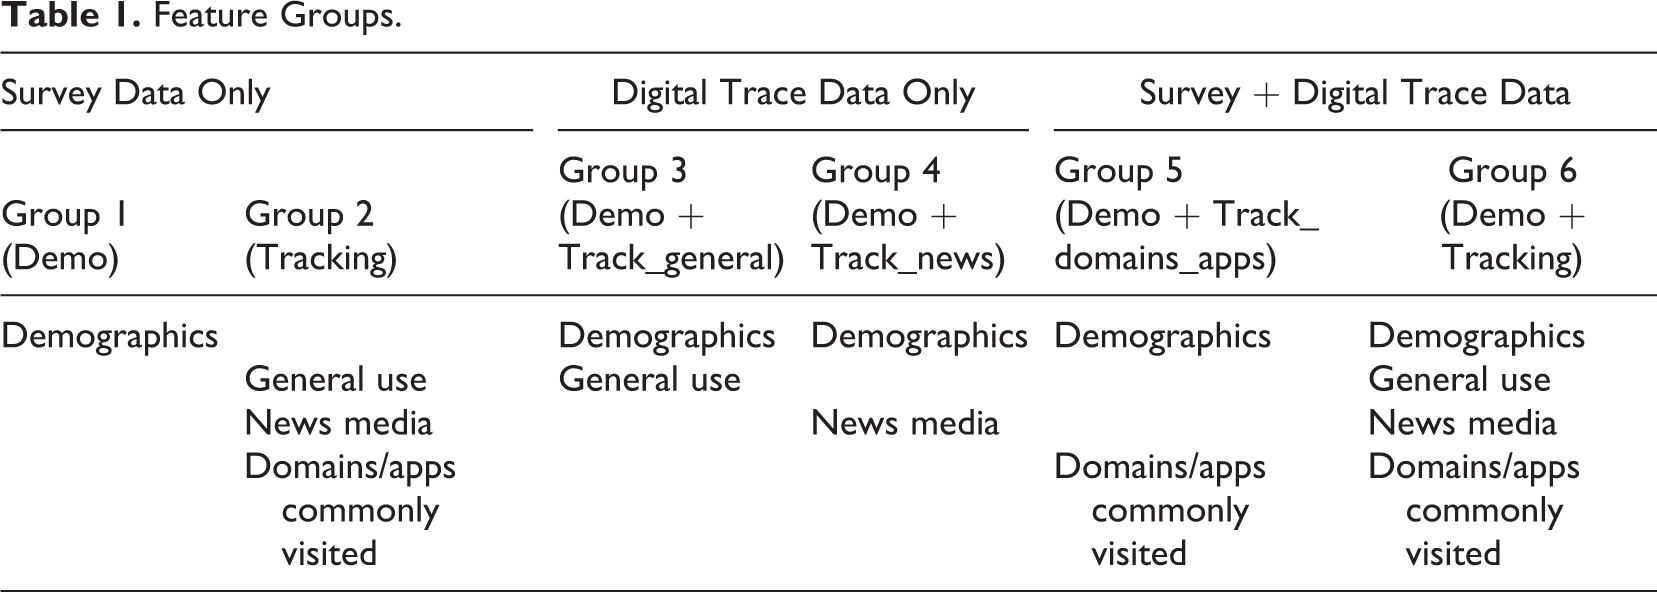
In order to study the potential of digital trace data for inferring personal information, we built a total of 35 XGBoost models, 6 for each of the political outcome variables (undecided, voted, AfD, and Greens) and 1 for each of the sociodemographic outcome variables (age, gender, net income, marital status, federal state, childless, number of children in household, and employment status). We built multiple models for each political outcome variable by considering different subgroups of features for each outcome, which enables nuanced insights into the predictive power of digital traces for our outcomes of main interest (see Table 1). Group 1 (Demo) uses sociodemographic variables from the survey data as features, providing a reference point to compare performance within outcomes. Group 2 (Tracking) includes all variables that were derived from the digital trace records while excluding all survey information from the feature set (equivalent to benchmark models predicting sociodemographic characteristics to compare performance across outcomes). In addition, Groups 3–5 combine both data sources by adding different subgroups of features from the digital trace data (general use, news media consumption, or commonly visited apps and domains) to the sociodemographic information to study the (potential) added benefit of linking both types of data. Finally, Group 6 incorporates the full set of features from both data sources (Demo + Tracking). The models with sociodemographic characteristics as outcomes use all variables that were derived from the digital trace data as features (Tracking) and provide a reference for the models that predict voting behavior and party preferences.
Feature Groups.
The training and evaluation procedure for the XGBoost models included multiple steps. First, we tuned the hyperparameters of each model by using 10-fold cross-validation (CV) in a 75% training data set that was drawn at random from the full sample. Tuning was conducted via exhaustive grid search over the full set of hyperparameter values. Details on the tuning process are provided in Appendix D located in the Online Supplement to this article. For each model, the tuning parameter constellation that minimized the binomial log loss was chosen as the best setup. We then used the CV results of the respective best model for a first evaluation of prediction performance across XGBoost models with different outcomes and feature groups (Hothorn, Leisch, Zeileis, & Hornik, 2005). In the next step, a final model is built for each feature group and outcome (combination) by retraining the respective best model on the full training data. The final models were used to predict the corresponding outcome in a 25% validation set that resulted of the initial train-test split. We used the predictions in the validation set to again evaluate and compare XGBoost models with different outcomes and feature groups, this time using a new, completely untouched data set to get an honest estimate of out-of-sample performance (in the tuning process hold-out sets were used repeatedly, i.e., the CV error for each final model potentially underestimates the true test error; Hastie et al., 2009). We used ROC-AUC and log loss to assess prediction performance in the validation set. While these metrics summarize prediction performance independent of specific classification thresholds, we also predicted class membership at “optimal” thresholds (based on the top-left points of the ROC curves) to illustrate classification performance for fixed cutoffs.
Results
Figures 1 and 2 summarize the first set of results for our outcomes of main interest, voting behavior and party preferences. Figure 1 presents cross-validated ROC-AUCs (the ROC-AUC distribution over all hold-out samples) for our main series of XGBoost models that predict voting behavior with different feature groups. More precisely, the distributions of ROC-AUC over all hold-out folds (samples that were not used for model training) of the CV procedure are summarized with boxplots. ROC-AUC measures the area under the receiver operating characteristic (ROC) curve and ranges between [0, 1], with higher values indicating better discrimination between classes and 0.5 representing a noninformative model. It becomes clear that predicting party preferences and whether a person is undecided before an election is a challenging task. Particularly, Figure 1A (undecided) indicates weak performance, with ROC-AUCs only slightly above the score of a noninformative model. However, fair performance can be observed for Figure 1B (voted) and—in terms of discrimination—also for Figure 1C (AfD) and 1D (Greens). Furthermore, it can be seen that for a given outcome, performance hardly varies between feature groups, that is, the survey only, digital trace only, and the combined models result in comparable ROC-AUC values. While there is typically a small decrease in performance when using only tracking data as features, this feature group achieves a slightly higher median ROC-AUC as the sociodemographic survey data when predicting AfD votership. This is noteworthy as it indicates that digital trace data can substitute sociodemographic survey information when predicting preferences for a populist party, following the assumption that particularly polarized political attitudes manifest themselves in the form of distinct web media consumption and browsing behavior. Note, however, that there is little evidence that a certain type of digital trace data (general usage, time spend on news media websites, commonly visited websites and apps) is particularly informative for predicting party preferences and not much can be gained when combining both sources (survey and digital trace data). A similar pattern can be observed when using cross-validated log loss as an alternative performance metric, again indicating little variation when comparing prediction performance between feature groups for a given outcome (Figure 2). Log loss evaluates the predicted probabilities of each XGBoost model with respect to their “distance” to the actual classes, that is, smaller values indicate better performance. Note that although log loss has no upper bound, the log loss of a (useless) model which predicts 0.5 for all cases is ln(0.5) ≈ 0.693.
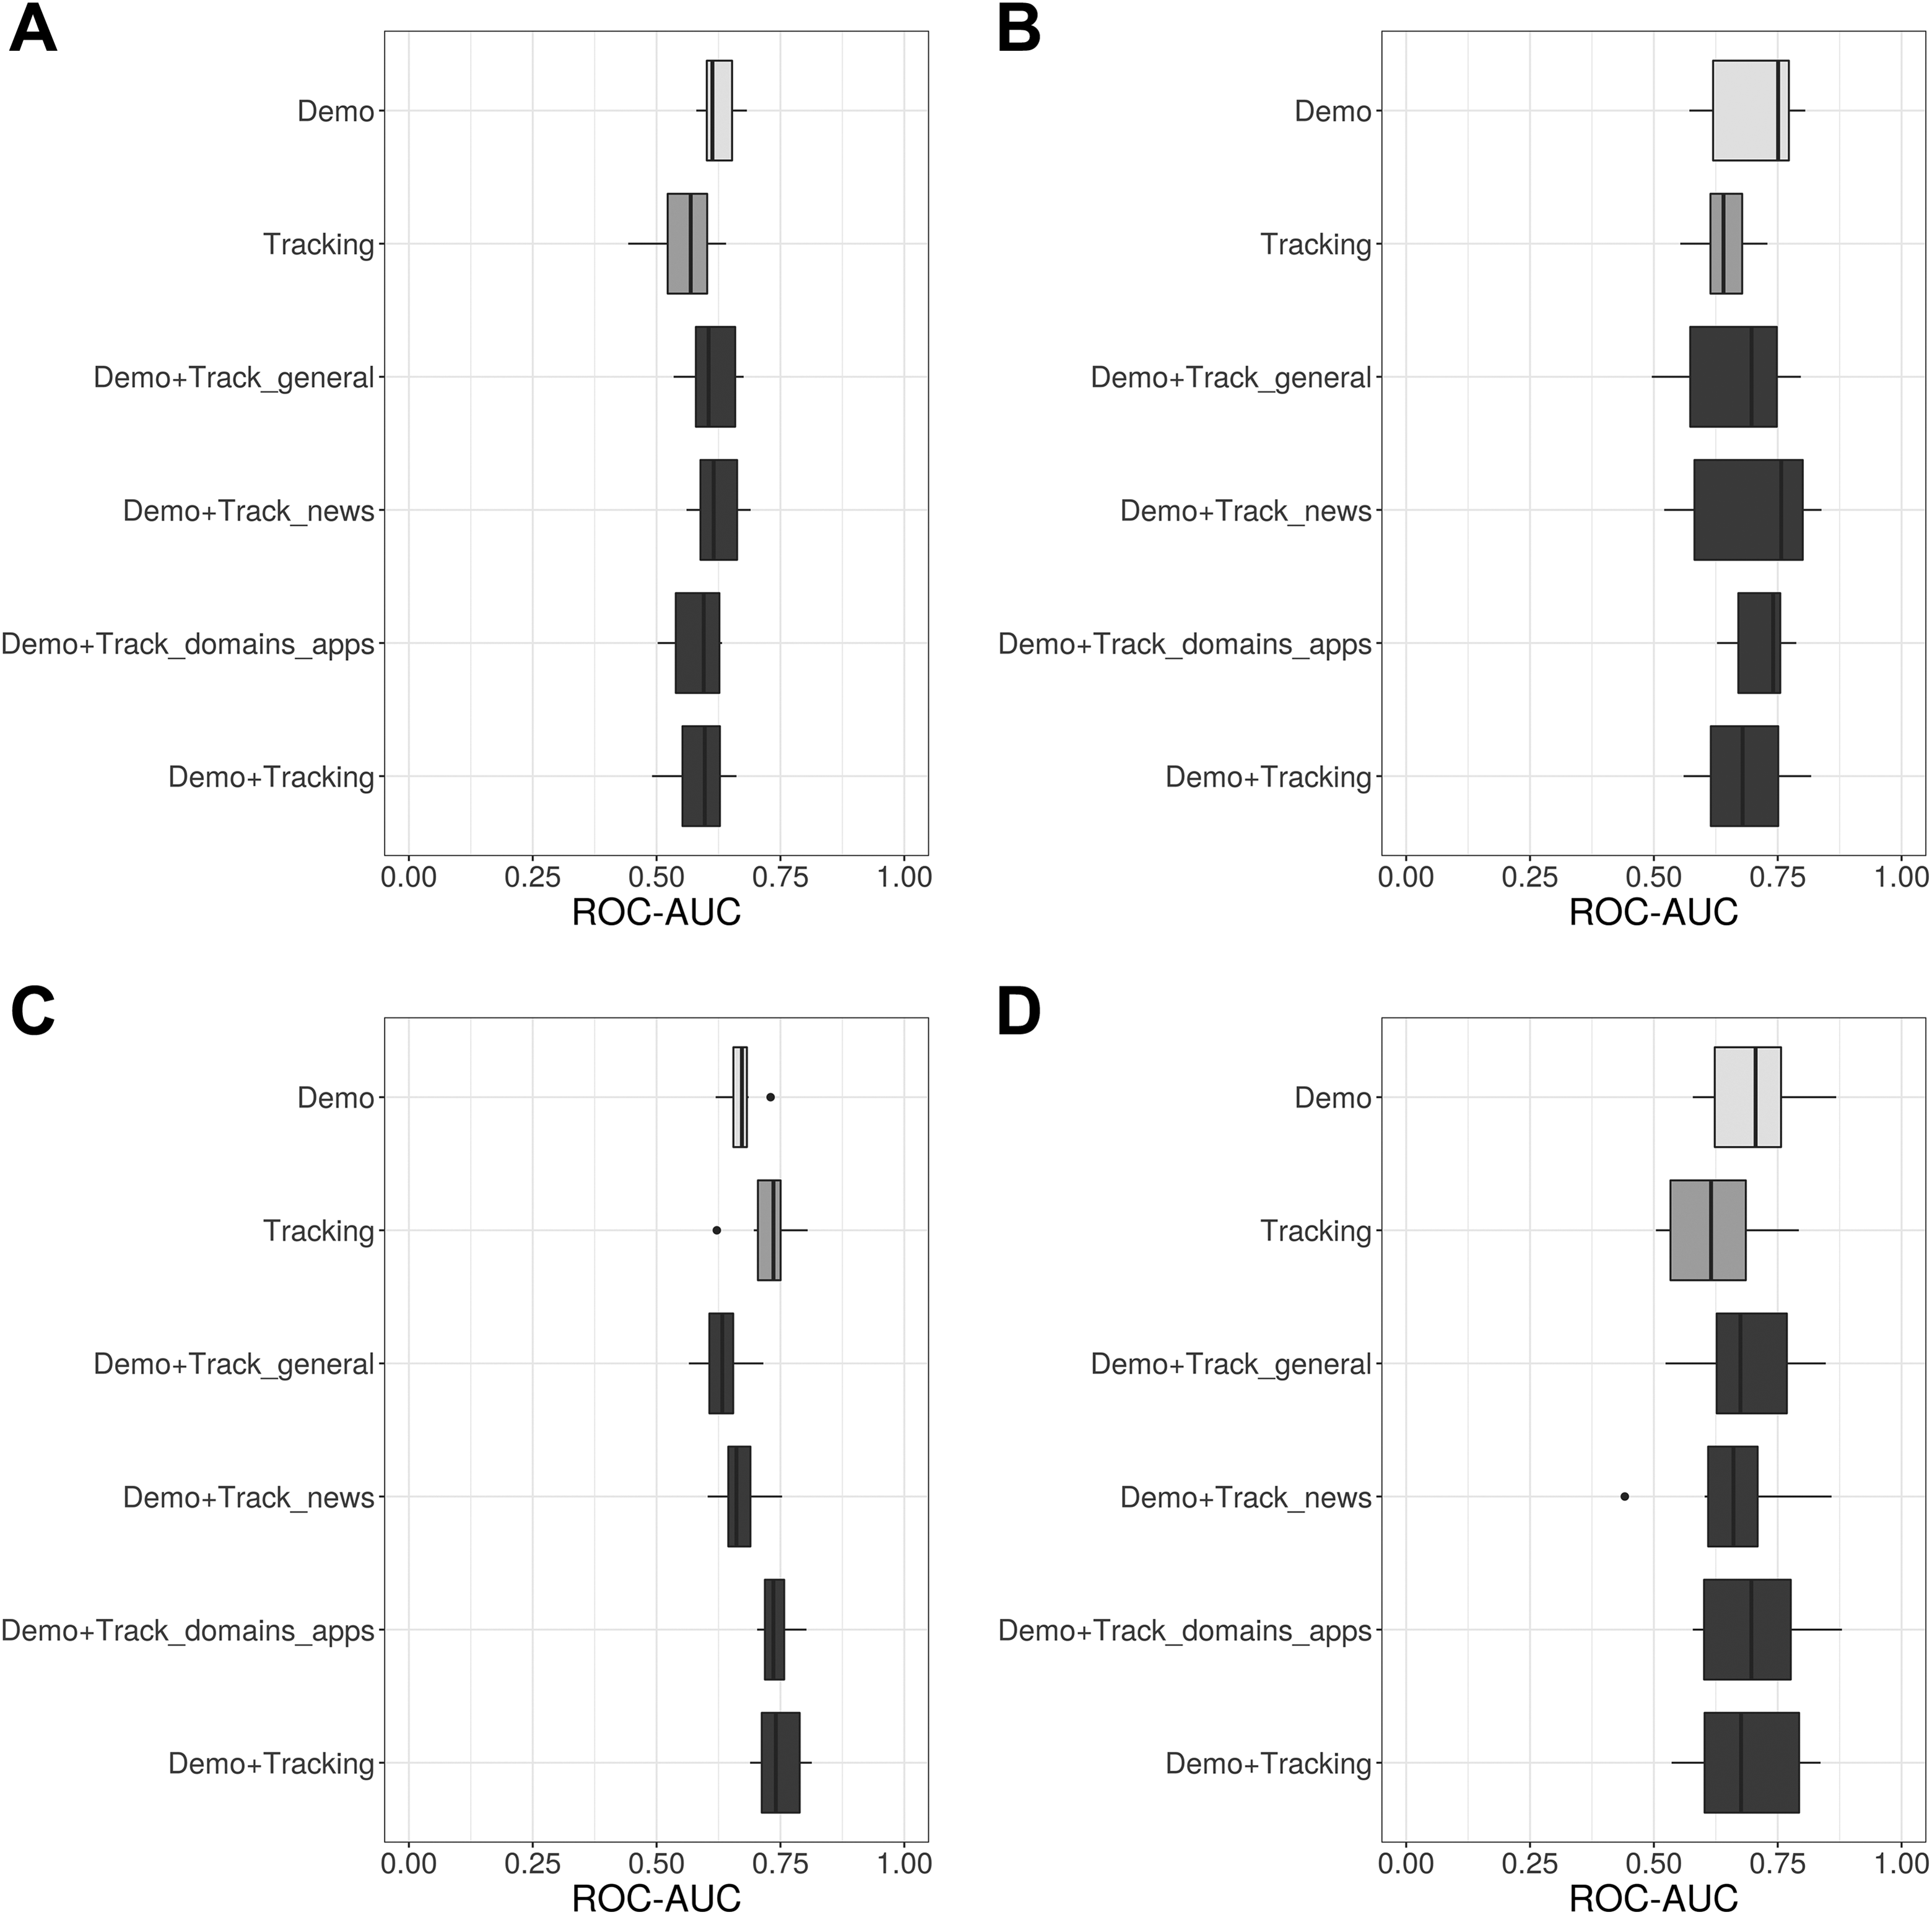
Receiver operating characteristic–area under the curve (ROC-AUCs) for predicting voting behavior with different feature groups (cross-validation in training set). (A) Undecided, (B) voted, (C) Alternative für Deutschland, (D) Greens.
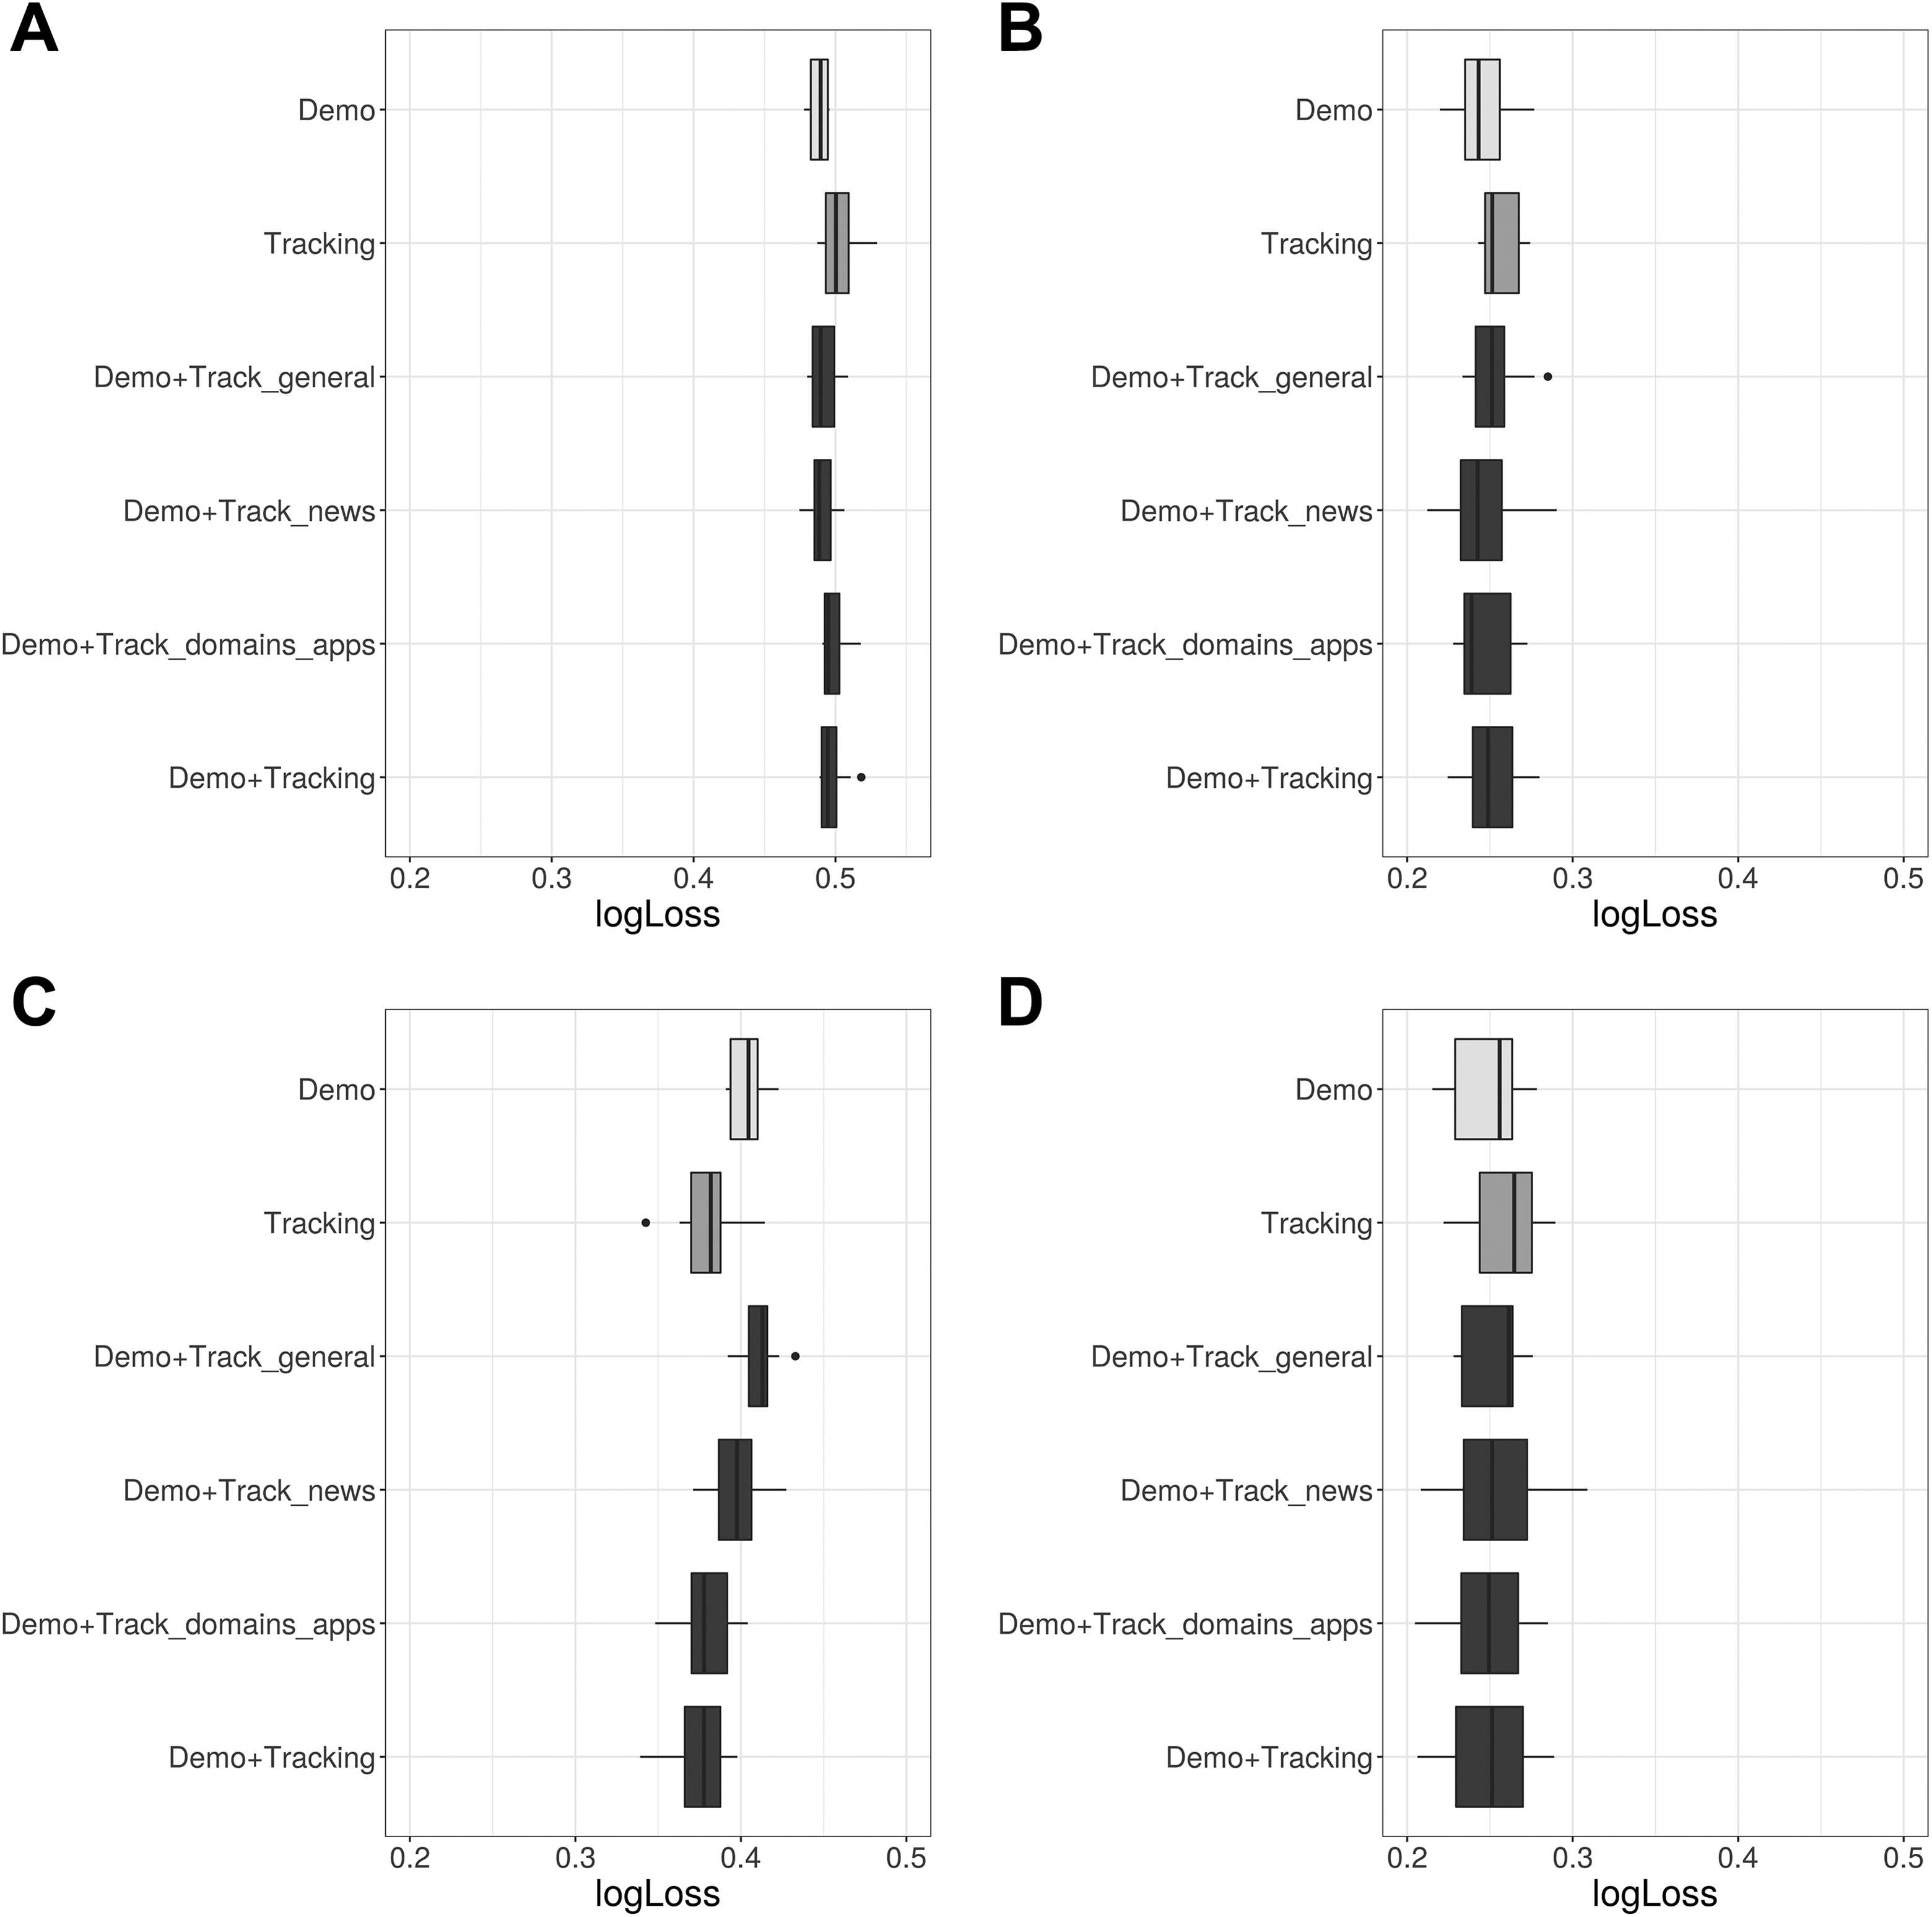
Log loss for predicting voting behavior with different feature groups (cross-validation in training set). (A) Undecided, (B) voted, (C) Alternative für Deutschland, (D) Greens.
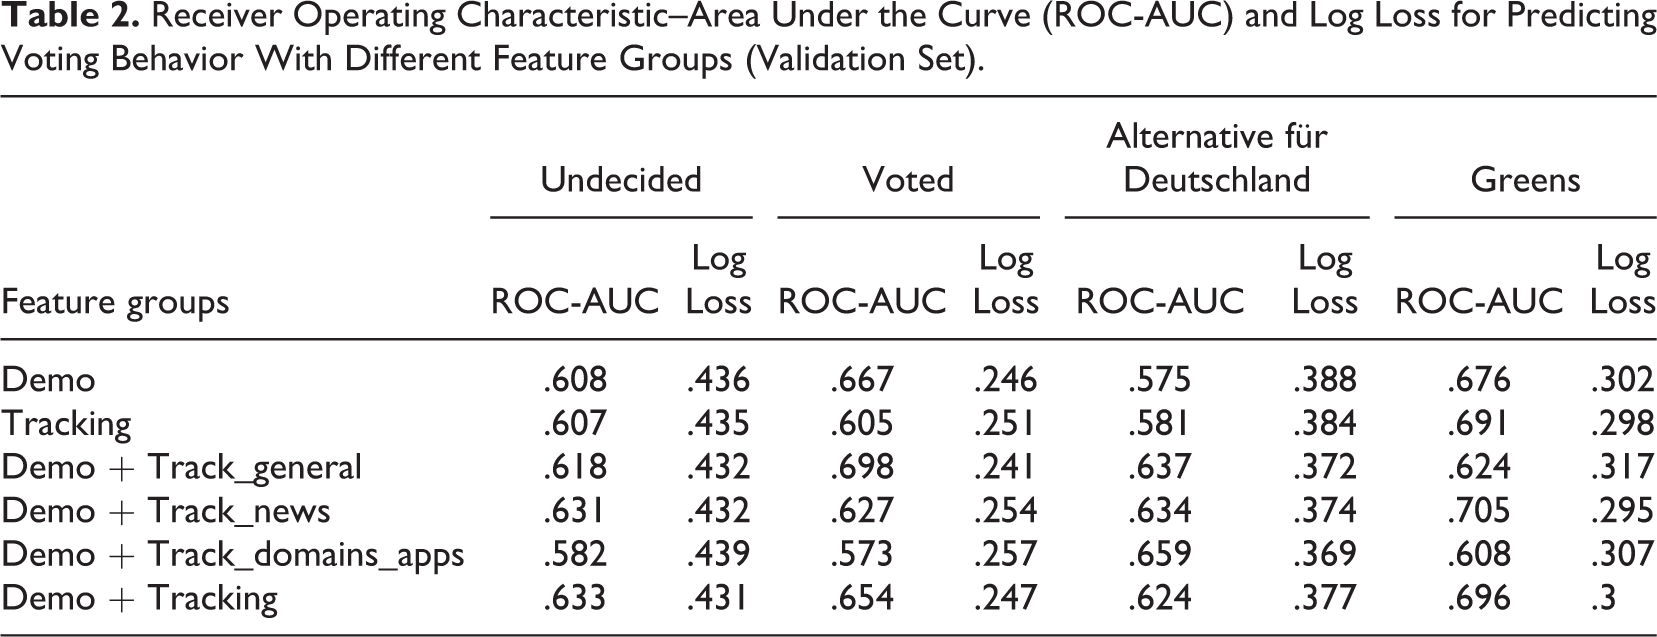
In addition to the CV results, Table 2 summarizes ROC-AUCs and log loss in the validation set. The validation set results are generally in line with Figures 1 and 2; we observe poor to moderate prediction performance across outcomes, with little variation between feature groups (within outcomes). The results for predicting AfD votership somewhat diverge from this pattern, which seem to benefit from combining survey information with digital trace data. In this case, ROC-AUC increases notably when adding information on online news consumption and commonly visited websites as predictors, peaking at .659 (Demo+Track_domains_apps). Note that—similar to the CV results—some combined models (which include survey and tracking data) perform slightly worse than the respective survey data only model, indicating that the dimensionality of the data complicates distinguishing signal from noise.
Receiver Operating Characteristic–Area Under the Curve (ROC-AUC) and Log Loss for Predicting Voting Behavior With Different Feature Groups (Validation Set).
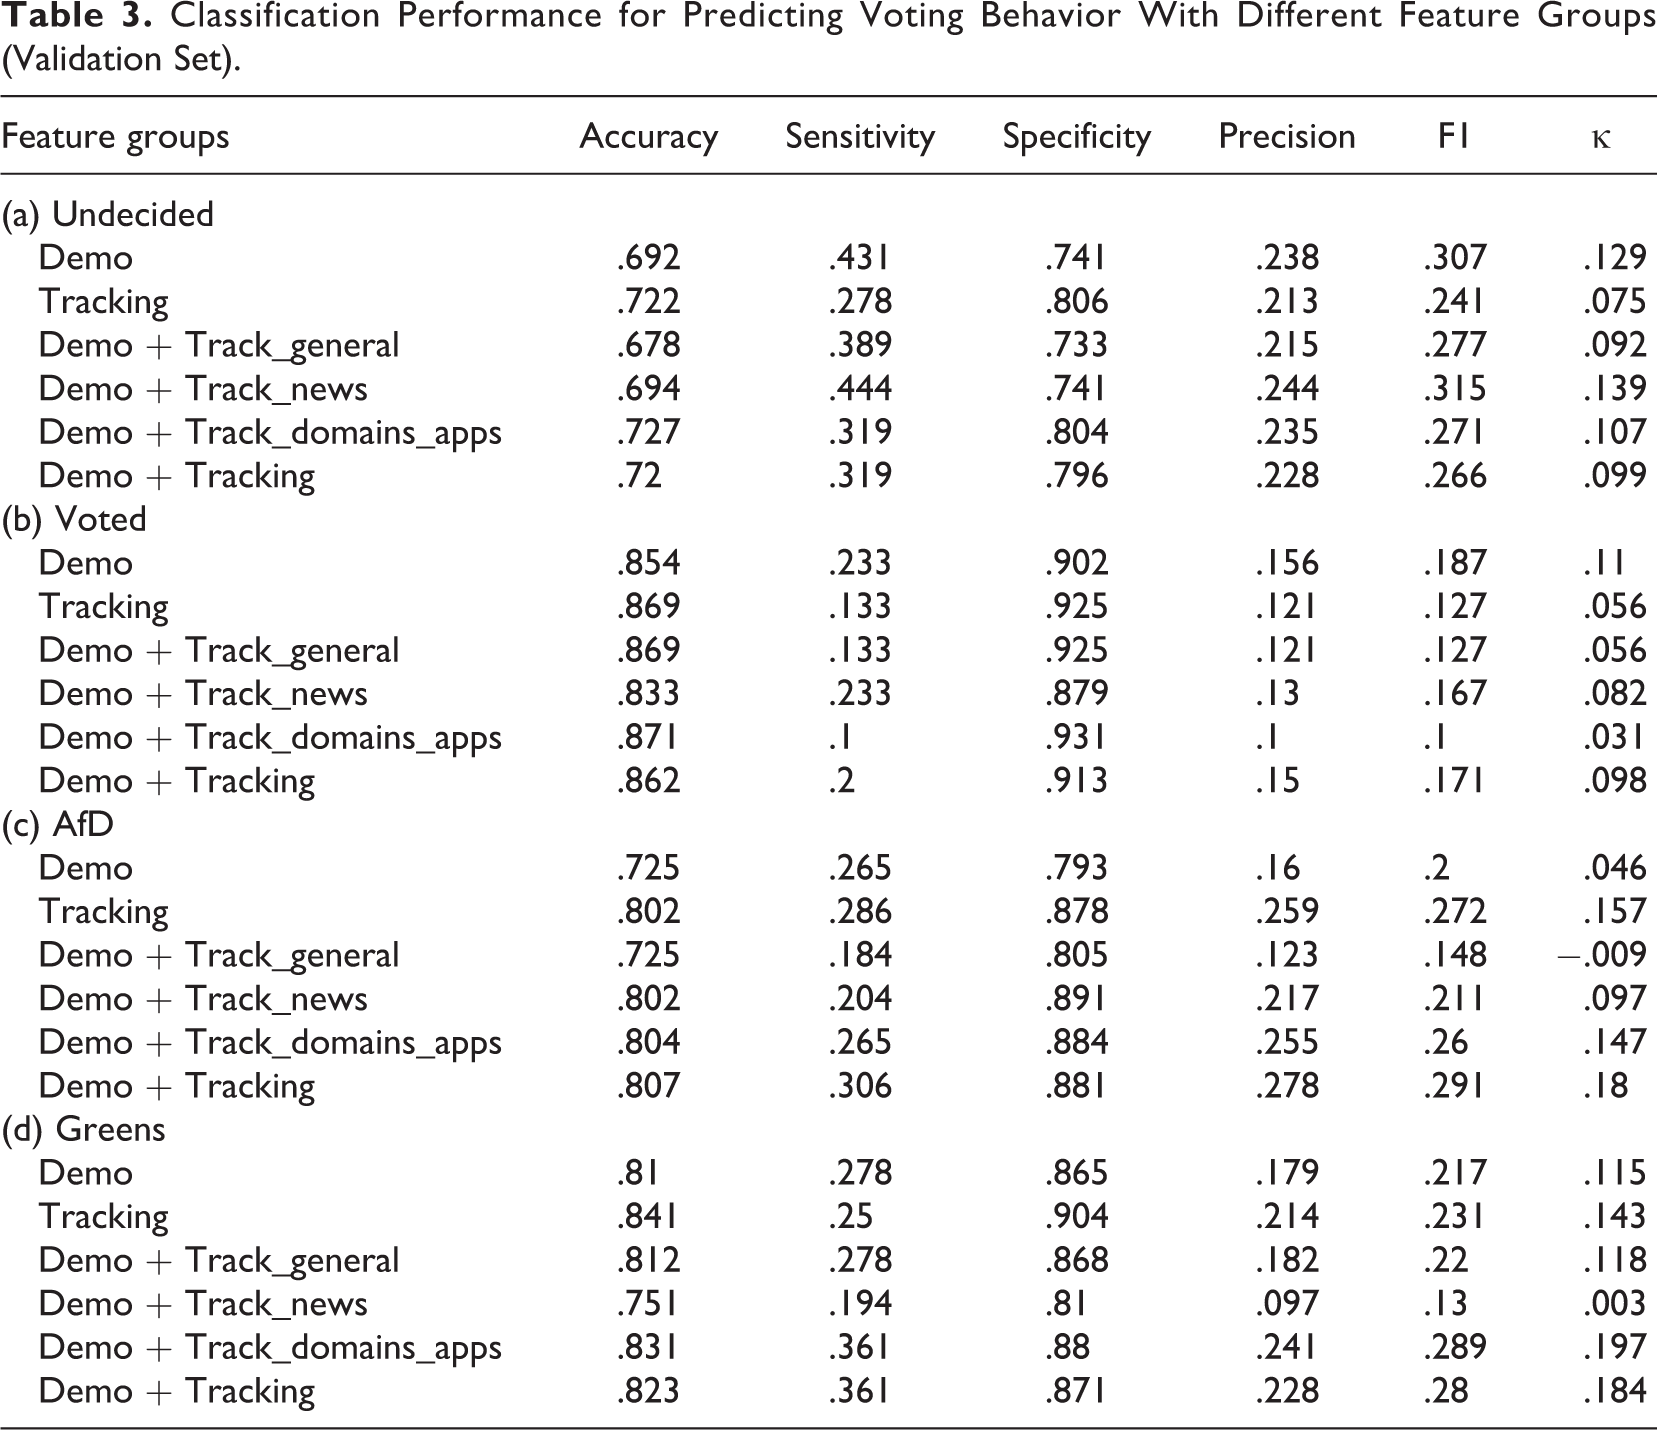
While the previous evaluation focused on the general performance of the XGBoost models based on predicted risk scores/probabilities, a typical objective with the outcomes at hand is classification—predicting “voted” vs. “not voted” or “voted for AfD” vs. “not voted for AfD.” Table 3 presents accuracy, sensitivity, specificity, precision, F1, and κ for predicted classes for all feature group and outcome combinations. Class predictions were obtained using optimal classification thresholds, that is, cut-offs close to the top-left point of the ROC graphs while putting more weight on specificity (for the majority class) to account for the imbalanced class distributions. Note that the thresholds were obtained based on the respective first model (survey data only) for a given outcome and then fixed for the remaining models to ensure comparability. Again, there is no clear evidence that digital trace data can be used to precisely predict voting behavior and party preferences, with all accuracy values falling under the respective no information rate (accuracy when predicting the majority class for all instances; undecided: .841, voted: .928, AfD: .87, Greens: .9). However, we do see some indication of increased prediction accuracy when moving from the survey data only to the combined models for the outcome AfD, again hinting that browsing behavior can reveal some information about party preferences.
Classification Performance for Predicting Voting Behavior With Different Feature Groups (Validation Set).
Finally, Figure 3 (CV) and Table 4 (validation set) present ROC-AUC (Figure 3A) and log loss (Figure 3B) when predicting sociodemographic characteristics with features from digital trace data for benchmark purposes. We achieve notable performance regarding age groups (both metrics) and gender (ROC-AUC), whereas digital trace data appears to be less informative for inferring marital status and predicting whether a person is in a partnership.
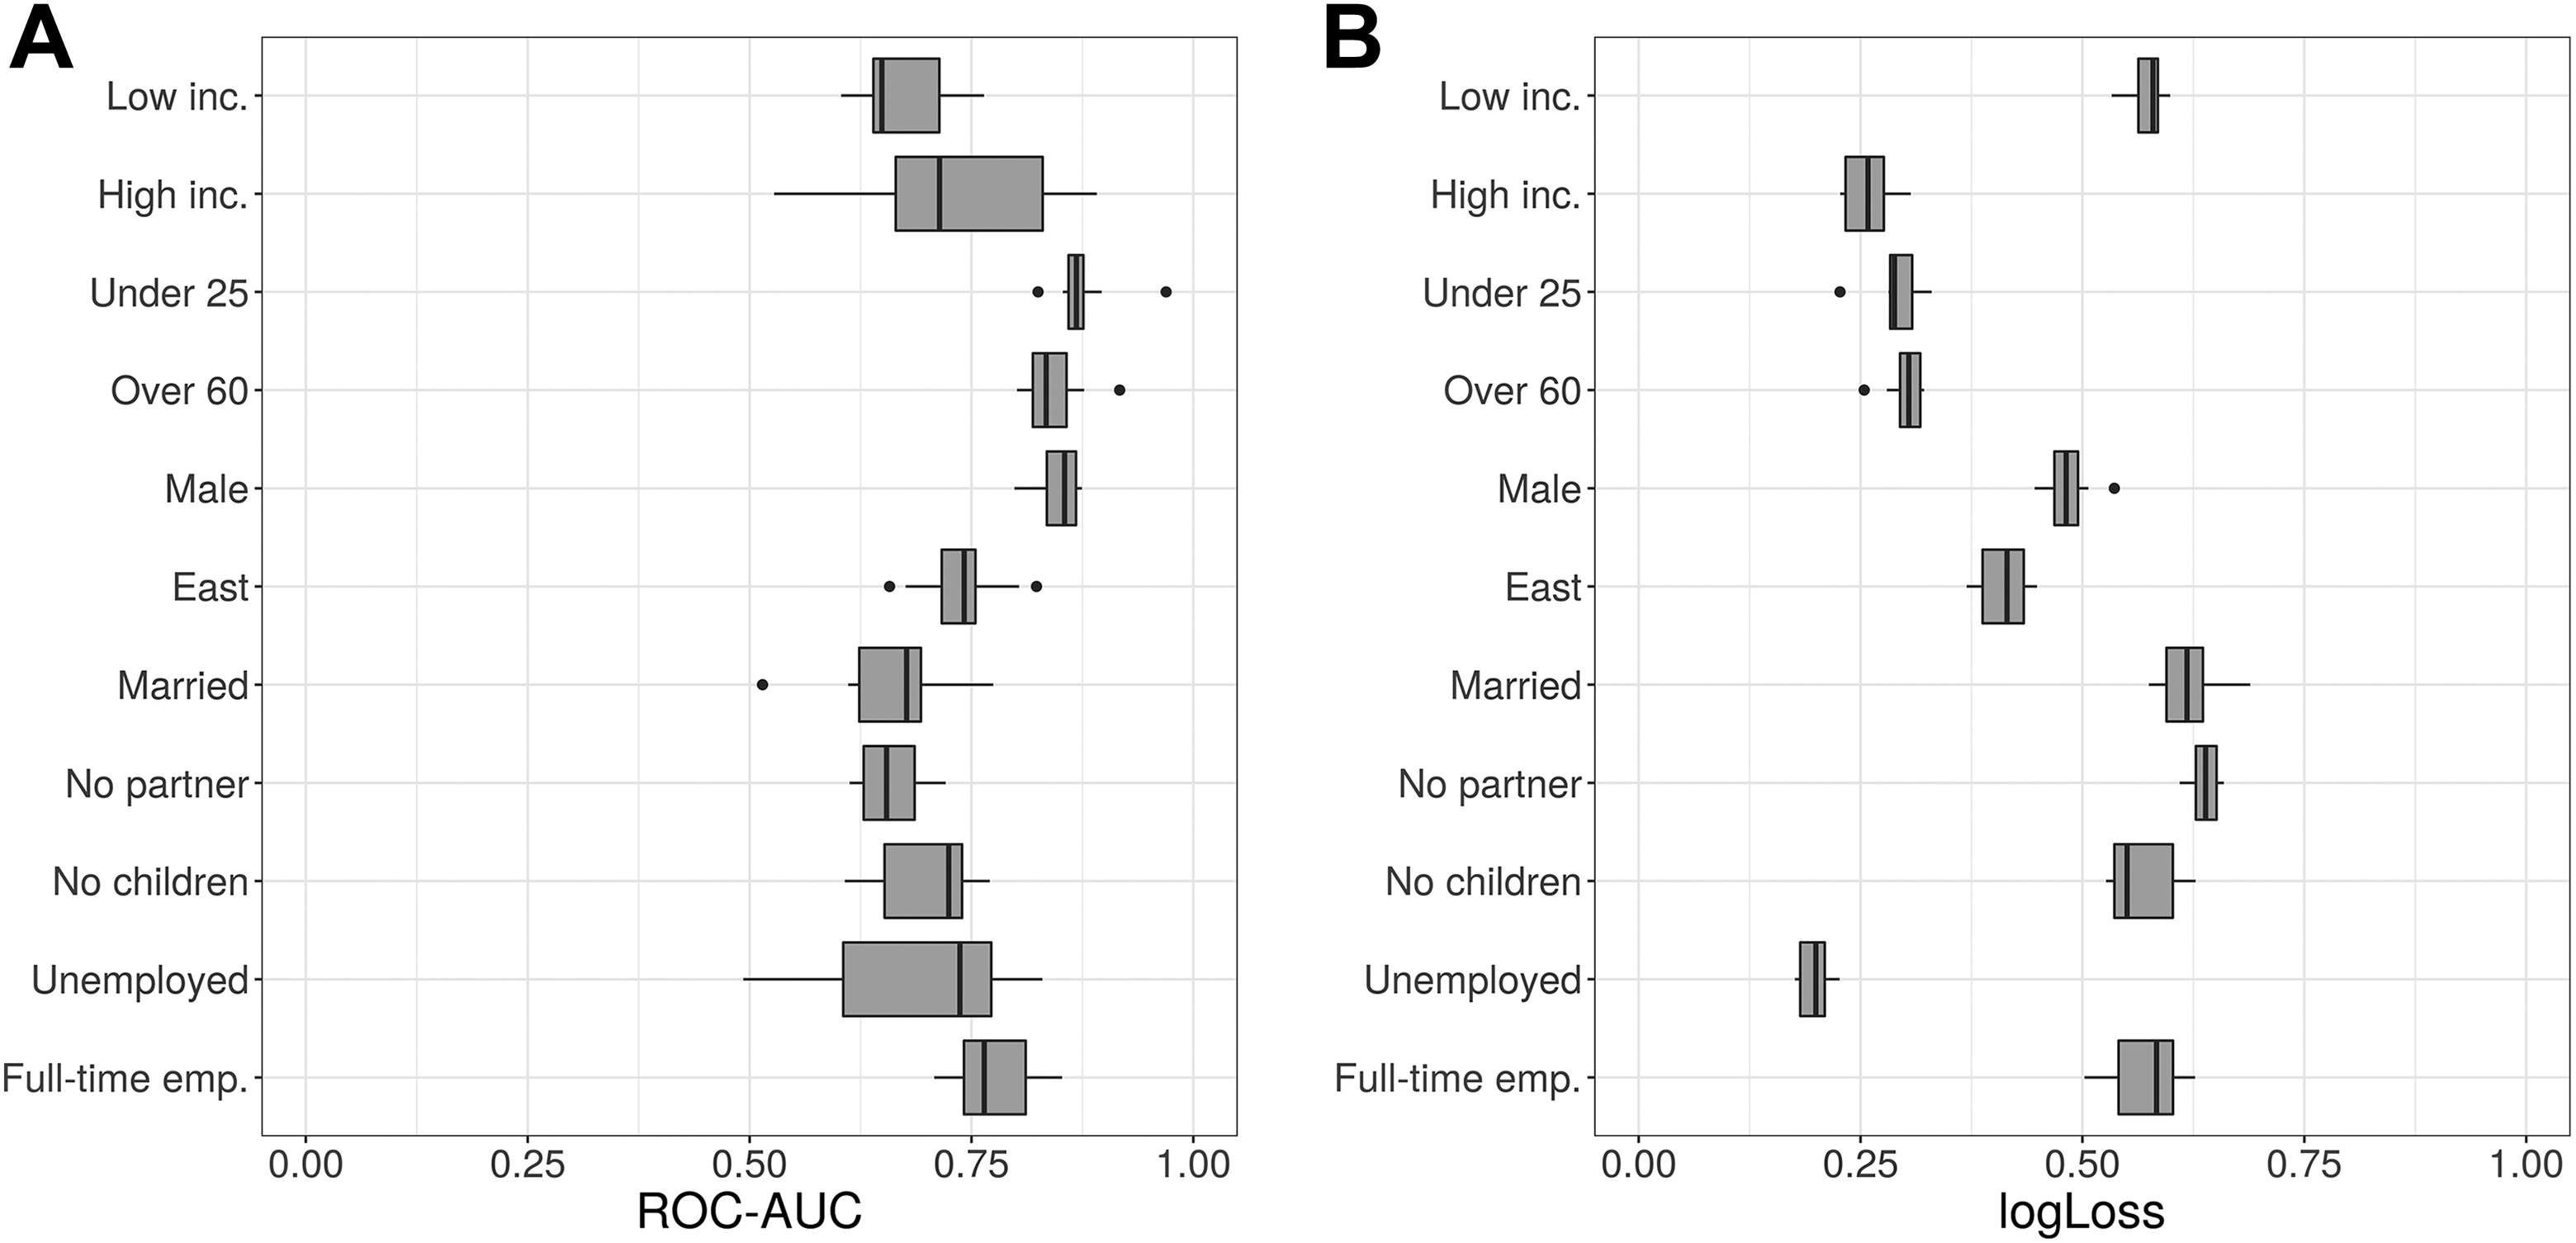
Performance for predicting sociodemographic characteristics with tracking data (cross-validation in training set). (A) Receiver operating characteristic–area under the curve and (B) log loss.
Receiver Operating Characteristic–Area Under the Curve (ROC-AUCs) and Log Loss for Predicting Sociodemographic Characteristics With Tracking Data (Validation Set).
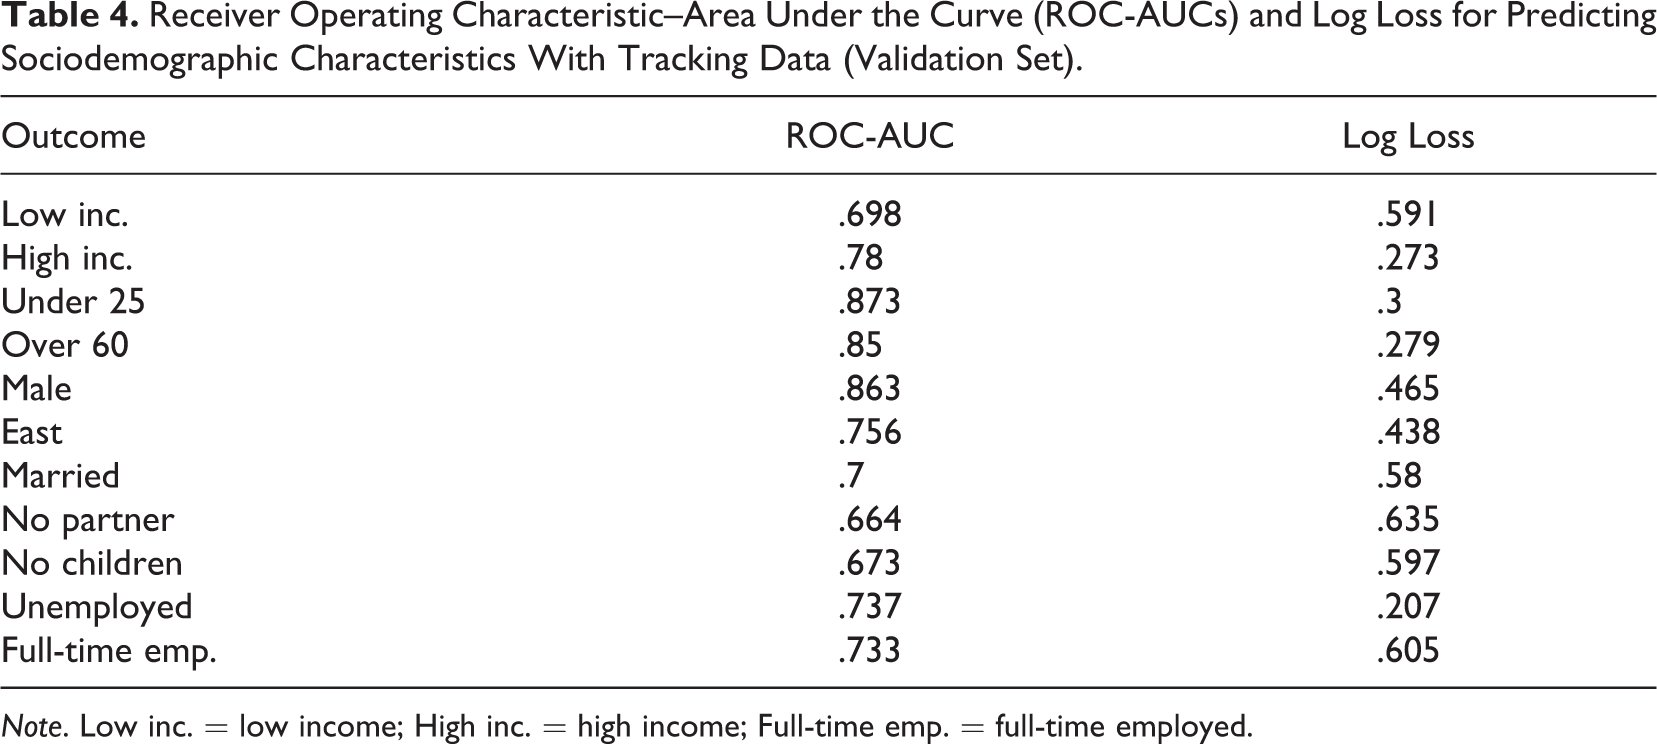
Note. Low inc. = low income; High inc. = high income; Full-time emp. = full-time employed.
Discussion
Commercial research in online marketing and advertising heavily rely on digital trace data to gather insights into peoples’ lives. By inferring users’ attributes and interests from their online activities, companies offer user-friendly online experiences, tailor search results, and make Internet users’ lives easier. Ubiquitous tracking of individuals’ online activities, however, raises concerns regarding users’ limited control over personal information, especially regarding sensitive information. Against this background, we study in this article whether we can accurately predict voting behavior and party preferences, a form of sensitive personal information, using a rich combination of digital trace and survey data. With our setup, we aim to mimic tracking and processing of digital trace data in the wild.
On a general level, our predictions of voting fail to reach typical performance levels of sociodemographic benchmark models (e.g., Goel et al., 2012; Malmi & Weber, 2016). In particular, digital trace data do not allow us to accurately identify undecided voters, while we achieve slightly better results for (self-reported) voting and for votes for a right-wing populist party (AfD) and a progressive environmentalist party (Greens). Comparing different feature groups indicates that digital trace data seem to be more informative than sociodemographic information regarding predictions of populist party preferences (voted for AfD). Generally speaking, our findings do not indicate that political behaviors such as those studied in our article can be inferred from records of users’ online activity in an almost deterministic way.
Overall, our sociodemographic benchmark results are in line with findings from previous studies (e.g., Goel et al., 2012, report similar ROC-AUCs for age and gender based on web visits and Malmi & Weber, 2016, for app-based models), demonstrating that tracking data can be used to uncover users’ age and gender. Given that these findings match those of previous research, we believe that the levels of accuracy achieved regarding political behaviors provide a realistic estimate of how much digital trace data reveal about them. Yet, companies like Alphabet (Google) or data brokers like Acxiom likely have larger analytical resources and collect additional data through the variety of the services they offer (e.g., location data through Google maps) and may do so for longer time spans. Therefore, the levels of accuracy that can be achieved through combinations of more data sources and larger investments in analytical capacities may be higher.
It is important to note that our results are conditional on a number of methodological decisions made in the workflow of our study. Given the large amount of information from the digital trace data, we considered only domains (instead of full URLs) and restricted the domains visited and apps used based on the frequency and duration of usage. Future studies may attempt to extract more information from the records of browsing behavior, for example, by mining information from the websites visited or by extracting additional information from a URL such as the title of a news article or search queries from visits to search engines. While additional efforts of mining URLs increase the workload of preprocessing the records substantially, there is no guarantee that those efforts will pay off in terms of increasing predictive performance. Furthermore, we observed class imbalance in most of our outcomes, which complicates class predictions and—in combination with the overall sample size—limits detailed subgroup analysis. In addition, the size of our training data (about 1,500 users) is rather small, and predictive performance may increase with more training data. Another caveat is that we treated survey data from a nonprobability source as the ground truth of the outcomes. Our models predict reported voting behavior and reported party preferences (for members of a nonprobability panel who consented to being tracked for four months). Our findings are therefore dependent on the assumption that any (potential) survey errors (such as sampling or measurement error) are unrelated to the correlation structure used to build the prediction models. We also note that our results are limited to the German case, and results may differ for countries with different political systems (e.g., the two-party systems of the U.S.) or more (or less) polarized and partisan media.
Interestingly, studies using Twitter data report similar (low) levels of predictive performance (Cohen & Ruths, 2013). While classifying political orientations of politically very active Twitter users and politicians based on their Twitter activity results in high accuracies (more than 90% of users can be correctly classified), the same task fails for an ordinary sample of Twitter users (only about 65% correctly classified). Likewise, even large and experienced companies like Facebook do not seem to achieve results that are much different from ours (about 75% correctly classified), thus challenging the idea that more data and more resources may boost algorithmic performance (Pew Research Center, 2019). The difficulties of predicting political behaviors and preferences of people who are not above-average politically active thus seems to be consistently difficult across various sources of digital trace data.
Regarding social science theories of selective news exposure and changes in political engagement due to Internet use, our results add to previous research regarding the limited effect size of internet use and selective news exposure on political behaviors and preferences. We do not believe that our results disprove these theories; instead, they contribute to our understanding of the magnitude of the associations. That is, online societies, for example, may not be as fragmented as some early commentators postulated (e.g., Sunstein, 2009). Likewise, mainstream public debates of Big Data, microtargeting in political campaigns, and social media’s impact on democracy may overestimate what Big Data and predictive modeling can (or cannot) do (A. Chen & Potenza, 2018).
Regarding the issue of users’ limited control over personal information flows, we note that our findings are only partly appealing to those concerned that digital trace records may be (mis)used to reveal sensitive political behaviors. While the inferred attributes are likely inaccurate, users seem to perceive inaccurate information as much of a privacy violation as accurate attributes (Dolin et al., 2018). Moreover, some companies seem to infer sensitive personal information (including political views and behaviors) from digital trace data, although (judging from our results) with low accuracy. Thus, users are in fact associated with certain political positions and behaviors although they may be far from accurate. Moreover, such activities leave users completely out of control of personal information flows. This seems to be especially challenging for users if they do not know who gets access to their (false) information and who may take the ascribed behaviors, trusting Big Data and associated technologies, as the truth.
Supplemental Material
Supplemental Material, Bach_Online_Supplement - Predicting Voting Behavior Using Digital Trace Data
Supplemental Material, Bach_Online_Supplement for Predicting Voting Behavior Using Digital Trace Data by Ruben L. Bach, Christoph Kern, Ashley Amaya, Florian Keusch, Frauke Kreuter, Jan Hecht and Jonathan Heinemann in Social Science Computer Review
Footnotes
Data Availability
Data may be accessed onsite at the University of Mannheim by contacting the first author of this article (
Declaration of Conflicting Interests
The authors declared no potential conflicts of interest with respect to the research, authorship, and/or publication of this article.
Funding
The author(s) disclosed receipt of the following financial support for the research, authorship, and/or publication of this article: Ruben L. Bach's time was supported by the German Research Foundation (DFG) through the Collaborative Research Center SFB 884 “Political Economy of Reforms” (Project A8) [139943784 to Annelies Blom, Florian Keusch, and Frauke Kreuter].
Software Information
Tracking data preparation and analyses was done in R (Version 3.5.1, R Core Team, 2018). Prediction models were trained using the XGBoost package (Version 0.82.1; T. Chen, He, Benesty, Khotilovich, & Tang, 2018). The training, tuning, and evaluation infrastructure was provided by the caret package (Version 6.0-81; Kuhn, 2017). Classification thresholds were obtained with the pROC package (Version 1.13.0; Robin et al., 2011). Survey data were prepared in Stata (Version 14). Code for replication purposes is archived at ![]()
Supplemental Material
Supplementary material for this article is available online.
References
Supplementary Material
Please find the following supplemental material available below.
For Open Access articles published under a Creative Commons License, all supplemental material carries the same license as the article it is associated with.
For non-Open Access articles published, all supplemental material carries a non-exclusive license, and permission requests for re-use of supplemental material or any part of supplemental material shall be sent directly to the copyright owner as specified in the copyright notice associated with the article.