
Abstract
Smartphones enable passive collection of sensor data alongside survey participation. Location data add context to people’s reports about their time use. In addition, linking global positioning system data to self-reported time use surveys (TUSs) can be valuable for understanding how people spend their time. This article investigates whether and how passive collection of geographical locations (coordinates) proves useful for deriving respondents’ functional locations. Participants of the ongoing Children of Immigrants Longitudinal Survey in the Netherlands were invited to participate in a TUS administered with a smartphone app that also unobtrusively tracked respondents’ locations. Respondents reported their activities per 10-min interval in a smartphone diary app (n = 1,339) and shared their geographical location data (n = 1,264). The correspondence between the functional locations derived from the time use data and those derived from the geographical location data was assessed by calculating the percentage of intervals in which both measures are similar. Overall, results show that home locations can be automatically assigned reliably but that respondent information is required to reliably assign work or school locations. In addition, location tracking data contain many measurement errors, making it difficult to record valid locations. Multilevel models show that the variability in correct classifications is intrapersonal and largely predicted by phone type, which determines location measurement frequency.
Smartphones are increasingly viewed as groundbreaking data collection tools for studying human behavior (Link et al., 2014; Miller, 2012; Raento, Oulasvirta, & Eagle, 2009). In the Netherlands, 90.3% of the total population owned a smartphone with Internet access in 2018, with percentages over 98.5 for individuals between 12 and 45 years (Statline, 2019). People carry smartphones around naturally and use them continuously for information and communication purposes in everyday life. This allows researchers to directly interact with respondents at any time and at any location (Raento et al., 2009). Because most people are used to sharing opinions and information through the apps on their mobile phones, they probably see smartphone-based data collection tools as natural extensions of the many functions of their phones, which could lower the threshold to use it for research.
Smartphones have sensors that researchers could use to collect high-intensity data passively, that is, without the measurements requiring any respondent activity beyond giving a one-time permission to share sensor measures with the researchers. We do not know whether respondents are willing to do give such permissions and neither do we know how useful sensor data actually are for social scientific research purposes.
A growing body of research on sensor data (e.g., Anhoj & Moldrup, 2004; Chatzitheochari et al., 2017; Plowman & Stevenson, 2012; Sonck & Fernee, 2013) illustrates the new types of data that can be collected via mobile phones. Notwithstanding their importance, many of them are small case studies and pilot projects (e.g., Cottrill et al., 2013; Sugie, 2018). Questions remain regarding the usefulness and data quality of sensor data.
This article addresses methodological challenges of analyzing and integrating survey and sensor data. More specifically, our purpose is to assess whether in time use surveys (TUSs) administered on smartphones, the passive recording of participants’ geographical locations (the coordinates of the locations) is sufficient to establish their functional locations (the natural functions of the locations). In other words, if we know a person’s current activity and geographic coordinates, do we also know the function of their current location, for example, whether they are at home, at school, or somewhere else? As location tracking data incorporate information about people’s time use, linking global positioning system (GPS) location data to self-reported TUSs can potentially be a beneficial practice. The main aims of this article are to propose a method for analyzing GPS data, to integrate location and survey data, and to explain variability. If we understand how to use location tracking data, and if locations are measured accurately, we may be able to automatically record functional locations in TUSs in the future.
Background
Traditional and paper diary studies are commonly used by researchers to measure a respondent’s time use, travel behavior, physical activity, or dietary intake. Respondents are asked to take detailed notes about all their activities for several days. The accuracy of the data depends on respondents’ memory and the effort they are willing to put in filling out the diary. Due to the high burden, respondents may be less willing to put effort in the diary over time and may also be inclined to postpone filling out their diaries leading to higher recall bias. Analyses of 2-day dairies show that respondents were less accurate and nonresponse was higher during the second day than during the first day (Arentze et al., 2001; Chatzitheochari et al., 2017). Alternatively, they may drop out altogether; nonresponse has been shown to be problematic in diary studies (e.g., Elevelt, Lugtig & Toepoel, 2019; Thompson et al., 2014; Van Ingen, Stoop, & Breedveld, 2008). Therefore, diaries are most often used for capturing only a couple of days of behavior (Schlich and Axhausen, 2003), although covering fewer days increases the chances that low-frequency behavior will not be captured (Gershuny, 2012).
Location data can be a valuable addition to time use research and diary studies in general. With these data, we get an insight not just into what people are doing but also where they are doing it (Plowman & Stevenson, 2012). This allows data to be understood in its context (Chen, 2011). When respondents, for example, fill out to be listening to music, the geographical location data can enable researchers to make a distinction between listening to music in the train or at home.
Many European TUSs follow the Harmonized European Time Use Survey (HETUS) guidelines (Eurostat, 2009). These guidelines recommend to code functional locations such as in transit, at home, working place or school, other people’s home, or unspecified location. According to these guidelines, functional locations are not asked directly but determined by trained coders based on diary information. This is a very time-demanding/money-demanding and rater-dependent process. Alternatively, when respondents are asked to report their functional locations themselves, a lot of item missings are found (Chatzitheochari et al., 2017; ONS, 2006). Therefore, it would be useful to see whether we can automatically code functional locations, without interference of raters or the respondent himself or herself.
The use of smartphone-based diaries can, combined with sensor data, be an efficient and cost-effective solution to reach a large sample and follow them over a longer time without increasing respondent burden (Patel, Nowostawski, Thomson, Wilson, & Medlin, 2013; Raento et al., 2009). Researchers can passively record geotracking information by using the location services of the smartphone. Geotracking enables researchers to see exactly where participants are and how they travel throughout the day (Bohte & Maat, 2009; Miller, 2012). Respondents’ geolocations can be determined both by the GPS receiver incorporated in smartphones and by cellular towers and Wi-Fi networks. All methods result in a location that consists of a latitude and longitude measurement. Depending on the method being used, locations can be measured accurately with a precision of about 5 m (GPS/Wi-Fi), although precision is much lower when cellular networks are used. Geotracking records locations at regular intervals and will therefore yield a very large and detailed data set of location coordinates of every respondent, from which we can potentially automatically derive functional locations.
Researchers have already started to investigate how to combine geographical location data and survey data in mobility research. The purpose of location data in mobility research is to identify movement or trips. Respondents are asked to write down the locations of the beginning and destination of the trip, along with the purpose, length, and distance of the trip and mode of transport. This purpose is different from recording locations of time use, but there is still a lot we can learn from mobility research. Traditionally, mobility research data were also collected through paper travel diaries in which respondents were asked to record their travel behavior for several days (Bohte & Maat, 2009). GPS-based data methods are potentially more accurate and less burdensome for respondents compared to traditional paper travel diary methods. The evaluation of a GPS-based mobility survey confirms that this method has a lot of potential (Bohte & Maat, 2009; Cottrill et al., 2013). More exact data about routes, trip length, and trip duration can be collected, as these are really hard for respondents to estimate precisely. Subsequently, these data can be enriched with a survey in which respondents are asked about the functional locations or origin and destination, and trip purposes.
Problems identified in studies from mobility research include the need for rule-based algorithms, GPS trackers’ battery life, and geographical location data quality. Because of the large quantity of location data that can be collected, there is a need for procedures to manage, manipulate, and analyze the data. We need to set up rules and algorithms to automatically detect trips and determine trip mode and purpose (Stopher, Fitzgerald, & Zhang, 2008). Another issue is smartphone or GPS logger battery drain due to geotracking. Respondents need to charge their device (more) often, which they may forget or perceive as burdensome, inducing nonresponse (Bohte & Maat, 2009; Cottrill et al., 2013). Furthermore, the geographical location data can contain measurement error. GPS coverage varies, and GPS accuracy depends on satellite geometry, signal blockage, atmospheric conditions, and receiver design features/quality (in other words, the device itself). Geographical location data may be inaccurate as GPS trackers may, for example, lose signal indoors, in trains, or in areas with many tall buildings (Bohte & Maat, 2009; Zheng, Li, Chen, Xie, & Ma, 2008), leading to positioning errors (Song & Lee, 2015). According to Stopher and Shen (2011), location trackers sometimes miss trips that are of short duration or distance or when the time between trips is short. The device then fails to locate the position before the trip has ended or the next trip has started. Next to these technical drawbacks, the problems can be caused by the respondent who can turn off the location tracker or forget to carry the location tracker during travel.
In this study, we assess whether locations measured by smartphones are sufficient to automatically record functional locations of respondents and see whether we can overcome some of the problems of geotracking identified in mobility studies. The use of location data next to time use day could add context to the time use codes (Chen, 2011). We show whether and how we can use geographic data to automatically record functional locations in time use research. In order to test this, we apply a set of simple rules to assign functional locations in different steps to the raw location data and link this to the time use data. When functional locations are coded to be the same in both data sources, we consider them to be correctly classified. We start by investigating the correspondence between the frequency distributions of functional locations assigned by the location data and by the time use diary data. Second, we investigate whether the functional locations are also correctly classified as we compare them at a fixed 10-min interval level. Third, we investigate for what specific activities we find correspondence between the functional locations. Finally, we try to explain the variability by investigating for whom and when we can automatically record functional locations.
Method
Sample and Procedure
To answer the question whether we can automatically record functional locations from geotracking data, we use self-reported time use data and passively collected tracking data of young adults. We invited panel respondents of the ongoing Children of Immigrants Longitudinal Survey in the Netherlands (CILS4EU; Jaspers and Van Tubergen, 2015; Kalter et al., 2016) to participate in a smartphone survey study lasting 4 days. The CILS4EU panel study started in 2010 with a sample of 14–15-year-olds (third-year high school pupils in the Netherlands) that oversampled immigrant minority youth. The name of the survey that was used to invite respondents was Youth in Europe Study. In the Netherlands, respondents were followed up each year until Wave 5 for which fieldwork was completed in the period January to May 2015. Two thousand and six hundred and fifty-eight randomly sampled panel respondents, for whom there was a valid e-mail or postal address, were invited to our smartphone study. The unique login codes that were sent to the respondents corresponded to a randomly assigned set of 4 fieldwork days in the 2-week period of September 28 to October 11, 2015. The 4 days were always at least 2 days apart. Invitation letters were sent, so that respondents received them 1 week prior to the first fieldwork day, which would give them sufficient time to install the app and login for the first time. The app then retrieved the fieldwork days assigned to the respondents automatically from the server. All those who had not yet logged in for the first time on Monday, September 28, 2015, were sent a reminder e-mail. Anyone who had already missed the first-week fieldwork day was assigned two additional fieldwork days in a third week of data collection (October 12 to October 18, 2015).
We used a progressive remuneration scheme in which we sent respondents a 40-euro gift card if they completed the full 4 days of the TUS. Those who missed 1 day received a 20-euro gift card, and respondents who participated for 2 days got a 10-euro gift card. If respondents participated fewer than 2 days, they did not receive a gift card.
Of the 2,658 invited panel respondents, 50.4% participated in our smartphone diary study (N = 1,339); 83.5% of the respondents had at least one observation on each of the 4 fieldwork days, 7.7% on 3 days, 4.2% on 2 days, and 4.7% on 1 day.
The Smartphone Time Use and Victimization Survey App
In order to study in greater detail the situational factors that influence the risk of victimization, the Netherlands Institute for the Study of Crime and Law Enforcement (NSCR) developed a dedicated time use and victimization smartphone survey app Dagboek Activiteiten en Risico [Activities and Risk Diary]. The app conforms to the HETUS guidelines on harmonized European TUSs (Eurostat, 2009) in that it asks respondents to report about their activities in 10-min intervals, starting each response day at 4:00 a.m. It uses the overall HETUS activity categories (for more details on the app design and how it follows HETUS guidelines, see Sonck & Fernee, 2013; see Figure 1 for screenshots of the TUS app). Although the app could be installed by anyone, it could only be used with a unique login code that was sent to respondents in the invitation to participate.
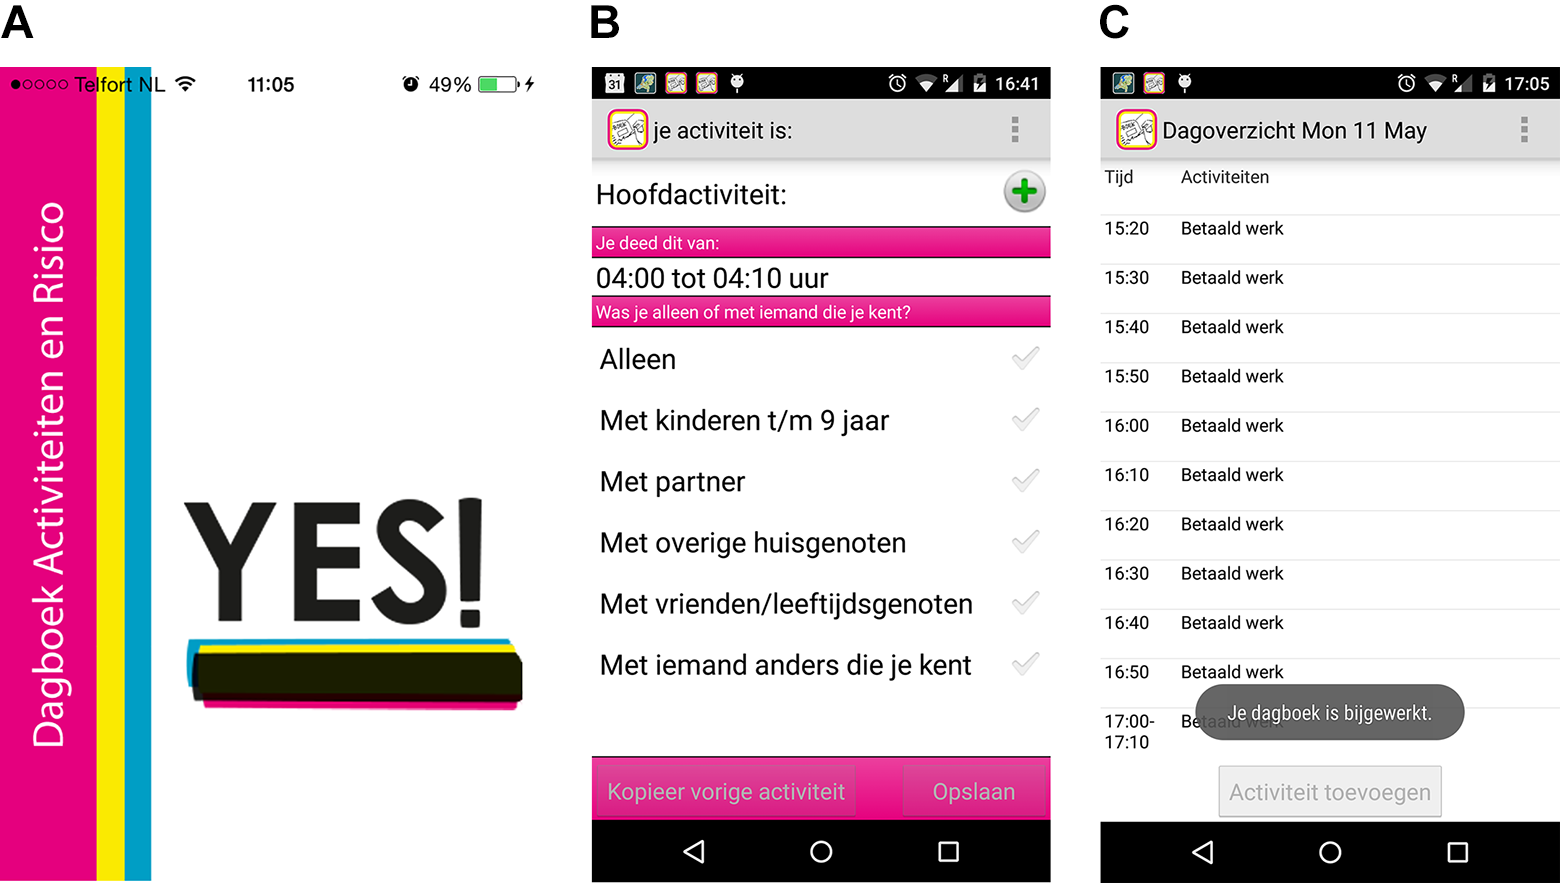
Screenshots of the time use survey app. (A) The login screen; (B) the screen where activities were reported; and (C) the day overview of a set of recorded activities.
The app was programmed by CentERdata, an independent research institute in the Netherlands, who also hosted the servers to which all responses were sent. Commissioned by NSCR, CentERdata extended the app with additional questions on victimization, witnessing crime, and substance use, additional answer categories for the questions on mode of transportation and other people present. These data are not used in this study.
Following the HETUS guidelines, the time use diary divided the day into 144 fixed 10-min timeslots. The total number of observations available for analysis was 702,832 ten-min intervals (timeslots), implying that the 1,339 respondents on average provided data for 525 ten-min time intervals (91% of all possible timeslots).
The present study uses only the time use and geotracking data. Respondents completed their time diary on average 8.4 times a day, ranging from only once to 40 times a day. Android users completed the diary more often (10.6 times) than iOS users (7.1 times).
Comparison of Respondent Activities With the Dutch TUS
By comparing the reported activities from our sample with data from the Dutch TUS 2016 (Roeters, 2017), we can estimate whether the smartphone diary app generated results comparable to that of the official Dutch TUS. The average age in our sample was 20.55 years old, ranging between 18 and 24. We compare our sample to two separate age categories of the Dutch TUS: 12–19 years, as the lifestyle of our sample is probably most comparable to this group (education and few responsibilities concerning domestic work and care) and 20–64 years, as the average age in our sample lies in this range.
The Dutch TUS divides the separate activity codes into six main categories: personal care, employment, study, domestic work and care-taking, leisure and volunteer work. Table 1 shows that the reported activities of our sample are quite similar to the activities of the 12–19-years-old group in the Dutch TUS 2016. The main differences lie in the time spent on domestic work and leisure, which is lower in our sample. This difference can be explained by the absence of the main category “traveling” in the Dutch TUS, where travel episodes were classified based on the trip purpose (e.g., traveling to a sport club would be classified as leisure in the Dutch TUS).
Average Percentage of Time Spent on Various Activities Per Day.
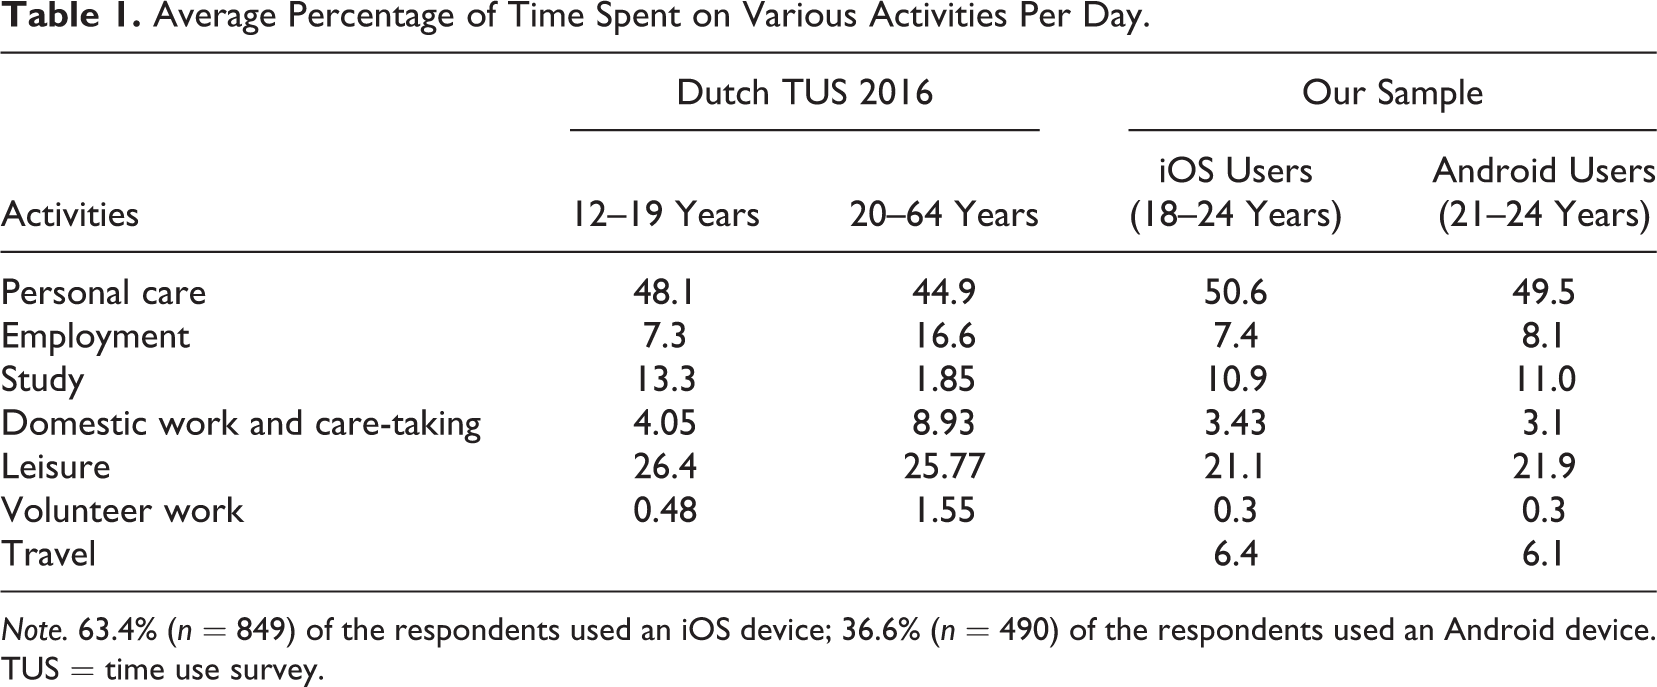
Note. 63.4% (n = 849) of the respondents used an iOS device; 36.6% (n = 490) of the respondents used an Android device. TUS = time use survey.
Time Use Location Codes
We assigned all 41 time use activity codes to one of five functional locations based on where the activities are expected to happen. The United Kingdom Office of National Statistics (2006) uses a crude distinction between activities at home versus those away from home. We subdivided the away category further into at work/school, in transit, and at some other location. We also included a category everywhere for activities that have no clear functional location and could thus occur in all locations (see Appendix A of Online Supplementary Material) for the classification scheme for all 41 HETUS activity codes. To our knowledge, ONS (2006) is the only organization using respondents’ self-reports of their locations and time use following the HETUS guidelines.
Home included all activities related to personal care or the household, such as sleeping, washing, and dressing, or doing housework. Following reports of ONS (2006), media- or computer-related activities such as watching TV, reading, and using the computer were also assigned to the home category.
Work/school is expected to be the main daytime activity of most people in our sample. However, some respondents are doing vocational training at work, so we combined the two.
Other included all activities that we expected to happen at another location than the home or work/school locations. This category includes activities related to leisure time, going out, and doing volunteer work, for example, shopping, cultural visits, sports, religious activities, and helping others outside the family.
In transit included all recorded trips, traveling by own means/transport and traveling by public transport reported by respondents.
Everywhere included all remaining categories that could reasonably take place at any location. This category includes having a talk, using the telephone, registering time use, and listening to radio and music.
Location Tracking
At installation of the smartphone survey app, respondents were asked whether they agreed with sharing their geotracking information over the 4-day period when they completed the time use diary; 94.4% of the participants gave consent to share GPS data (n = 1,264). The location tracking services of the smartphone platforms were then used to record time-stamped longitude/latitude coordinates.
In total, 941,821 location tracking measurements were collected (mean per person = 726.6). The frequency of measurement differed between the two platforms. Android phones record GPS coordinates every 10 min, which in theory would sum to 576 GPS locations for the 4 days of data collection. However, the location tracking services did not always get a valid measurement immediately (e.g., in densely build areas or indoors), and if that occurred, the app retried to get a valid measurement of coordinates a few minutes later. This resulted in more measured coordinates. On average, 986.3 coordinates were available per Android user (472,422 in total). On iOS devices, the location services operated differently. The measurement of time-stamped coordinates only starts when the accelerometer on the smartphone detects large movement, after which GPS coordinates are recorded frequently until the movement stops. On average, 573.1 coordinates were collected per iOS user (469,388 in total).
Analysis of Correspondence Between Diary and Geotracking Locations
In order to link the geotracking data to the time use diary data, we split the geotracking data in the same 10-min timeslots as used in the time use diary. When there were multiple coordinates measured within a particular timeslot, the first measurement within the timeslot was used.
In merging the time use data with the coded geotracking information, we only kept those timeslots for which we at least had information from the TUS. Missing geotracking data had a different meaning for iOS and Android users, due to the different ways of measuring. iOS devices only stored geotracking information when movement was detected by the accelerometer of the phone. This implies that no coordinates were recorded when a respondent was stationary. However, missing data could also mean that a respondent turned off his/her phone or GPS tracker. We imputed all stationary time GPS data from iOS devices though using the “na.lofc” function (Zeileis & Grothendieck, 2005) in R, replacing all missings with the most recent nonmissing value prior to it.
Functional Locations Derived From Geotracking Data
In order to derive functional locations from the time-stamped GPS coordinates, we first had to deal with small measurement errors in the geotracking data. This was done by rounding the longitude/latitude coordinates to the first three decimals, which limits spatial precision to 111.32 m. These rounded data were subsequently used to derive four location categories for the GPS data. All coordinates that were recorded when a movement of at least 100 m was detected were coded as in transit.
Home was coded as the main location where respondents were for at least 10 timeslots (1 hr and 40 min) between 4:00 and 6:00 in the morning.
Work/school was coded as the main location where respondents were for at least 15 timeslots (2 hr and 30 min) between 10:00 and 15:00 in the morning/afternoon. After assigning the home and work/school location this way, all timeslots that had the same coordinates at later time points were also coded as home and work/school, respectively. All other locations, where the respondent was not in transit, not at home, nor at school/work, were coded as other.
Method
Because our main objective is to investigate whether it is possible to automatically infer functional locations from geotracking data, the correspondence between the functional locations derived from the self-reported time use data with those derived from the geotracking data needed to be assessed. This was done by crosstabulating the codes from the two different sources and subsequently calculating the percentage that was coded to be the same. When timeslots were coded the same in both data sources, they were counted as correctly classified.
In order to investigate whether the two data sources match, we calculated the total accuracy by dividing the number of correctly classified timeslots by the total number of timeslots assigned to home, work/school, other, and in transit. In this calculation, we excluded the category everywhere because it is impossible to assess correct classification for these activities as they can take place everywhere. In order to investigate which functional locations we can automatically derive, the total percentage correct is calculated by dividing the matching timeslots of a specific location by the total number of timeslots assigned that specific location by the TUS.
We subsequently examined which types of activities, classified according to the HETUS codes, were better classified than others. Finally, we estimated several multilevel logistic regression models in order to assess whether correct classification mainly varies within or between individuals. This allows us to assess when and for whom it is possible to automatically record functional locations from geotracking data.
All data cleaning and analyses were done in RStudio (R Core team, 2017; see Appendix B of Online Supplementary Material) for the full code.
Results
Linking Location and Time Use Data
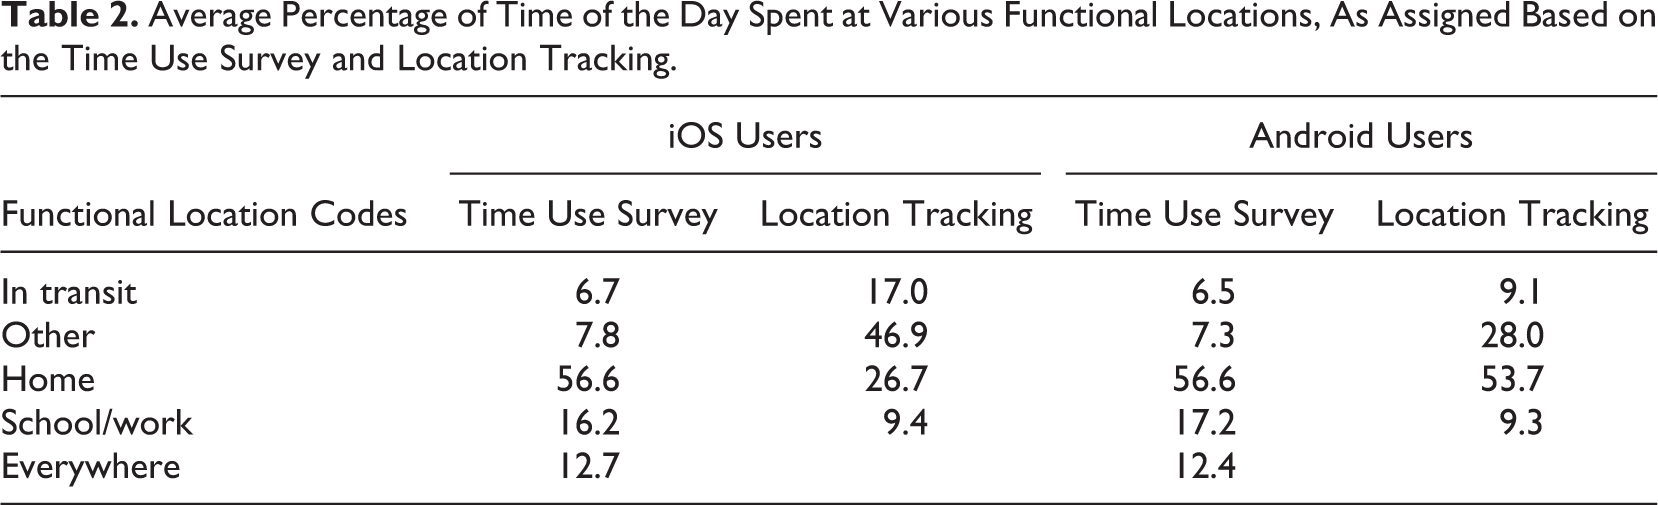
We start by investigating whether the aggregated frequency distributions of the functional location codes are the same for the TUS and the location tracking. The frequency distributions of the time use and location tracking data shown in Table 2 are more similar for Android users than for iOS users. This is mostly caused by the large overrepresentation of the category other for iOS according to the location tracking, which covers almost half of the records of iOS users. The functional location category other is also overrepresented in the Android data, but much less so than in the iOS data. For Android users, the percentage home and in transit are almost the same for the TUS and location tracking. For both types of devices, the functional location code work/school is underrepresented; the percentage of work or school locations assigned based on the location tracking is only half of the percentage according to the TUS. This suggests that we succeed only half the time in automatically assigning a school or work location. There are multiple possible reasons why we fail to find high correspondence between the measures. Either the diary data are incorrect or—in our view, more likely—the GPS data cannot be easily assigned to a functional location. To further investigate this issue, we conduct several additional analyses later in this article. First, we investigate matches at the level of the timeslot to inspect in more detail how data are misclassified.
Average Percentage of Time of the Day Spent at Various Functional Locations, As Assigned Based on the Time Use Survey and Location Tracking.
Linking Location and Time Use Data at the Timeslot Level
In the first step, we assigned functional locations to timeslots per day. This implies that what is referred to as the respondent’s home and work/school locations can vary from day to day (e.g., someone may have different work locations). The total percentage of correctly classified timeslots for iOS users is 33.3% and for Android users 58.5%.
Tables 3 and 4 show the results and correspondence at the timeslot level in more detail. What stands out of this table is that there is much more correspondence between time use diary and GPS locations for Android phones than for iOS phones. For Android data, the home location is correctly estimated for 70.5% of time use reports, while for iOS, this is 35.6%. Work/school are not consistently categorized correctly (21.3% and 32%). Especially for iOS users, respondents are far too often at an other location according to GPS when they are at home according to time use data. We fail to automatically record a home location for these participants. Next, we investigate several potential reasons why our method does not work.
Matching Per Participant and Per Day for iOS Users.
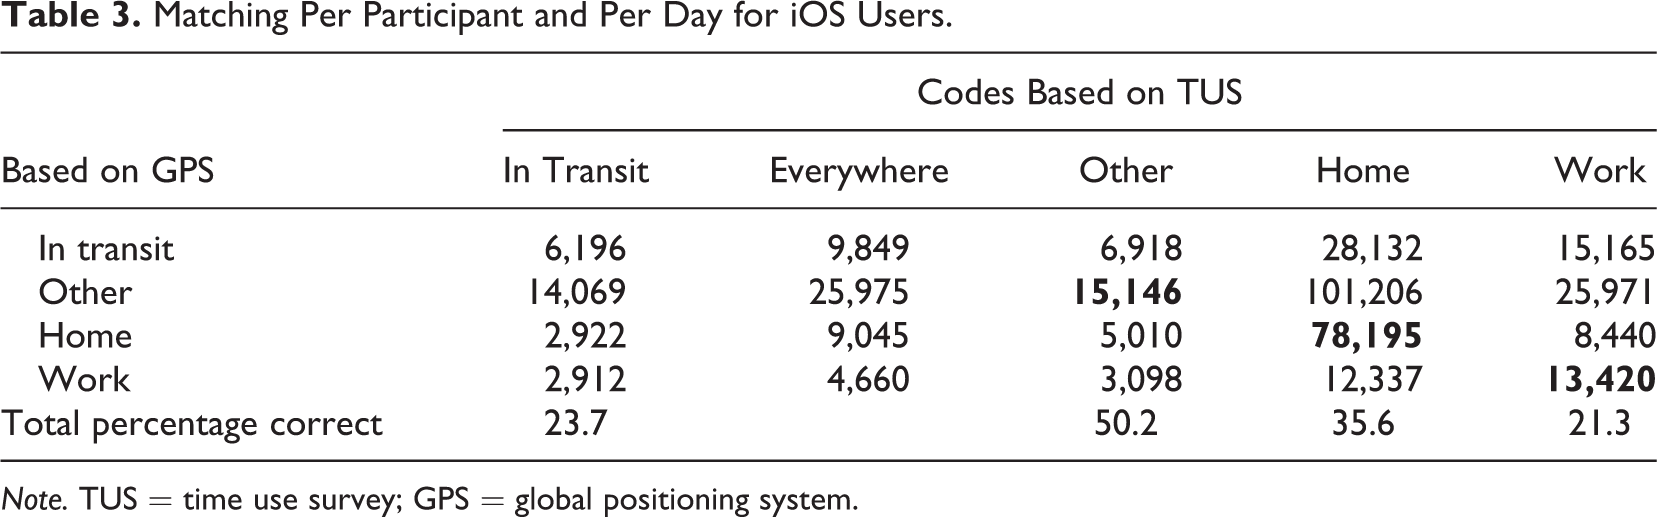
Note. TUS = time use survey; GPS = global positioning system.
Matching Per Participant and Per Day for Android Users.
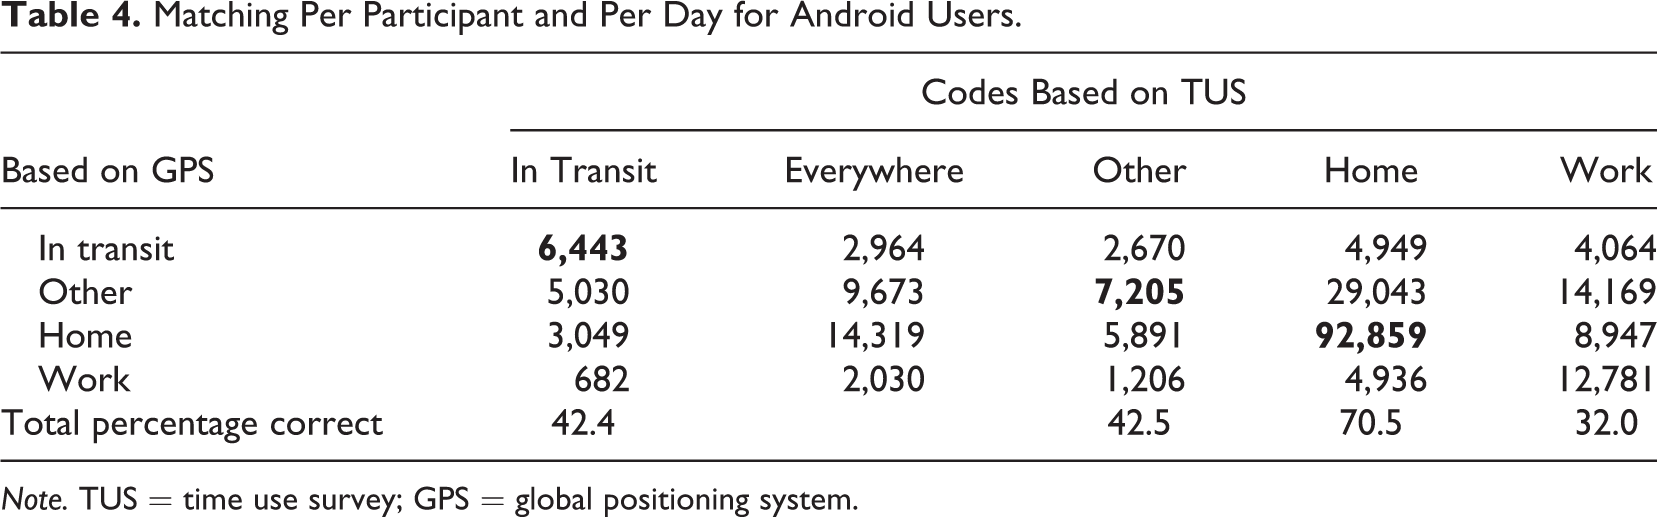
Note. TUS = time use survey; GPS = global positioning system.
First, there can be coding errors in the geographical location data. For example, respondents are not at home or work on a particular day, so we cannot assign a home or work location successfully. We therefore repeat our analysis, now coding over days, by using the geotracking data of all recorded days. We find that this does not solve the problem of low correspondence of measures though. The total accuracy for iOS is 24.7%, and the total accuracy for Android users is 52.8% (see Table A1 and A2 in the Appendix of Online Supplementary Material) for the complete results of these analyses.
Second, there can be coding errors in the time use data. For example, respondents fill out activities they do not actually do. We cannot control for that here and come back to this in the discussion.
Third, the two data sources are out of sync. For example, respondents miscode their time use activities due to recall error; an activity is recorded at a particular timeslot, when in reality it had happened a timeslot earlier or later. Allowing for these small temporal inconsistencies after matching the two data sources improves the coding, implying that respondents sometimes misclassify the timing of their activities. A more liberal coding by definition results in more matches and higher correspondence throughout. The total accuracy for iOS users increases to 36.0%, and the total accuracy for Android users increases to 61.3% (see Tables A3 and A4 in the Online Appendix for the complete results of these analyses).
A fourth possible reason is that the location data do not provide enough information in isolation. So far, we have assumed that the TUS data are correct and used those to better code the functional locations of the GPS measurements. Incorporating respondent information in our model, by using the locations where respondents filled out they were sleeping, working, and studying, to classify other locations at different times and days largely improves the coding of work and school. The total accuracy also increases but mostly due to the improvement in the coding of work and school. The total accuracy for iOS users increases to 44.9% and for Android users to 64.5% (see Tables A5 and A6 in the Appendix of Online Supplementary Material for the complete results of these analyses).
Finally, we chose to use the results as reported in Tables 3 and 4 for the remainder of the article. These results are not the most accurate, but the increase in accuracy by more liberal coding is not very large. The remainder of the article focuses on investigating for what specific HETUS codes, the GPS locations match.
Time Use Categories
Overall, we detect no large differences between activities that fall within the same functional location category. We see that we can assign functional locations generally better for Android users than for iOS users. The percentage of timeslots correctly classified is relatively low for iOS users; even for an activity like sleeping. For Android users, we are able to assign home codes quite well but not work and school locations (see Appendix 2, Table A7, of Online Supplementary Material), for the complete results per HETUS category.
Multilevel Models: Exploring Variability
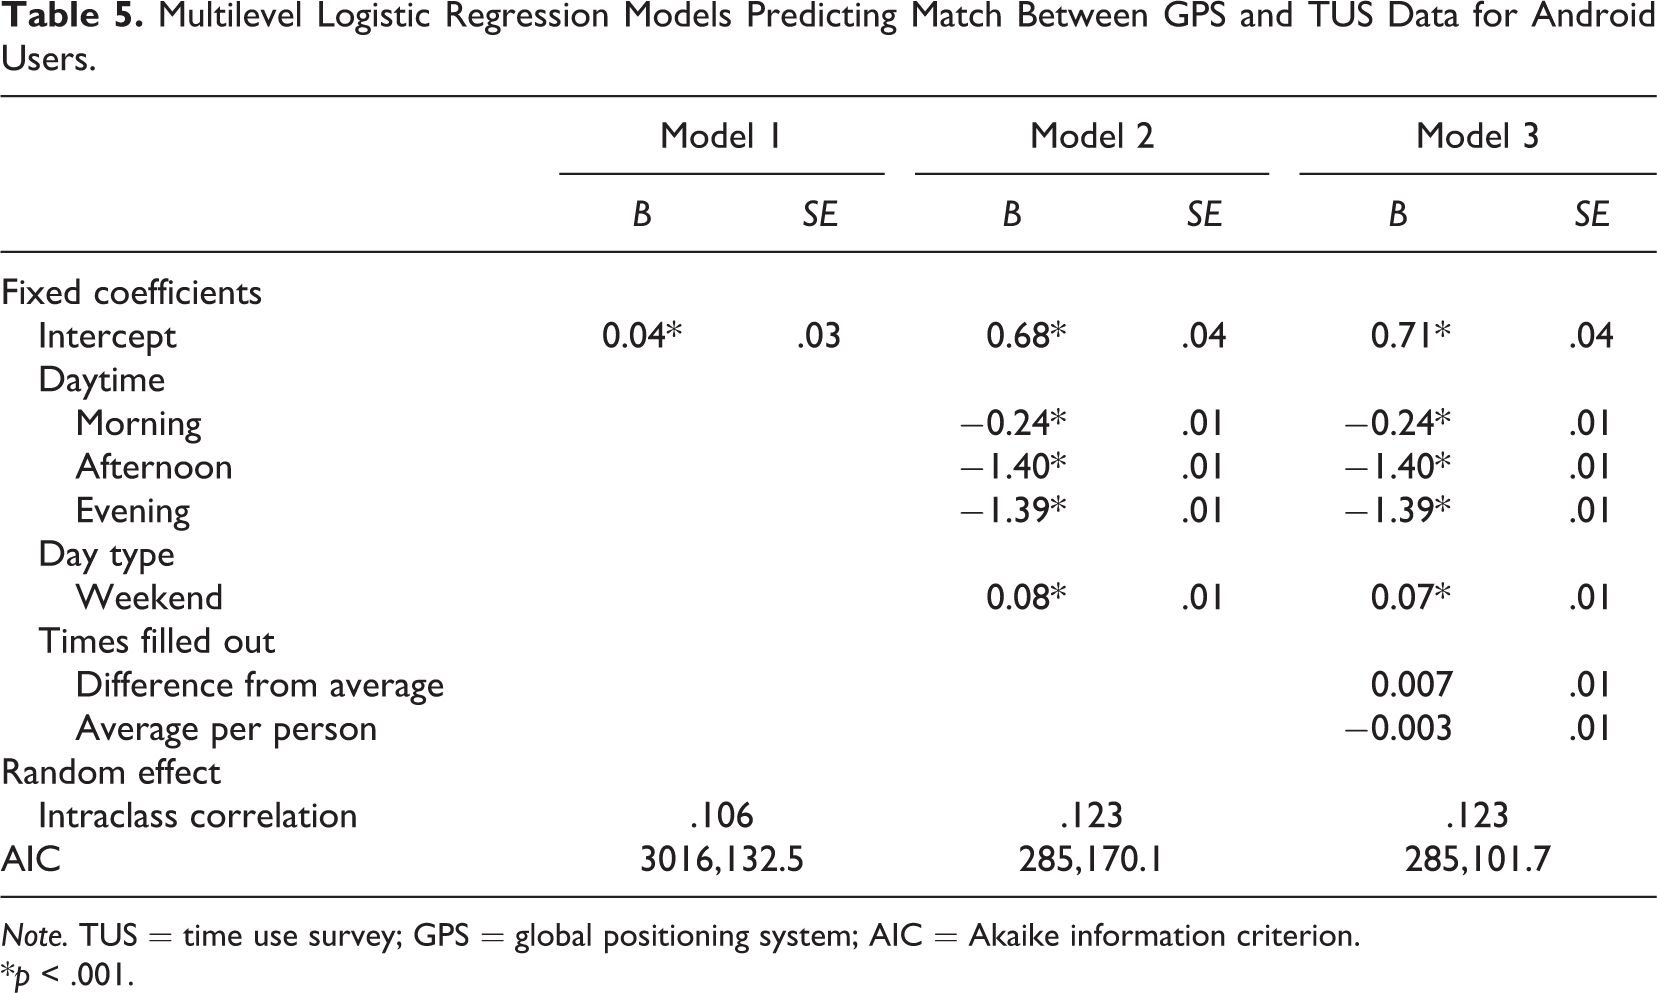
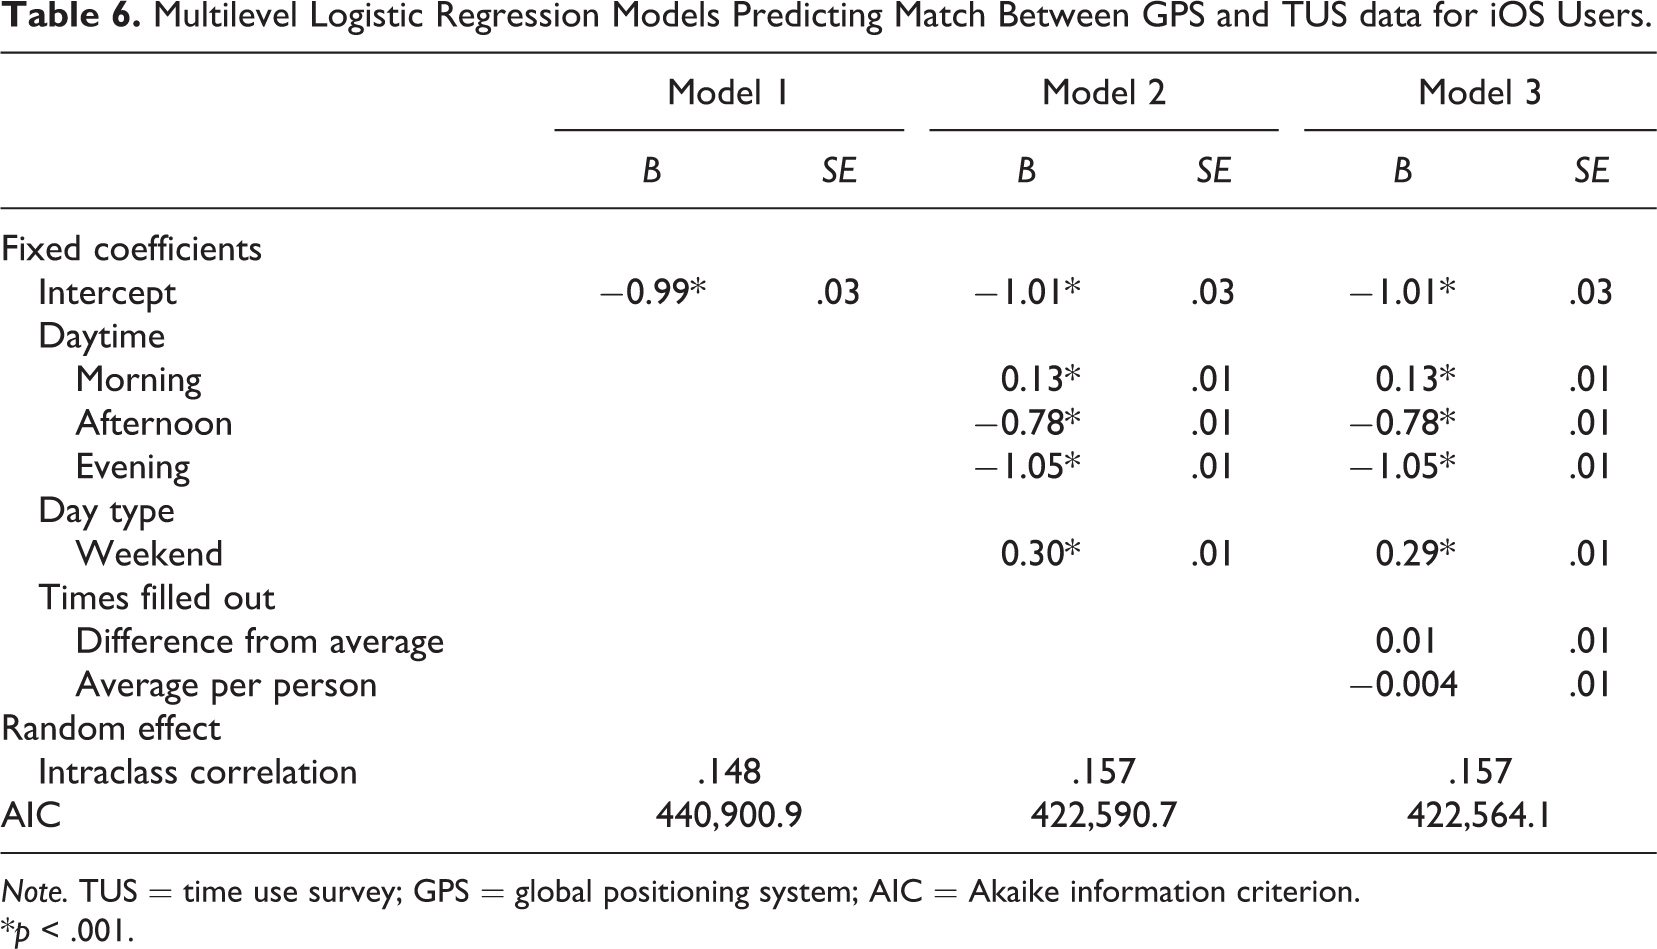
To explore the variability within the (in)correct classifications, we ran several multilevel models. We predict whether there is a match (0 = no match, 1 = match) between the functional location assigned by the location data and the functional location based on the time use data. As we have many measurements per person (one for each timeslot), and these measurements may not be independent, we treat time as Level 1 and the person/participant as Level 2 in our multilevel model. In addition, we calculate the intraclass correlations (ICCs) to investigate the proportion of within (time) and between (person) variance (Level 1 = time, Level 2 = person; see Tables 5 and 6 for the results of the multilevel models per phone type).
Multilevel Logistic Regression Models Predicting Match Between GPS and TUS Data for Android Users.
Note. TUS = time use survey; GPS = global positioning system; AIC = Akaike information criterion.
*p < .001.
Multilevel Logistic Regression Models Predicting Match Between GPS and TUS data for iOS Users.
Note. TUS = time use survey; GPS = global positioning system; AIC = Akaike information criterion.
*p < .001.
In Model 1, we add time and type of day as Fixed Level 1 effects to our model. Daytime divides the day into night (0:00–6:00), morning (6:00–12:00), afternoon (12:00–18:00), and evening (18:00–0:00). We made three dummies (morning, afternoon, and evening) using night as reference category. Day type is a dummy representing the difference between weekdays (= 0) and weekends (= 1). In Model 2, we added the number of times the respondent filled out the diary as a Fixed Level 1 and Fixed Level 2 effect. To use the number of times the diary is filled out as a Level 1 effect, we calculated the number of times the diary was filled out at a specific day of participation and centered that value within persons. As Level 2 predictor, we used the grand mean centered average number of times the diary was filled out per respondent per day.
We started with the intercept-only model and calculated the ICC (Hoffman, 2015; Snijders & Bosker, 1999). The ICC is a standardized way of expressing how much dependency is due to person mean differences (Hoffman, 2015). We calculated the ICC as (τU02)/(τU02 + 3.29) (Hoffman, 2015; Snijders & Bosker, 1999). In our case, 11% (Android) and 15% (iOS) of the original outcome variation can be explained by between-person mean differences over time. So the largest proportion of outcome variation is due to within-person differences.
Results of Model 1 show that for both phone types, more matching occurs at night than in the afternoon and evening. For the Android users also more matching occurs at night compared to the morning, whereas for the iOS users, more matching occurs in the morning. In addition, more matching occurs on weekend days than on weekdays. Results of Model 2 show that the number of times a respondent filled out the diary does not predict matching success. When looking at the model fit indices, it can be observed that the decrease in AIC is only small, indicating that adding the number of times the diary is filled out as a predictor does improve the model only slightly.
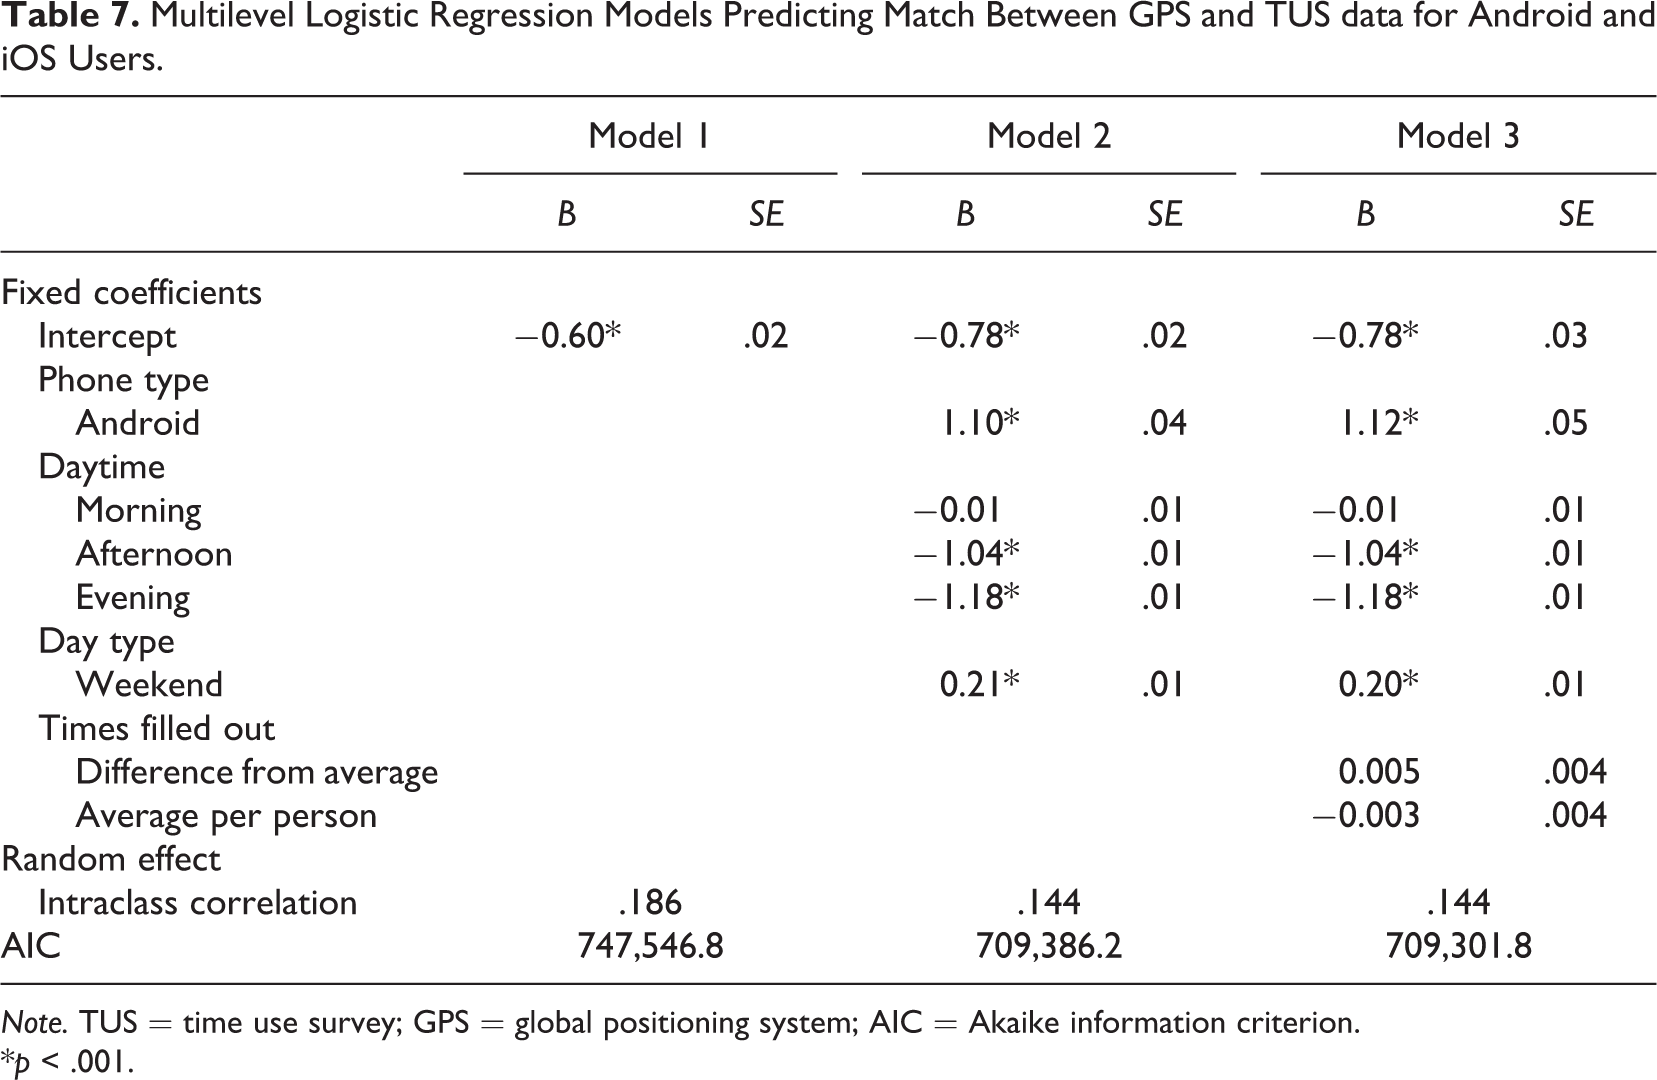
After running these three models for iOS and Android separately, we merged the data of both groups together. See Table 7 for the results of the multilevel models for both groups together. The first intercept-only model shows that the ICC is higher than in the separate models. This larger variance between persons is mostly explained by phone type, as can be observed in our second model; iOS users have fewer matches than Android users. When we add phone type as Level 2 predictor, the ICC decreases from 18.6% to 14.4%. The same effects of type and time of day are observed as in the models per device type; timeslots earlier in the day (night and morning) and in the weekends are more often classified correctly. Finally, we added the number of times the respondent filled out the diary that day as fixed Level 1 and Level 2 effect to our model. There is a negative effect, but like previous models, the small decrease in AIC indicates that adding the number of times the diary is filled out as predictor improves the model only slightly. Chi square tests revealed that for all data sets, Model 1 had a better model fit than the intercept-only model, and Model 2 had a better model fit compared to Model 1.
Multilevel Logistic Regression Models Predicting Match Between GPS and TUS data for Android and iOS Users.
Note. TUS = time use survey; GPS = global positioning system; AIC = Akaike information criterion.
*p < .001.
Discussion and Conclusion
In this article, we investigated whether the passive collection of location tracking data is sufficient to automatically establish functional locations in time use research. This study contributes to developing a methodological framework for integrating sensor and survey data, in particular with respect to large-sample time use research. We know little about how to effectively analyze and use mobile phone sensor data in large-sample studies. This study provides a step forward toward the integration of multiple data sources.
Our results show that by integrating time use and geographic location, we can to some extent derive functional locations automatically, at least for Android users. For iOS users, the results of the automated coding of functional locations were rather disappointing. An important limitation for automatically deriving functional locations in this TUS is that measurement errors occur in the location tracking for both phone types (Android and iOS). Therefore, in order to adequately record functional locations, active input from respondents is still needed.
The automatic coding of home location performs well for Android users, so it seems that we are reasonably successful in determining a person’s home location. The automatic coding of work and school does not perform well, but the automatic coding of these locations improves when we incorporate information from the respondent. Four days may not have been sufficient to improve our model; however, future research could investigate the effects of asking respondents for GPS locations of their main locations (home, work, and school) or collecting data for more days on automatic assignment. Zenk, Matthews, Kraft, and Jones (2018) recommend to measure location data for at least 14–28 days to measure respondent’s activity spaces. Or, alternatively, we need respondent information to better assign these locations.
Overall, measurement error in location tracking, also called positioning error, proved to be a major issue. Location trackers can suffer from positioning errors (Song & Lee, 2015), especially indoors. Even though we rounded our GPS data to 112 m, we still found small position changes at times when one would expect most respondents to remain stationary (e.g., at night and at work/school). An indication of measurement error in our data is the overrepresentation of the functional location category other, as this indicates that too many locations were not assigned to a home, work, or school location. This might be due to a larger variability in functional locations than anticipated. However, it is more likely due to measurement error in the location tracking. When positioning errors occur, the measured GPS coordinates for a specific timeslot are (slightly) incorrect. In that case, the GPS coordinates of that timeslot cannot be matched to the GPS coordinates of the home or work location of the respondent, and the timeslot is incorrectly assigned the functional location other. We advise future research to focus on detecting, eliminating, and correcting positioning errors to improve data accuracy. Some studies have recorded the precision of individual measurements and have used these in modeling the location data. This seems to be a promising way to deal with possible errors in future research.
The variability in matching success is mainly intrapersonal. Results of the multilevel model in which we predict for which timeslots we can automatically derive functional locations show that only 10–19% of the variance is between persons. Most of the variance is thus within persons, making it difficult to predict which time–location data is difficult to match. Our multilevel model shows that time of day is a particularly important predictor, which may indicate that matching success is related to complexity. The night and morning may be relatively easy to predict as these follow the same daily cyclical structure of sleeping, waking up, and going to work or school. Respondents may change locations relatively little, compared to the afternoon and evening. Respondents have more leisure time later during the day (Cloïn et al., 2013) and therefore more alternative options for locations, which complicates the automatic derivation of functional locations. This argument seems to speak against our finding that functional locations are easier to predict on weekends because weekends contain more leisure time. However, weekends are also characterized by less variation in activities, which may decrease overall complexity (Sonck & Fernee, 2013). A larger complexity in activities could also lead to an increase in survey fatigue and satisficing behavior (Krosnick, 1991). Satisficing respondents do not try to recall all that is relevant, but just enough to provide a reasonable answer, leading to a deterioration in time use data quality. Incorrect matches might thus also be partly due to incorrect time use reports. Future research could shed more light on the effect of complexity and on the validity of the various explanations of the large intrapersonal variance.
Phone type strongly affects the accuracy of geolocation measurement. This is demonstrated by the large differences in matching percentages between iOS and Android users and also by the large predictive value when we include this variable in our multilevel model. This phone type effect is likely due to the difference in location geotracking strategies of both platforms; Android phones record GPS coordinates every 10 min, whereas iOS phones record GPS coordinates when movement is detected. iOS phones may have suffered from a “cold/warm start” problem (Stopher, Fitzgerald, & Zhang, 2008): some amount of travel has already been completed before the first new positions are being recorded and stored. In that case, our app may have recorded the wrong geolocation and have failed to detect the exact stationary location. For future research, we advise to combine the two geotracking methods. Energy-wise, it is very inefficient (and also complicates data storage and analysis) to record geolocations constantly at a fixed rate, although an interval of 10 min between measurements should be reasonable. Additionally, when movement is detected, the frequency of recordings could be increased to capture trips in greater detail. More geolocations are necessary if exact routes need to be recorded at finer granularity. For researchers interested in mobility, iOS data may currently be more useful.
Many decisions were made to align the sensor data with the survey data. This may have affected our results. For example, rounding GPS data and choosing a GPS measurement per timeslot may affect whether or not we are able to derive functional locations correctly. Without rounding, or with rounding on more than three decimals, small positioning errors decrease the successful classification of home and work locations. But rounding may also have increased the number of in transit codes. Rounding to three decimal places created 112 m of precision, yet travel was assumed any time two data points were more than 100 m apart. If two locations are both slightly off, but one is rounded up and one is rounded down, it may incorrectly seem like the respondent is in transit. This may have increased the incorrect number of in transit codes. Alternatively, the travel distances could be calculated before rounding and before coding the home and work location. Another important decision we made was using only the first GPS measurement per timeslot if more measurements were available. Android users had only one measurement available and we wanted to treat the iOS users similarly, but one could also compute the center point or check all GPS locations when more are available. A finer granularity of location tracking may increase the correspondence between the two data sources. However, more frequent GPS locations would make it more difficult to match timeslot diary data to GPS-derived locations.
Unfortunately, we only had proxy information about respondents’ locations available. We could not let respondents validate our functional location codes, so we used information recorded in the TUS instead. Based on previous research (ONS, 2006) and common sense, we assigned the activity codes to one functional location, but these activities might occur at other locations as well. When we investigate the percentage of matching per activity, however, there are no activity categories that are assigned to another functional location category more often, supporting our assignment strategy. Furthermore, like every diary study, recall bias may occur and respondents may not actually have performed the activities they reported. When we correct for that, by allowing small inconsistencies, the accuracy only increases a little. Future research could ask respondents to validate their location or keep track of their locations. However, this is a very expensive and burdensome process especially in a large-sample study.
A last limitation of our study is the specific type of sample that was very willing to share GPS data (94.4%). This will probably not be the case in general population studies. This type of study may therefore be less feasible in random samples of the general population.
Finally, to answer our main research question, can we reliably automatically record functional locations by combining activity recordings with geotracking? Due to measurement errors in geotracking, this is possible only to some extent (notably places of residence can be established), and respondents’ self-reported information is still necessary to measure other functional locations. Future research could explore different methods of filtering positioning errors and recording GPS coordinates, and variations in recording frequency length, to investigate its effect on data quality. Location tracking data may be easier to process in the future and more reliable to use to better fulfill the potential to enrich smartphone survey data collection.
Supplemental Material
Supplemental Material, Elevelt_Online_Appendix_A - Where You at? Using GPS Locations in an Electronic Time Use Diary Study to Derive Functional Locations
Supplemental Material, Elevelt_Online_Appendix_A for Where You at? Using GPS Locations in an Electronic Time Use Diary Study to Derive Functional Locations by A. Elevelt, W. Bernasco, P. Lugtig, S. Ruiter and V. Toepoel in Social Science Computer Review
Footnotes
Data Availability
This article describes research with sensitive data including location tracking and self-reported time use. The data file with all the functional location codes assigned to the time use and location tracking is publicly available (see Online Supplementary Material in .zip file format).
The raw GPS location data cannot be shared online, as the respondents have been guaranteed anonymity, which would be jeopardized by making public data on their whereabouts and time use. The data have been collected under an arrangement that requires that the data remain in a secured research environment detached from the Internet, the Secure Analytics Laboratory at the Netherlands Institute for the Study of Crime and Law Enforcement (NSCR), and cannot be posted or deposited anywhere else. NSCR endorses open science and welcomes and encourages replication. Therefore, NSCR commits itself to making the raw (i.e., microlevel, individual) data available to anyone making an application. We declare that the applicant(s) will be made a temporary member of the research team and will be given on-site access to all data used for the research and all code (R Statistical Computing software). As the replications or extensions must be performed on-site in a secured research environment detached from the Internet, we will also provide a desk and sufficiently powerful computing resources in the SAL. NSCR cannot provide funding for travel and accommodation. All applicant(s) will be required to sign an agreement stating that they (1) will use the data only for scientific purposes, (2) will not make the data accessible to third parties, and (3) will not publish results that will disclose the identity of the subjects in the data. Data access requests should be sent to the NSCR Data Protection Officer at e-mail address:
Declaration of Conflicting Interests
The authors declared no potential conflicts of interest with respect to the research, authorship, and/or publication of this article.
Funding
The authors received no financial support for the research, authorship, and/or publication of this article.
Software Information
The statistical analysis for this article was conducted using R version 3.4.3. The R code used to analyze the data is available in Appendix B (see Online Supplementary Material in .R format).
Supplemental Material
Supplemental material for this article is available online.
References
Supplementary Material
Please find the following supplemental material available below.
For Open Access articles published under a Creative Commons License, all supplemental material carries the same license as the article it is associated with.
For non-Open Access articles published, all supplemental material carries a non-exclusive license, and permission requests for re-use of supplemental material or any part of supplemental material shall be sent directly to the copyright owner as specified in the copyright notice associated with the article.