
Abstract
While the choice of matrix versus item-by-item questions has received considerable attention in the literature, it is still unclear in what situation one is better than the other. Building upon the previous findings, this study expands this line of research by examining whether the difference between the two question types is moderated by the number of response options. Through a web survey experiment, this study compares matrix and item-by-item questions with 2, 3, 4, 5, 7, 9, and 11 response options. Additionally, we also investigate the impact of the device used to complete the survey on data quality. The results show that straight lining and response time are similar between the two question types across all response lengths, but item nonresponse tends to be higher for matrix than item-by-item question, especially among mobile respondents. Also measurement models reveal measurement equivalence between the two question types when there are fewer than seven response options. For matrices with 9 or 11 response options, analyses reveal substantial differences compared to item-by-item questions.
As more and more surveys are moving to online completion, be it by PC or mobile, survey researchers are striving to decrease the respondent burden without sacrificing data quality. One of the many important decisions in this sense is the use of grid questions. When asking multiple questions using the same set of response options, researchers often have two choices: either format them as item-by-item questions (asking them item by item) or group them into a matrix (also called grid) format and present them together. While the latter is more succinct, it can impact data quality (e.g., see Couper, Traugott, & Lamias, 2001).
In this context, survey researchers have to make informed decisions regarding which approach to use in different situations. Thus, they have to counterbalance the potential time savings and ease of application with the quality of the answers and the satisfaction of respondents. Additionally, they have to consider how other characteristics of the questions can influence this trade-off. For example, it would be expected that an increase in answer categories would lead to a considerable decrease in data quality, as the matrix becomes larger and harder to complete. As such, in addition to knowing which approach leads to better results, it is essential to know how characteristics of the questions, such as the number of categories or the device used, influence the trade-off between the use of grids and single-item questions.
This article aims to inform decision-making regarding the use of matrix or single items. This is done using an experimental design, where respondents used either single items or grids to answer questions regarding environmental protection and attitudes toward sports. In addition to the question type, we have manipulated the number of response categories using 2, 3, 4, 5, 7, 9, and 11 response points. This will help inform the degree to which the quality trade-off between matrix and single items is moderated by the number of categories. We will also investigate how this relationship is influenced by the device used by the respondents. This aspect was not randomized, and respondents could choose the device used to complete the survey, which is similar to most real-world applications.
In the next section, we will present the current literature regarding the use of matrix questions in surveys. This will be followed by a description of the data and the statistical methods. Next, the results of the analyses are presented. We finish the article with a discussion and recommendations.
Literature Review
The popularity of matrix questions in web surveys has led to a considerable amount of research. These studies have focused on comparing the measurement properties of matrix and item-by-item questions as well on different designs for matrix questions. Couper, Traugott, and Lamias (2001) were among the first to examine matrix questions through a survey experiment. They compared a matrix with item-by-item questions using a 5-point agree–disagree Likert-type scale. The matrix questions were presented on one single webpage, while each item-by-item question was presented on its own webpage (paging design). The result showed that the interitem correlation was higher for the matrix questions than for the item-by-item questions. The matrix question also took less time to complete than the item-by-item questions. In the same year, Iglesias, Birks, and Torgerson (2001) published a similar experiment where they compared matrix questions with item-by-item (paging design) questions using a 5-point frequency scale. Similar to the Couper et al.’s (2001) study, the internal reliability of the matrix question tended to be higher than item-by-item questions. However, the item nonresponse rate tended to be lower for item-by-item questions.
In a study conducted by Bell, Mangione, and Kahn (2001), the item-by-item questions were compared with a matrix question (3-point scale). Different from the previous studies, the completion time, reliability of the scale, and the substantive answers did not differ between the two question types. Tourangeau, Couper, and Conrad (2004) tested three question formats: one big matrix question with 8 items, two small matrices with 4 items each, and eight item-by-item questions on eight separate webpages. All questions used a 7-point scale. The reliability, as measured by Cronbach’s α, decreased and the completion time increased as the questions separated into smaller parts of the big matrix. On the other hand, straight lining, a type of item nondifferentiation, was more prevalent in the matrix answers.
Thorndike et al. (2009) compared the use of four matrices or separate item-by-item questions (using paging) to answer 83 questions. Different from the previous studies, this study also interviewed the same group of respondents a second time, with half of the respondents randomly assigned to the same question type as Time 1 and the other half were assigned to a different question type. The survey estimates were similar between the two question formats. Also, respondents preferred the item-by-item to matrix questions although the completion time was longer in the former. Callegaro, Shand-Lubbers, and Dennis (2009) compared five designs of rating scales: regular matrix, shaded matrix with coloring of alternate rows, single item per screen item-by-item question with horizontal response options, single item per screen item-by-item question with vertical response options, and single item per screen with vertical and alternate color for response options. All of the questions were asked using 5-point frequency scales. The completion time was longer for the item-by-item than the matrix questions. The internal reliability measures, including Cronbach’s α and Spearman’s correlation, did not differ significantly across question types.
Different designs of matrix questions have also been examined in several survey experiments. Toepoel, Das, and Soest (2009) experimentally manipulated the number of items (1, 4, 10, and 40) per webpage. For the conditions with 4, 10, and 40 items per page, the questions were presented either as a matrix or as item-by-item questions. All questions used 5-point agree/disagree response scales. A larger matrix was associated with more item nonresponse and shorter completion time, although the univariate distributions were similar across conditions. In addition, the survey design was rated by respondents as poorer when the matrix became larger. Another experiment compared the following: single item per webpage, three items per webpage, one matrix with six rows, and two matrices with three rows each on their own webpage (Grandmont, Graff, Goetzinger, & Dorbecker, 2010). All questions were presented using a 7-point agree/disagree scale. They found a higher dropout rate for the matrix than the item-by-item questions, higher respondent satisfaction for the three items per webpage, and similar completion time across different question types.
Design features like color and shading for matrix questions have also been investigated. One study reduced item nonresponse in a regular static matrix question by creating a dynamic matrix, where the rows were grayed out once they were answered (Galesic, Tourangeau, Couper, & Conrad, 2007). Another dynamic matrix where the row was highlighted when the mouse hovered over it was also tested, but it increased the item nonresponse, possibly due to distraction (Kaczmirek, 2011). A static shading of alternate rows of a matrix did not significantly reduce the item nonresponse compared to a nonshaded matrix (Kaczmirek, 2008). Another recent study examined the influence of dynamic feedback and visual clutter of matrix questions on data quality (Couper, Tourangeau, Conrad, & Zhang, 2013). Dynamically graying out the irrelevant rows and/or columns reduced item nonresponse. Similarly, the item nonresponse rate decreased when a large matrix was split into smaller ones. The visual clutter of the matrix as measured by the background colors and typefaces did not exert a significant impact on item nonresponse or completion time.
The Current Study
This study investigates the impact of question formatting, matrix versus item-by-item, on data quality. More exactly, we explore how this relationship is moderated by different scale lengths and the device used. These aspects have been generally ignored in previous research. However, the impact of question type, either matrix or item-by-item, may be moderated by the scale length and device.
More generally, some studies have examined the influence of scale length (for a review, see Krosnick & Presser, 2010) and device (for review, Couper et al., 2016) on survey response and data quality. When responding to a survey question, the respondents need to comprehend the scales and map their underlying attitudes on one of the options. The cognitive load required to complete this task can have an impact on the ease of responding and, hence, the quality of the data. Cognitive load is the amount of cognitive effort required by the working memory in order to solve a problem (Sweller, 1988), and it is often classified into three categories: the intrinsic, extraneous, or germane cognitive loads. The intrinsic cognitive load describes the inherent task difficulty for solving a problem, while the extraneous cognitive load is affected by how the problem is presented (Paas, Renkl, & Sweller, 2003; Sweller, Van Merrienboer, & Paas, 1998) (The germane cognitive load is not applicable in this scenario.). Although the fundamental task between a matrix and a item-by-item question is the same, the way that a matrix presents questions may make it more daunting than a item-by-item question. In other words, the intrinsic cognitive loads are likely to be similar between the two question formats, but the extraneous cognitive loads tend to be higher for matrix than item-by-item questions. The difference for questions with more response options is likely to be larger than questions with fewer response options. Thus, the disparity of survey responses and data quality between matrix and item-by-item questions increases as the number of response options increase.
The difficulty of the task can also be influenced by the device used as a smaller screen can hide part of the matrix or can reduce the size of the text and radio buttons. This study will also investigate whether the effect of the question format is moderated by the survey device and in particular mobile devices. Some studies have examined the matrix question among mobile respondents, and they show somewhat mixed results in completion time, item nonresponse, and response distribution (e.g., see Couper & Peterson, 2016; de Bruijne & Wijnant, 2013; Lattery, Bartolone, & Saunders, 2013; Peterson, Mechling, LaFrance, Swinehart, & Ham, 2013 Revilla, Toninelli, & Ochoa, 2016). Given the smaller screen size of mobile devices compared to computers, responding to a matrix question may require more scrolling (both horizontal and vertical, depending on the size of the matrix), zooming, and pinching than for a item-by-item question and hence can be more challenging. As the number of options increases for matrix questions, the difficulty of completing the survey using a mobile device will increase as well. Therefore, we expect significant differences in data quality between matrices and single-item questions when using more response categories and when answering using a mobile device.
Considering the findings reported in the literature, we formulated the following hypotheses for this study.
To the best of our knowledge, this is the first study that systematically examines the impact of question format (matrix vs. item-by-item) and scale length, and the interaction between these two factors in a full factorial survey experiment. Similarly, it is the first one to evaluate these relationships and the moderating effects of the devices used by respondents. We believe this study will have practical implications and provide guidance on how to design ordinal rating scales in surveys.
The Experiment and Method
Subjects
The survey experiment was conducted on the SurveyMonkey platform. The participants were the part of the SurveyMonkey Audience, a nonprobability online access panel (More information about the sample can be found at the sample provider’s website https://www.surveymonkey.com/mp/audience/our-survey-respondents/). The experiment was conducted between December 5 and 14, 2015. In total, 5,644 participants completed the survey. Given the nature of the sample, a response rate is not applicable. Among all the respondents, 74% were female, 68% above age 45 years, 24% made over US$100,000 last year, and 34% responded through mobile devices (smartphones and tablets combined). Detailed demographic information by experimental conditions can be found in Appendix Table A1.
Design of Experiment
This study used a 2 × 7 factorial design. The first factor was the question type either as a matrix question or item-by-item questions. The second factor was the number of the response options, which can be 2, 3, 4, 5, 7, 9, or 11 points. Respondents were randomly assigned to 1 of the 14 conditions. In each condition, the same 12 questions were asked. The first seven questions were about environmental protection, while the next five questions were about sports. Thus, in all the matrix conditions, there are two matrix questions with 7 and 5 items. Each matrix question was presented on its own webpage. The matrix questions were not reshaped based on the screen size. That means scrolling was required for smaller screen size in order to view the entire matrix. Also, on mobile devices, the matrix was not converted to item-by-item questions. They showed up as regular matrix. It is important to note that in May 2016, the SurveyMonkey platform made design change to the matrix questions, and they are now automatically converted to item-by-item questions for small screens. When this study was conducted, the change has not been made. For the corresponding item-by-item conditions, the set of seven questions was on one page and the set of five questions was on another page. We used scrolling rather than paging design for the item-by-item conditions because the literature reviewed above showed differences between these two design approaches. By using scrolling design for both matrix and item-by-item questions, we can eliminate its potential confounding effect. Verbal labels were used for all response options in the 2-, 3-, 4-, and 5-point scale conditions. For the 7-, 9-, and 11-point scale conditions, only the two end points were labeled verbally, while the other options used numeric labels only (Appendix Table A2). Response options for the item-by-item questions were displayed vertically. The use of full verbal labels for shorter scales, but end point labels for longer scale limit us from comparing across scale length and these two labeling techniques (Menold, Kaczmirek, Lenzner, & Neusar, 2014). However, the focus of this study is to compare item-by-item versus matrix with the same number of response options and labeling. All questions were optional and respondents could skip any of them.
Measures
In this study, we compared the two designs with regard to data quality. We examined the data quality using measures from the survey satisficing literature and by using multigroup analysis. Below, we describe the methods used.
Several measures were used to examine the survey response and data quality, most of which were drawn from the satisficing theory. Satisficing theory suggests that instead of giving an optimal answer, respondents stop the mental process as soon as they reach a suboptimal answer. Satisficing can occur on a continuum from little to no satisficing, weak satisficing, and strong satisficing. The three factors that foster satisficing are task difficulty, respondent ability, and respondent motivation. For item nonresponse, we sum up the total number of missing data under each experimental condition divided by the sample size for the condition and multiply by 100. Straight lining refers to the phenomenon that the same answer choice is selected for the entire multi-item scale regardless of the specific question content. In this study, the straight lining can have three values: 0 if respondents did not straight line for either scale, 1 if respondents straight lined on one scale, and 2 if respondents straight lined on both scales. In the analysis, we computed the average of the straight lining within each condition. The time to complete (response latency) is a third measure in the study. The server side time stamp paradata capture the time each respondent spent on the entire survey.
We also use multigroup confirmatory factor analysis (CFA) to investigate the differences between matrix and single-item questions for the different number of response categories. This approach uses both the correlations of the items and their means in order to calculate the measurement model. An important advantage of this method is the ability to pinpoint the impact of the question design on the measurement of the model. Thus, using multigroup analysis, we can investigate if there are any differences in the way the two dimensions are measured across the two designs and which coefficients are different. This is especially interesting here, as some of the coefficients estimated are interpretable as data quality indicators. For example, loadings can be considered estimates of validity, while random variances can be interpreted as random error or lack of reliability (Bollen, 1989). As a result, we would be able to judge which design has higher levels of validity and reliability.
In order to estimate these models, we will be using a generalized latent variable approach. More precisely, we will carry out both continuous and categorical CFA. The former is equivalent to the item response theory approach. The measurement model for the observed items of interest y can be defined as:
where ξ is the continuous latent variable that the multi-item scales are intended to measure, λ is the loading or slope for latent variable, τ is the intercept (or threshold for categorical observed variables, Millsap, 2012), and ∊ is the random error, where
The multigroup procedure typically goes through a sequential approach (Steenkamp & Baumgartner, 1998). It starts with a configural model, which estimates a model in which each group has the same structure (same relationships estimated) but allows for different coefficients. Thus, in this step, no equality constraints are applied. Next, metric equivalence is evaluated by restricting the loadings (λ) to be equal between matrix and item-by-item questions. The third step is to further restrict the intercept/threshold (τ) to be equal between the two question types known as scalar equivalence. The next steps follow a similar procedure and sequentially test the means, residuals, latent variable variance, and latent variable covariance.
Categorical CFA (item response theory) was used for conditions with less than five response options, and continuous CFA was used for conditions with five or more response options. The categorical CFA approach assumes an underling unobserved variable that is measured with approximation by the response categories used (Millsap, 2012). Instead of estimating intercepts (as in the continuous CFA model) to represent conditional means, this model estimates thresholds. Thus, for the questions with two-, three-, and four-response categories, we will be constraining thresholds in the scalar model. Additionally, for these experimental groups, we will not restrict the random variances. This is due to the use of Δ estimation for categorical CFA when using lavaan (Rosseel, 2012) in R package, Version 3.2.3.
In order to choose the best fitting model, we will use comparative fit index (CFI) and Akaike’s information criterion (AIC) (only for continuous CFA models). We consider differences of CFI (ΔCFI) larger than .01 (Chen, 2007) and a difference of AIC (ΔAIC) larger than 5 as signs of important differences between models.
Results
Missing Data
Overall, there was very little missing data in the experiment (Table 1). Nevertheless, for the most part, it is more prevalent for matrix questions than Item-by-item questions. When comparing the overall responses, matrix questions (column 2) produced more missing data than Item-by-item questions (column 1), but the difference is only significant for five-category (p = .02) and seven-category (p = .01) questions. For computer respondents, the pattern of missing data became somewhat mixed: Matrix questions produced more missing data for four-, five-, seven-, and nine-category questions, while for the other response option formats, the missing rates were higher for Item-by-item questions. However, none of the differences are significant. For mobile respondents, matrix questions consistently had higher missing data than item-by-item question, and the difference was significant for questions with three categories (p = .03), five categories (p = .01), and seven categories (p < .01).
Item Nonresponse for Item-by-item (MC) and Matrix Questions With Statistically Significant Differences by Group.
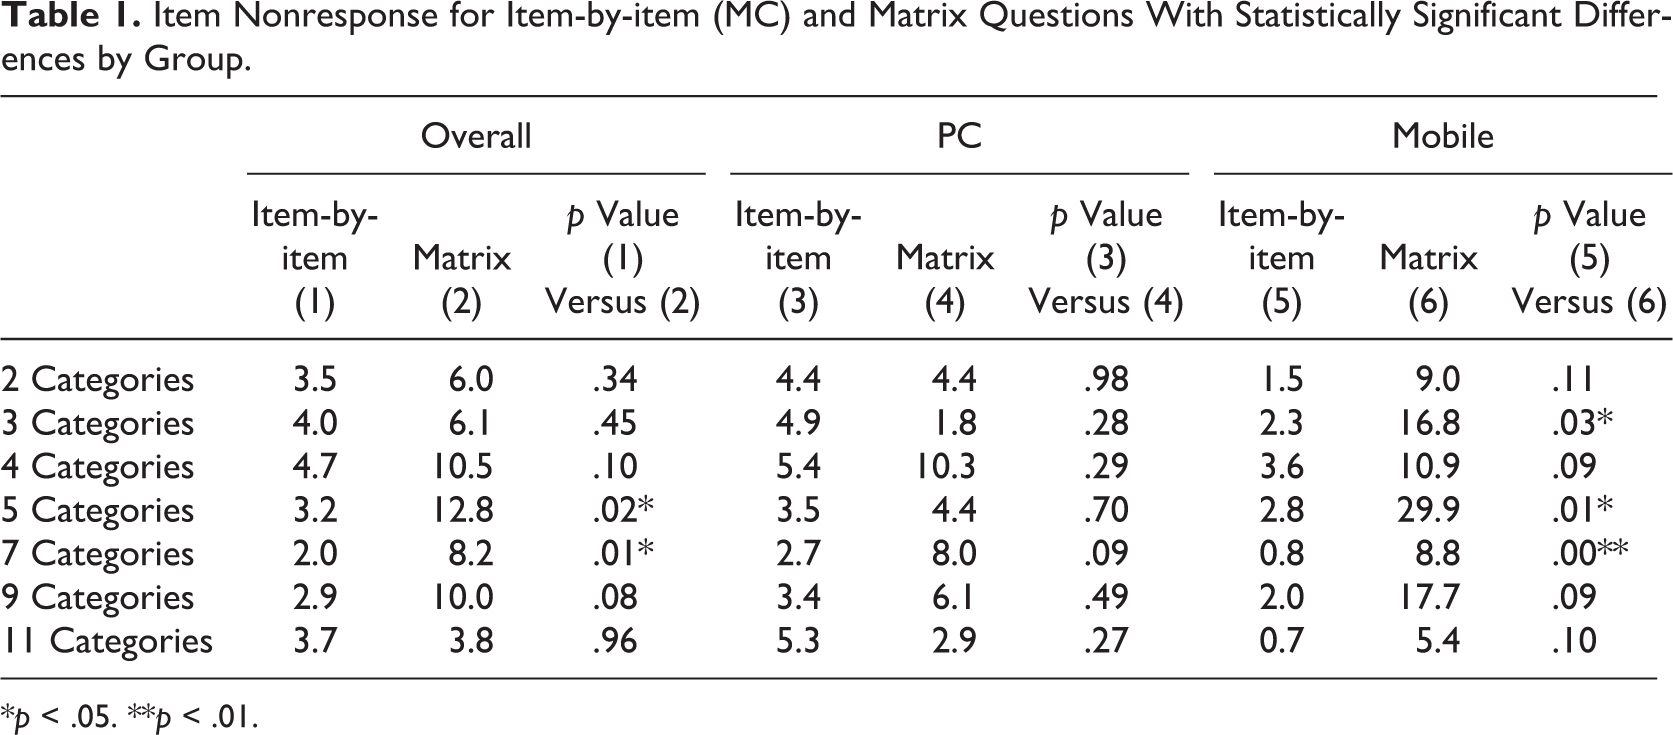
*p < .05. **p < .01.
Completion time
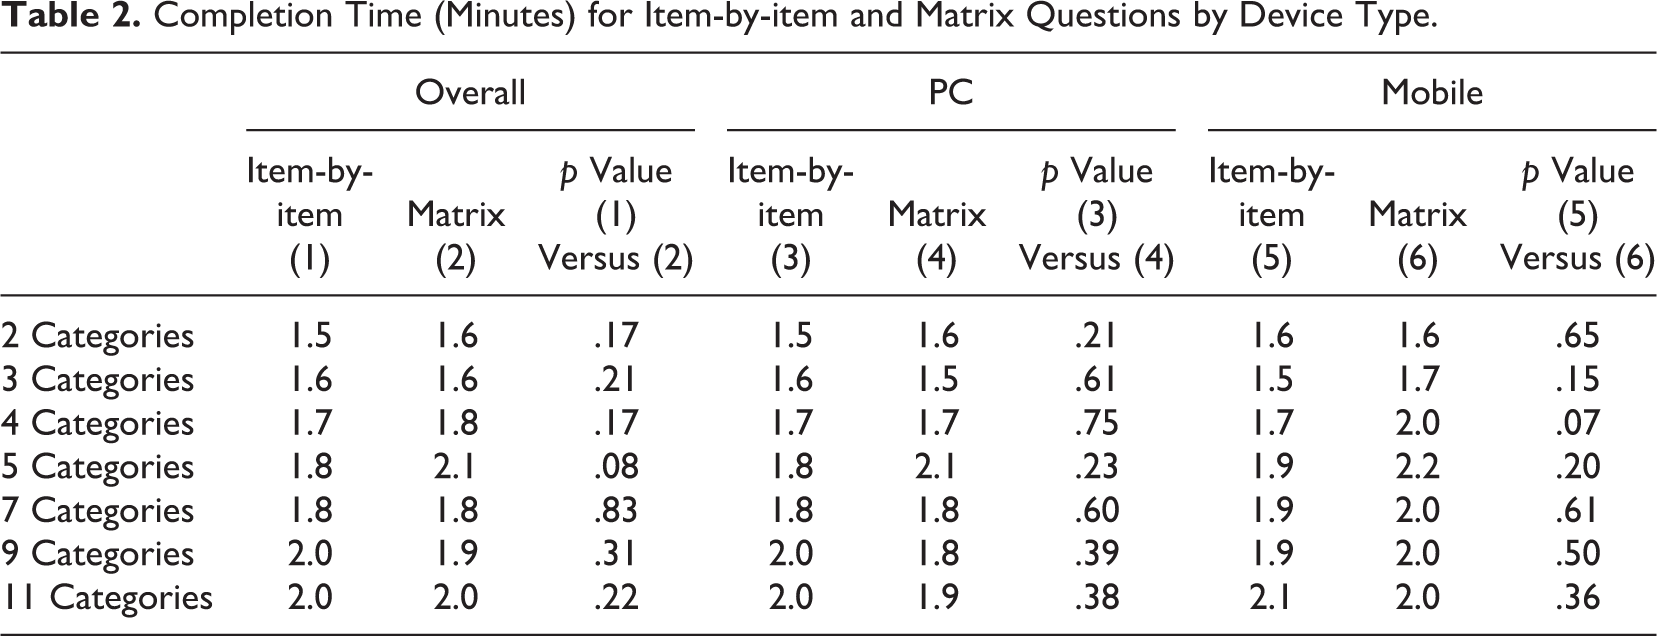
The amount of time respondents spent on the entire survey is another aspect analyzed in the study. Since the only difference between the experimental groups was the different ways of presenting the rating scales and most of the questions were part of the experiment, the overall response latency is mostly driven by the experimental conditions. As Table 2 shows, on average, respondents spent less than 2 min on the survey. When comparing all respondents, the response time was similar between matrix and Item-by-item questions. When examining respondents with different devices, similar patterns emerged. The time it took for respondents to complete the survey was similar regardless of the question type or the survey-taking device.
Completion Time (Minutes) for Item-by-item and Matrix Questions by Device Type.
Straight Lining
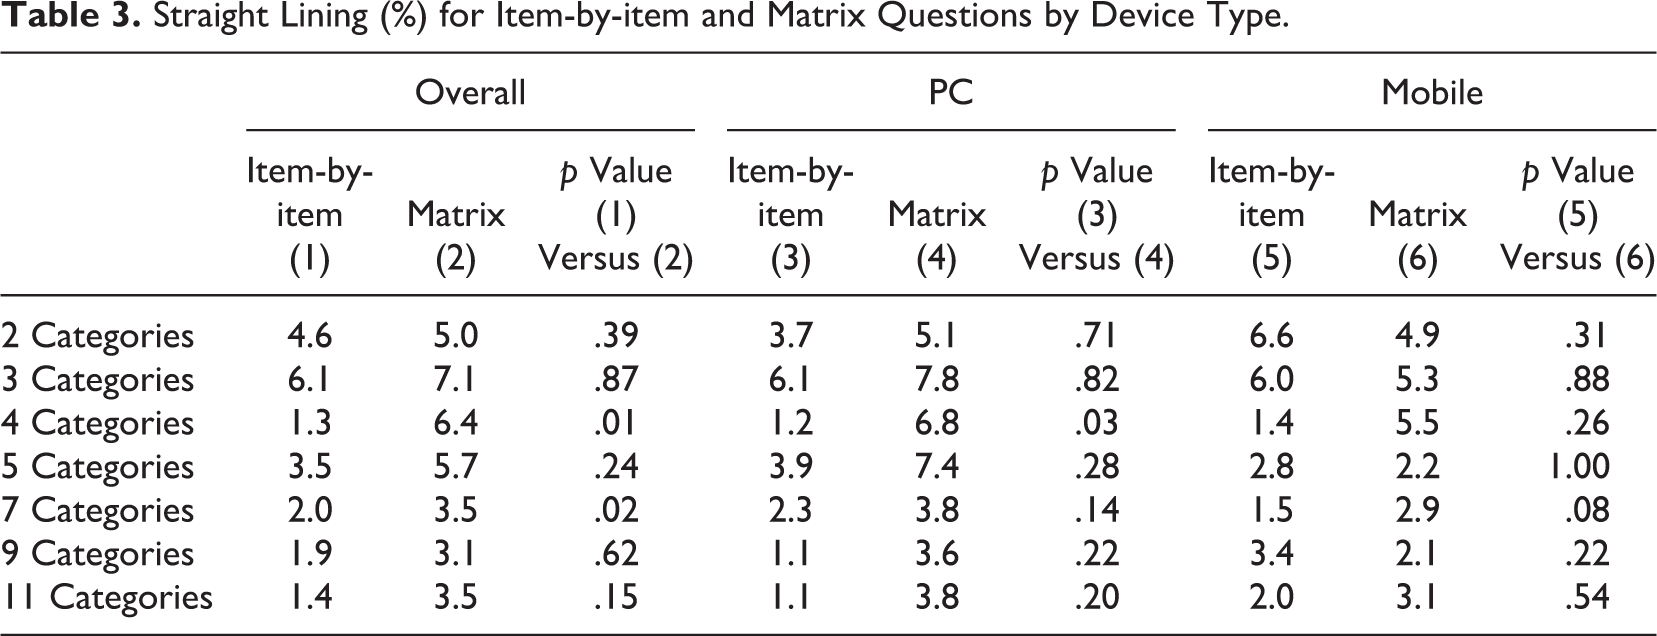
Straight lining was another data quality indicator analyzed in this study (Table 3). When all responses were combined, matrix questions had more straight lining than item-by-item questions. The differences for four categories (p < .01) and seven categories (p < .05) were statistically significant. Similarly, for PC respondents, the matrix questions also had more straight lining than item-by-item and the four categories (p < .05) was statistically significant. For mobile respondents, the pattern was more mixed, but none of the differences were significant.
Straight Lining (%) for Item-by-item and Matrix Questions by Device Type.
Multigroup Analysis
The multigroup analysis that follows is based on the measurement model that includes two latent variables. The first one represents attitudes toward the environment and is measured using the 7 items, while the other measures attitudes toward sports using five questions (all question wordings are presented in Appendix Table A2). The model also includes a correlation between the two latent variables. The model has a moderate fit. For example, in the experimental group that received the 5-point response categories, the fit is χ2 = 246.289 (df = 53), root mean square error of approximation (RMSEA) = .069, CFI = .865, and standardized root mean square residual (SRMR) = .055. This model will be the basis for the invariance testing.
The first part of Table 4 (Two Categories) presents the results for the multigroup analysis for the two-category questions using the categorical CFA approach. The measurement equivalence was tested in the order we described in the Method section. The configural model, which assumed the same structure for the measurement model between matrix and item-by-item questions, was used as a baseline. In this model, even though the structure is the same, the coefficients are free to vary between groups. The metric equivalence model restricted the loadings to be equal between the two question types. Table 4 indicates that this model is preferred to the configural model as the change of CFI is very small (less than .01). In other words, restricting the loadings across groups did not significantly worsen the model fit.
Multigroup Categorical Confirmatory Factor Analysis (Item Response Theory) for Matrix Versus Single Items by Number of Categories.
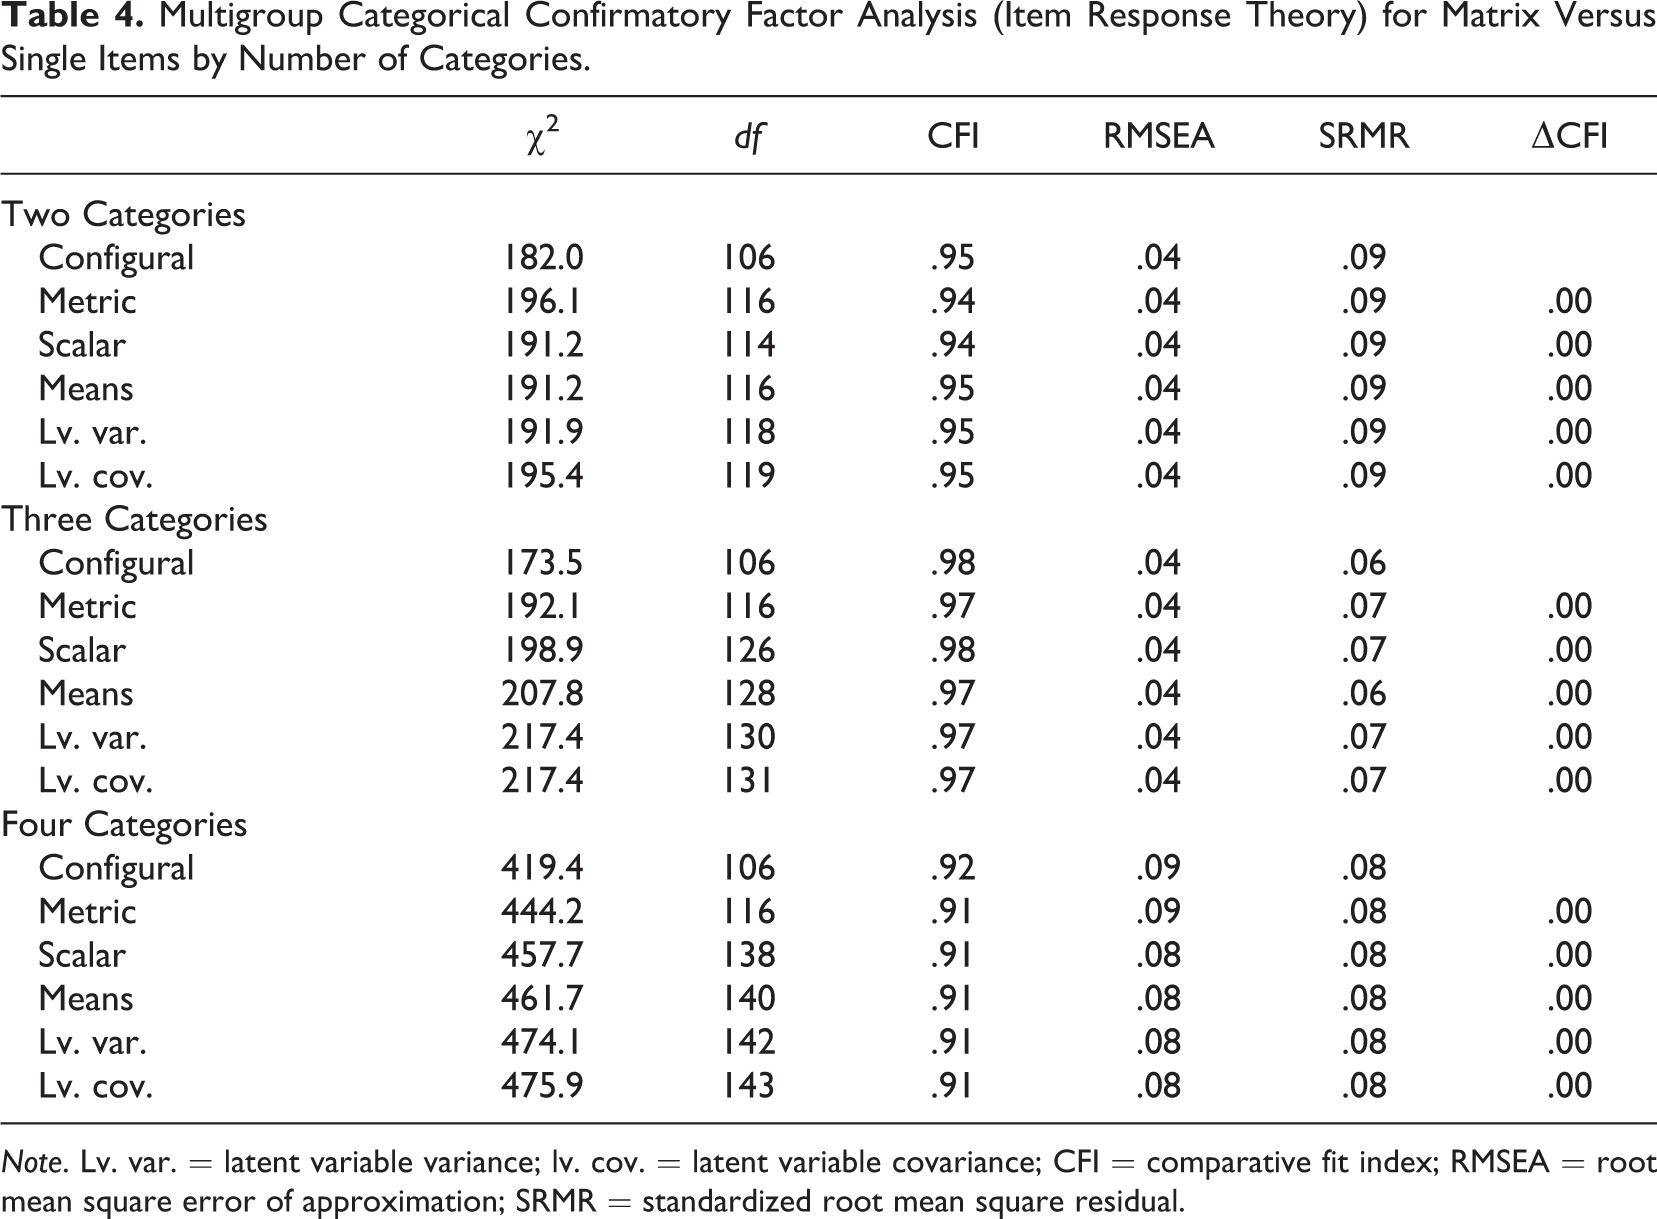
Note. Lv. var. = latent variable variance; lv. cov. = latent variable covariance; CFI = comparative fit index; RMSEA = root mean square error of approximation; SRMR = standardized root mean square residual.
The next model to be tested imposed scalar equivalence. This adds an equality constraint on the threshold—the conditional mean of the observed items. The small ΔCFI suggests that this model is not significantly worse, meaning that there are no significant differences across groups. The next two steps were to constrain the latent variable means and variance to be equal. Both constraints brought very little change to the CFI. As a result, we can say that the latent variables were the same across the two designs. Similarly, the covariance between latent variables were subsequently constrained to be equal, and the model fit did not worsen the model substantially, suggesting that the latent variables measured by matrix and item-by-item questions were the same. In this case, the question type does not have a significant impact on the measurement of the model for a two-category agree/disagree scale.
Table 4 also presents the same results for questions with three categories and four categories, respectively. The analyses were conducted in the same fashion as the two-category analysis. Again, a ΔCFI smaller than .01 indicates that the more constrained (parsimonious) model was not significantly worse than the less constrained model, hence, the constrained one is preferable. As both sections of the table show, the ΔCFI is very small for each step when equality constraints are imposed on the data, suggesting that the matrix and item-by-item questions measure the latent variables for questions with three categories and for questions with four categories in the same way.
We next move to the continuous CFI approach for the rest of the experimental groups (see Table 5). For the five-category comparison, the small changes in ΔCFI and ΔAIC for the metric, scalar, and means equality tests suggested that the loadings, intercepts, and latent means were the same for the matrix and item-by-item questions. The residuals of the latent variables, however, were different for the two question types. A closer look at the results (see Appendix Table A3) shows that the single-item questions had consistently smaller residual variance than the matrix questions. This indicates that the quality is higher in the former, as people are more consistent, leading to less random variance.
Multigroup Confirmatory Factor Analysis for Matrix Versus Single Items by Number of Categories.
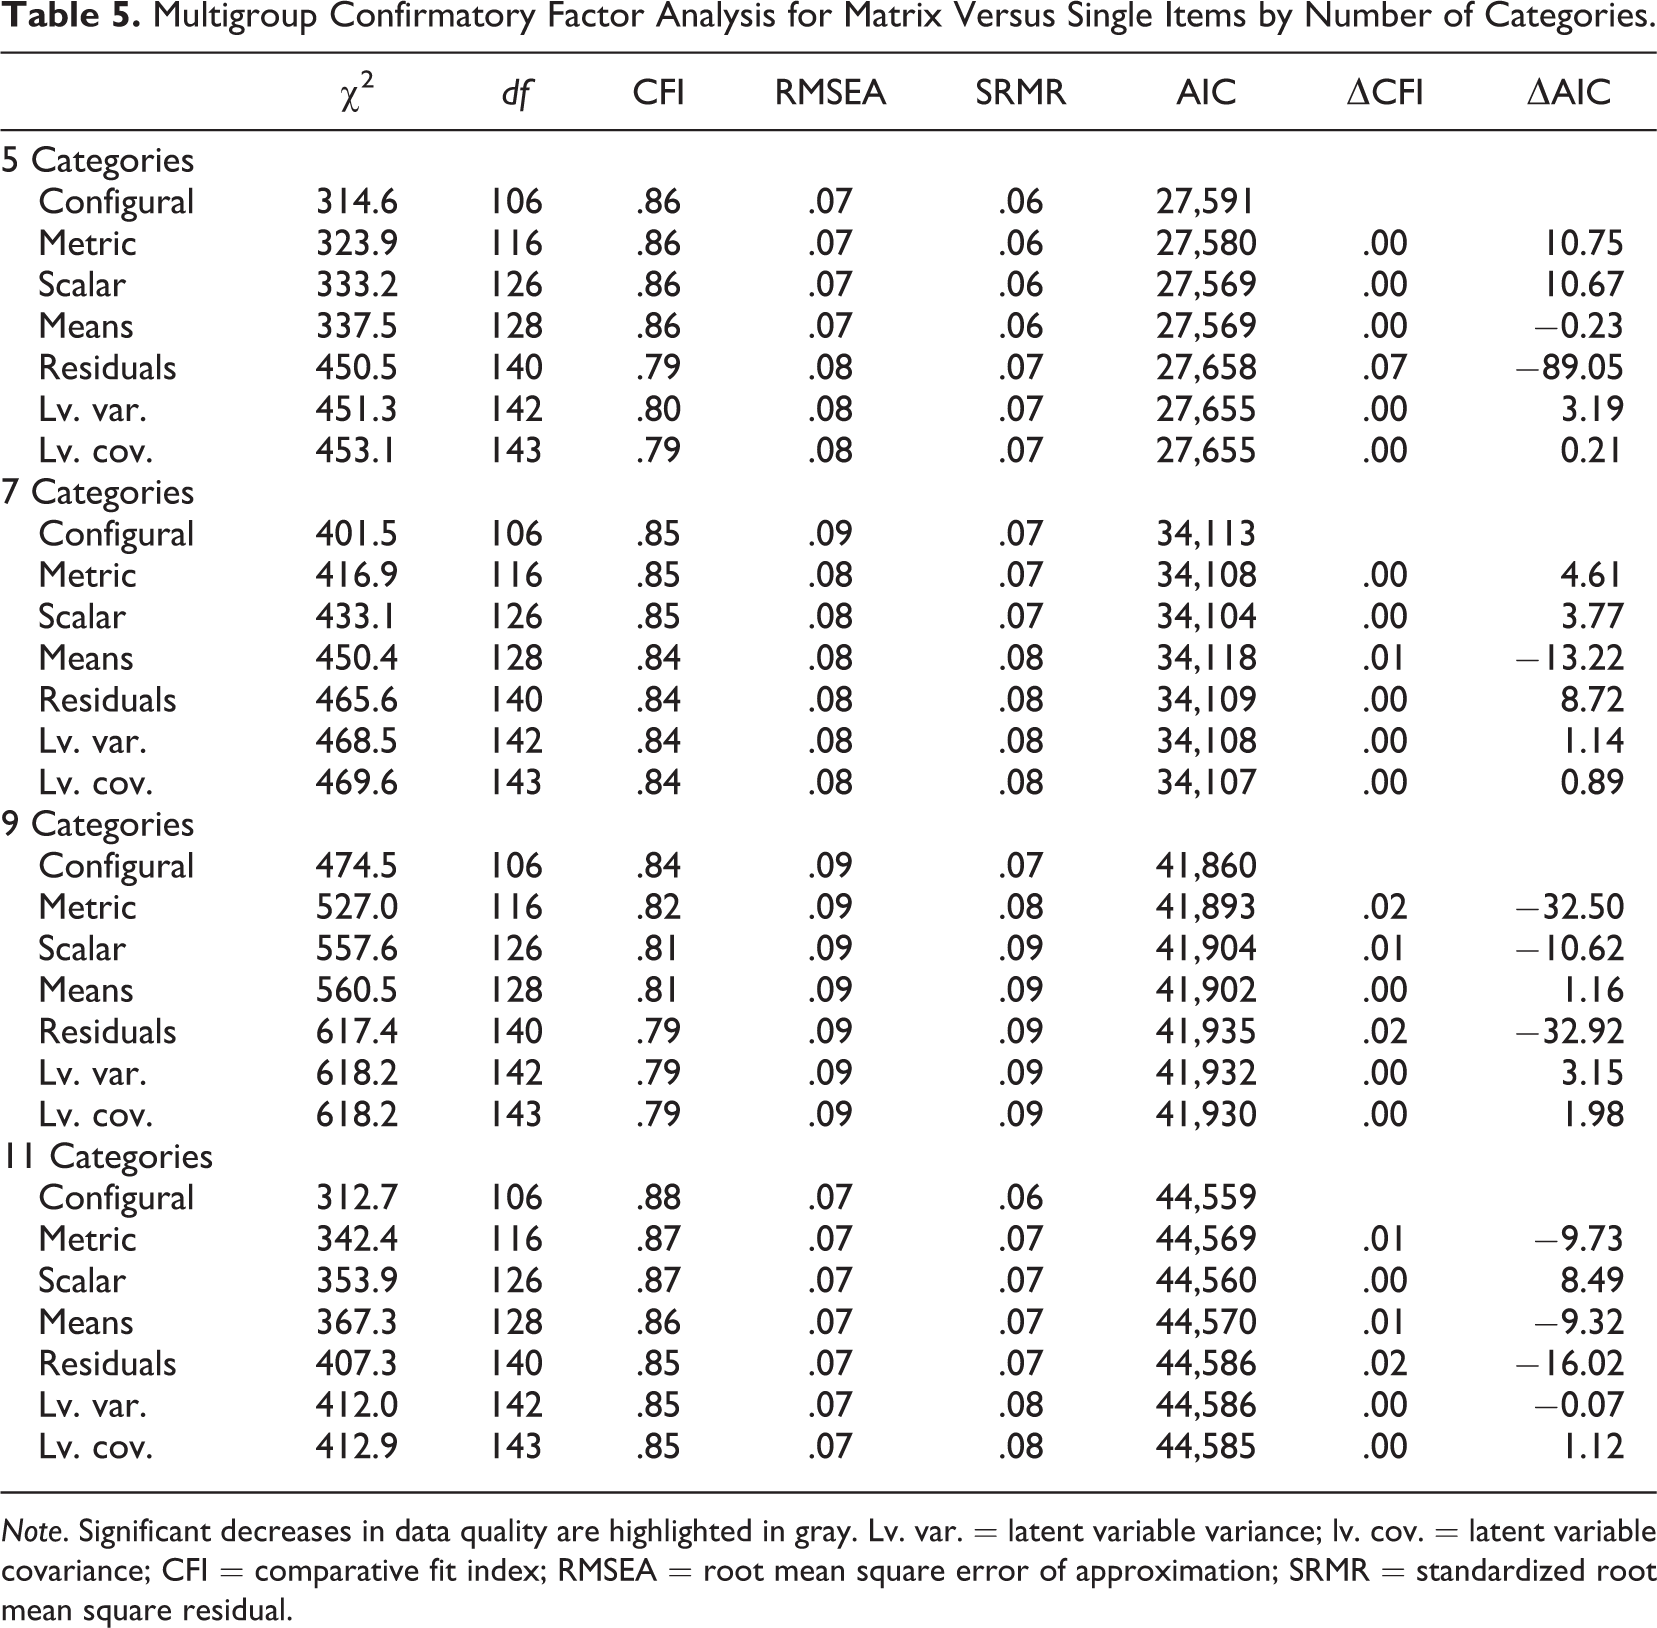
Note. Significant decreases in data quality are highlighted in gray. Lv. var. = latent variable variance; lv. cov. = latent variable covariance; CFI = comparative fit index; RMSEA = root mean square error of approximation; SRMR = standardized root mean square residual.
The seven-category scales were examined next and the loadings, intercepts, latent means and residuals, and latent variable variance and covariance were all the same between matrix and item-by-item questions.
The longest response options tested in the experiment were 9 and 11 categories. For both the 9- and 11-category questions, the metric equivalent was not supported by the data, meaning that the loadings and residual variances for matrix and item-by-item questions were significantly different from each other. This suggests that the latent variables measured by the two question formats were not the same when a long scale was used. Regarding the validity, the causes of the differences show mixed results, as no approach shows consistently higher loadings. On the other hand, the single-item design shows consistently lower random error (lower residual variance) compared to the matrix approach both for the 9- and 11-category questions (see Appendix Table A3).
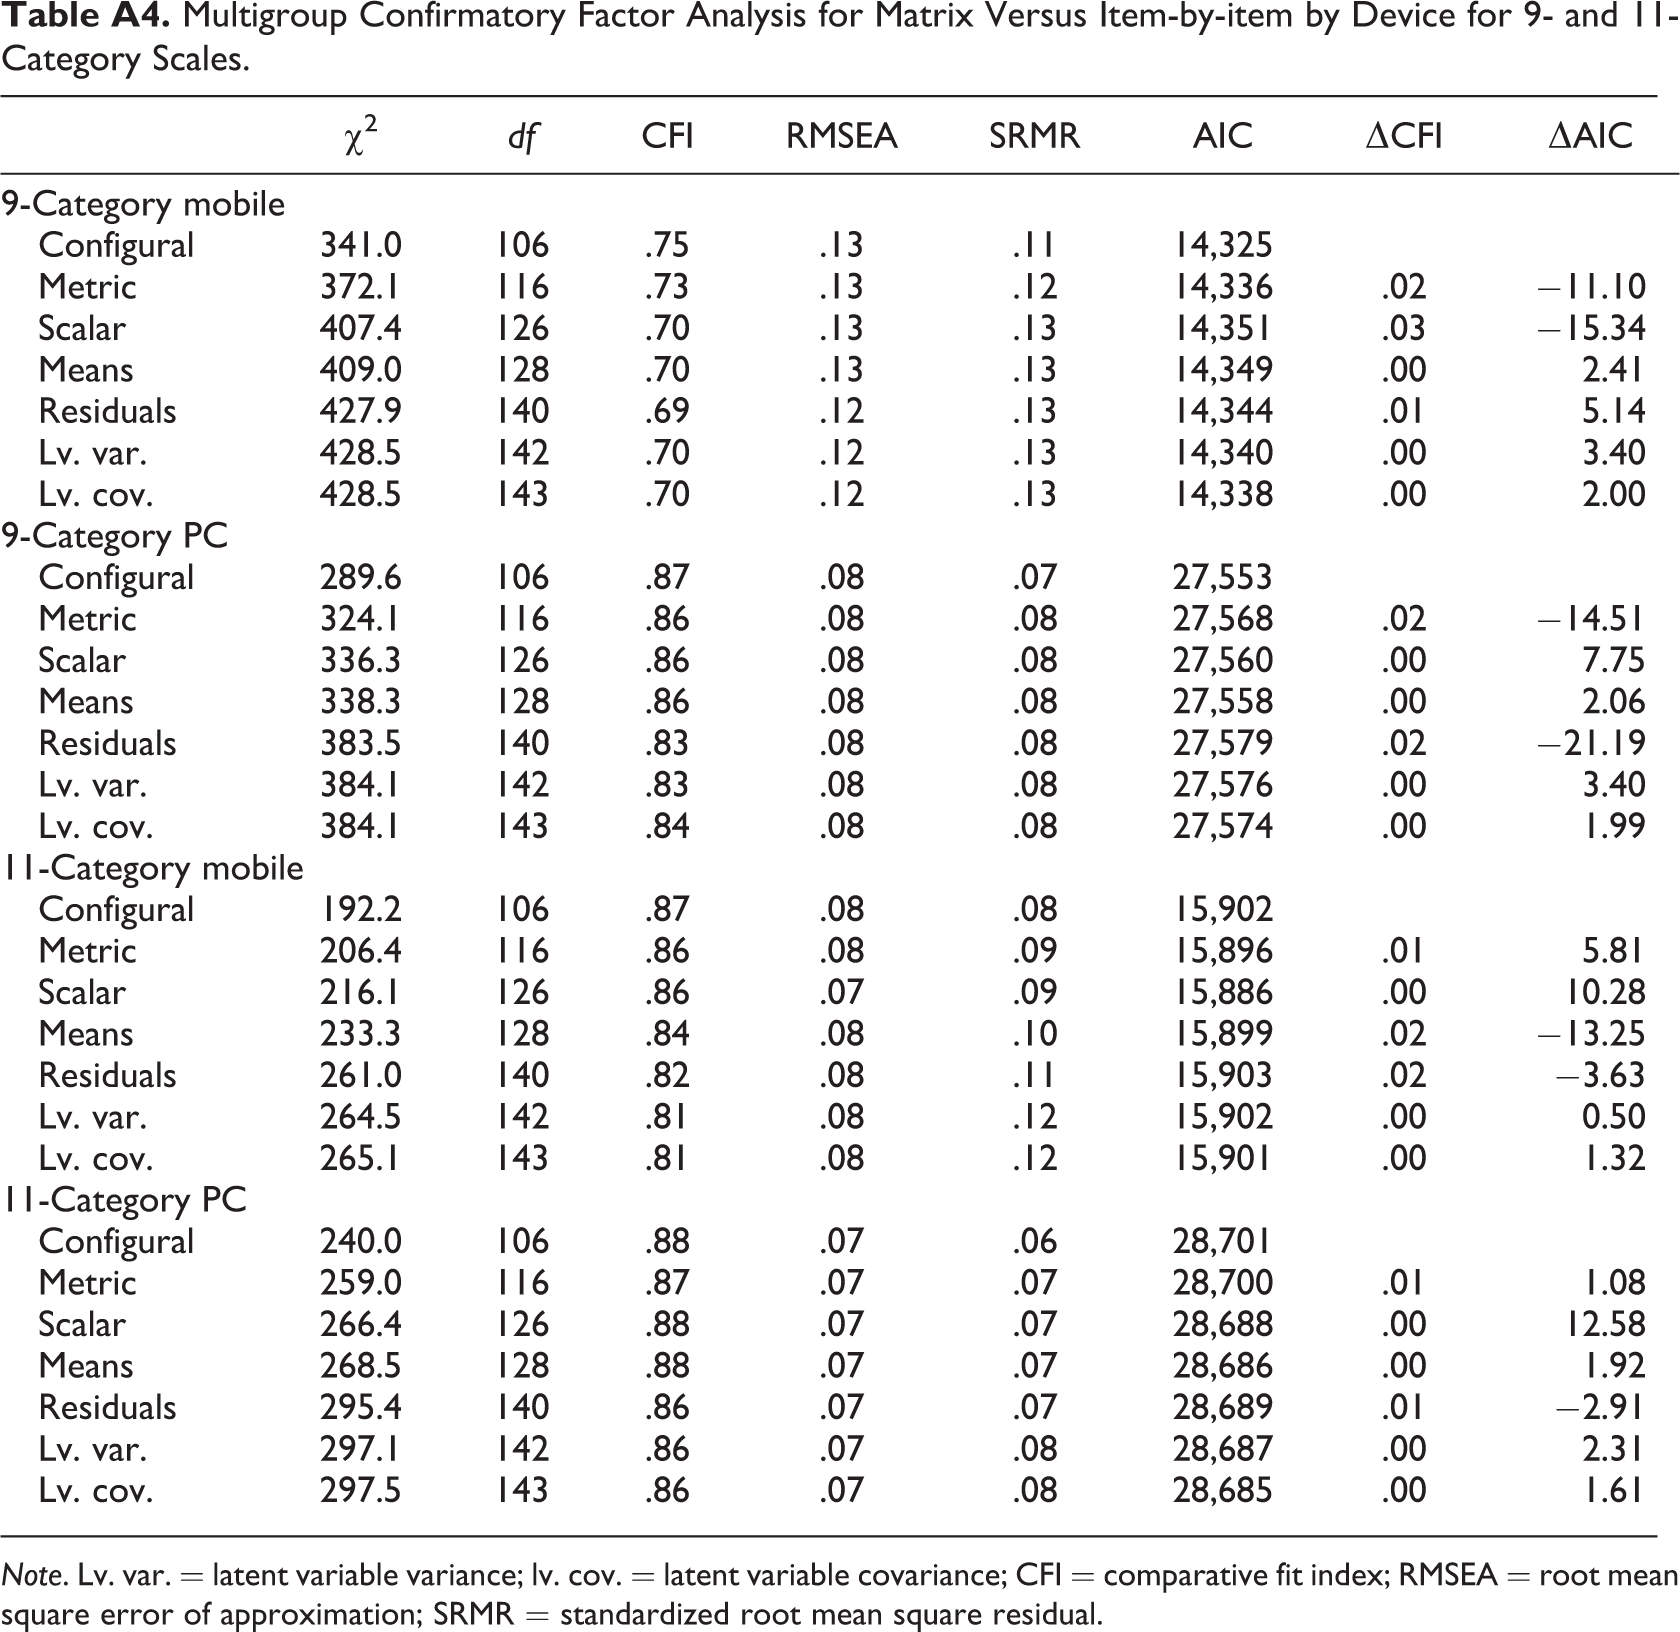
We can also investigate the differences in the 9- and 11-point scales in more detail by device. As mentioned earlier, we expect larger differences between the two designs when completing the survey by mobile than by PC. Appendix Table A4 shows the differences between the two designs when using 9 points separately for mobile and PC. We see that in the case of mobile respondents, both the loadings and the intercepts are significantly different (both metric and scalar models are significantly different). This means that differences in both variation (amount random error) and validity (shift in the mean) are present when we use the 9-point scale in the two designs. Significant differences are also present when the respondents used a PC, but this time the difference is only in random error (significant differences for the metric and residual models). One possible explanation could be that in addition to the extra random error introduced with the use of a matrix with a 9-point response scale, there is a mean shift when completing the survey using mobile devices. This could be because part of the response scale does not appear on the screen for small devices. This receives partial support through the fact that for 10 of the 12 items, the intercepts were higher (more values to the right of the screen) for the item-by-item design when completing the survey using a mobile device.
When we investigate the impact of the design by device for the 11-point scale (Appendix Table A4), we find a slightly different result. We see that for the PC respondents, now there are no significant differences between the matrix and item-by-item design. On the other hand, there is a significant difference in the mean of the latent variables for the mobile devices. Once again, a possible explanation could be the obstruction of the screen for small mobile devices. This seems to lead to an average shift for all the questions in the grid. The results support this hypothesis, as the means for both latent variables are higher (more values to the right of the screen) in the item-by-item design compared to the single choice.
Discussion
This study set out to experimentally test whether the size of matrix questions affects the data quality and survey responses. Specifically, the experiment tested using matrices with 2, 3, 4, 5, 7, 9, and 11 response options and compared them to item-by-item questions. In general, we reached the following conclusions. First, matrix questions yielded more item nonresponse than item-by-item questions in general and especially for questions with five, seven, or nine categories. Additionally, this difference is higher when the survey is completed on a mobile device. Second, the time it took to complete the entire survey was similar between matrix and item-by-item questions for both mobile and nonmobile respondents. Couper and Peterson (2016) found that the additional scrolling behavior for matrix questions contributes to the longer response time for mobile respondents. The lack of significant time difference in this study between matrix and item-by-item question types is probably because the survey was fairly short with only two matrix questions. A longer survey with more matrix questions could show a different pattern. Third, straight lining was more prevalent for matrix than item-by-item questions, although for the most part, the differences were relatively small and not significant.
Fourth, the multigroup comparison showed that for questions with two, three, four, and seven categories, the latent variables measured by matrix and item-by-item questions were similar. For 5-, 9-, and 11-category questions, however, the two question types show a significant difference in terms of the latent variables that the scales were designed to measure. We have consistently found that the matrix design has lower reliability (more random variance) than the single items. For the questions with 9 and 11 response categories, we have also found a mean shift in responses for mobile respondents. These are in the expected direction, with more responses to the left of the screen for the matrix design.
The results of this experiment can guide researchers and practitioners in making design choices for matrix versus item-by-item questions. Considering the results from both the data quality indicators (item nonresponse, time to complete, and straight lining) and the multigroup comparison, we conclude that for scales with seven or less categories, matrix and item-by-item questions should produce similar survey results. For questions with nine or more response options, item-by-item questions are better than matrix questions.
This study has several unanswered questions for future research to address. First, the devices (mobile vs. nonmobile) were self-selected rather than randomly assigned, which prevented us from drawing solid conclusions on how the survey device interacts with question types. Second, online panel members may be different from the general population in that panelists tend to have more survey experience than nonpanelists. More experienced respondents may be more capable of handling all types of questions, even those that are more difficult to navigate, like matrix questions. Another population with less experience participating in surveys may show a different pattern. Future studies should replicate this experiment with a different population and potentially incorporating survey experience as a predictor. Third, other web survey paradata, such as screen size, pitching and zooming, and number of clicks, are also factors that can affect the responses. We encourage future research to capture and explore the impact of other factors. Fourth, the survey was very short which may limit the results from generalize to other longer surveys. This should be addressed in future research.
Regardless of the limitations, this study is the first one testing the different sizes of matrix questions in a factorial web survey experiment. The findings suggest that as the number of columns increases, the data quality for the matrix questions deteriorates. This is especially true when using a large number of categories (9 and 11). Considering the results in the larger context of studies on the topic, it suggests that the design of a matrix, rather than the matrix itself, is important for ensuring data quality. We hope that future studies can explore other factors, such as different number of rows and columns, to improve the matrix design and hence the data quality.
Footnotes
Authors’ Note
The conclusions and any errors are of course solely the responsibility of the authors.
Acknowledgments
We thank SurveyMonkey for conducting data collection for this study and the editor and the two anonymous reviewers for their helpful comments. The authors are grateful to the support offered by the Economic and Social Research Council through the grant for the National Centre for Research Methods.
Declaration of Conflicting Interests
The author(s) declared no potential conflicts of interest with respect to the research, authorship, and/or publication of this article.
Funding
The author(s) disclosed receipt of the following financial support for the research, authorship, and/or publication of this article: This work is supported by the Economic and Social Research Council through the grant for the National Centre for Research Methods (grant number RES-576-47-5001-01).
Appendix
Multigroup Confirmatory Factor Analysis for Matrix Versus Item-by-item by Device for 9- and 11-Category Scales.
| χ2 | df | CFI | RMSEA | SRMR | AIC | ΔCFI | ΔAIC | |
|---|---|---|---|---|---|---|---|---|
| 9-Category mobile | ||||||||
| Configural | 341.0 | 106 | .75 | .13 | .11 | 14,325 | ||
| Metric | 372.1 | 116 | .73 | .13 | .12 | 14,336 | .02 | −11.10 |
| Scalar | 407.4 | 126 | .70 | .13 | .13 | 14,351 | .03 | −15.34 |
| Means | 409.0 | 128 | .70 | .13 | .13 | 14,349 | .00 | 2.41 |
| Residuals | 427.9 | 140 | .69 | .12 | .13 | 14,344 | .01 | 5.14 |
| Lv. var. | 428.5 | 142 | .70 | .12 | .13 | 14,340 | .00 | 3.40 |
| Lv. cov. | 428.5 | 143 | .70 | .12 | .13 | 14,338 | .00 | 2.00 |
| 9-Category PC | ||||||||
| Configural | 289.6 | 106 | .87 | .08 | .07 | 27,553 | ||
| Metric | 324.1 | 116 | .86 | .08 | .08 | 27,568 | .02 | −14.51 |
| Scalar | 336.3 | 126 | .86 | .08 | .08 | 27,560 | .00 | 7.75 |
| Means | 338.3 | 128 | .86 | .08 | .08 | 27,558 | .00 | 2.06 |
| Residuals | 383.5 | 140 | .83 | .08 | .08 | 27,579 | .02 | −21.19 |
| Lv. var. | 384.1 | 142 | .83 | .08 | .08 | 27,576 | .00 | 3.40 |
| Lv. cov. | 384.1 | 143 | .84 | .08 | .08 | 27,574 | .00 | 1.99 |
| 11-Category mobile | ||||||||
| Configural | 192.2 | 106 | .87 | .08 | .08 | 15,902 | ||
| Metric | 206.4 | 116 | .86 | .08 | .09 | 15,896 | .01 | 5.81 |
| Scalar | 216.1 | 126 | .86 | .07 | .09 | 15,886 | .00 | 10.28 |
| Means | 233.3 | 128 | .84 | .08 | .10 | 15,899 | .02 | −13.25 |
| Residuals | 261.0 | 140 | .82 | .08 | .11 | 15,903 | .02 | −3.63 |
| Lv. var. | 264.5 | 142 | .81 | .08 | .12 | 15,902 | .00 | 0.50 |
| Lv. cov. | 265.1 | 143 | .81 | .08 | .12 | 15,901 | .00 | 1.32 |
| 11-Category PC | ||||||||
| Configural | 240.0 | 106 | .88 | .07 | .06 | 28,701 | ||
| Metric | 259.0 | 116 | .87 | .07 | .07 | 28,700 | .01 | 1.08 |
| Scalar | 266.4 | 126 | .88 | .07 | .07 | 28,688 | .00 | 12.58 |
| Means | 268.5 | 128 | .88 | .07 | .07 | 28,686 | .00 | 1.92 |
| Residuals | 295.4 | 140 | .86 | .07 | .07 | 28,689 | .01 | −2.91 |
| Lv. var. | 297.1 | 142 | .86 | .07 | .08 | 28,687 | .00 | 2.31 |
| Lv. cov. | 297.5 | 143 | .86 | .07 | .08 | 28,685 | .00 | 1.61 |
Note. Lv. var. = latent variable variance; lv. cov. = latent variable covariance; CFI = comparative fit index; RMSEA = root mean square error of approximation; SRMR = standardized root mean square residual.