
Abstract
Interview duration is an important variable in web surveys because it is a direct measure of the response burden. In this article, we analyze the effects of the survey design, respondent characteristics, and the interaction between these effects on interview duration. For that purpose, we applied multilevel analysis to a data set of 21 web surveys on political attitudes and behavior. Our results showed that factors on both levels, the individual and the survey level, had effects on interview duration. However, the larger share of the variation in interview duration is explained by the characteristics of the respondents. In this respect, we illustrate the impact of mobile devices and panel recruitment on interview duration. In addition, we found important relationships between the respondents’ attitudes and how a web survey is designed: Highly motivated respondents spent significantly more time answering cognitively demanding questions than less motivated respondents. When planning a survey, not only the number and formats of questions need to be taken into account but also the expected sample composition and how the participants will respond to the design of the web survey.
Introduction
Interview duration is an important variable in survey design (Loosveldt & Beullens, 2013). It is a direct measure of the response burden on the respondents. On average, the longer a survey takes to complete, the higher is the burden on the respondents. Methodological research shows that the expected and actual burden of survey participation influence the initial decision to participate, the subsequent decisions to continue participating, and the multiple decisions related to answering web survey questions (Dillman, 2007; Peytchev, 2009). For example, previous research has shown that the longer the stated interview length in an invitation e-mail or on an introductory page of a web survey, the fewer respondents start a questionnaire (Crawford, Couper, & Lamias, 2001; Galesic & Bosnjak, 2009). The perceived length of a questionnaire further affects subsequent decisions to continue participating in a survey. For instance, slow progress of a progress indicator was shown to increase the risk of survey breakoff in web surveys (Peytchev, 2009; Villar, Callegaro, & Yang, 2013). Finally, respondent fatigue might be of more concern in longer questionnaires. This also is important, since fatigue increases the chances that respondents will use satisficing response strategies, which ultimately will result in lower data quality (Krosnick, 1991, 1999). These findings are particularly important in light of increasing difficulties to gain cooperation. As Couper (2013) recently pointed out, an increasing disconnect is occurring between survey requests and what people may be willing to provide. Thus, reducing survey length and burden to match the lifestyles of potential participants are important goals of survey design.
However, researchers designing web surveys are often uncertain about the actual length of their questionnaire because the number of items is a rather imprecise measurement for the response burden and the interview duration. In addition, respondents likely vary in their ability to answer survey questions, which makes predictions of the interview duration even more difficult. According to our experience, reliance on personal assessment and rules of thumb often results in a severe underestimation of the respondents’ burden. Thus, we would strongly benefit from knowing the factors in advance that affect the actual duration of a web survey. In recent years, some research has been carried out on the determinants of response latencies (Couper & Kreuter, 2013; Yan & Tourangeau, 2008) and interview duration (Loosveldt & Beullens, 2013). The studies by Couper and Kreuter (2013) and Yan and Tourangeau (2008) investigate the factors that explain item-level response times, whereas Loosveldt and Beullens (2013) shift the focus to the effects of item, respondent, and interviewer characteristics on the overall interview duration in a cross-national comparison. While these studies provide valuable insights into the factors that explain response times, their empirical findings are based on a single (Couper & Kreuter, 2013; Loosveldt & Beullens, 2013) or a limited number of surveys (Yan & Tourangeau, 2008). In addition, the studies by Couper and Kreuter (2013) and Yan and Tourangeau (2008) illustrate the important fact that the factors explaining response times might interact across different conceptual levels. However, the authors do not specify the direction of the cross-level interactions they found (Yan & Tourangeau, 2008) or they do not find noteworthy effects (Couper & Kreuter, 2013). Therefore, the aim of this article is to empirically investigate the factors influencing interview duration and the cross-level interactions among them based on a large database of 21 web surveys. An enhanced knowledge of these factors and their interplay allows us to make informed design decisions that may help to reduce the burden on respondents and further improve the quality of web surveys.
In the next section, we provide an overview of the research on interview duration. As we will show, the findings from this research can be fitted into a multilevel explanation model of interview duration. The following sections present the data, the operationalization of the dependent and independent variables, and the method used in the empirical analysis. Finally, we present our findings and close with a discussion and outlook for further research.
Explaining Interview Duration
Several factors on two different conceptual levels contribute to the interview duration in web surveys. 1 The first level is the survey level. Although the focus of our article is on the overall interview duration, we needed to derive several hypotheses from research on item-level response times due to a lack of theoretical reasoning and empirical evidence on factors of the survey level that affect interview duration. For these cases, we assumed that the theoretical mechanisms for the item level also hold true for the survey level.
The overall number of questions in a survey is a strong although not perfect predictor of interview duration. However, other characteristics of the survey and questionnaire influence the interview duration as well. Web surveys can differ to the extent to which they make use of audio files, pictures, and videos. The use of media increases files sizes and, as a consequence, increases download times as well (Couper, 2008). A more important factor of the survey level is the composition of a questionnaire with respect to the use of different types of questions and different question formats. Not surprisingly, research on the item level shows that longer questions increase the response burden and, thus, take longer to be answered (Couper & Kreuter, 2013; Yan & Tourangeau, 2008). The same finding applies to the number of answer choices. The more answer options for a question, the longer is the response time on average (Yan & Tourangeau, 2008). Furthermore, complex or flawed questions needed more time to be answered (Bassili & Scott, 1996; Lenzner, Kaczmirek, & Lenzner, 2010). The format of a question also influences the response time. For example, usually more cognitive processing is needed to answer open-ended questions than other types of questions (Couper & Kreuter, 2013; Yan & Tourangeau, 2008). In addition, some kinds of question formats might be more familiar to respondents than others, and for other formats, respondents may need to do more actions to enter their answers. For instance, a study by Heerwegh and Loosveldt (2002) showed that respondents completed a web survey faster when the questions used radio buttons instead of drop-down boxes. For web surveys, the grouping of related questions to form a matrix question might reduce the response burden on respondents because they would expect that items physically near each other are conceptually related (Tourangeau, Couper, & Conrad, 2004). This expectation is underpinned by the use of a common response scale. Experimental research also has shown that in many instances, respondents need more time to answer the same questions when each question is placed on a separate survey page instead of being grouped together on one or two pages (Tourangeau, Conrad, & Couper, 2013). Hence, we expect that the more cognitively demanding questions a survey includes, the longer the respondents will need to complete the survey (Hypothesis 1). For an overview of our hypotheses, see Table 1.
Overview of the Hypotheses.
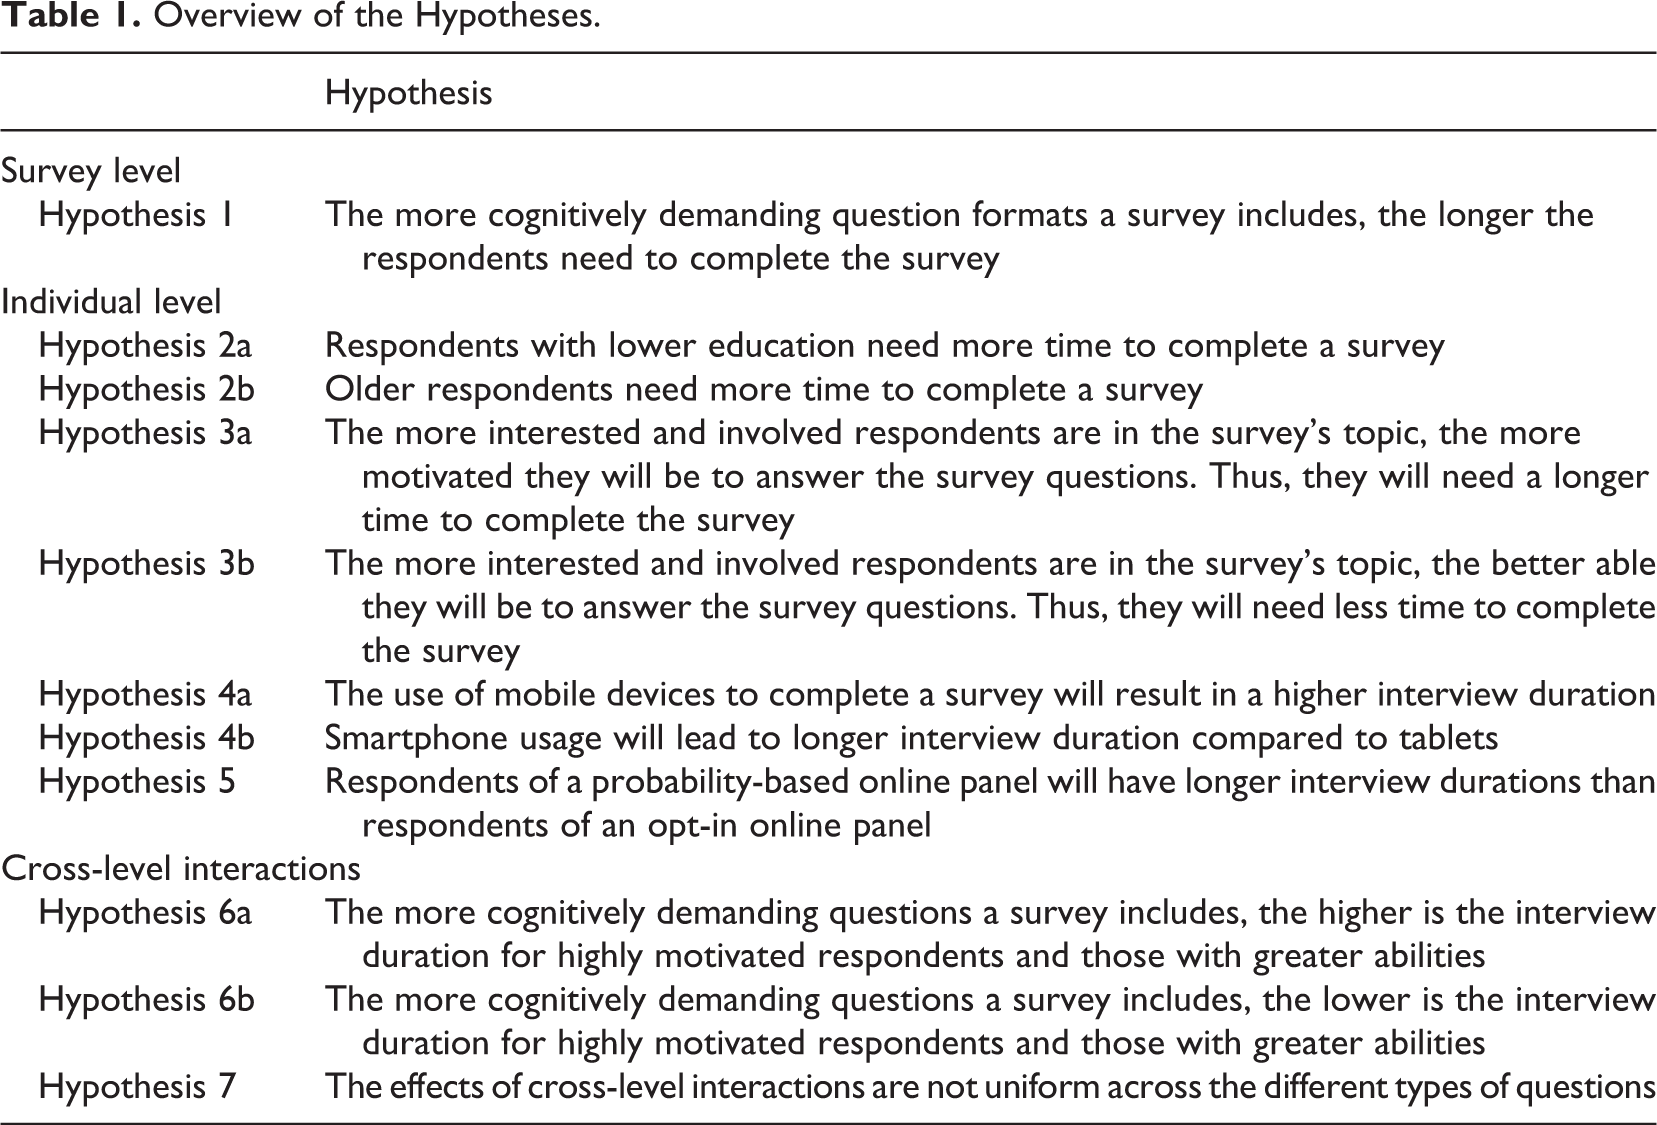
The second conceptual level is the individual level. The personal characteristics of respondents have an effect on response speed. Previous research has demonstrated consistently that older respondents and those with lower levels of education take longer to answer (Couper & Kreuter, 2013; Yan & Tourangeau, 2008). The higher working memory capacity of higher educated respondents and the declining working memory capacity of older respondents are a likely explanation for these findings (Couper & Kreuter, 2013; Knäuper, 1999; Loosveldt & Beullens, 2013; Olson & Peytchev, 2007; Yan & Tourangeau, 2008). Accordingly, we expect lower educated (Hypothesis 2a) and older respondents (Hypothesis 2b) to have higher interview durations.
However, working memory capacity is not the only influence on interview duration; another effect is the extent to which respondents are able and motivated to accurately answer questions. The more interested and involved respondents are in the topic of a survey, the more motivated they might be to accurately answer the questions. Less motivated respondents are expected to reduce their cognitive burden by skipping some steps of the response process as a means to cope with the cognitive demands of the survey task. The use of this response strategy, which Krosnick (1991, 1999) termed “satisficing,” leads to short response times (Callegaro, Yang, Bhola, & Dillman, 2004). Thus, a shorter interview duration might be the result of satisficing (Malhotra, 2008). Based on this argument, we can infer the hypothesis that respondents with a greater interest and involvement in the survey topic need more time to complete the survey than those respondents who are less interested and involved (Hypothesis 3a). On the other hand, the greater the interest and the higher the involvement in the topic of a survey, the more likely respondents possess more readily accessible attitudes on the topic of the survey (Fazio, 1990). Thus, we expect them to be able to respond more quickly than less involved respondents (Hypothesis 3b). As the mechanisms underlying the Hypotheses 3a and 3b cannot be disentangled in this study, we present them as two competing hypotheses.
In recent years, the use of Internet-capable mobile devices, such as smartphones and tablet computers (tablets), has grown immensely (De Bruijne & Wijnant, 2013; Mavletova, 2013; Peytchev & Hill, 2010; Stapleton, 2013). The use of mobile devices to fill in web surveys might affect interview duration in at least three ways. First, mobile devices can differ substantially from standard personal computers (PCs) with regard to screen size and functionality (Peytchev & Hill, 2010). Smaller screens limit the amount of visible information, so respondents sometimes may have to scroll to view the complete question or response scale (Peytchev & Hill, 2010; Stapleton, 2013). Thus, answering questions on a mobile device can be more difficult and require more effort from respondents (De Bruijne & Wijnant, 2013; Mavletova, 2013; Peytchev & Hill, 2010). Second, the speed of the Internet connection is usually slower when using the mobile web instead of a high speed Wi-Fi (wireless local area network) or fixed line Internet connection, which necessitates longer download times (De Bruijne & Wijnant, 2013; Mavletova, 2013). Third, smartphones and tablets are mobile devices, so respondents use them more often to respond to surveys when they are outside of their home (Mavletova, 2013). This different survey context might induce more distractions and lead to increased numbers of interruptions and, as a result, increases the interview duration. In line with recent research by De Bruijne and Wijnant (2013) and Mavletova (2013), we expect that the use of mobile devices increases the interview duration (Hypothesis 4a). However, tablets are more similar to PCs in regard to screen size and are less difficult to handle than smartphones. In addition, since they are larger and heavier, their mobile use outside the home may be less than the use of smartphones outside the home. Thus, in line with the findings of Wells, Bailey, and Link (2013), we expect that the use of a smartphone leads to an even larger increase in interview duration than the use of a tablet (Hypothesis 4b).
Finally, the respondent’s experience with web surveys can be expected to have an effect on response speed. A study by Toepoel, Das, and van Soest (2008) found that trained online panelists had shorter interview completion times than fresh respondents. These authors argued that this finding can be attributed to the greater experience and higher levels of survey satisficing of the trained panelists. We expect that the respondents from an opt-in online panel of volunteers are generally more inclined to respond to surveys due to the self-selection in the recruitment process. In addition, membership in multiple online panels is presumably more common among members of opt-in online panels due to the higher inclination to do surveys and/or financial motives. As those panelists complete more web surveys, they are supposedly experienced above average and satisfice more often (Baker et al., 2010). Due to the use of probability sampling, we expect that the panelists of probability-based online panels are less often members of multiple panels and that they are less experienced on average. Thus, we hypothesize that the respondents of probability-based online panels take longer to answer web surveys (Hypothesis 5).
Although the factors that we assume to explain the interview duration of web surveys are linked to different conceptual levels, we expect them to interact across those levels. For example, according to satisficing theory, respondents differ in their response behavior depending on the length and complexity of the survey and on their abilities and motivation (Krosnick, 1991, 1999). While highly motivated respondents and those with greater abilities likely perceive a survey with many complex questions as a challenge and invest even more effort in responding to it, less motivated respondents are discouraged and switch their response strategy to satisficing (cf. Hypothesis 3a). As a result, the interview duration does not only depend on the complexity of the survey and the motivation of respondents but on the interaction of both. In other words, we hypothesize that the more cognitively demanding questions a survey includes, the higher is the interview duration for highly motivated respondents and those with greater abilities (Hypothesis 6a). At the same time, those respondents likely possess more readily accessible attitudes on the topic of the survey (cf. Hypothesis 3b). In this regard, we can formulate the opposing hypothesis that the effects of attitude accessibility on interview duration are moderated by the complexity of the information needed to answer the questions of the survey. In other words, the more cognitively demanding questions a survey includes, the shorter is the interview duration for highly motivated respondents and those with greater abilities (Hypothesis 6b). Both hypotheses on the interaction of question formats and the respondents’ abilities and motivation imply that the strength of the effect is moderated by the complexity of the question formats. The higher the complexity of the question format, the larger are the differences between the respondents who are low in motivation and ability and those who are highly able and motivated to answer the questions. Thus, we hypothesize that the effects of the cross-level interactions are not uniform across the different types of questions (Hypothesis 7).
In summary, we infer from theory and previous research that several factors have effects on response times and, therefore, on the interview duration of web surveys. We expect that factors on both levels—the survey and the individual level—explain parts of the variation in interview duration. Furthermore, we hypothesize that these factors interact across the conceptual levels. Accordingly, the aim of our empirical analyses is to assess the influence of the factors presented previously, their relative importance, and interactions across the conceptual levels.
Data
To test our assumptions, we pooled the data of 21 web surveys on the political attitudes and behavior of German Internet users. The surveys were conducted between 2009 and 2013 as part of the German Longitudinal Election Study (Rattinger, Roßteutscher, Schmitt-Beck, Weßels, & Wolf, 2009–2013). The respondents to Surveys 1–16 were sampled from an opt-in online panel, whereas Surveys 17–21 used respondents from a probability-based online panel of Internet users (recruited by computer-assisted telephone interviewing). For their participation in the web surveys, all respondents received a payment in the form of panel points or vouchers.
On average, a single survey included 1,156 cases. The total number of respondents in the pooled data set is 24,273. Since outliers heavily influence the distribution of the interview duration, we excluded respondents with a very long (i.e., interrupted interviews) or a very short interview duration (i.e., speeding respondents). As the lower threshold value, we chose the 1st percentile and the 99th percentile as the upper threshold. Threshold values were calculated separately for each survey.After the exclusion of outliers, the data set had 23,800 observations. As a result, the skewness of interview duration is reduced from 31.11 to 2.25. Since the identification and exclusion of outliers might heavily influence the robustness of our analyses, we tested different approaches of dealing with very short and long interviews. These tests confirmed the robustness of our results. 2
Our dependent variable is the absolute interview duration in seconds for each respondent. The interview duration was calculated using paradata (i.e., time stamps), which are automatically generated by the survey software. The average interview duration over all 21 surveys is 31.73 min (1,904 s). We plotted descriptive statistics on the interview duration for each survey in Figure 1. The interview duration strongly varies between and within different surveys.
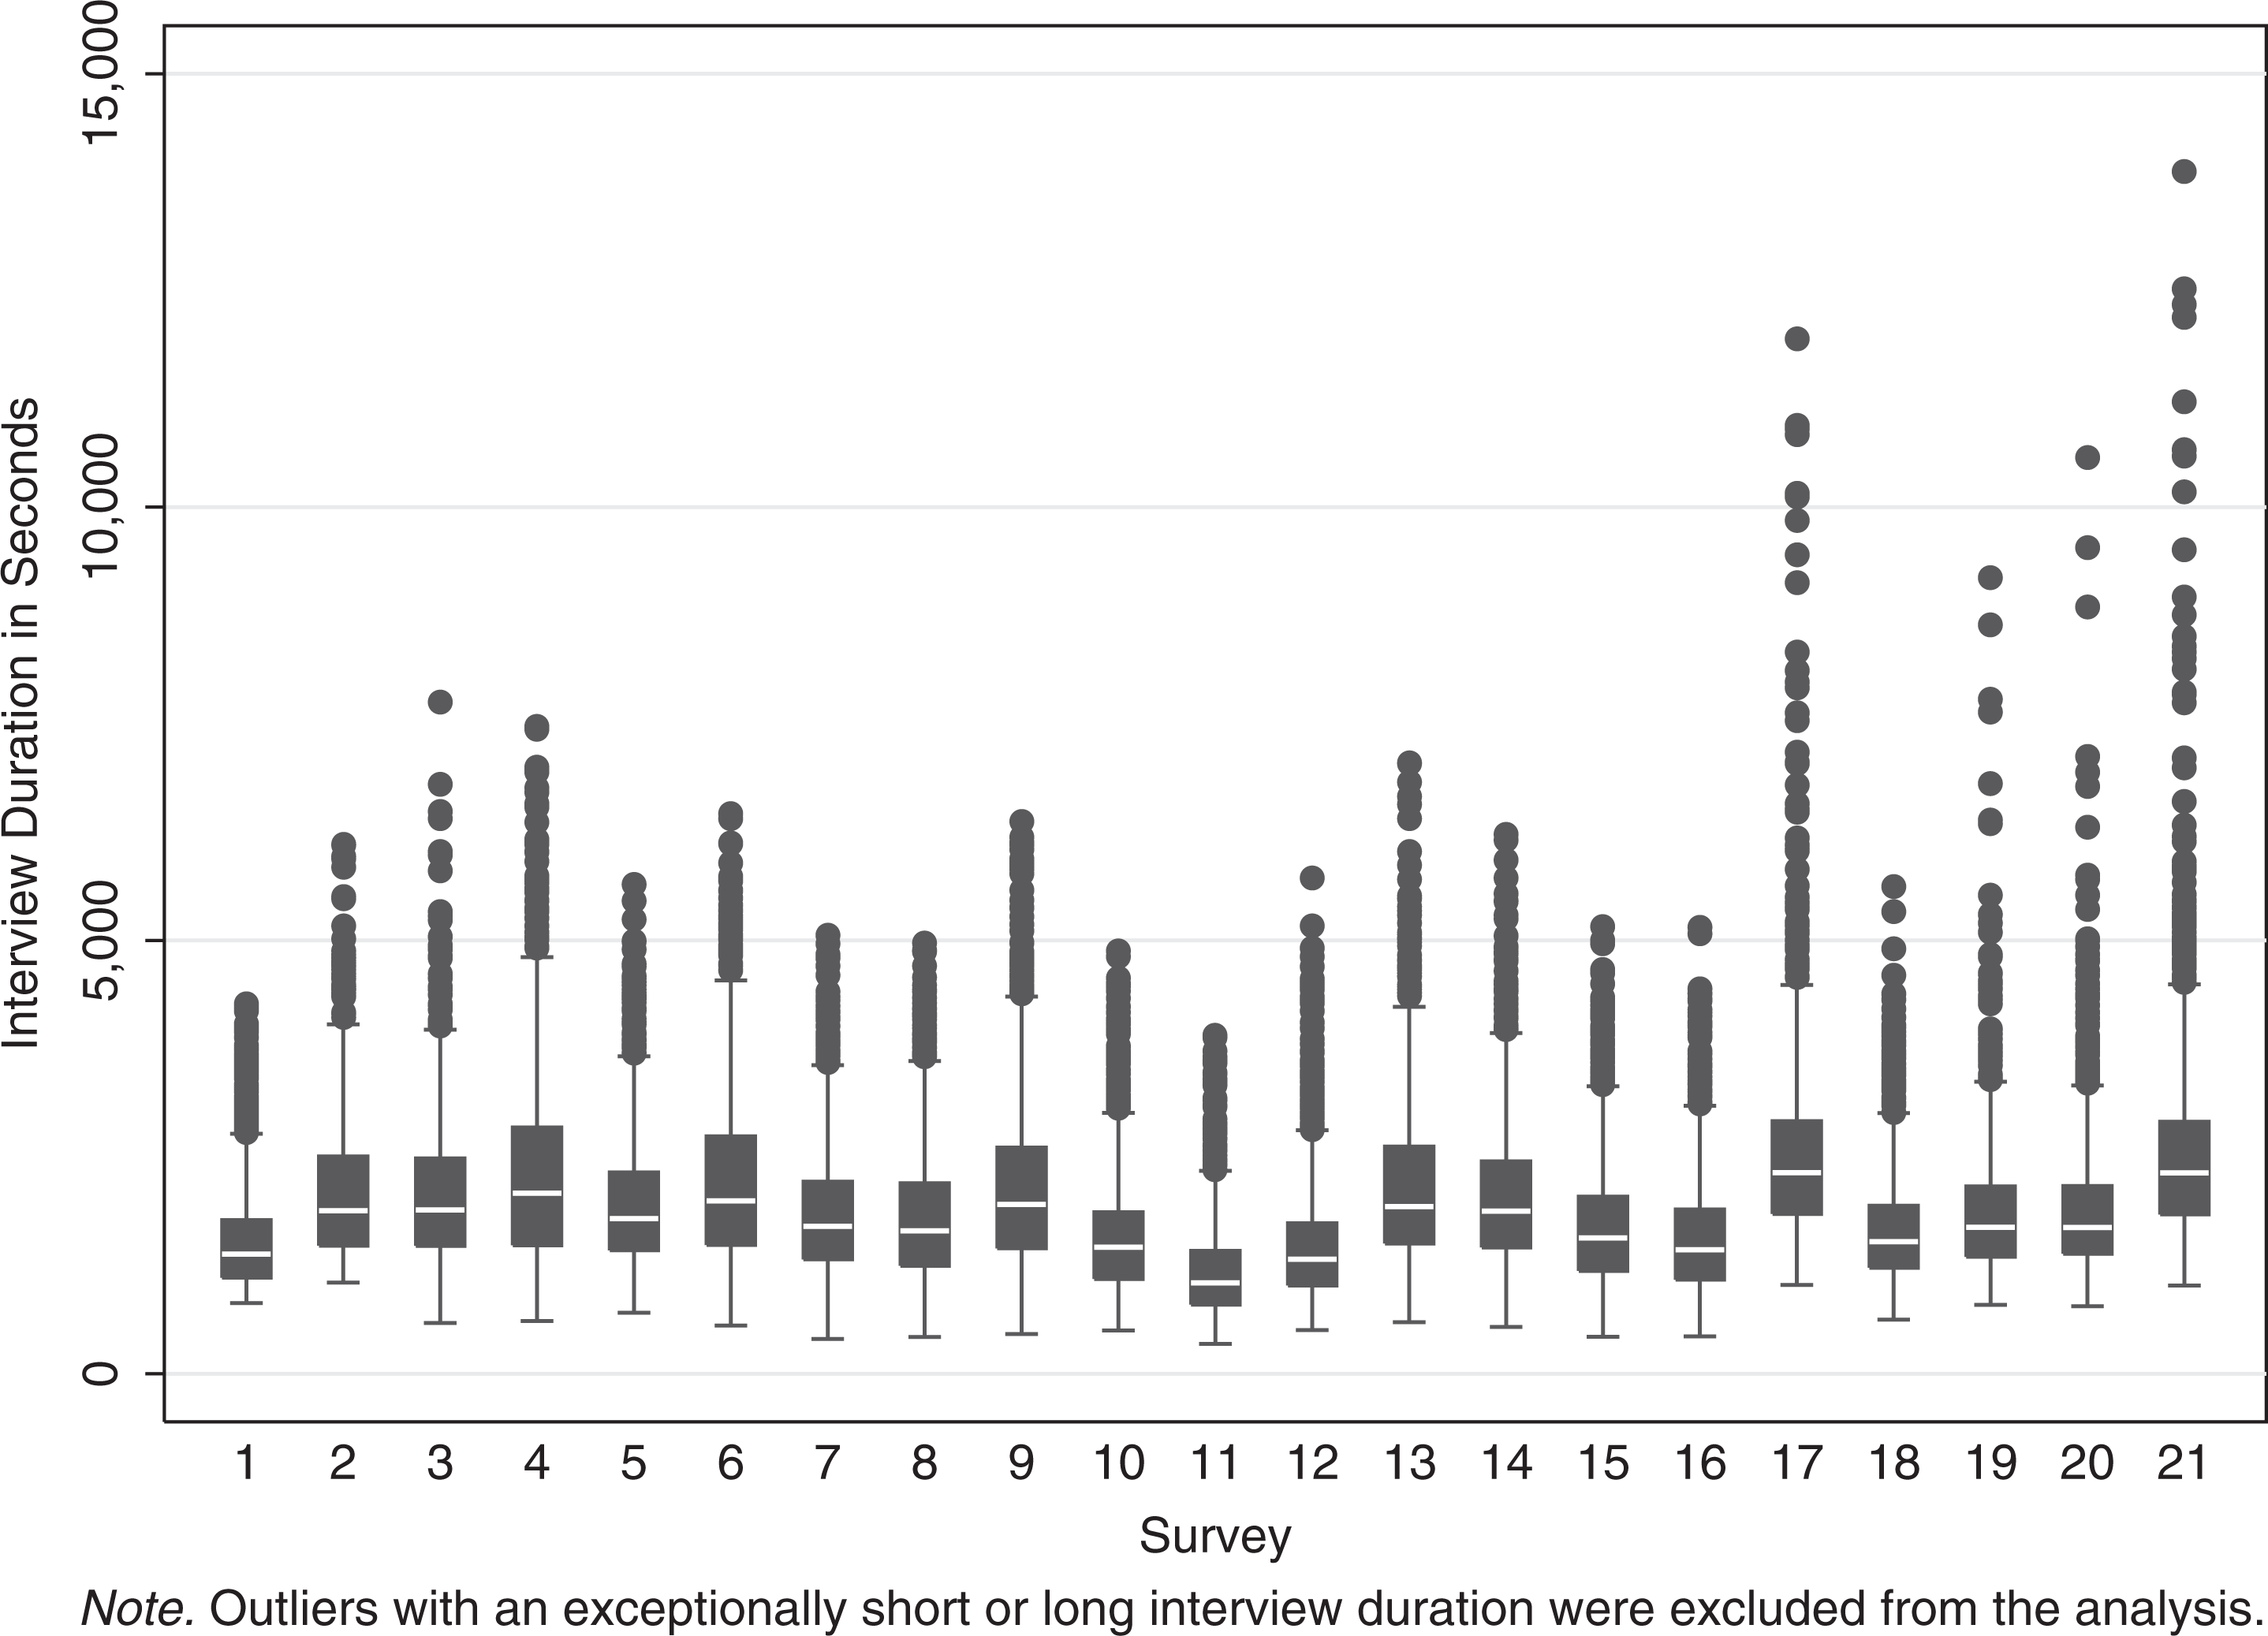
Interview duration in 21 web surveys.
Figure 2 shows a quantile–quantile plot of the distribution of the dependent variable against a normal distribution. Since the distribution was still moderately skewed, we used the natural logarithm of interview duration as the dependent variable in the models presented subsequently. This procedure further reduced the skewness to 0.12 (the correlation between duration and ln(duration) remains strong with r = 0.94).
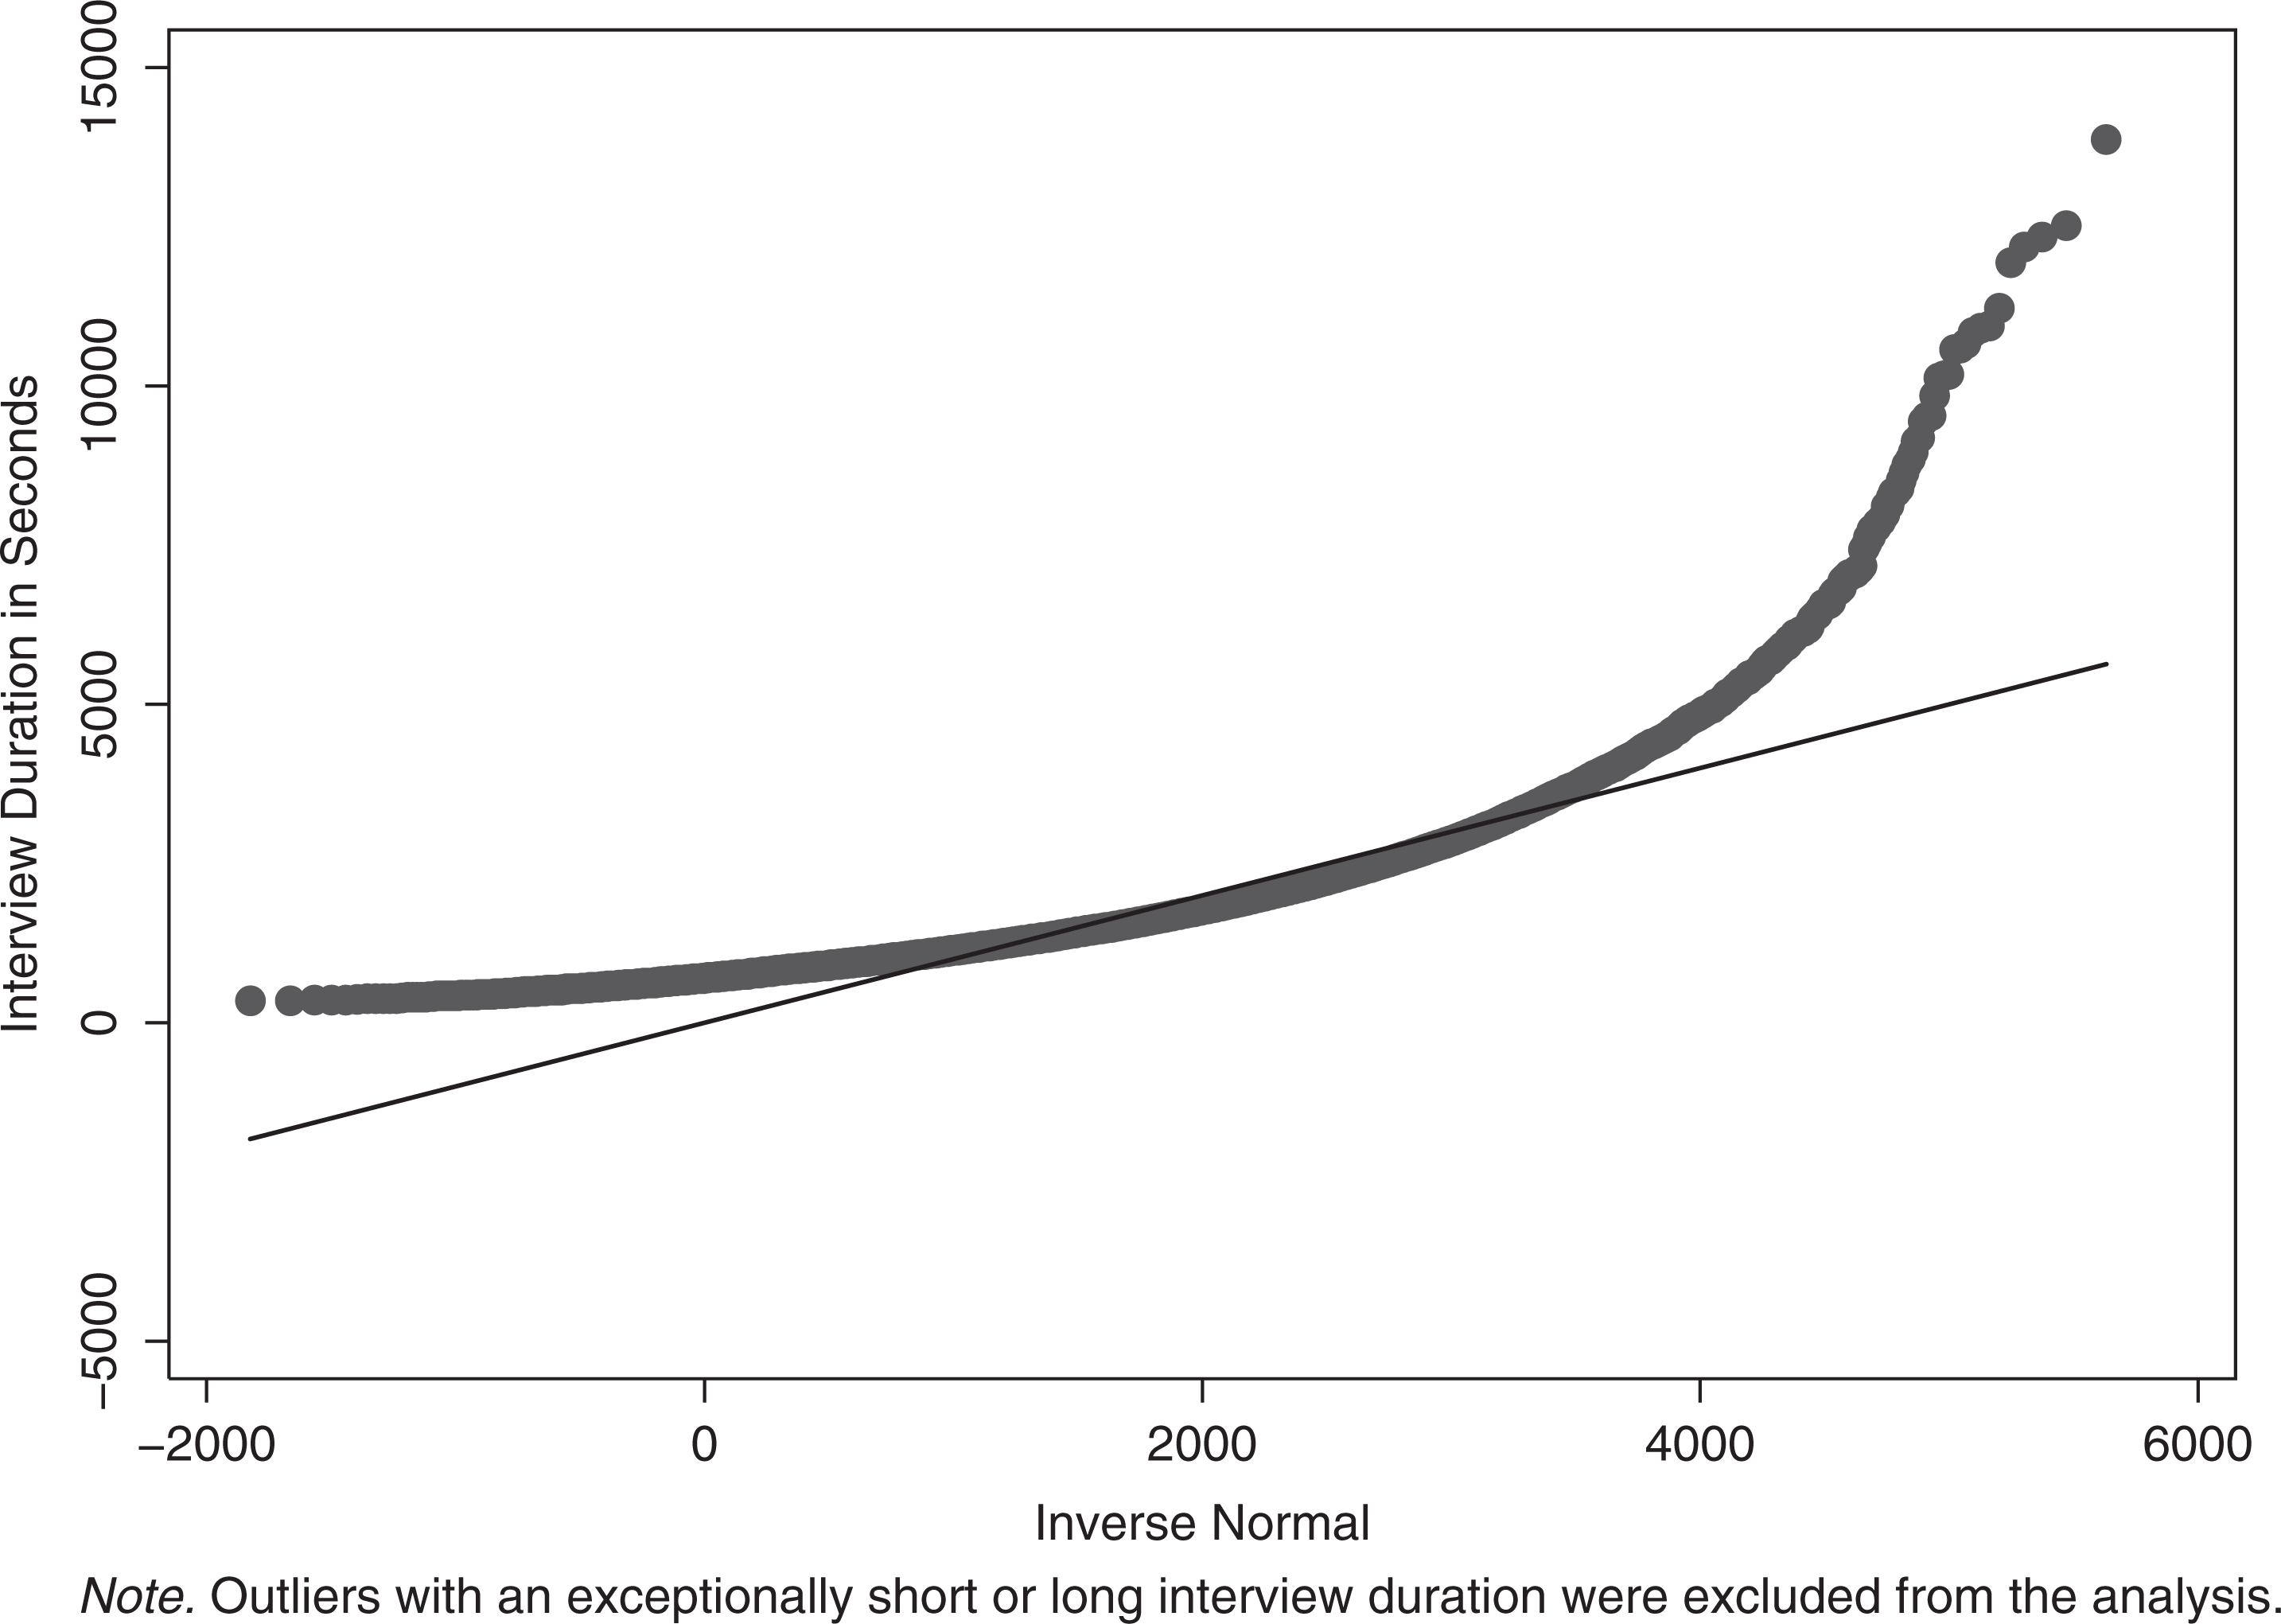
Quantile–quantile plot of interview duration against normal distribution.
For the individual level, we collected the information that was available in each of the 21 surveys. As outlined before, we expect a broad range of variables to have an effect on the time needed to complete the survey. Table 2 gives a brief overview of these variables. Age was measured in the following categories: 18–29, 30–39, 40–49, 50–59, and 60+. Education was measured by the respondent’s highest educational degree achieved so far. It was coded in three categories: a low, intermediate, or high level of education. We used age and education as indicators of the working memory capacity of the respondents (Hypotheses 2a and 2b). On average, working memory capacity should be higher among younger and higher educated respondents. Control variables are the respondent’s gender and the region of residence. Both were coded as dummy variables (gender: male/female; region: Eastern/Western Germany).
Descriptive Statistics of Individual and Survey-Level Characteristics.
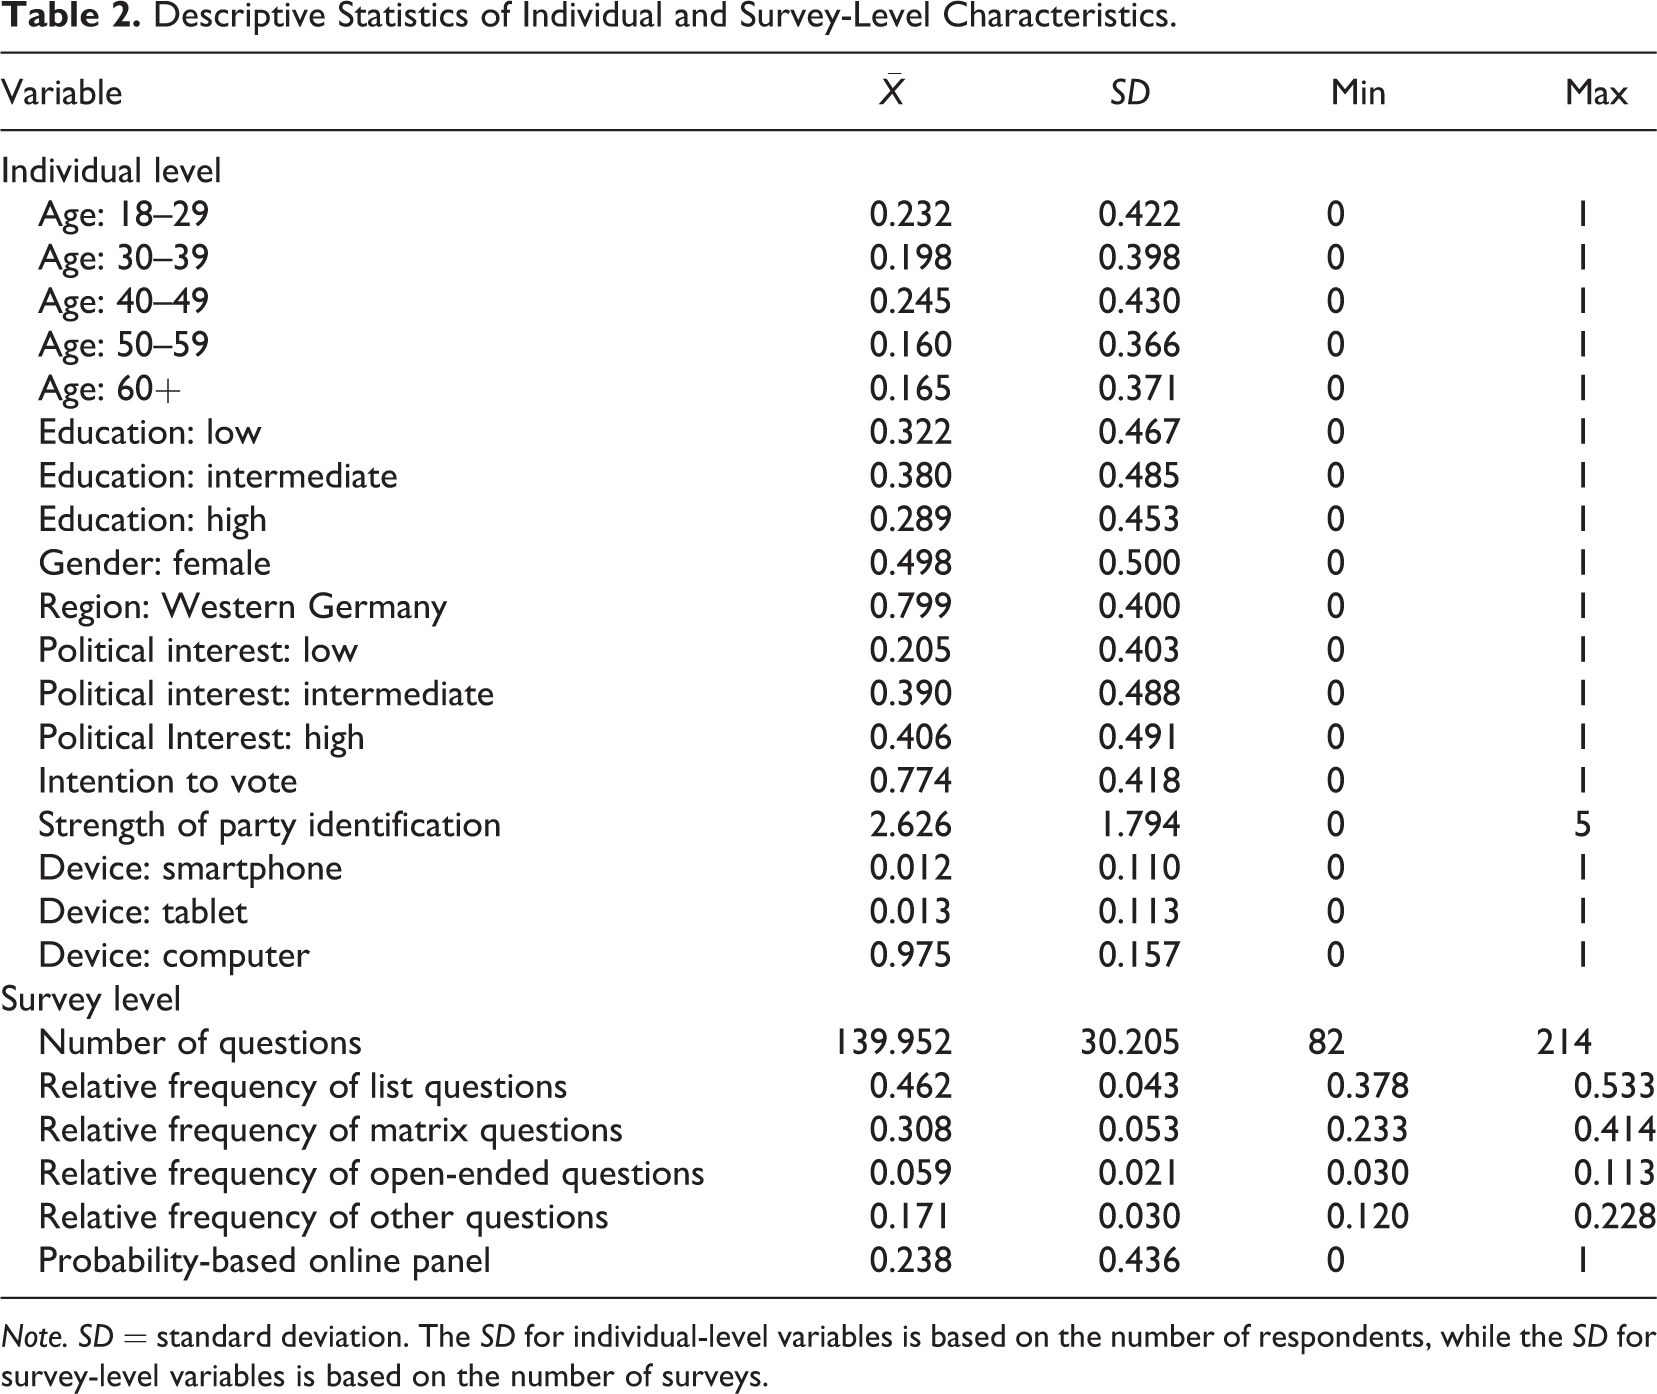
Note. SD = standard deviation. The SD for individual-level variables is based on the number of respondents, while the SD for survey-level variables is based on the number of surveys.
To test the assumptions about the effects of respondents’ motivation and involvement in the survey topic, first, we coded their intention to vote at the next federal election as a dummy. Second, their involvement in politics should be reflected further by the way they identified themselves with a political party. Therefore, we used the strength of the identification with a party as a measure for involvement. Third, their interest in politics was coded into three categories: low, intermediate, and high (Hypotheses 3a and 3b).
As discussed previously, we expect that the use of mobile devices has an impact on the interview duration (Hypotheses 4a and 4b). We used the “user agent strings” to determine whether respondents used a PC, a smartphone, or a tablet to answer the survey (see Callegaro, 2010, 2013). These data on the operating system, browser, and further technical specifications were collected as paradata (Kreuter, 2013; Kreuter & Casas-Cordero, 2010) by the web survey software package. Although most respondents used a computer, we found an increasing number who used mobile devices, for instance, smartphones and tablets (up to 10.9% for the offline recruited panelists of Survey 21).
A second set of variables addressed the survey level. First, we generated variables for the question format. Each question in the 21 web surveys was assigned to one of the four major categories: list, matrix (grid), open-ended, or other question. A question was coded as a list question if it presented the answer options as a vertical list from which the respondent had to select a response (single response). Questions with one or multiple items and horizontal rating scales (Likert-type scales) were coded as matrix questions. Open-ended questions are questions that offered the respondents a text area (or text box) to enter their answer. If none of these characteristics applied, questions were coded into the residual category. 3
To reflect how a survey was designed, we calculated the proportion of each question format in a respective survey. Averaged over the surveys, list questions were the most frequently used format
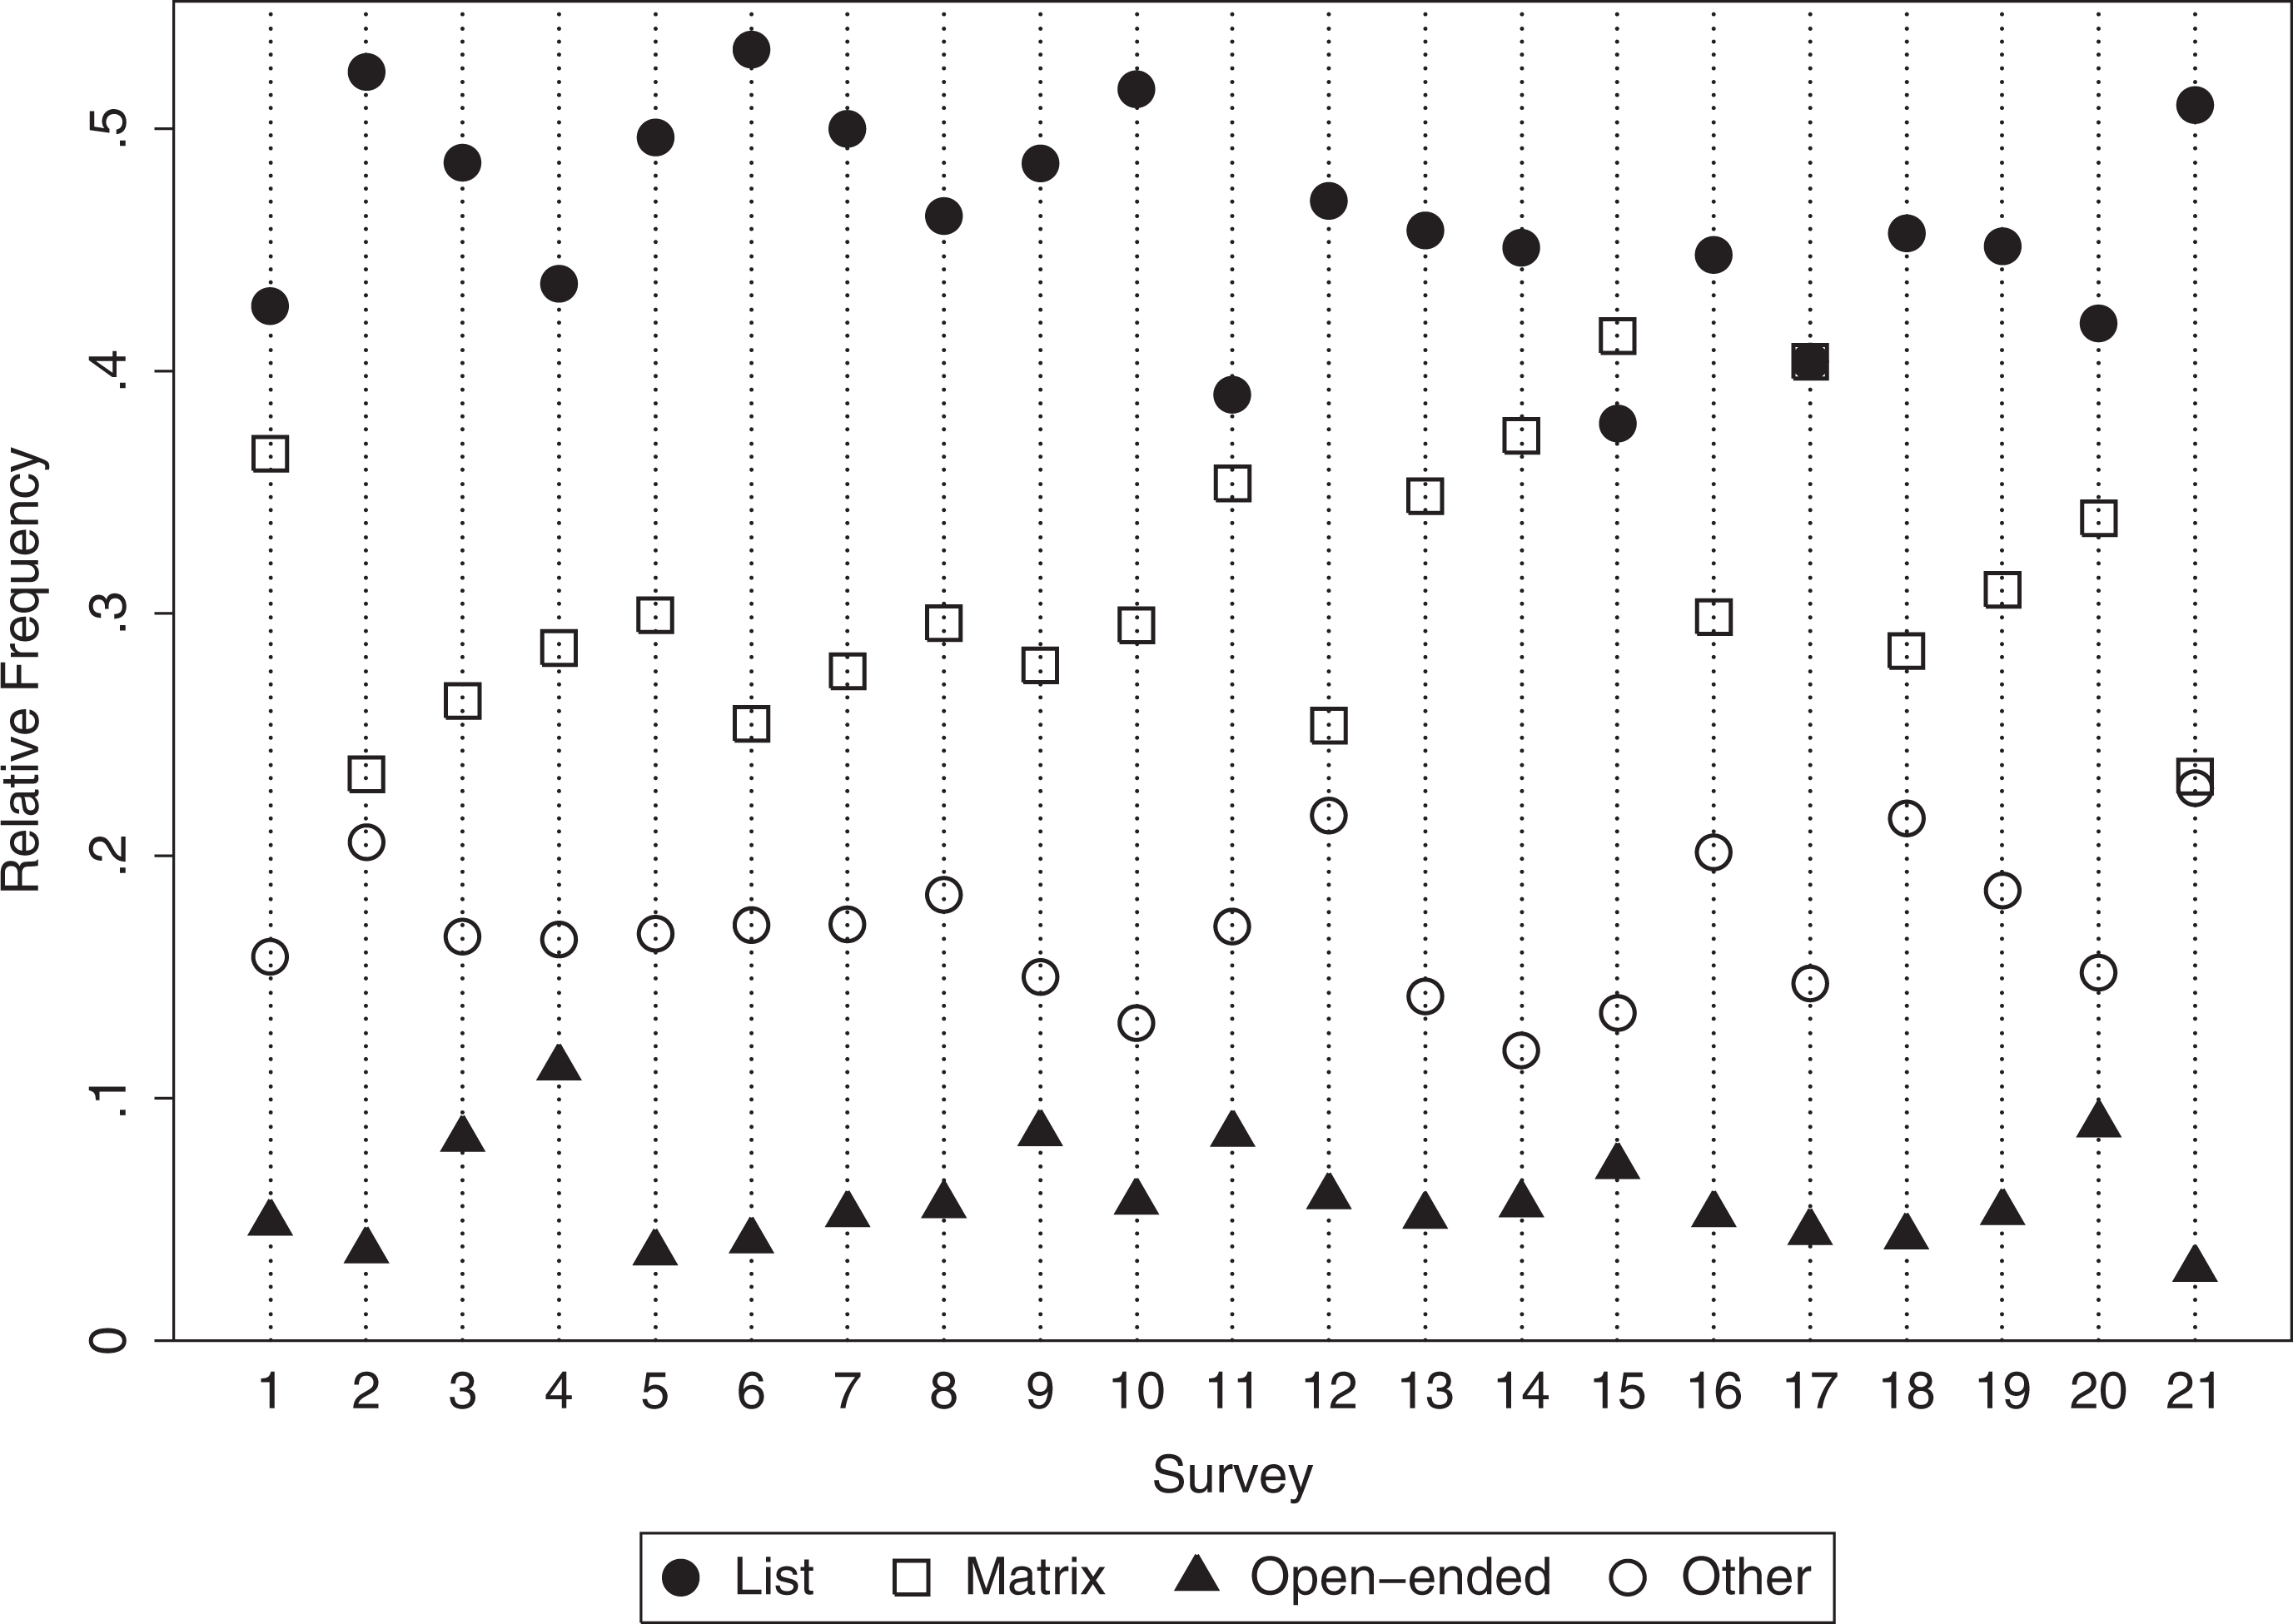
Relative frequencies of the three different question formats in 21 web surveys.
Surveys 1–16 used respondents from an opt-in online panel, and Surveys 17–21 used respondents from an offline recruited probability-based panel. A dummy variable was included to indicate an opt-in or probability-based sample (Hypothesis 5).
Method
We applied multilevel analysis to account for the multilayered structure of the factors that we assume to explain the interview duration in web surveys (for an overview, see Hox, 2010; Luke, 2004; Snijders & Bosker, 1999). We expect that each of the survey-level factors has an independent effect on interview duration, even when we control for individual-level variables and vice versa. In methodological terms, the structure of the pooled data is clustered. Applying standard regression models to this data structure would result in an underestimation of the standard errors. Furthermore, multilevel analysis enabled us to test hypotheses concerning the interaction of factors on different levels.
We fitted a series of models beginning with an empty or null model (EMPTY). Then, we added the explanatory variables stepwise. The final model was a random intercept fixed slope model with cross-level interactions (RIFSCI). It is specified as
where yij denotes the interview duration of individual i in survey j. The other parameters of the equation are as follows:
β0 the grand mean (i.e., the mean intercept of all surveys);
β1 vector of coefficients of the individuals’ characteristics X;
β2 vector of coefficients of the surveys’ characteristics Z;
β3 vector of coefficients of the cross-level interactions XZ;
Xij vector of characteristics of individual i in survey j;
Zj vector of characteristics of survey j;
XijZj vector of cross-level interactions;
uj random effect of the surveys;
∊ ij residuals of the individual i in survey j.
Additional models such as random intercept random slope (RIRS) models were tested. These exceed the level of complexity of random intercept fixed slope (RIFS) models. Nevertheless, the RIRS models yield no further improvement of explanation, since we assumed interest in the topic to only interact with the design of the survey. In addition to these interactions, our theoretical model assumes fixed slopes for the respondents’ interest in the topic. Thus, RIRS were excluded from the Results section. Akaike Information Criterion and Bayesian Information Criterion were calculated to decide which model fitted best. Furthermore, we conducted likelihood ratio tests to check whether a model provided significant improvement when compared to preceding models. To make all models comparable and to allow for likelihood ratio tests, we restricted the sample to respondents without missing data on any of the variables used in the models. The number of excluded cases was very low (n = 21). Therefore, restricting the sample should not bias our results. Models were calculated with a total of 23,779 observations.
To evaluate the model fit, we calculated R
2 for the individual and survey level as suggested by Snijders and Bosker (1999, p. 102-103). The indicators are defined as: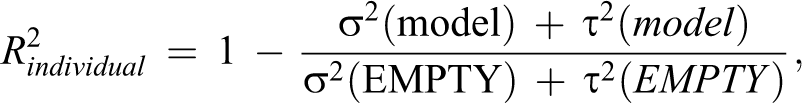
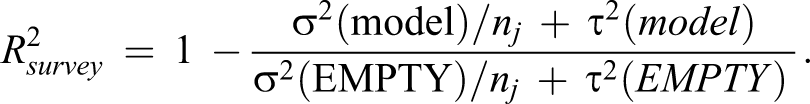
The residual variance within surveys is denoted as σ2 and as τ2 between surveys. The survey size is referred to as nj
in the second equation. Because nj
varies between surveys, we used the harmonized mean
A major challenge to the application of multilevel analysis is that the degrees of freedom on the macro level are often limited. This was problematic, since it forced us to restrict the number of variables on the macro level. Different rules of thumb can be used to determine how many macro-level observations are needed to perform a multilevel analysis (e.g., Maas & Hox, 2005; Snijders & Bosker, 1999, p. 44). Rather than following one of these rules of thumb, we decided to limit the number of variables on the survey level. While this approach did not allow us to fit an all-including model, we nonetheless could include all the variables we needed to test our hypotheses.
Results
To estimate what share of the variance is accounted for by the different levels, we calculated the intraclass correlation coefficient (ICC). The EMPTY model has an ICC of 0.177, which means that 17.7% of the variance is explained by the survey level. Accordingly, individual characteristics account for a larger share of the variance (82.3%). This result clearly shows that the explanation of interview duration has to take two distinct conceptual levels into account: the individual and the survey level.
Model 1 in Table 3 is an RIFS model with a full set of variables on both levels. Models 2 and 3 are extensions of this model (RIFSCI). These two models include cross-level interactions between the respondents’ interest in politics and the relative frequency of open-ended (Model 2) and of open-ended, matrix, and list question formats (Model 3), respectively. Likelihood ratio tests showed that both extended models explained a significantly larger share of the variance than did Model 1 (p < .01 for Model 2 vs. Model 1, p < .01 for Model 3 vs. Model 1).
Multilevel Models of Interview Duration.
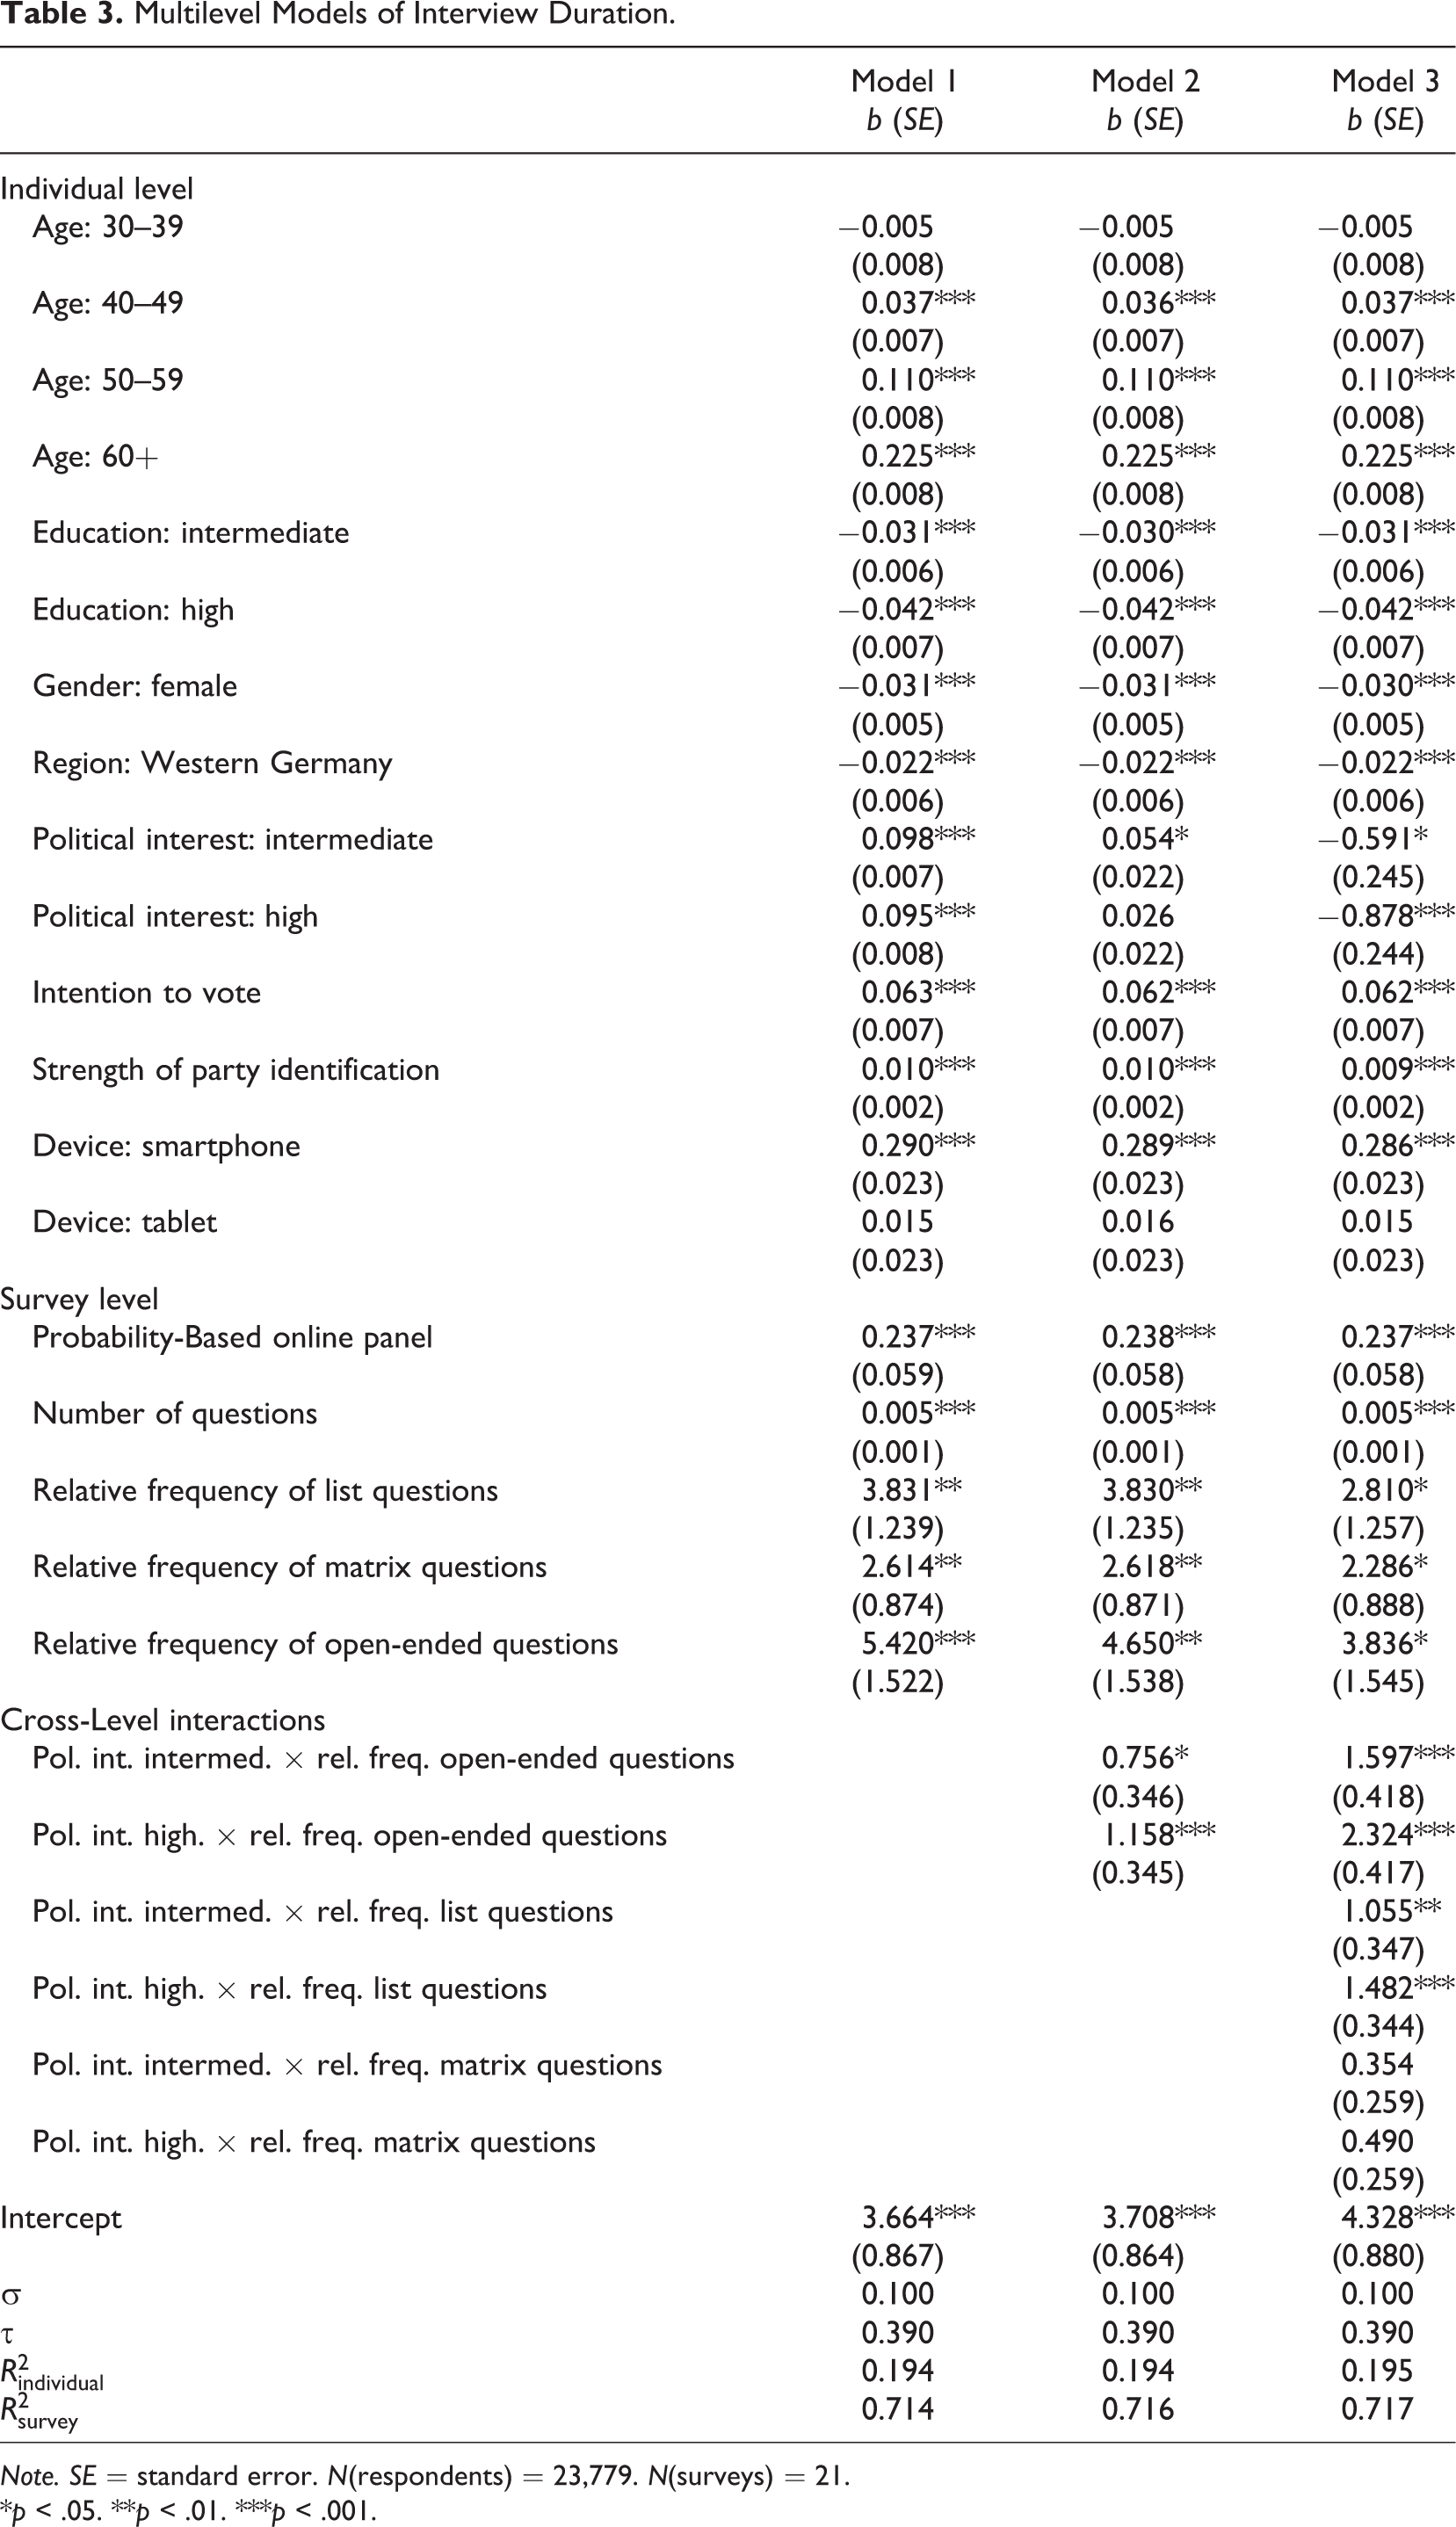
Note. SE = standard error. N(respondents) = 23,779. N(surveys) = 21.
*p < .05. **p < .01. ***p < .001.
Following the conceptual distinction of the two explanatory levels, we first analyzed the effects on the individual level based on Model 1. As we expected in Hypothesis 2a, higher educated respondents need less time to complete a survey, most likely due to their higher working memory capacity (cf. Yan & Tourangeau, 2008). Second, confirming the results from previous research on response latencies, we found that interview duration increases with age (Hypothesis 2b). The effect is strongest in the group of the oldest respondents, which supports the hypothesis of a more rapid decline in working memory capacity after around age 65 (Knäuper, 1999). Nonetheless, we need to consider that the effects of age and education can also be explained by differences in attention span, computer literacy, and reading speed (e.g., Carver, 1992; Wagner, Hassanein, & Head, 2010).
With regard to social psychological research, we presented two competing hypotheses on the effects of interest and involvement in the survey topic on interview duration. Respondents who intended to vote and identified themselves strongly with a party can reasonably be assumed to be involved in politics. We found that both variables had significant positive effects on interview duration. This finding is in line with Hypothesis 3a but conflicts with Hypothesis 3b. Apparently, politically involved respondents are more motivated to search their memories for adequate information and take more time to integrate this information into accurate and meaningful responses. Thus, being politically involved increases interview duration in web surveys about political attitudes and behavior. Controlling for further variables, we found that interview duration increases with greater interest in politics (Model 1 in Table 3). This result is also in line with the hypothesis that respondents interested in the survey topic are more motivated to invest considerable effort in comprehending and answering the questions in the survey (Hypothesis 3a).
Confirming our theoretical expectations, we found that smartphones had a strong effect on interview duration (Hypothesis 4b). Respondents who used their smartphone to fill in the web surveys needed a significantly longer time than those who used a PC. In contrast, respondents using a tablet did not need more time to answer the surveys than PC users. Thus, Hypothesis 4a is rejected. As discussed previously, we believe that these findings are a result of the smaller screen size and the more likely mobile use in combination with the slower Internet connection speed of smartphones in comparison to tablets. The latter are equipped with larger screens and are easier to handle. In this regard, tablets are more similar to PCs, Notebooks, and Netbooks. Accordingly, a study by Müller, Gove, and Webb (2012) found that the most common locations for using tablets are within the home of the users. This finding is particularly important for web survey methodology because it highlights the need to differentiate not only between standard computers and mobile devices but also between smartphones and tablets.
Turning to the survey-level variables, we began by assessing the effects of sample composition and web survey experience. In line with the findings of Toepoel et al. (2008), our results showed that the panelists of the probability-based online panel who are presumably less inclined to respond to surveys and are less experienced answered the web surveys at a much slower rate on average (Hypothesis 5). We take this finding as an indication that the sample of the probability-based online panel is composed of higher motivated respondents who satisfice less and are less experienced in completing a web survey than the respondents of the opt-in online panel.
Next, we examined the effects of the composition of the questionnaire in regard to different question formats. Not surprisingly, we found that higher overall numbers of questions increased the interview duration. Furthermore, we hypothesized that the more cognitively demanding questions a questionnaire includes, the stronger is the increase in the interview duration. Our analysis revealed (Model 1) that the relative frequency of open-ended questions had the largest effect on interview duration, followed by the effects of list and matrix questions. These findings are in line with Hypothesis 1. Increasing the proportion of matrix questions while keeping the share of open-ended and list questions at a constant level increases the interview duration the least. While list questions mainly represent only 1 item, matrix questions usually consist of several items. Although matrix questions might induce nondifferentiation (Krosnick, 1991, 1999) and have negative effects on survey breakoff and item missing data (Tourangeau et al., 2013), they are nonetheless an efficient question format and, thus, they are less time consuming to answer per item (cf. Tourangeau et al., 2004). With a rising proportion of open-ended questions, the average interview duration increases strongly. These results are not surprising, since open-ended questions are often cognitively more demanding than closed questions because respondents cannot infer from the response options what an appropriate answer might be, and they have to formulate and type in an answer in their own words (cf. Tourangeau, Rips, & Rasinski, 2000). In conclusion, these results imply that the composition of a questionnaire in terms of different question types has an effect on the average interview duration of the survey.
So far, our study enhances existing knowledge by confirming several previous findings on the individual and survey level. Further, we fitted two extended models (Models 2 and 3) in which we added cross-level interactions between the respondents’ interest in the survey topic and the question format. To allow for a more intuitive interpretation, we plotted the interactions, setting all other covariates on their means (Figure 4). When we included the interaction between political interest and the relative frequency of open-ended questions (Model 2), the main effect of political interest partially vanished, while we found the interaction effect to be significant with a positive sign. Extending Model 2 with further cross-level interactions between interest in politics and the proportion of list and matrix questions (Model 3) again altered the main effect of political interest. It became significantly negative. Yet, as a main effect in a set of interactions, it is hard to interpret. We take this finding as an indication that it might be possible to disentangle the mechanisms behind Hypotheses 3a and 3b. It seems that the respondents with a greater interest in the survey’s topic needed more time to answer questions from the three major formats, whereas they needed less time to answer other kinds of questions. However, the findings from Models 2 and 3 implied a more complex underlying causal relationship. In line with Hypothesis 6a, it seems that respondents with greater political interest are more motivated to answer accurately and, thus, need more time to finish the survey, especially for a distinct set of questions. As Figure 4 shows, the slopes are steeper for respondents with a high interest in the survey’s topic for each of the interactions compared to respondents with intermediate and low levels of interest in politics. This result means that the effect of increasing the share of one of these three major question formats on interview duration depends on the respondents’ interest in the survey’s topic (Hypothesis 6a). Respondents with greater interest in politics can be expected to discuss, read on, and think about this topic more often than others. Thus, they have plenty of information on this topic available, and they are likely more motivated to answer the questions accurately. Cognitively demanding open-ended questions offer them the opportunity to express their complex thoughts but also impose a higher burden on them because they need to consider more complex information that they have to integrate into a final response. In contrast, less motivated respondents might satisfice by giving superficial answers. Respondents who are somewhat interested in the survey’s topic may inhibit some information, which they carefully assess to report an accurate answer. However, because they do not inhibit as much information as highly interested respondents, the cognitive process of answering the open-ended questions is easier and faster for them. The more cognitively challenging the design of a survey is (e.g., many open-ended questions), the more information has to be processed by highly interested respondents. On the other hand, a survey that is designed to be easier (e.g., many matrix questions) limits the possibility to express complex thoughts. Thus, respondents may possess highly accessible information on the topic, but the process of answering the questions is shortened compared to a questionnaire comprising more complex questions. Although our analyses were limited to a selection of variables on both levels, they provided preliminary support for Hypotheses 6a and 7. Hypothesis 6b was not supported by our data and, thus, had to be rejected.
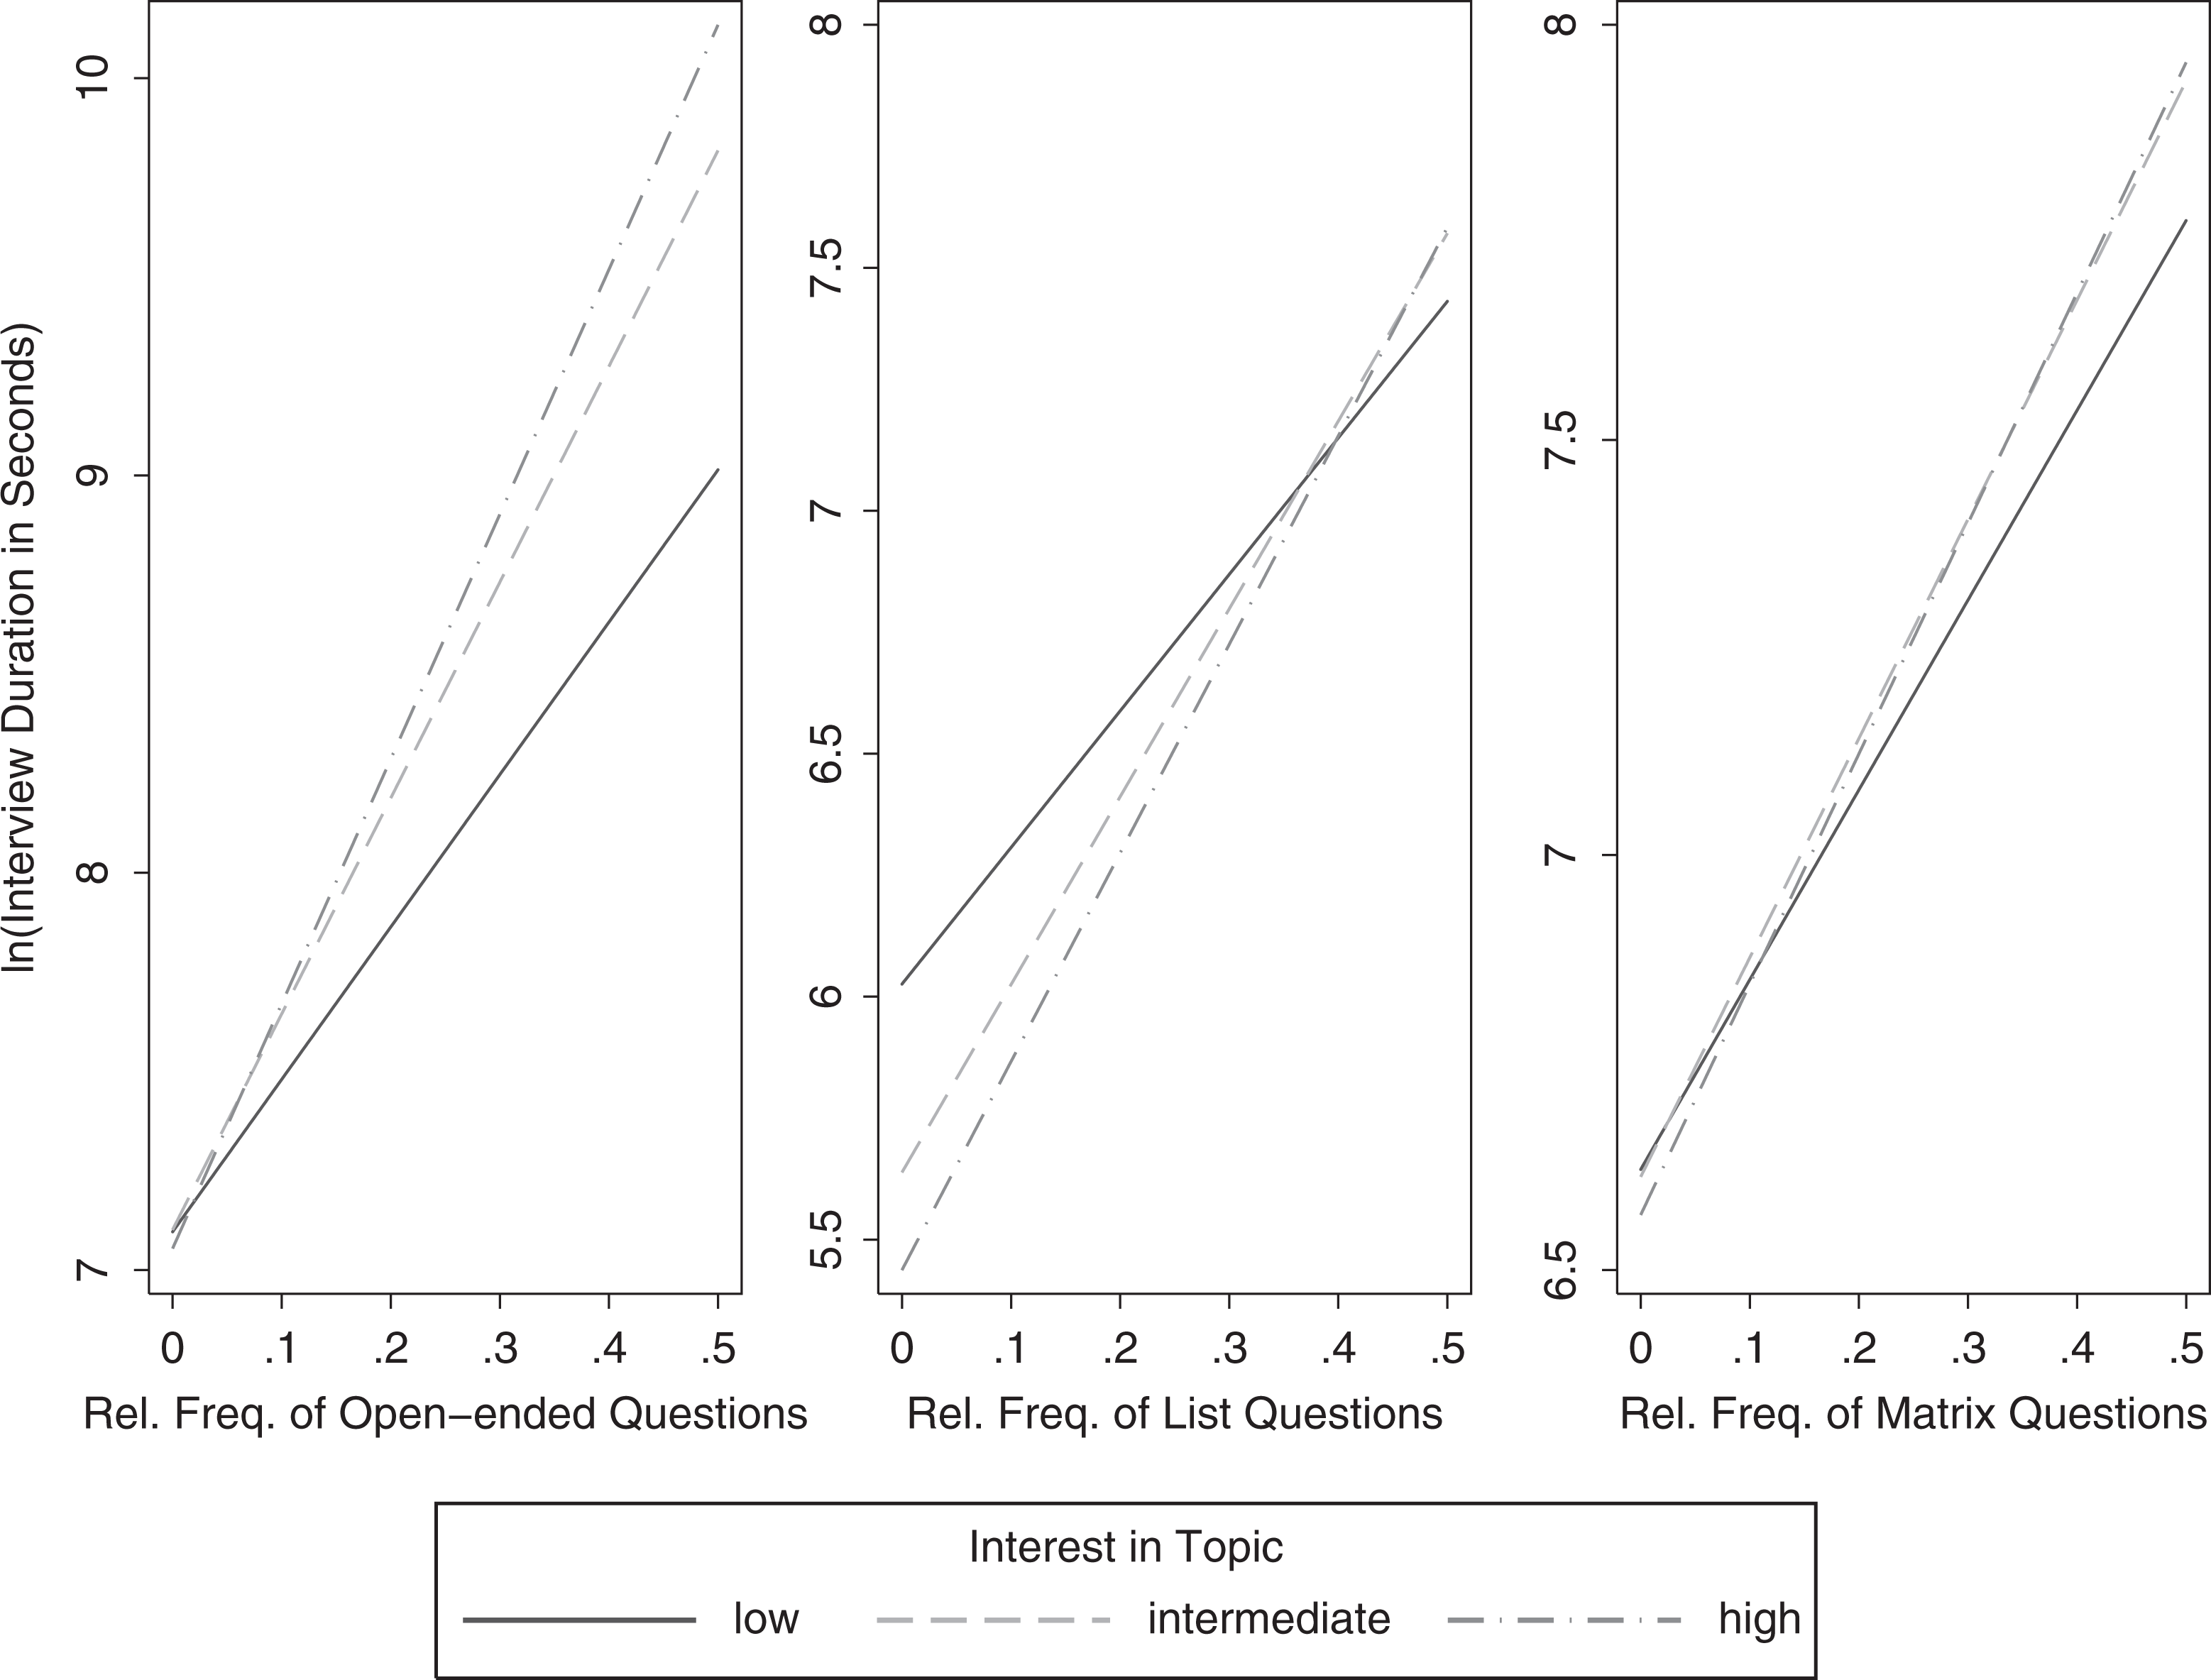
Cross-level interactions between political interest and the relative frequency of question formats.
To conclude, we found significant factors explaining interview duration on both conceptual levels. Decomposing the variance into between and within survey variance confirms the importance of determinants on the individual level. Basing the prediction of the interview duration exclusively on survey-level determinants, for example, the number of questions, would lead to inefficient and inaccurate results. Furthermore, our findings confirmed previous research on factors on both levels. Extending the baseline model with cross-level interactions revealed the need for further investigation on this matter. As our models show, several causal effects are operating on the individual level, survey level, and the interaction between them.
Discussion
Interview duration is an important aspect of web surveys. Due to its impact on response behavior and sample composition as well as on the quality of the answers, researchers need to estimate the interview duration before fielding a web survey. An enhanced knowledge about the factors and causal effects that explain interview duration will help us to make informed design decisions. This knowledge should ultimately result in better web surveys in regard to response burden and data quality. Adjusting the interview duration and burden to a respondent’s lifestyle should influence the decision to contribute and cooperate in a positive way. Thus, extending the knowledge about the factors that explain interview duration in web surveys is of pivotal importance.
This article contributes to the existing research in at least three ways. First, instead of relying on a single survey, we tested our hypotheses with a pooled data set of 21 web surveys on the political attitudes and behavior of German Internet users from opt-in and probability-based online panels. This approach allowed us to draw conclusions from a solid database.
Second, we were able to confirm several hypotheses that we inferred from previous research. Moreover, by adding cross-level interactions to our models, we showed that the factors on different levels of explanation are not fully independent but that they interact in meaningful ways. This result highlights the need for further research on cross-level interactions between individual- and survey-level characteristics. Our findings imply that survey design requires researchers to carefully weight not only the number and types of questions when constructing a questionnaire but also to take into account the target population and the sample composition. For example, samples comprising larger numbers of respondents with higher cognitive abilities will complete a questionnaire faster on average than samples comprising fewer of these respondents. In contrast, surveys of highly interested and therefore motivated respondents will likely result in longer interview durations compared to samples with a higher share of less motivated respondents. As a result of the interaction of individual and survey characteristics across levels, the effect of respondent motivation becomes even stronger when the questionnaire includes a larger number of cognitively demanding open-ended questions. In addition, we presented evidence that the presumably less survey experienced panelists of a probability-based online panel will answer slower on average than those of an opt-in online panel. Hence, the sampling also affects interview duration. When estimating the overall length and response burden of a survey, more should be taken into account than simply the number of questions. Basing the prediction on a more complex multilevel model has the advantage of providing us with better estimates of the interview duration and the interviewee’s burden. Ultimately, this knowledge should help us to construct better questionnaires that respondents will enjoy answering.
Third, the findings on differences in interview duration for standard computer, tablet, and smartphone users contribute to the emerging field of studies on mobile web surveying (e.g., Buskirk & Andrus, 2012; De Bruijne & Wijnant, 2013; Mavletova, 2013; Peytchev & Hill, 2010; Stapleton, 2013; Wells, Bailey, & Link, 2013). Obviously, answering a web survey that was designed for a standard computer on a smartphone can lead to longer download times, a higher response burden on the respondent, and as a result to a longer interview duration. Moreover, longer actual and subjectively perceived interview duration might be a reason for higher breakoff rates among users of mobile devices, a finding that has been reported in recent research (Buskirk & Andrus, 2012; Mavletova, 2013; Stapleton, 2013). In this regard, our findings are further evidence for the need to fit the design of web surveys to the type of device used by the respondent. However, adjusting the design to different types of devices again poses questions about whether the collected data are comparable across the different designs. These questions have to be addressed in upcoming research. Nevertheless, if we want to estimate the interview duration, we need to know what proportion of the respondents uses mobile devices to answer the web survey and to what extent the design of the survey influences download times and the response burden on smartphones and other mobile devices.
Finally, our study has three limitations. First, we investigated the effects of question formats on interview duration by using aggregate measures of the relative frequency of their use in the surveys. These measures comprise questions with different characteristics and varying complexity. As a consequence, the results on the effects of question formats on interview duration might be subject to the problem of ecological fallacy. However, our findings fit the results of previous research on effects on the item level. Second, all 21 web surveys were on the political attitudes and behavior of German Internet users. Although we investigated the effect of interest in the survey topic on interview duration, we could not examine the impact of differing survey topics on interview duration. Upcoming studies could address this shortcoming by using data from a topically more diverse set of web surveys. The third limitation is that the number of survey-level variables was restricted. Again, we look forward to upcoming research to remedy this shortcoming through a compilation of larger data sets and through further analyses of the complex interactions of factors on the individual and survey level. Eventually, this will enhance our knowledge about interview duration and help us to design better web surveys.
Footnotes
Declaration of Conflicting Interests
The authors declared no potential conflicts of interest with respect to the research, authorship, and/or publication of this article.
Funding
The authors received no financial support for the research, authorship, and/or publication of this article.