
Abstract
The development of new high-strength, lightweight materials for demanding industrial applications is a critical need. This work utilizes advanced technology of selective laser melting (SLM) to manufacture a novel PLA/HDPE/SiO2/GPN nanocomposite, aiming to achieve superior electrical, mechanical, and thermal performance. The influence of key parameters of GPN content, SiO2 content, laser power, and scan rate on the nanocomposite’s properties such as tensile strength, flexural strength, crystallization temperature and electrical conductivity, was examined using Central-Composite response surface methodology (RSM). Thermal and electrical properties were evaluated via TGA, DSC and four-probe test. The microstructure analysis was also performed by scanning electron microscopy (SEM). The incorporation of GPN and SiO2 nanoparticles was found to significantly enhance thermal stability and electrical conductivity. Subsequently, optimization via RSM and desirability function analysis (DFA) estimated the optimal parameters for concurrent improvement of tensile strength and flexural strength as 1.8 wt% GPN, 1.9 wt% SiO2, 16.5 W laser power, and a 2593 mm/s scan rate.
Introduction
Polymer materials are being adopted by a wide range of industries from aerospace to chemical owing to their exceptional strength-to-weight ratio.1,2 A key example is polylactic acid (PLA), which has recently attracted significant interest for its high strength, biocompatibility, biodegradability, and resistance to moisture and fats, making it suitable for packaging, medical, and other applications.3–5 Despite its advantages, PLA has several limitations, such as low heat resistance, poor impact strength, gas permeability, slow degradation, hydrophobicity, and chemical neutrality.6,7 To improve its impact resistance specifically, researchers have attempted to blend PLA with rubbery polymers such as Ethylene Propylene Diene Monomer (EPDM), High-density polyethylene (HDPE), Polyurethane (PU), etc.8–12 Beyond polymer blending, a common method to enhance PLA’s thermal, electrical, and mechanical performance is the incorporation of nano-fillers.13–15 Graphene (GPN) nanoplatelets are among the most popular and widely studied options for this purpose. Their suitability stems from a suite of remarkable properties, including a large surface area, high thermal and electrical conductivity, a good elastic modulus, and excellent intrinsic mobility.16–18 Previous studies confirm that integrating graphene (GPN) into a PLA matrix significantly enhances the composite’s thermal, mechanical, rheological, and electrical properties.19–22 Paradoxically, studies also show that while GPN improves some mechanical features, it can simultaneously reduce others, such as impact strength,23,24 tensile strength,25,26 and elastic modulus. 27 Consequently, the concept of using hybrid nano-fillers in polymer composites has been introduced to improve mechanical properties concurrently. For instance, Batakliev et al. 28 demonstrated that a combination of graphene (GPN) and CNTs in PLA yielded better hardness and elastic modulus than those achieved with CNTs alone. Further supporting the hybrid filler approach, studies have demonstrated concurrent improvements across various properties. Khammassi et al. 29 enhanced the stiffness and elastic modulus of PLA using a combination of silver and graphene (GPN) nanoparticles. Similarly, Nimbagal et al. 30 reported increased tensile and flexural strength in a PLA/epoxy composite by incorporating a blend of 0.2 wt% GPN and 0.3 wt% CNTs. According to Thiyagu et al., 31 incorporating a mixture of 1 wt% ZnO, TiO2, and SiO2 with 5 wt% cardanol oil improved the tensile strength and elongation of a PLA/PBAT blend. Another prominent nano-filler, silicon dioxide (SiO2), is recognized for enhancing the mechanical, electrical, and thermal characteristics of polymers. This is evidenced in polylactic acid (PLA) by Song et al., 32 who found that SiO2 nanoparticles improved its bending, stretching, and thermal performance. In another study, Prapruddivongs et al. 33 observed that SiO2 nanoparticles produced a significant improvements in the PLA’s thermal and mechanical properties. Palma-Ramírez et al. 34 found that the incorporation of 1 wt% SiO2 nanoparticles into PLA optimized morphological, rheological and mechanical properties, while the increase of SiO2 content up to 5 wt% deteriorated the mentioned properties. In a separate study, Dileep et al. 35 indicated that a hybrid filler system containing 0.3 wt% GPN and SiO2 simultaneously increased tensile, flexural strength and fracture toughness of PLA. Morales et al. 36 reported that that the addition of SiO2 nanoparticles decreased the chain mobility and gas permeability of PLA, while it increased Young’s modulus, thermal stability, and viscosity. The positive effect of SiO2 on the performance of PLA has also been reported in other references.37–40 Building on previous studies which demonstrate that hybrid filler systems improve the thermal, electrical and mechanical performance of polymer composites, this work utilizes a combination of graphene (GPN) and silicon dioxide (SiO2). The incorporation of both GPN and SiO2 into PLA enhances its mechanical and thermal properties.23–40
In recent years, the Selective Laser Melting (SLM) process has become a prominent method for fabricating nanocomposites. This preference is attributed to its unique benefits, such as high production speed, the capability to produce parts with intricate designs and superior mechanical properties, minimal waste generation, and the elimination of molds and tools.41,42 Consequently, its use has expanded across critical industries, including automotive, aerospace, military, and medical applications.43–45 Building on this trend, researchers have employed SLM to develop advanced composites for enhanced properties. For instance, Li et al. 46 fabricated CaSiO3/PLA composites to improve compressive strength and modulus, while Xu et al. 47 produced polycaprolactone/polylactic acid/nano hydroxyapatite (PCL/PLA/nHA) ternary composites to investigate their mechanical properties, surface morphology, wettability, and cytocompatibility. The versatility of SLM is highlighted by its use in diverse material systems. For specialized functional applications, Ding et al. 48 fabricated polyether-block-amide elastomer/carbon nanotube (TPAE/CNT) composites, targeting strain sensing and electro-induced shape memory capabilities. Conversely, Kryszak et al. 49 took a fundamental approach, analyzing the effect of SLM process parameters on enhancing the mechanical properties and controlling the degradation rate of polylactic acid (PLA). Further studies highlight unique material applications for SLM process. Odin et al. 50 used recycled nylon powder from SLM waste to create parts reinforced with Mg particles. Elsewhere, Idriss et al. 51 used SLM to create a composite from peanut husk powder (PHP) and polyether sulfone (PES), which showed improved density, impact strength, tensile strength, and dlexural strength. Further advancing SLM methodologies, Demina et al. 52 utilized a specialized variant of the process to fabricate polylactide micro-particles stabilized by a chitosan graft-copolymer for scaffolds. Moving beyond fabrication, Shuai et al. 53 employed thermal post-processing to enhance the surface smoothness of SLM-produced PLA-HA bone scaffolds. In a forward-looking approach, Ulkier 54 integrated artificial intelligence to optimize the thermomechanical properties of PLA/metal composites manufactured via SLM.
The increasing reliance on additive manufacturing to produce polymer nanocomposites is accelerating their integration into new industrial sectors. Parallel to this, investigation into multi-component nanocomposites aimed at enhancing material properties is also growing. However, previous research has been limited by the difficulties of using additive manufacturing to fabricate high-performance quaternary nanocomposites. These fabrication complexities have also impeded the optimization of their properties using combined RSM and desirability function approaches. To fill these research gaps, this study fabricates a novel quaternary PLA/HDPE/SiO2/GPN nanocomposite via the SLS process to simultaneously improve its mechanical, thermal, and electrical properties. The optimization of the SLS process parameters to attain the target nanocomposite characteristics was conducted by employing the response surface methodology (RSM) coupled with the desirability function approach. Following fabrication, the mechanical, thermal, and electrical properties of the nanocomposite were comprehensively characterized. The techniques employed included scanning electron microscopy (SEM) for morphological analysis, differential scanning calorimetry (DSC) and thermogravimetric analysis (TGA) for thermal behavior, and four-point probe testing for electrical conductivity.
Materials and methods
Raw materials
The matrix material, polylactic acid (PLA), was a commercial-grade PLA-3052D supplied by Plastika Kritis S.A. (Greece). This grade has a molecular weight (Mᵥ) of 116,000 g/mol and a melt flow index of 14 g/10 min, measured according to ASTM D1238. The high-density polyethylene (HDPE) modifier, grade DMDA 8007, was sourced from the Dow Chemical Company. It possesses a melt flow rate of 8.3 g/10 min (under 190°C and a 2.16 kg load) and a density of 0.949 g/cm3. The graphene (GPN) nanoplatelets, with a mean surface area of 700 m2/g and a thickness of less than 40 nm, were functionalized with hydroxyl, carboxyl, and ether groups. The silicon dioxide (SiO2) nanoparticles, with an average diameter of 26 nm and a specific surface area of 110 m2/g, were supplied by Kanto Chemical Co. (Tokyo, Japan).
Selective laser melting
A Selective Laser Melting (SLM) system (Model EOS P395, Germany) was employed to fabricate the test specimens. To prepare the composite powder feedstock, the GPN and SiO2 nanoparticles were mechanically blended with the PLA and HDPE matrix powders. This dry mixing was carried out in a cylindrical blender for 70 minutes at a rotational speed of 90 r/min to achieve a uniform distribution of the nano-fillers. The amount of EPDM in the system was 10 wt%. It should be noted that HDPE is a non-polar elastomer, and PLA is polar. Therefore, maleic anhydride (MA-g) was used as a compatibilizer in PLA/HDPE blends. The SLM process was subsequently performed using a CO2 laser with a beam diameter of 250 μm. The processing was conducted under a range of laser power and scan speed parameters to evaluate their effect. The samples were printed horizontally using a cross-scan pattern. Preheating the bed to a temperature close to sintering (145°C) is essential for reducing temperature variations. Throughout the printing process, a scan spacing of 125 μm, a layer thickness of 200 μm, and a bed temperature of 80°C were consistently used.
Experimental design
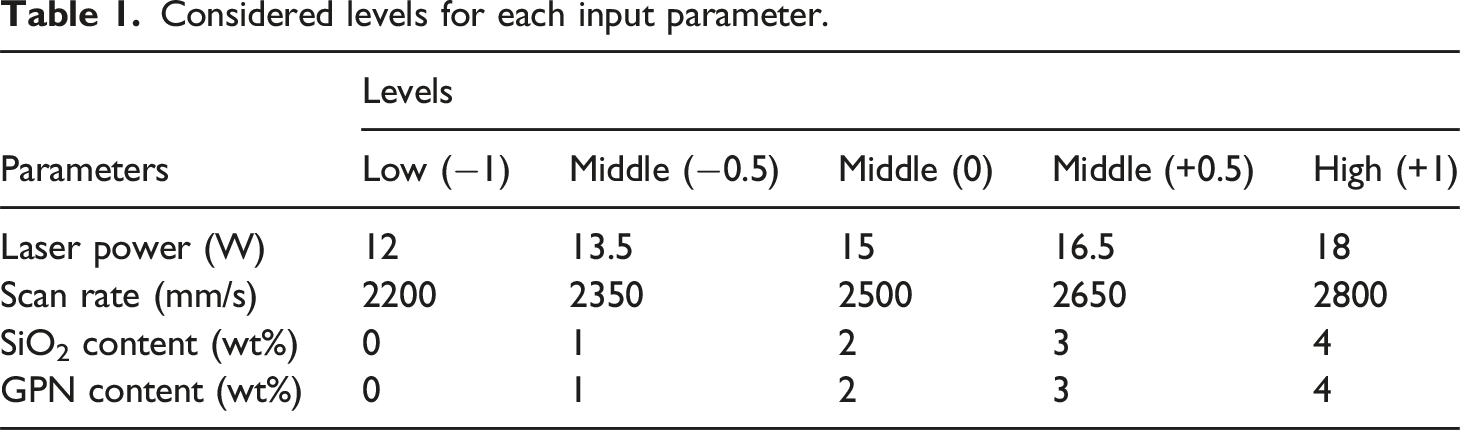
Considered levels for each input parameter.
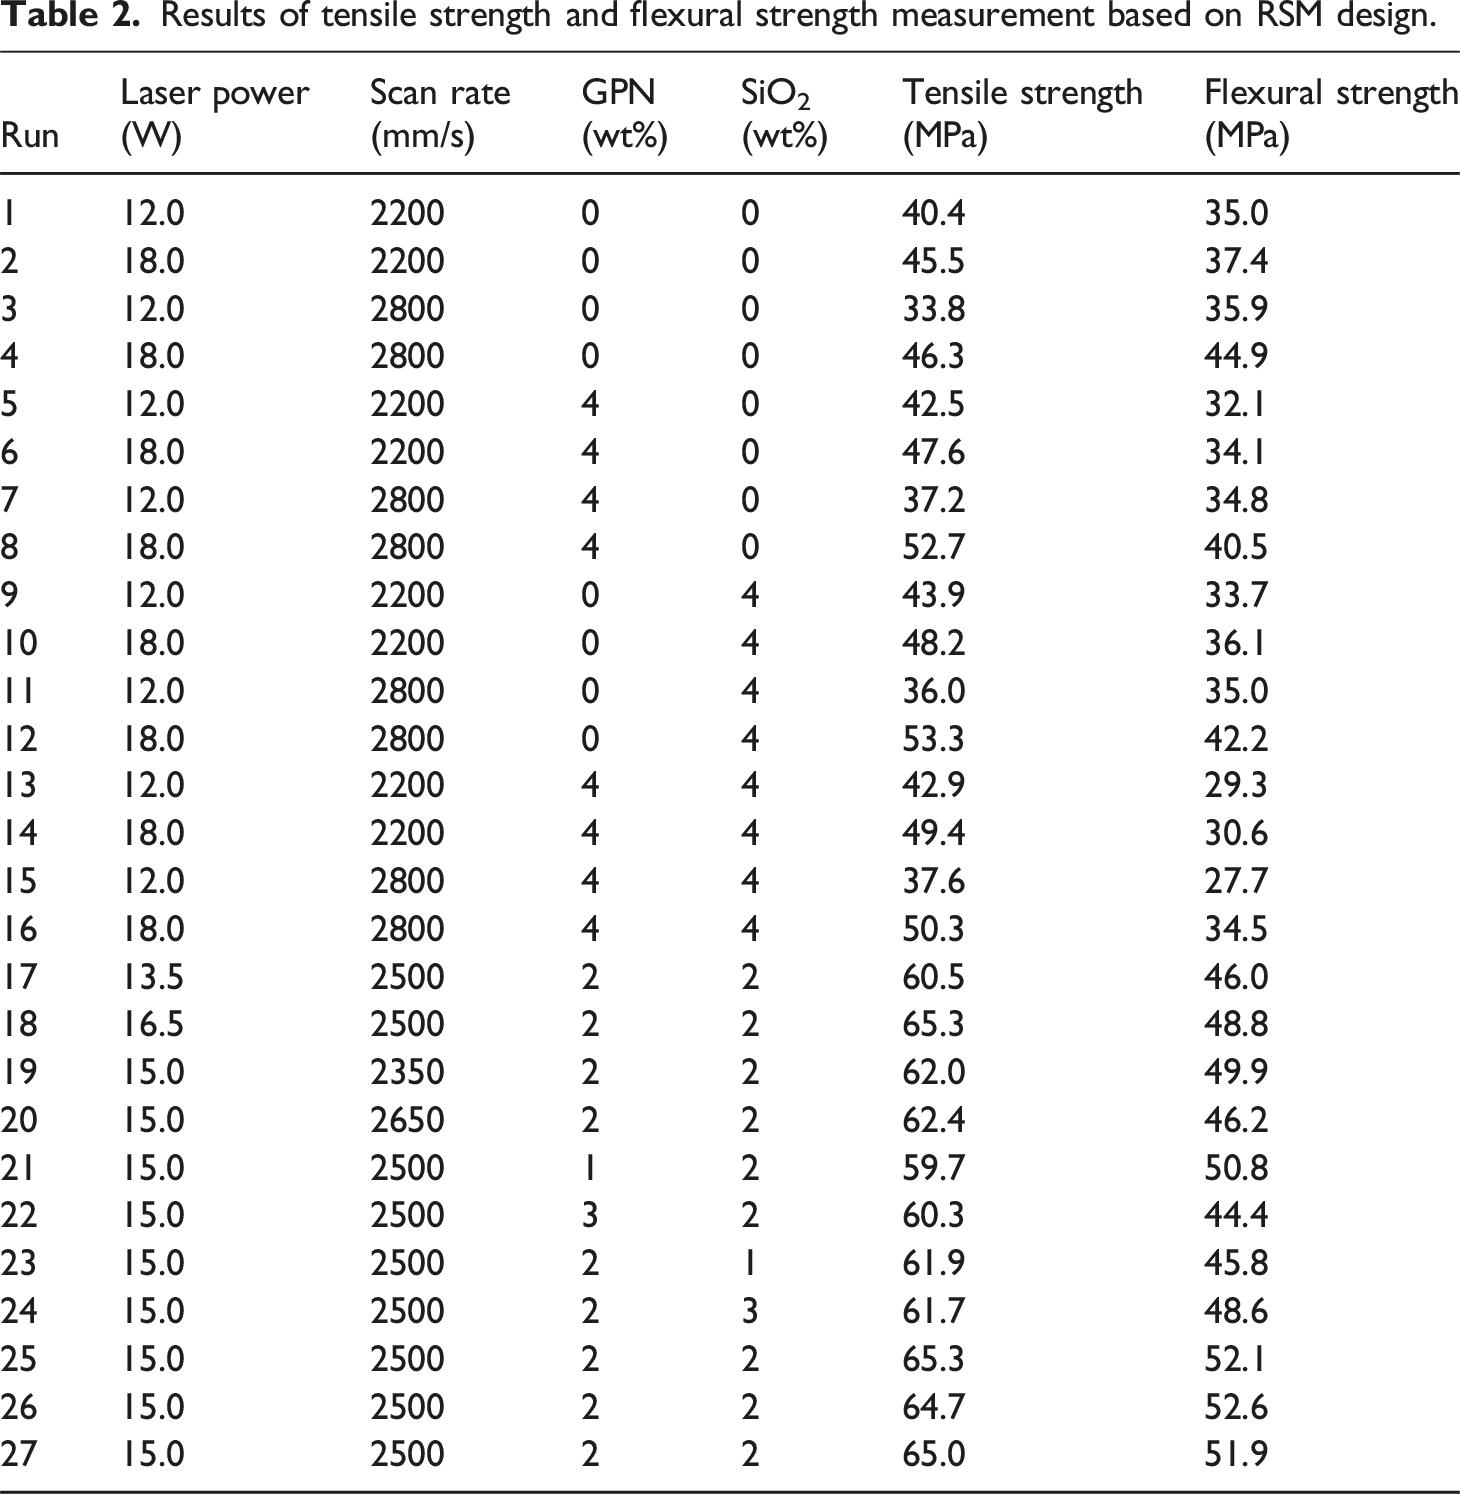
Results of tensile strength and flexural strength measurement based on RSM design.
The process parameters were determined based on prior research46–54 and preliminary feasibility trials. Using a laser power of 12–18 W and a scan speed of 2200–2800 mm/s, while keeping the scan spacing (125 μm) and layer thickness (200 μm) constant, produced an energy density ranging from 0.17 to 0.33 J/mm3. Initial tests revealed that operating outside this range was ineffective: densities below this threshold led to inadequate melting and poor consolidation, while higher densities induced material degradation from excessive heat.
Mechanical properties measurement
The SLM process was used to fabricate specimens for tensile and flexural testing. The tensile specimens were manufactured in accordance with ASTM D-638 standard geometry. Tensile testing was carried out on a Zwick/Roell-Z100 universal testing machine at a constant cross-head displacement rate of 5 mm/min. Similarly, flexural tests were performed as per the ASTM D-790 standard.
Thermal properties measurement
The melting (Tm) and crystallization (Tc) temperatures of the fabricated samples were determined using differential scanning calorimetry (DSC) analysis. Measurements were performed on a Netzsch 200 F3 Maia instrument using a heating and cooling rate of 10°C/min in a nitrogen environment. The test was performed between 20 and 200°C, by applying a heat-cool-heat cycle. The degree of crystallinity (X
c
) was subsequently determined from the thermal data according to Equation (1).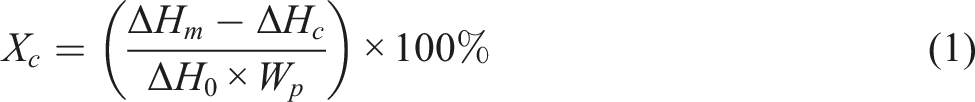
Electrical properties measurement
A four-point probe electrical conductivity meter (Suragus, Germany) was employed to measure the electrical resistance of the fabricated samples under ambient conditions (25°C, 55% RH). The electrical resistivity, ρ, was derived from the measured resistance R using the fundamental relationship ρ = RA/L, with A representing the cross-sectional area and L denoting the sample thickness, in accordance with the standard method cited in 55 .
Microstructure examination
Sample microstructure was characterized by scanning electron microscopy (SEM) on a VEGA-TESCAN-XMU instrument. Prior to imaging, the specimens were prepared by cryofracturing in liquid nitrogen to expose a clean fracture surface. To ensure electrical conductivity and prevent charging, the fractured surfaces were sputter-coated with a gold layer employing an Agar Scientific B7340 system (United Kingdom).
Results and discussion
Thermal analysis
To characterize the thermal behavior of the PLA/HDPE/SiO2/GPN nanocomposite, Differential Scanning Calorimetry (DSC) was utilized. The obtained DSC thermogram is presented in Figure 1. The corresponding data, including the melting temperature, crystallization temperature, and degree of crystallinity, are compiled in Table 3. Results of DSC analysis for PLA/HDPE/SiO2/GPN. Thermal properties of PLA/HDPE/SiO2/GPN nanocomposites obtained by DSC test.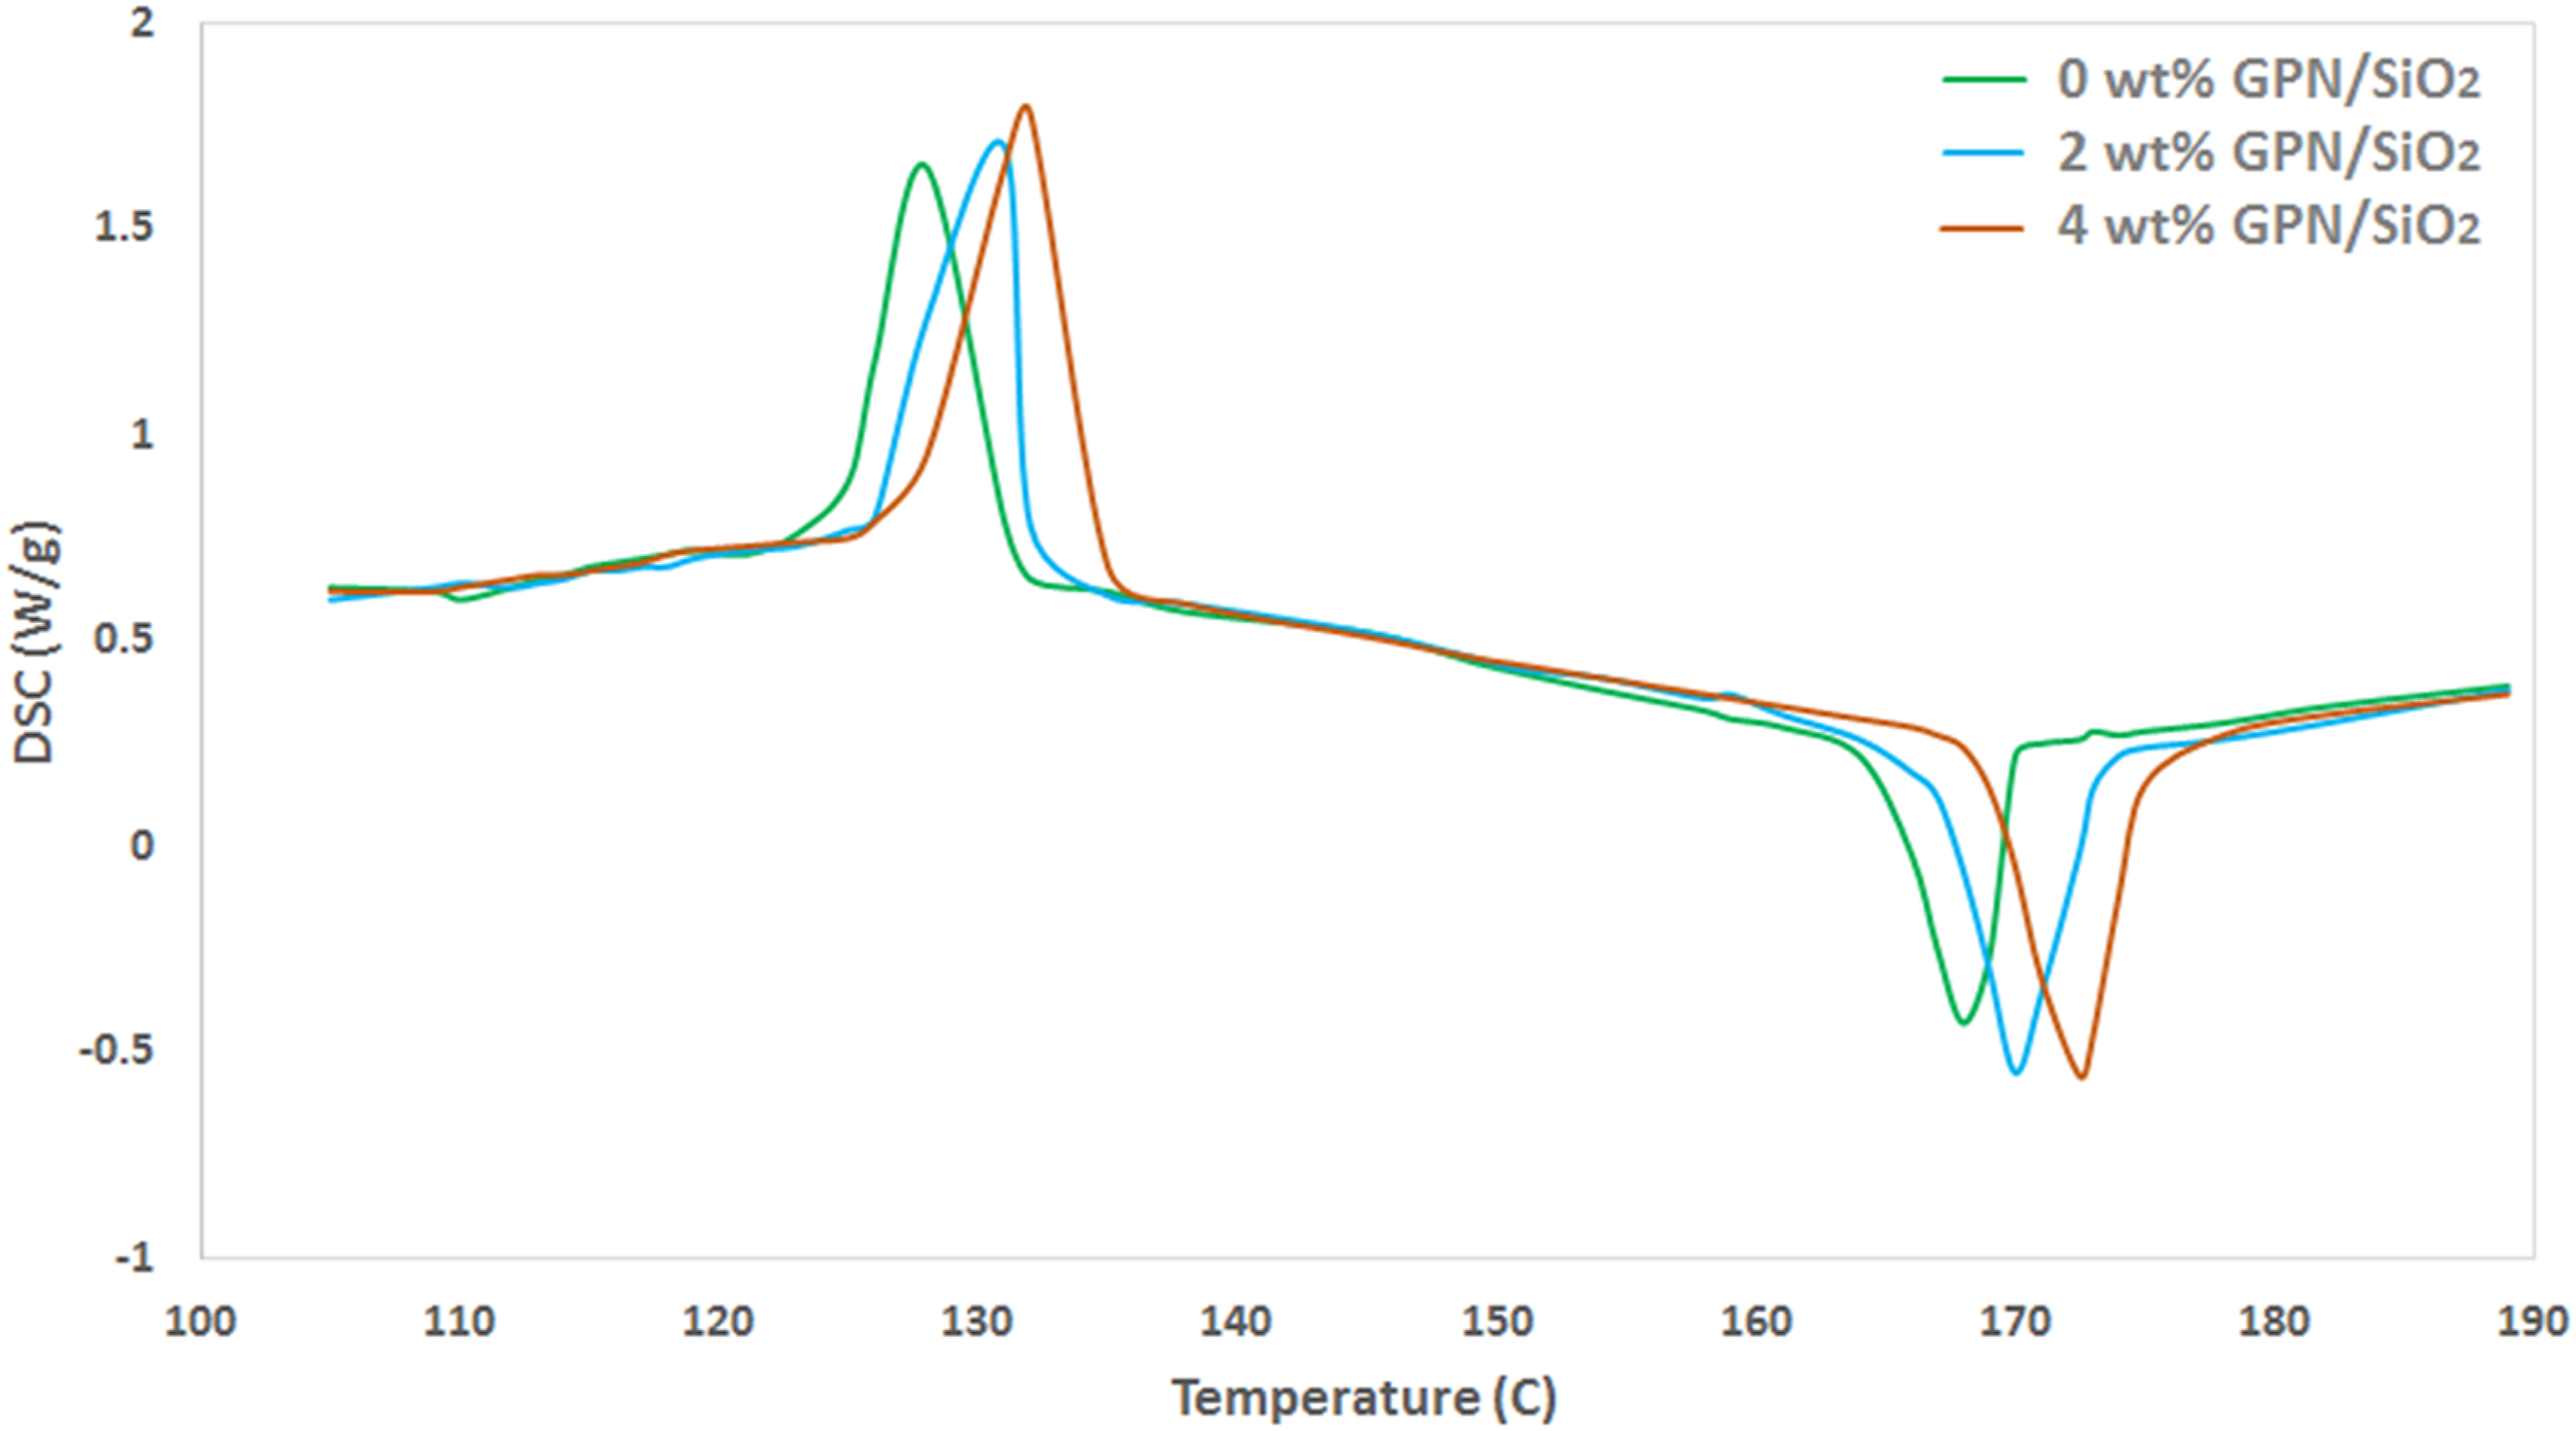
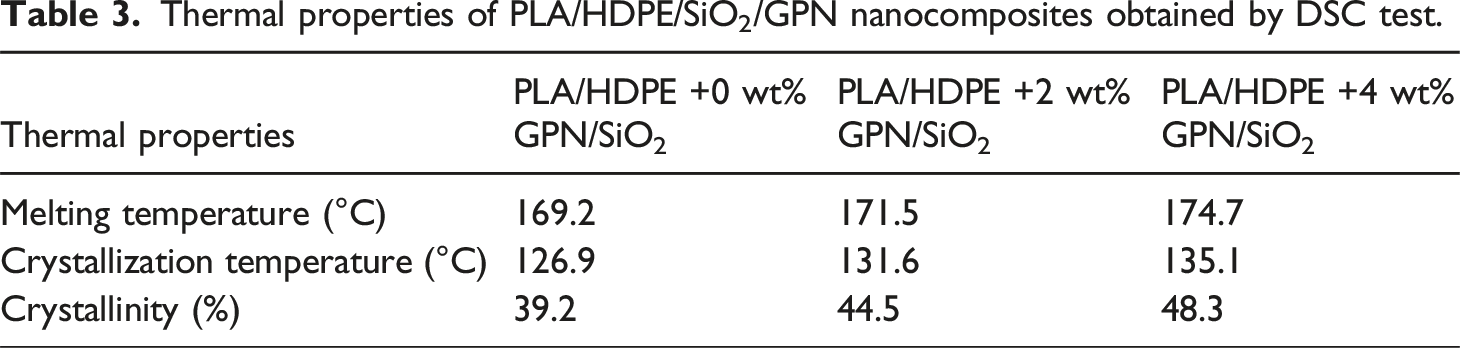
The DSC thermogram in Figure 1 reveals a single endothermic melting peak at 169.2°C for PLA, which indicates an α-crystalline structure. This unimodal peak that indicates the formation of exclusively stable crystals via homogeneous nucleation during cold crystallization, 56 is also observed in the PLA/HDPE/SiO2/GPN nanocomposite. The persistence of a single peak in the nanocomposite is attributed to the role of GPN and SiO2 nanoparticles in facilitating the formation of PLA crystals with uniform thickness. 56
It can be seen from Table 3 that the addition of GPN and SiO2 nanoparticles into PLA improves the melting and crystallization temperatures of the PLA/HDPE/SiO2/GPN nanocomposite. This thermal stabilization is primarily caused by the nucleation effect of the nanoparticles, which generates more stable crystal nuclei, 56 coupled with their role in absorbing heat. The shift in melting temperatures signifies improved thermal stability without affecting PLA’s molecular weight, confirming the efficacy of GPN and SiO2 as nucleating agents. This role is further evidenced by a measured increase in the material’s percentage crystallinity.
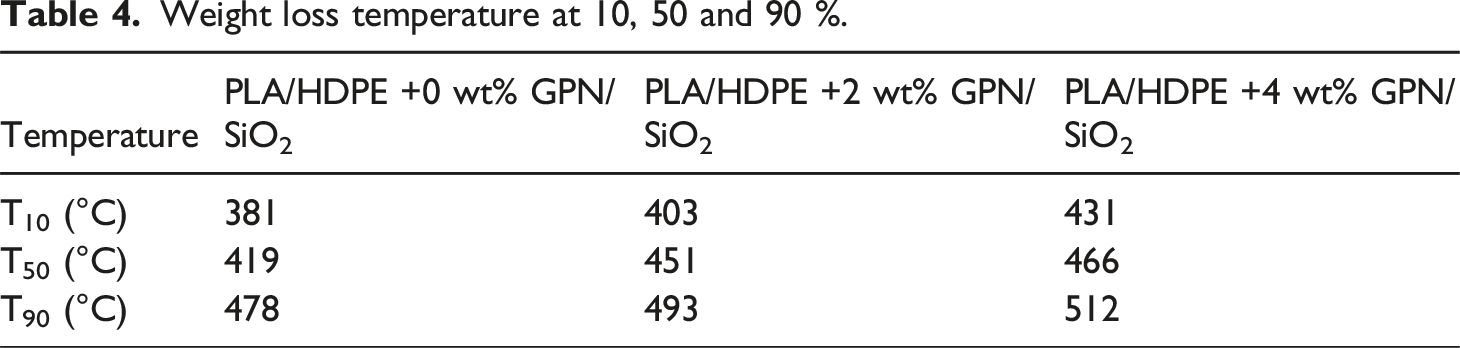
To further probe the thermal properties of the PLA/HDPE/SiO2/GPN nanocomposite, thermogravimetric analysis (TGA) was conducted up to 600°C, as shown in Figure 2. TGA results for PLA/HDPE/SiO2/GPN nanocomposite.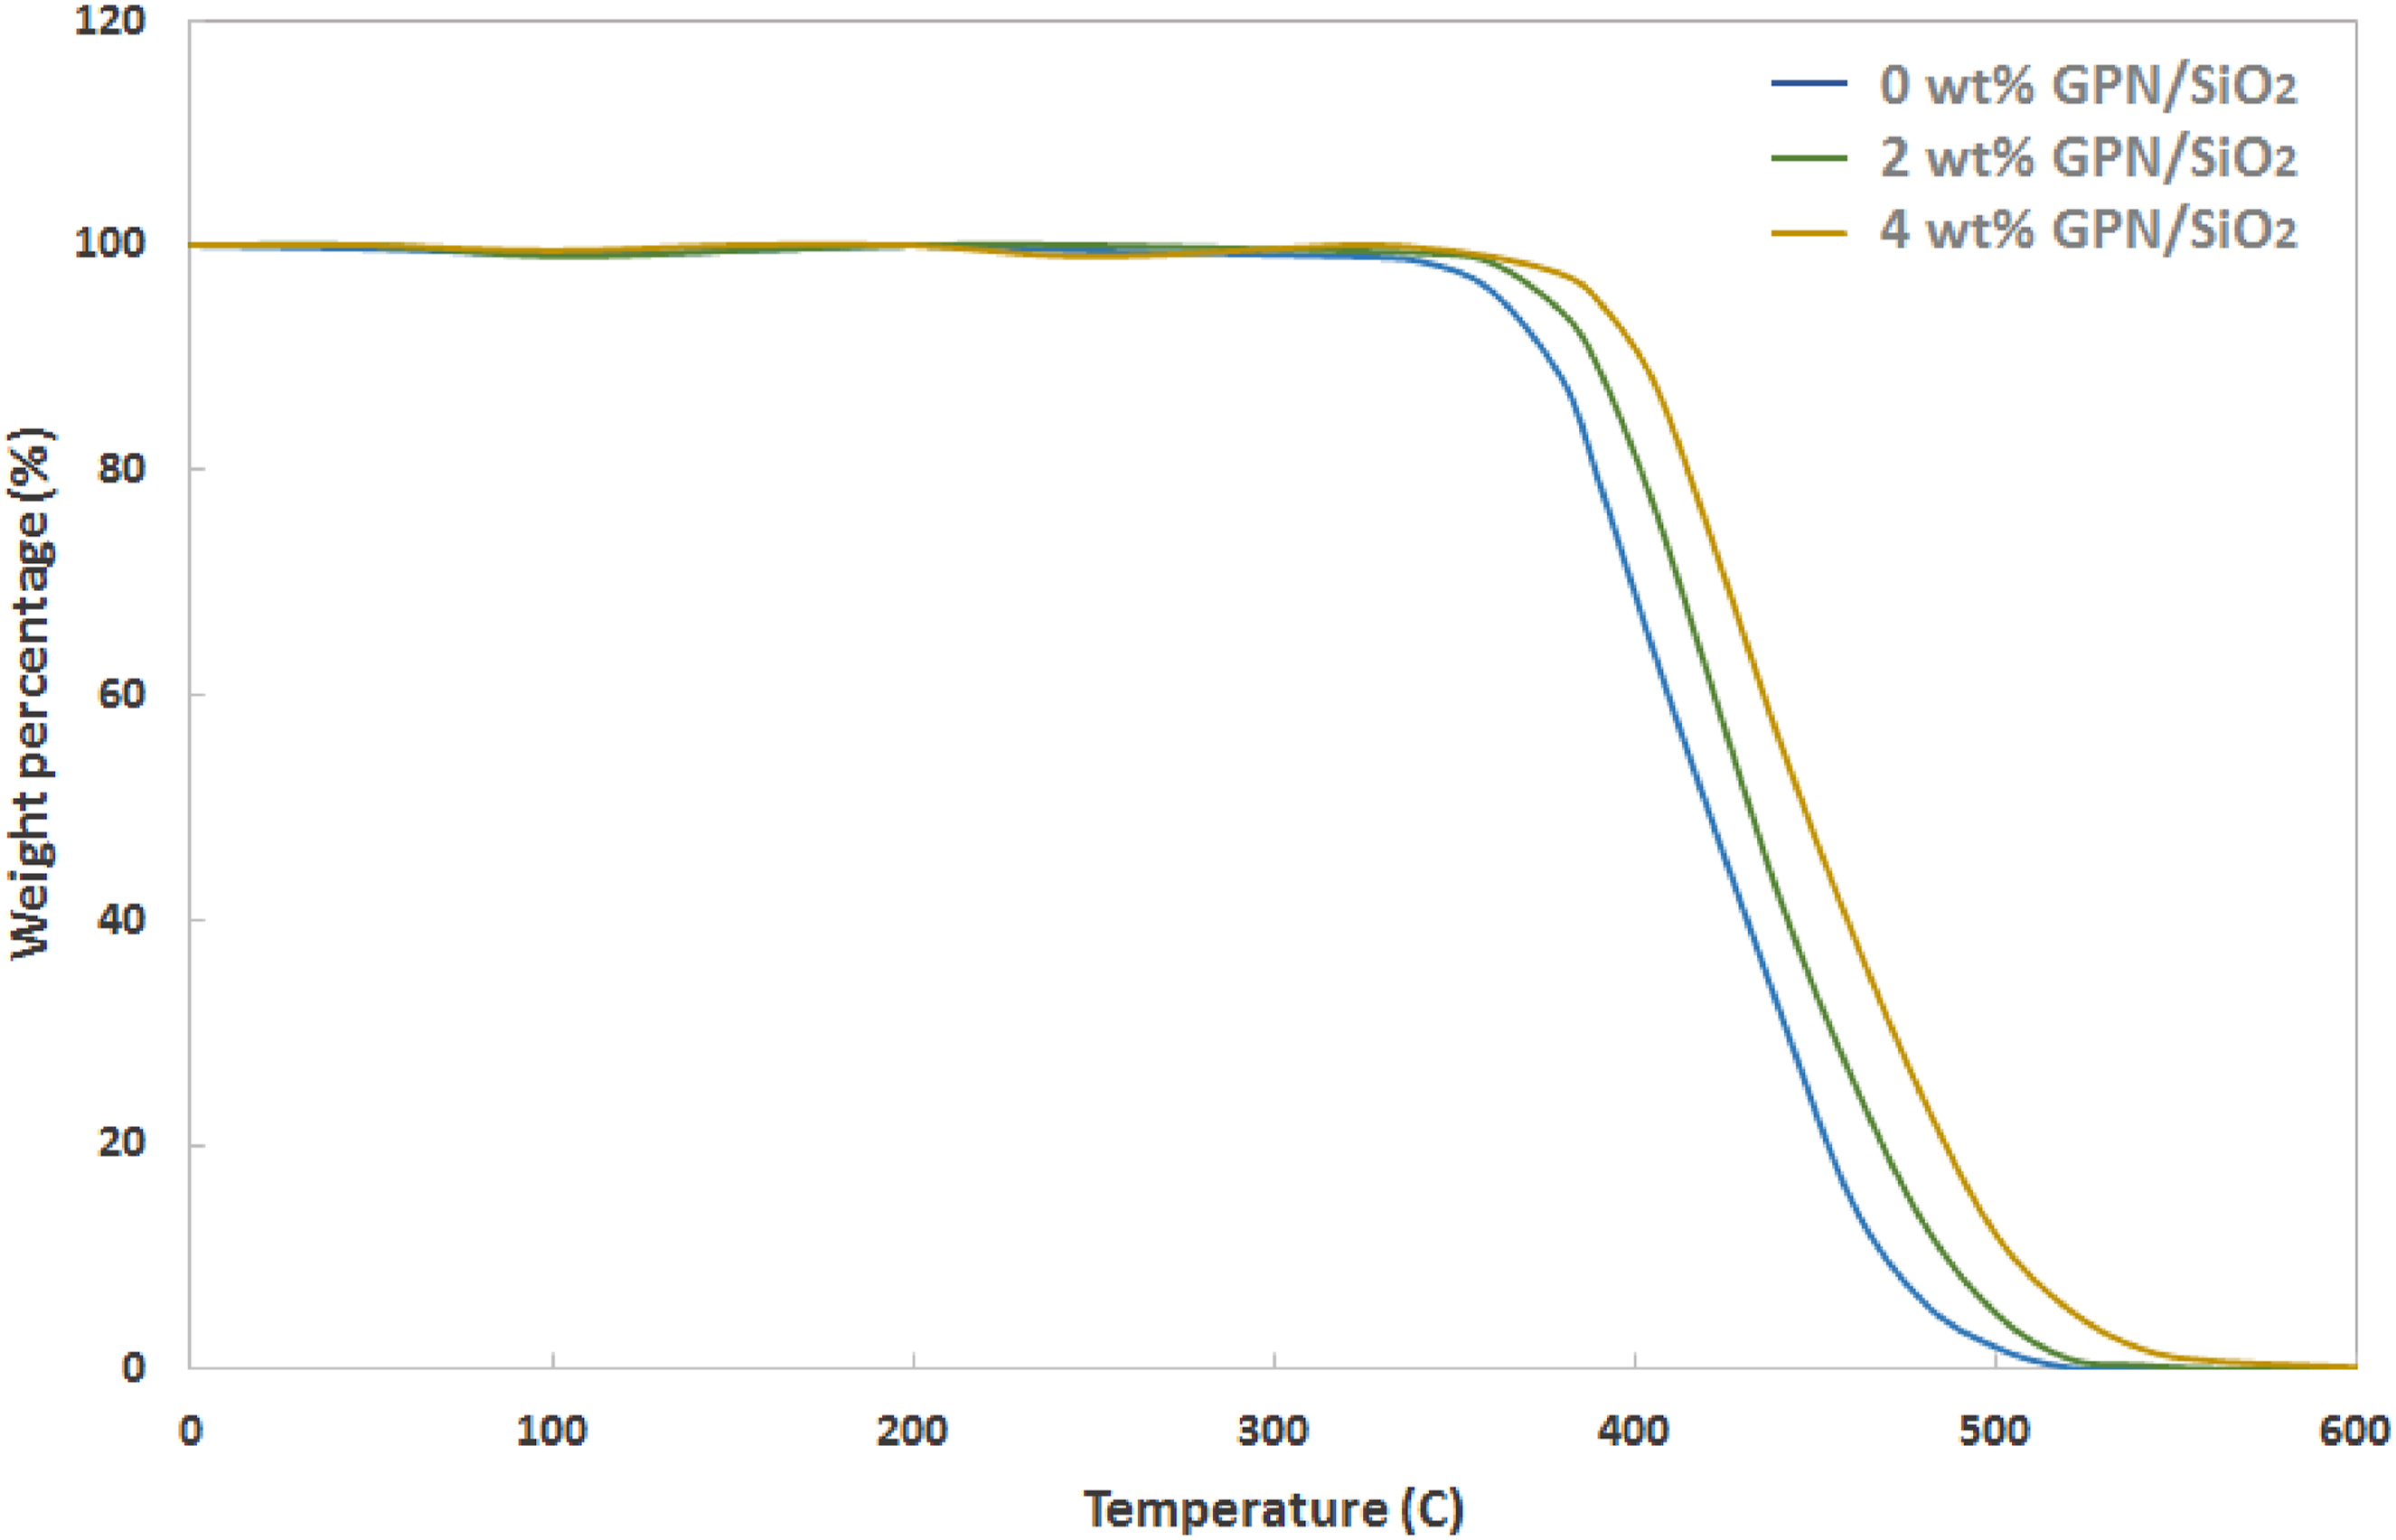
The findings reveal that the inclusion of GPN and SiO2 nanoparticles significantly improved the thermal stability of the PLA matrix. This was evidenced by a rise in the onset decomposition temperature from 332°C in pure PLA to 367°C in the nanocomposite. This improvement is attributed to nanoparticles restricting polymer chain mobility and creating a barrier effect. This barrier impedes the diffusion of volatile degradation products by prolonging their escape path, thereby increasing the decomposition temperature. 25
Weight loss temperature at 10, 50 and 90 %.
Microstructural evolutions
The microstructure of the sintered parts was analyzed to assess the dispersion of nanoparticles within the PLA/HDPE/SiO2/GPN nanocomposite and to evaluate the quality of the manufacturing process. Figure 3 shows the fracture surfaces of tensile test specimens containing varying loadings of GPN and SiO2. The analysis of fracture surfaces reveals a clear correlation between nanoparticle dispersion and mechanical performance. Pure PLA exhibits a smooth, featureless morphology, indicative of brittle fracture (Figure 3(a)). The incorporation of 2 wt% GPN and SiO2 results in a well-dispersed morphology (Figure 3(b)). The high interfacial surface area of these finely dispersed nanoparticles enables effective stress transfer from the PLA matrix to the reinforcements, thereby increasing the nanocomposite’s strength.57,58 In contrast, at a higher loading of 4 wt%, significant nanoparticle agglomeration is observed (Figure 3(c)). These aggregates act as stress concentration points and microstructural defects, which initiate failure and are consequently detrimental to the overall mechanical performance. Fracture surface of nanocomposite for (a) GPN = 0 wt%, SiO2 = 0 wt%, (b) GPN = 2 wt%, SiO2 = 2 wt%, (c) GPN = 4 wt%, SiO2 = 4 wt%.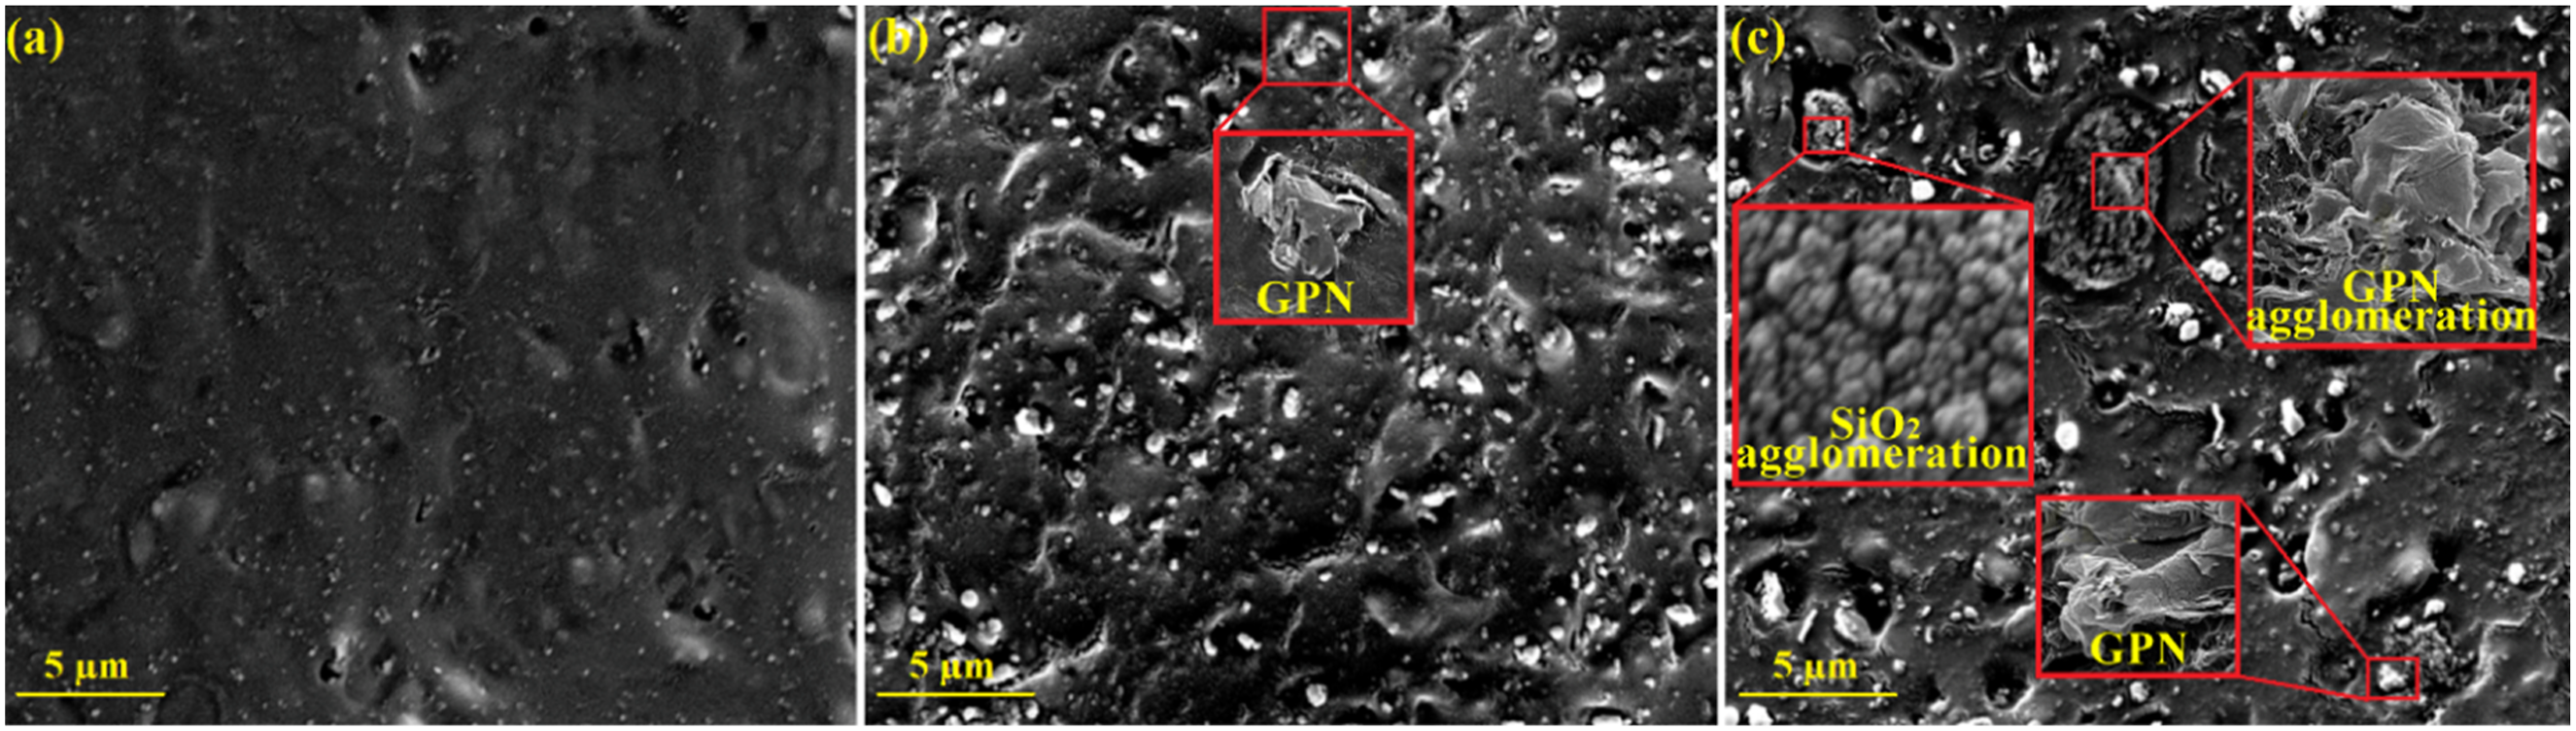
The influence of varying laser power on the microstructure of PLA/HDPE/SiO2/GPN nanocomposite is depicted in Figure 4. It can be seen from Figure 4(a) that a laser power of 12 W provides inadequate thermal energy, resulting in partially unmelted powder within the microstructure of PLA/HDPE/SiO2/GPN nanocomposite. This energy deficit prevents full densification and, as a consequence, induces the formation of cracks. These defects are expected to compromise the material’s mechanical properties. At a higher laser power of 15 W, the increased thermal energy reduced the prevalence of unmelted PLA/HDPE particles and improved the densification of the nanocomposite, as evidenced in Figure 4(b). Optimal results were achieved at 18 W (Figure 4(c)), where the microstructure was completely free of unmelted particles and cracks. This elimination of defects culminated in excellent densification and strong particle adhesion. Fracture surface of nanocomposites for laser power of (a) 12, (b) 15 and (c) 18 W.
The influence of the laser scanning rate on microstructure is presented in Figure 5. A low rate of 2200 mm/s results in a high cavity content, compromising densification (Figure 5(a)). An optimal rate of 2500 mm/s minimizes these cavities and maximizes densification (Figure 5(b)). Conversely, an excessively high rate of 2800 mm/s provides insufficient energy input, leading to unmelted powder and cavity formation, which consequently reduces densification (Figure 5(c)). Fracture surface of nanocomposites for scan rate of (a) 2200, (b) 2500 and (c) 2800 mm/s.
The interaction between laser power and scanning rate is critical for optimal microstructure, as shown in Figure 6. The combination of low laser power (12 W) and high scanning rate (2800 mm/s) delivers inadequate energy, leading to high porosity, unmelted particles, and consequently, severely compromised solidification (Figure 6(a)). In contrast, the high energy input from a high laser power (18 W) and low scanning rate (2200 mm/s) causes excessive heat, resulting in thermal deterioration and crack formation (Figure 6(b)). Fracture surface of nanocomposites for (a) laser power = 12 W, scan rate = 2800 mm/s, (b) laser power = 18 W, scan rate = 2200 mm/s.
Electrical analysis
Figure 7 presents the volume conductivity of sintered nanocomposites with varying nanoparticle content. The base PLA/HDPE composite exhibited low electrical conductivity (0.23 S/m), characteristic of an insulating material. The incorporation of GPN and SiO2 nanoparticles significantly enhanced this property, with a 2 wt% loading increasing conductivity to 0.48 S/m. However, a further increase to 4 wt% yielded only a marginal improvement to 0.54 S/m, indicating diminishing returns in conductivity enhancement at higher nanoparticle concentrations. This increase in volume conductivity originates from the high electrical conductivity of the GPN and SiO2 nanoparticles. These particles created a percolating network throughout the insulating PLA matrix, establishing stable conductive pathways that meet the requirements for functional applications. The diminished returns observed at the higher loading (4 wt%) can be attributed to agglomeration effects. This agglomeration leads to inhomogeneous dispersion of nanoparticles that compromised interfacial adhesion with the polymer matrix and prevented optimal network formation.59,60 Volume conductivity of sintered samples with different percentages of nanoparticles.
Mechanical properties analysis
Analysis of variance
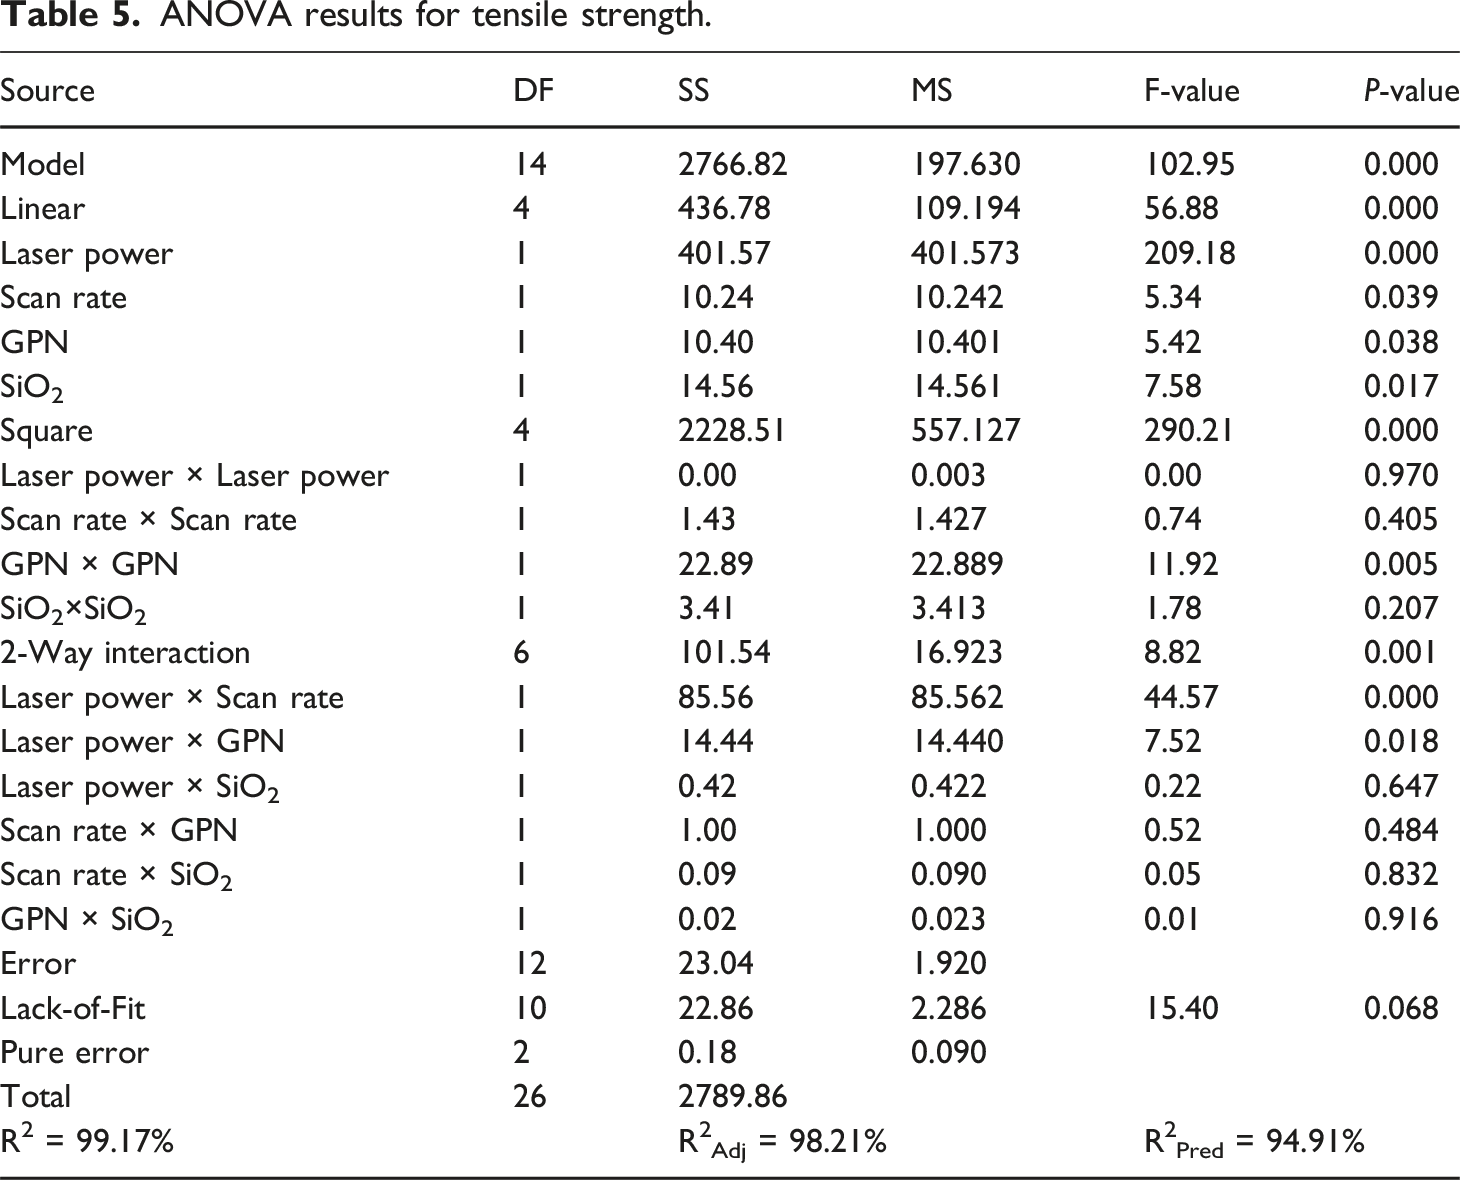
ANOVA results for tensile strength.
ANOVA results for flexural strength.
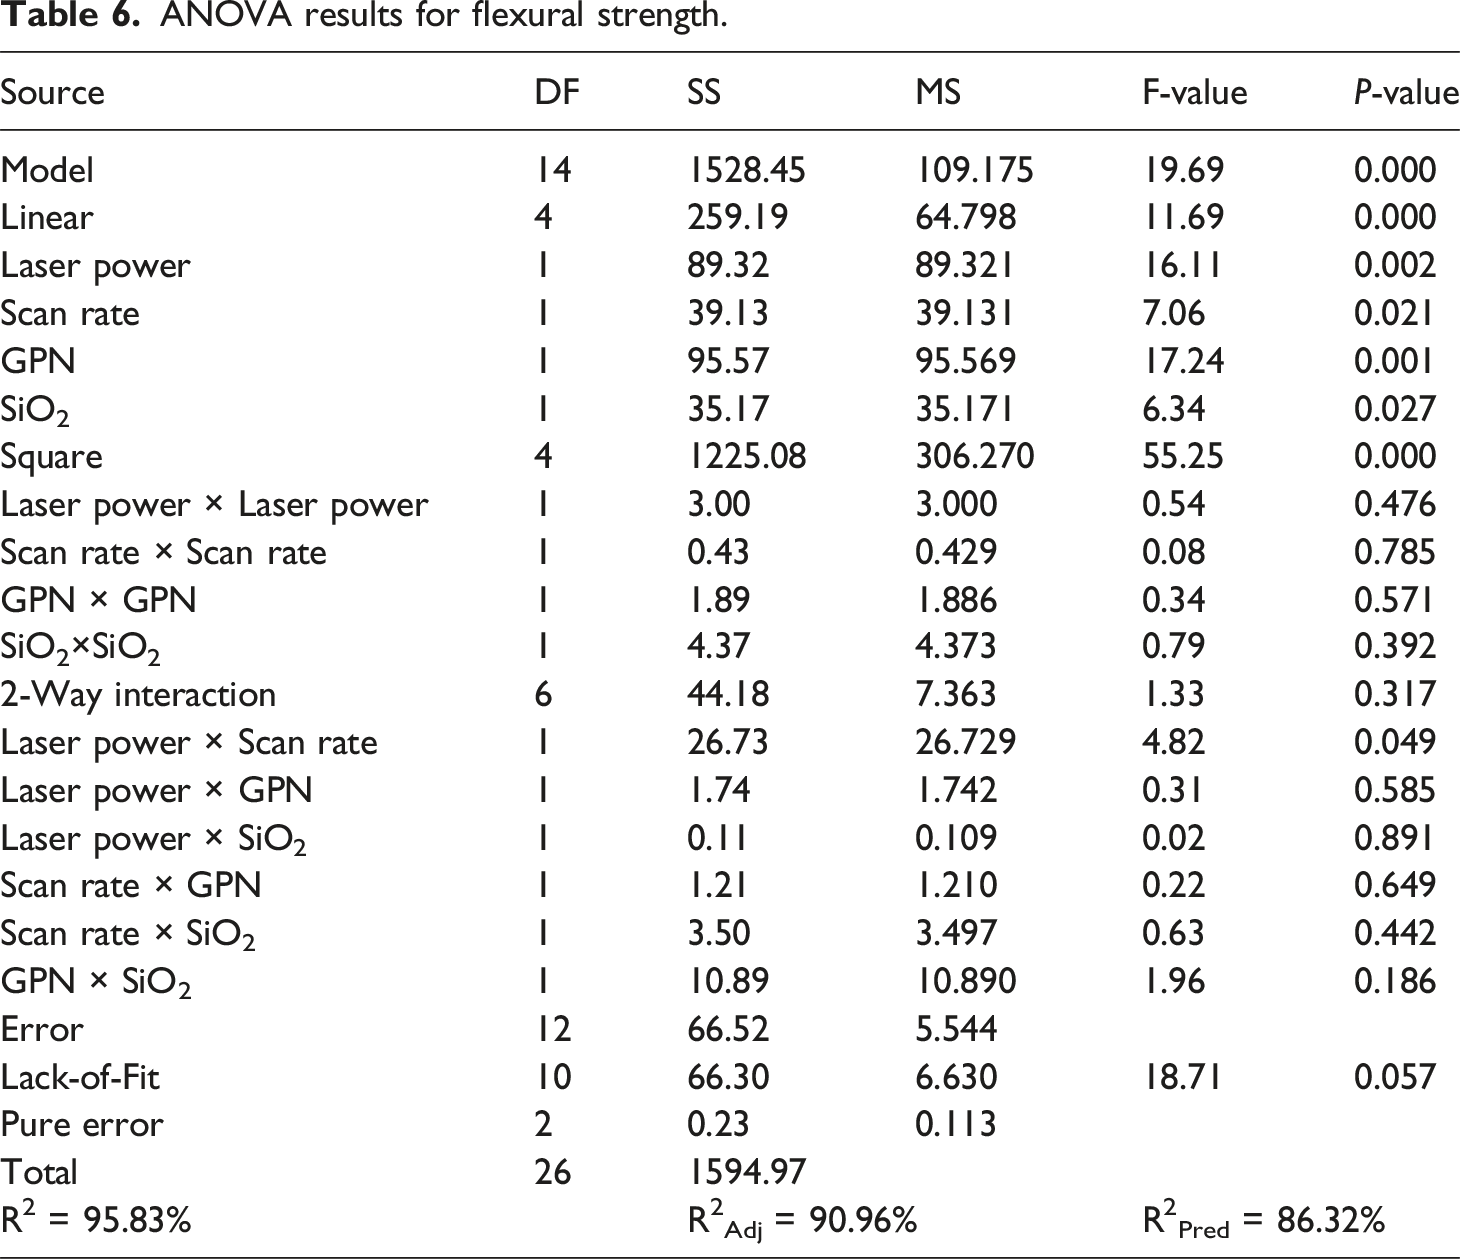
The model’s accuracy was validated by the R 2 , R 2 Adj and R 2 Pred values presented in the ANOVA tables. Values for these metrics near 100% indicate a model with excellent predictive power. The high values reported in Tables 5 and 6 demonstrate that the models for tensile strength and flexural strength are both accurate and reliable for predicting the responses.
Single Effect of parameters on the Mechanical Properties
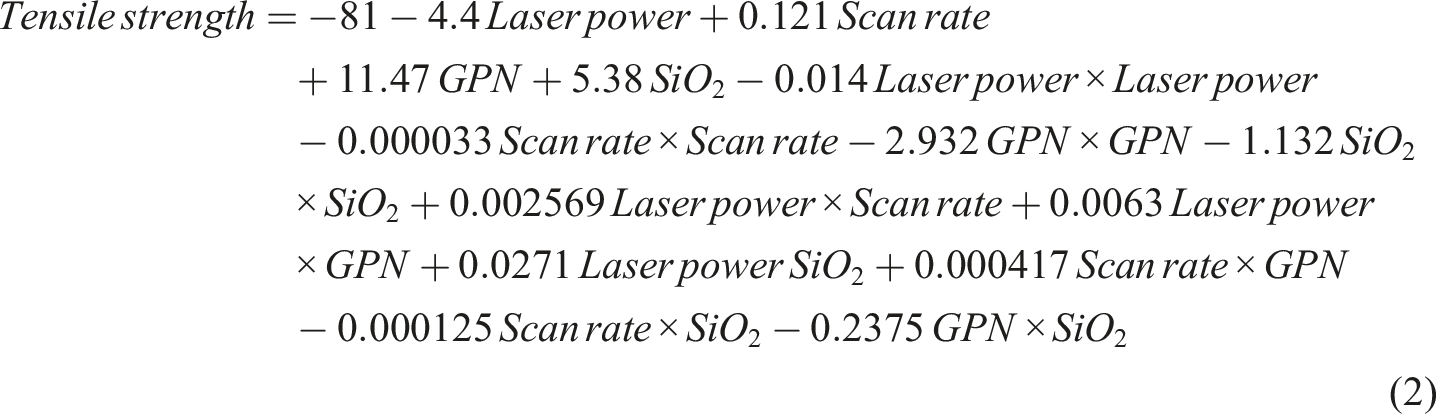
Figure 8 illustrates the single effect of parameters on tensile strength and flexural strength. As shown in Figure 8(a), increasing the laser power from 12 to 18 W enhanced tensile strength by approximately 16%. This improvement aligns with microstructural observations in Figure 4, where incomplete melting at 12 W, evidenced by residual polymer particles on fracture surfaces, led to poor densification due to insufficient energy input. Consequently, the lower tensile strength at 12 W is attributed to inadequate densification from low laser power. In contrast, at 18 W, improved densification resulted in higher tensile strength, consistent with findings in prior studies.46,47,61,62 The influence of scan rate on tensile strength is non-linear, as shown in Figure 8(a). An increase from 2200 to 2500 mm/s yielded a modest 3.5% improvement, but a further increase to 2800 mm/s caused a 6.5% reduction. This trend is explained by the microstructural analysis in Figure 5. The scan rate of 2500 mm/s produced a well-densified microstructure with minimal defects (Figure 5(b)), leading to higher strength. Deviating from this optimum, either to a slower 2200 mm/s or a faster 2800 mm/s, resulted in incomplete densification and a proliferation of defects such as cracks and cavities (Figure 5(a) and (c)), which consequently impaired the tensile strength. The results obtained are consistent with those reported in61–63. In the case of nanoparticle effects in Figure 8(a), a 2 wt% loading represents the optimum concentration for both GPN and SiO2 nanoparticles, resulting in tensile strength improvements of 30% and 10.5%, respectively. This significant enhancement is attributed to the homogeneous dispersion of nanoparticles observed in the SEM micrographs (Figure 3(b)). A uniform distribution is critical as it enables efficient load transfer from the softer PLA/HDPE matrix to the stronger, stiffer nanoparticles. Single effects of parameters on (a) tensile strength and (b) flexural strength.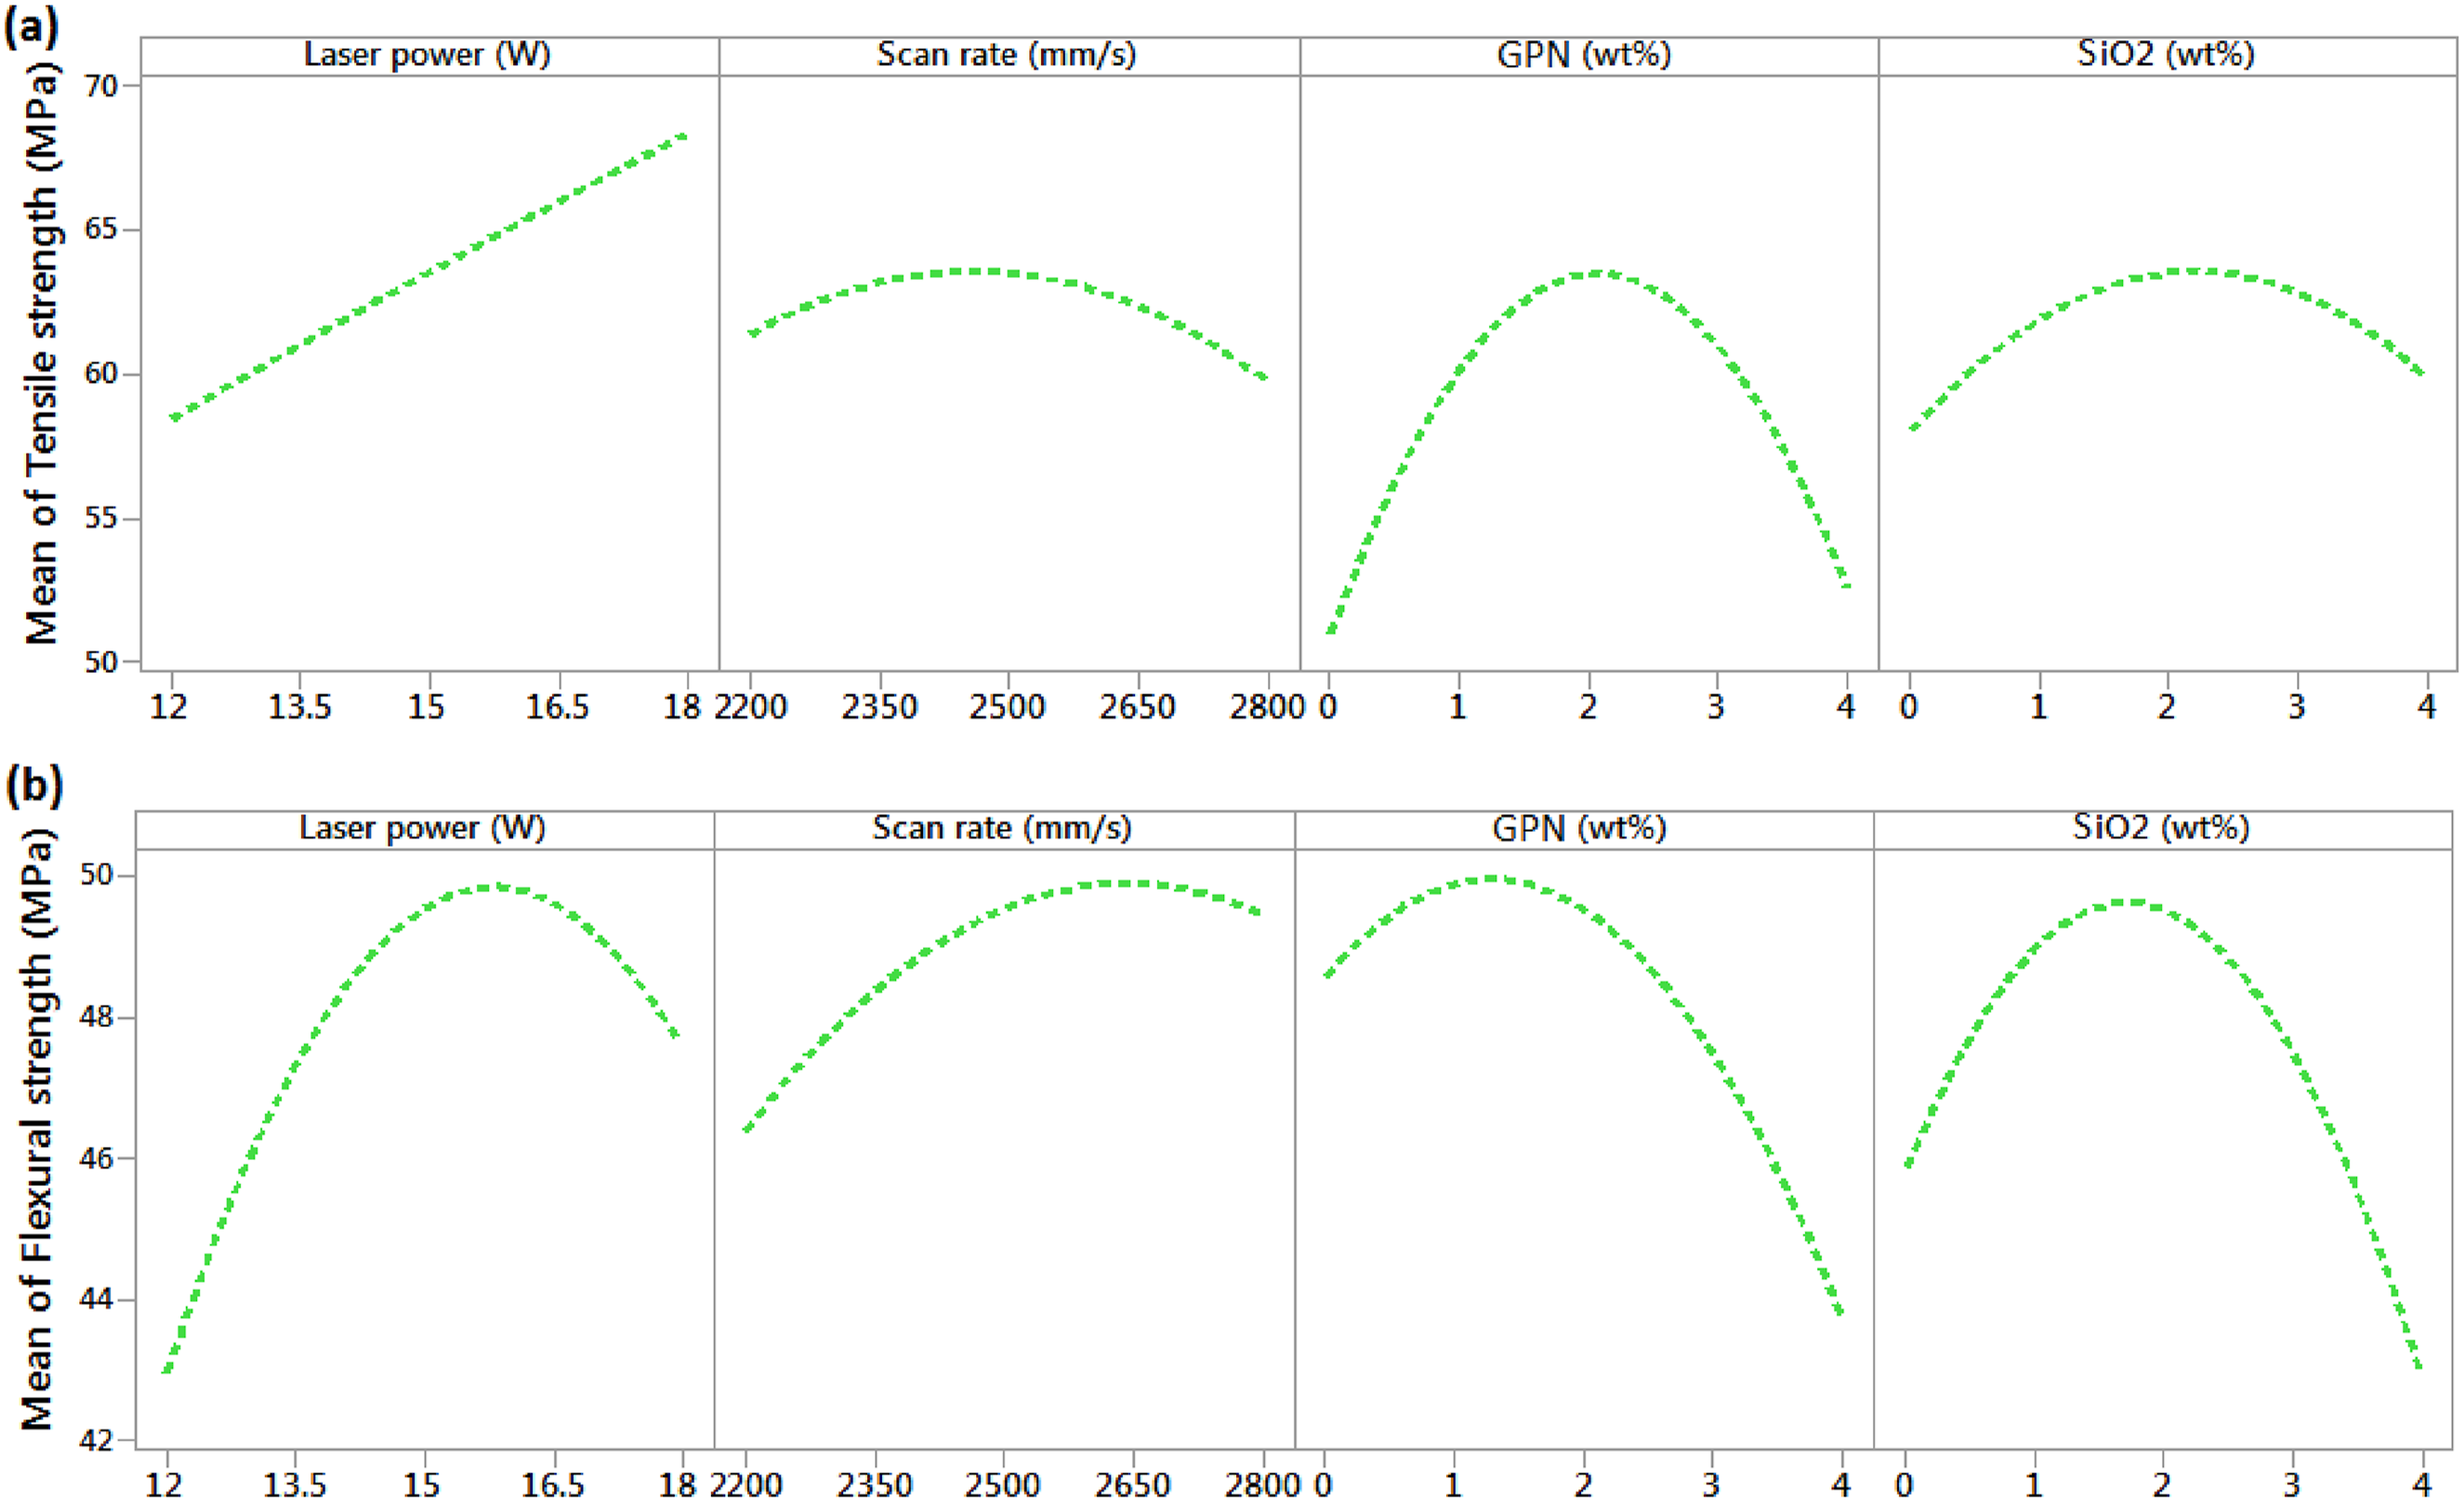
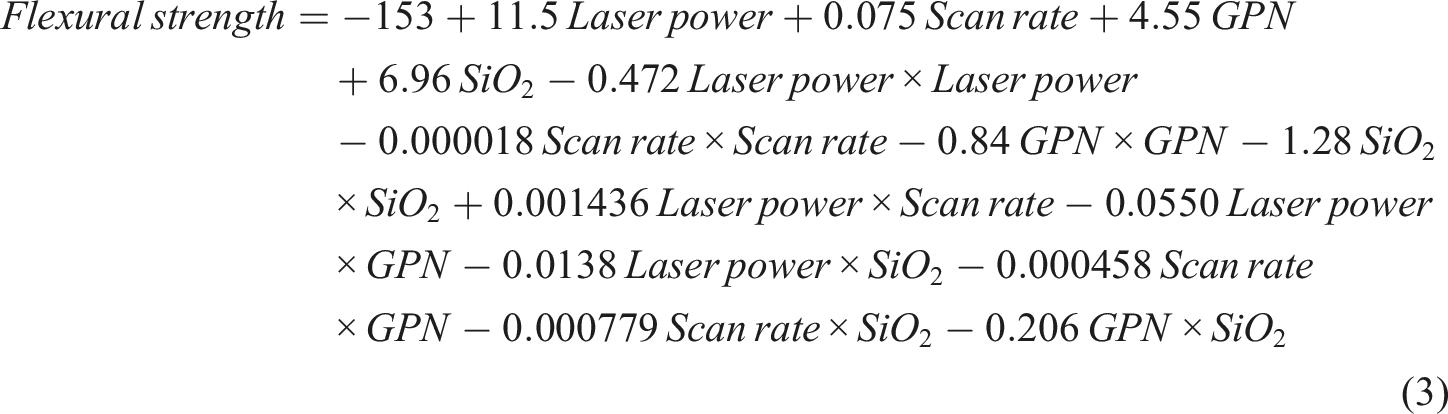
Figure 9(b) shows that the optimal flexural strength for the nanocomposite occurred within a laser power range of 15 to 16.5 W, resulting in a 17% increase compared to the value at 12 W. The subsequent reduction in flexural strength observed at the higher power of 18 W is likely caused by thermal degradation mechanisms, such as the development of microcracks or residual stresses, due to the excessive thermal energy input. Similar results were also reported in 46,47,61,62. As also evidenced in Figure 8(b), flexural strength improved by 8% as the scan rate increased from 2200 to 2650 mm/s but declined slightly (1%) at 2800 mm/s. The optimal performance observed at intermediate scan rates (2500-2650 mm/s) is attributed to superior densification and a reduction in crack formation within the microstructure. As illustrated in Figure 8(b), flexural strength peaks at a GPN concentration of 1 to 2 wt%, a result of the nanoparticles’ optimal dispersion within this range (Figure 3(b)). A further increase to 4 wt%, however, leads to a significant decline in flexural strength. This reduction is attributed to GPN agglomeration (Figure 3(c)), which creates stress concentration sites. A SiO2 content of 2 wt% resulted in the highest flexural strength due to its superior nanoparticle dispersion (Figure 3(b)). Conversely, the decline in flexural strength observed at 4 wt% was attributed to the agglomeration of SiO2 nanoparticles (Figure 3(c)). Interaction effects of parameters on (a, b) tensile strength and (c) flexural strength.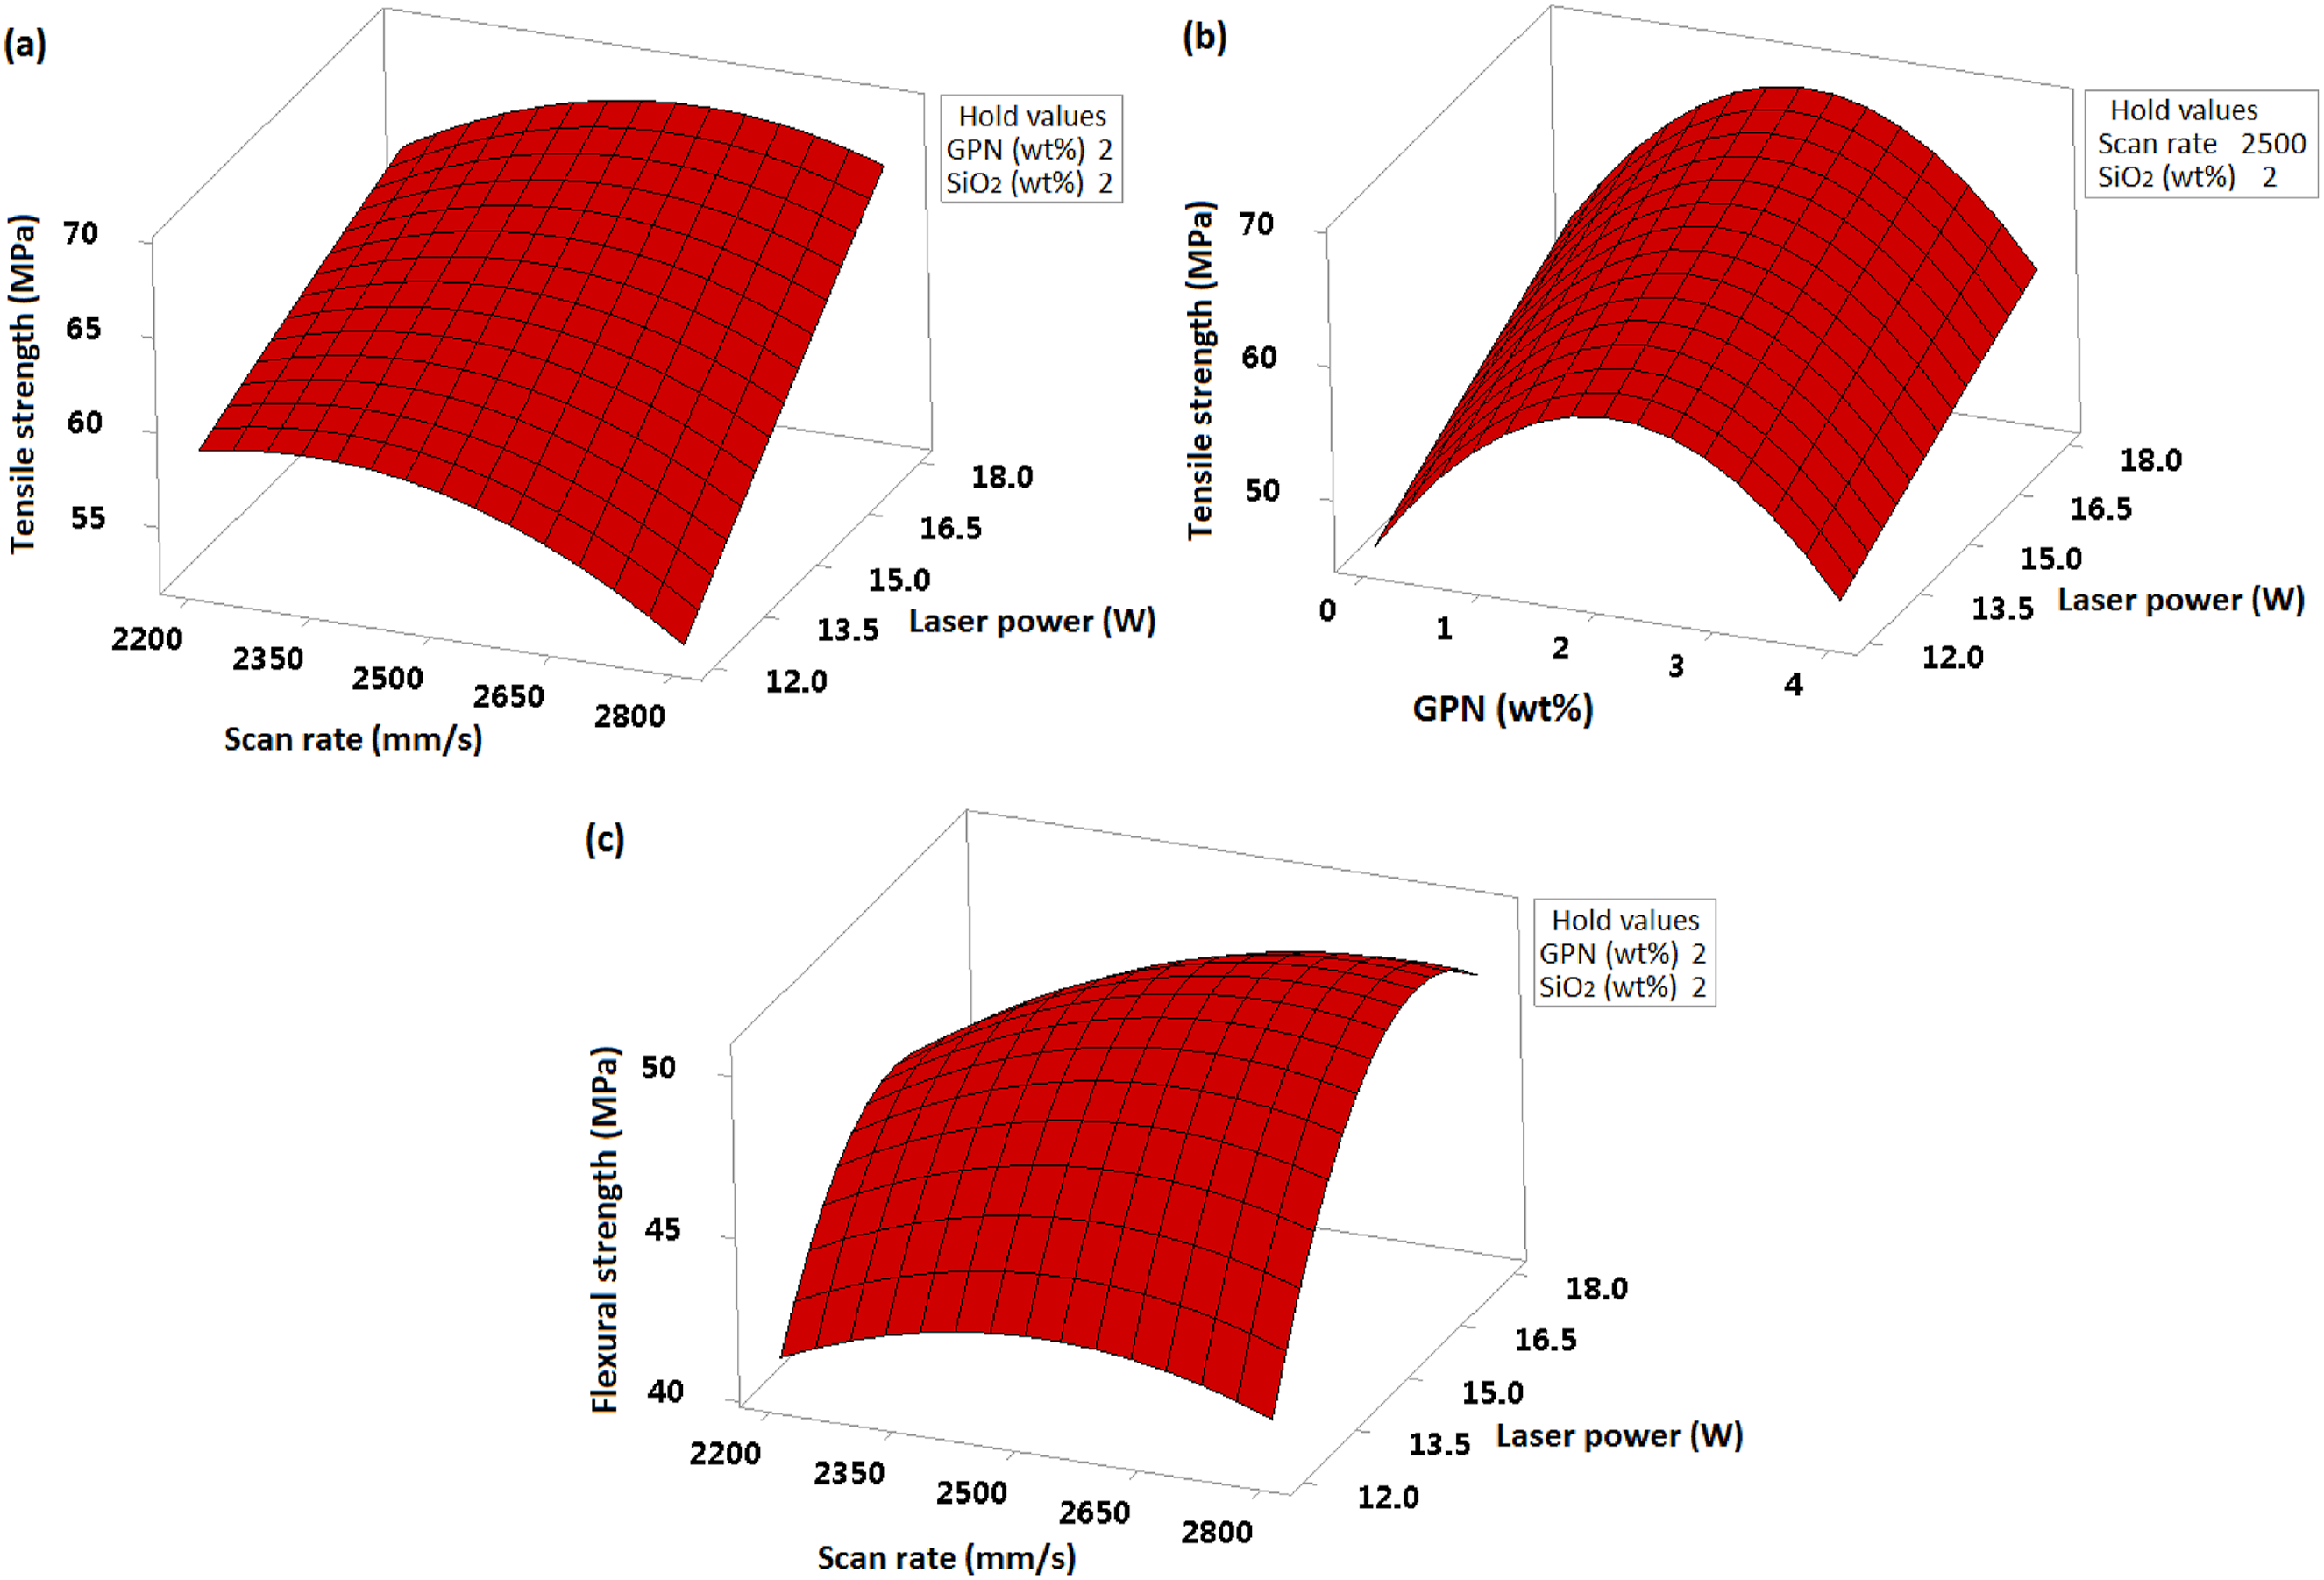
Interaction effect of parameters on the mechanical properties
Statistical analysis of variance (Tables 5 and 6) indicates that the interaction between laser power and scan rate significantly influences both tensile strength and flexural strength (p < .05). Furthermore, the interaction between laser power and GPN content significantly affects tensile strength. Given their significance, these interaction effects were investigated using the response surface plots, as presented in Figure 9.
It can be observed from Figure 9(a) that tensile strength responds differently to scan rate depending on the laser power. At 12 W, increasing the scan rate from 2200 to 2800 mm/s consistently reduced tensile strength. Conversely, at 18 W, the same increase in scan rate initially improved tensile strength before causing a reduction, resulting in a maximum value at a mid-level scan rate of 2500 mm/s. The decline at the high power (18 W) and low scan rate (2200 mm/s) is attributed to thermal degradation from excessive heat input, as evident from SEM images in Figure 6(b). According to Figure 9(b), the effect of laser power on tensile strength is highly dependent on GPN content. While increasing laser power from 12 to 18 W only slightly improved tensile strength at 0 wt% GPN, it caused a significant improvement at 4 wt% GPN. Therefore, higher GPN loadings require higher laser power to achieve optimal tensile strength. This is because GPN nanoparticles absorb a portion of the laser energy, which reduces the overall sintering rate of the nanocomposite.
Figure 9(c) reveals that the effect of laser power on flexural strength is contingent on the scan rate. At a low scan rate (2200 mm/s), flexural strength initially improved then declined as laser power increased to 18 W. Conversely, at a high scan rate (2800 mm/s), flexural strength improved continuously over the same power range. The decline observed at high laser power and low scan rate is attributed to excessive heat input causing thermal degradation, as confirmed by the SEM images in Figure 6(b). Consequently, optimal flexural strength is achieved by combining high laser power with a high scan rate to avoid detrimental heat accumulation.
Simultaneous optimization of the mechanical properties
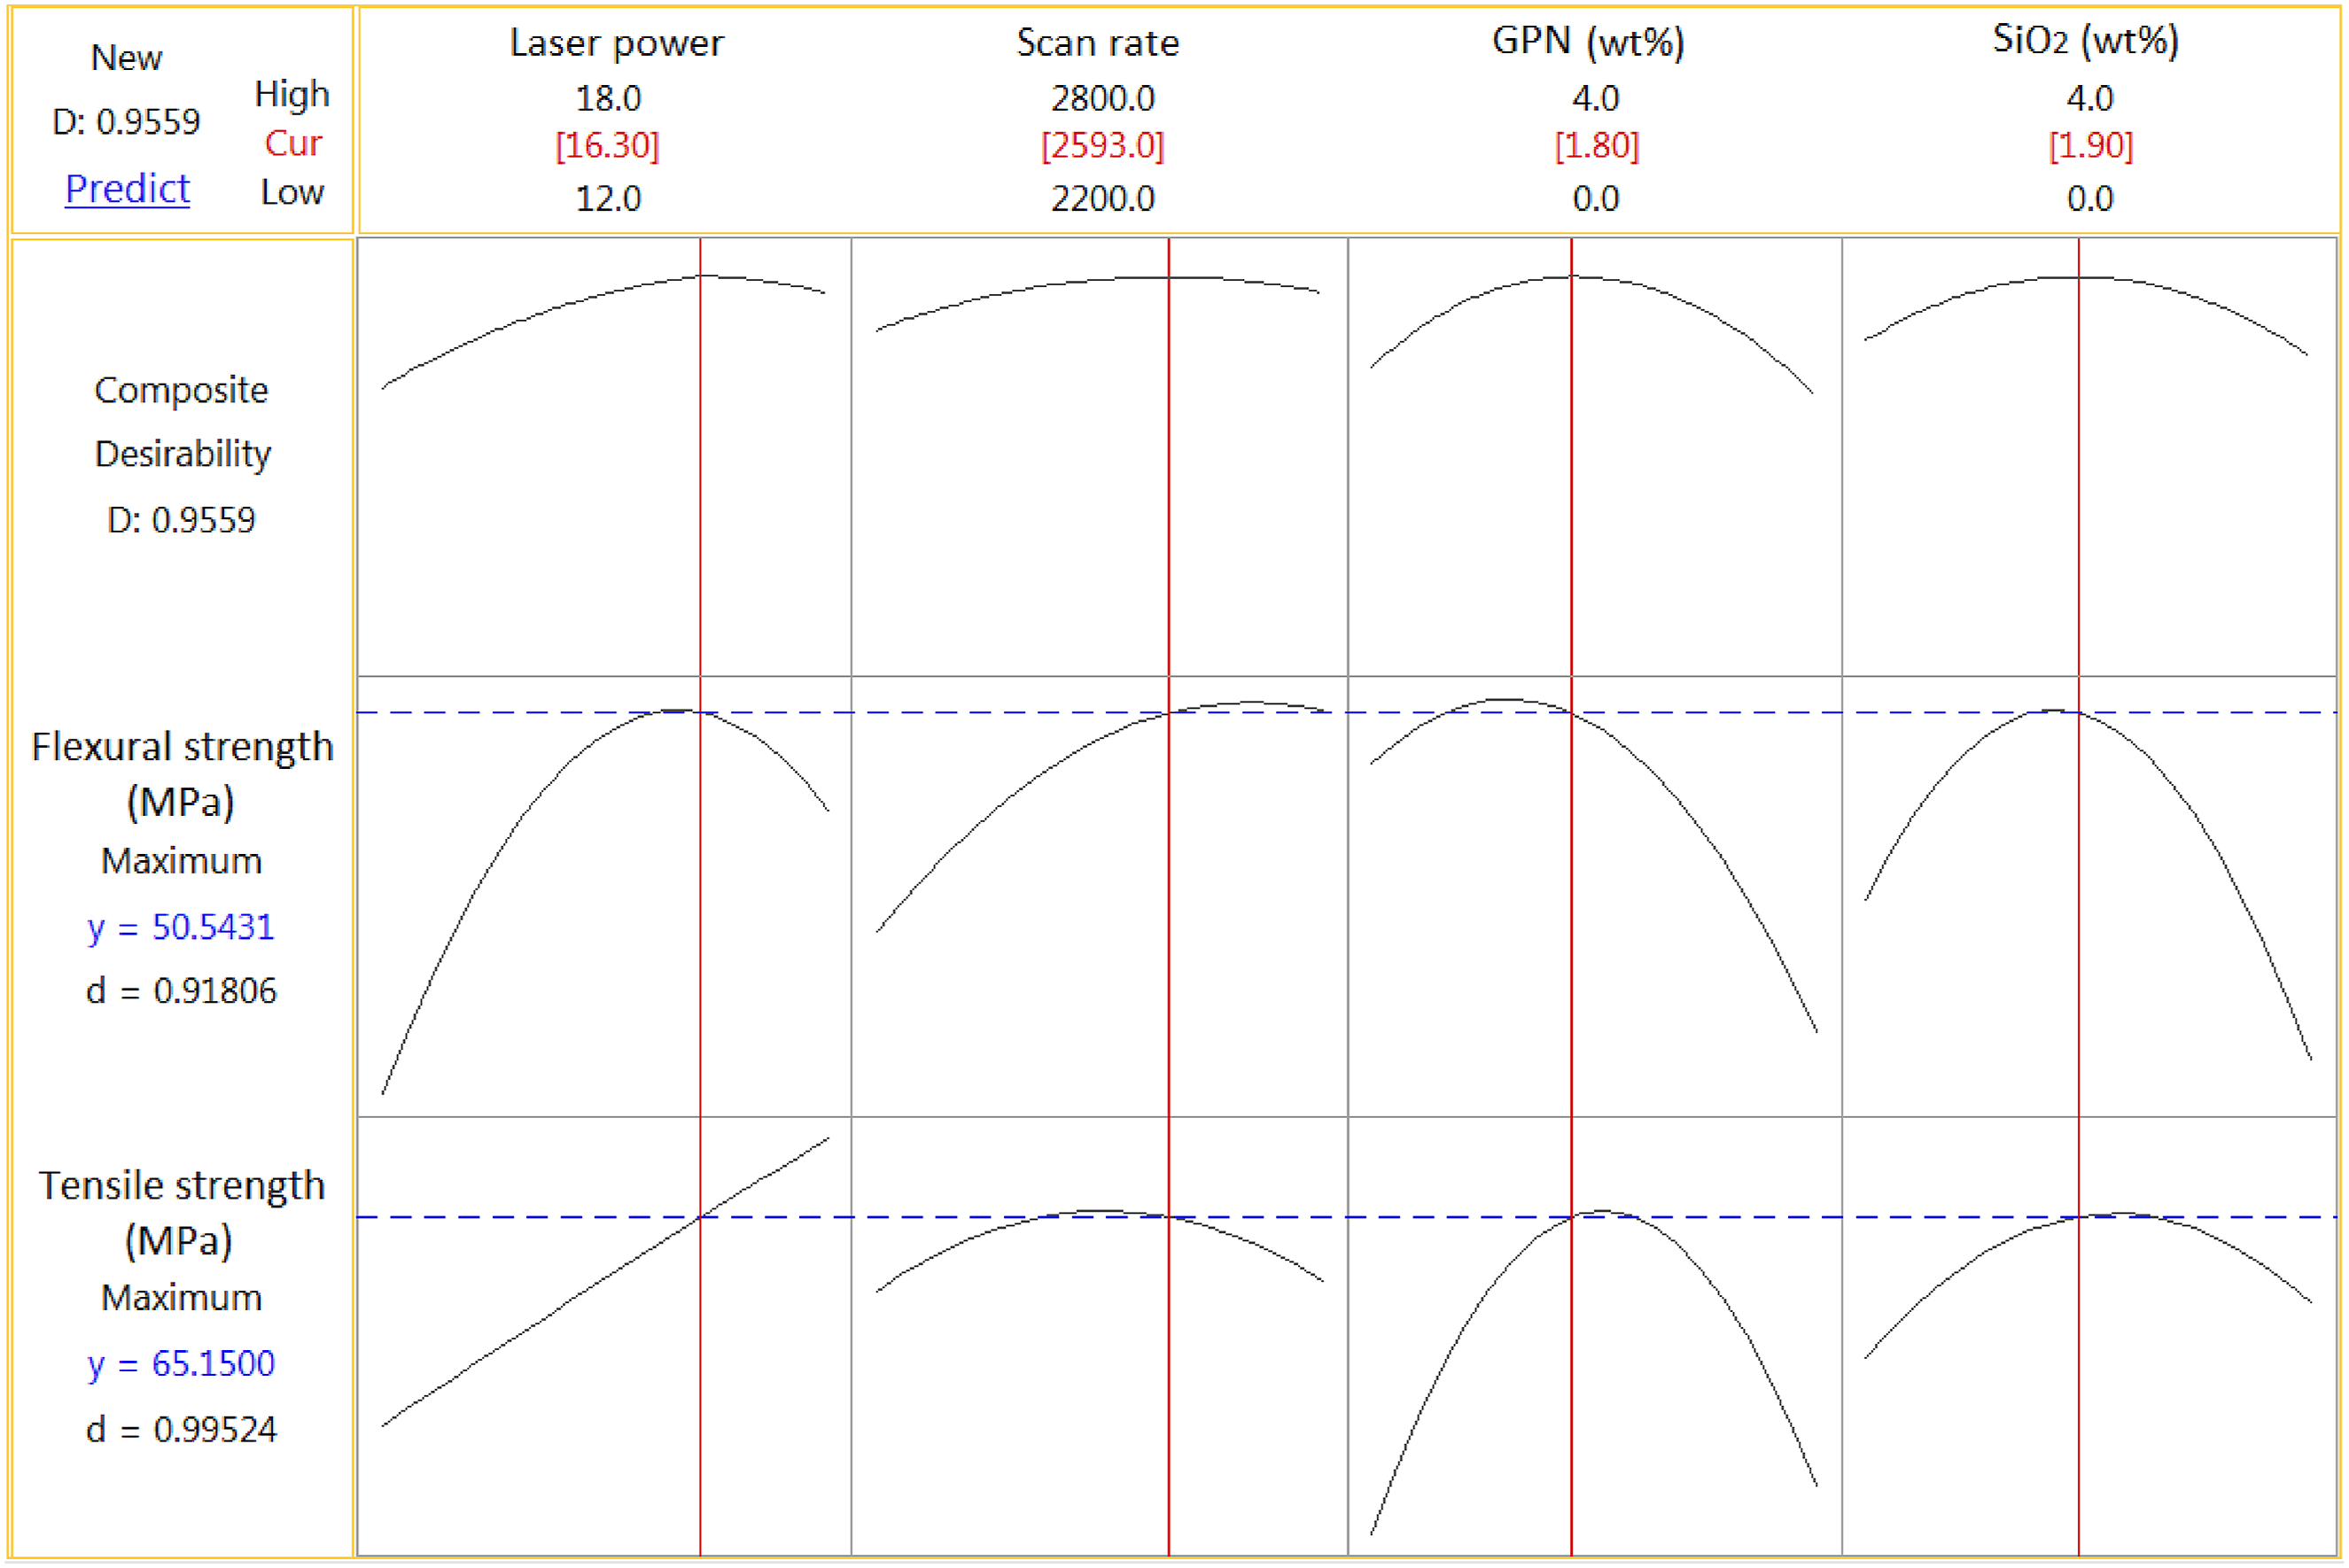
Research into the mechanical properties of SLM-produced PLA/HDPE/SiO2/GPN nanocomposites revealed that process parameters often affect tensile strength and flexural strength in opposing ways. Consequently, optimizing these properties simultaneously requires finding a parameter balance.64,65 The desirability function technique is well-suited for this type of multi-response optimization. It works by first translating the predictive model for each response into an individual desirability function (d), which are then combined into an overall composite desirability function (D). This function yields a value between 0 (representing an unacceptable result) and 1 (representing the ideal outcome). The single desirability functions (d) can be computed based on the intended purpose; 1- A higher response is better, 2- A lower response is better, and 3- A desired value of response is better.
25
For this study, where the objective was to maximize all responses, the “A higher response is better” option was selected for calculating each individual desirability function (Equation (4)). Results of optimization using the desirability function.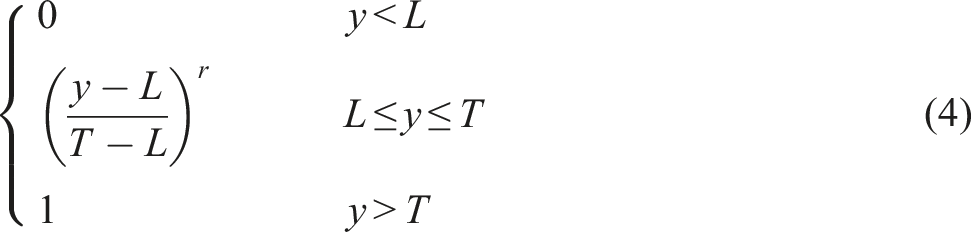

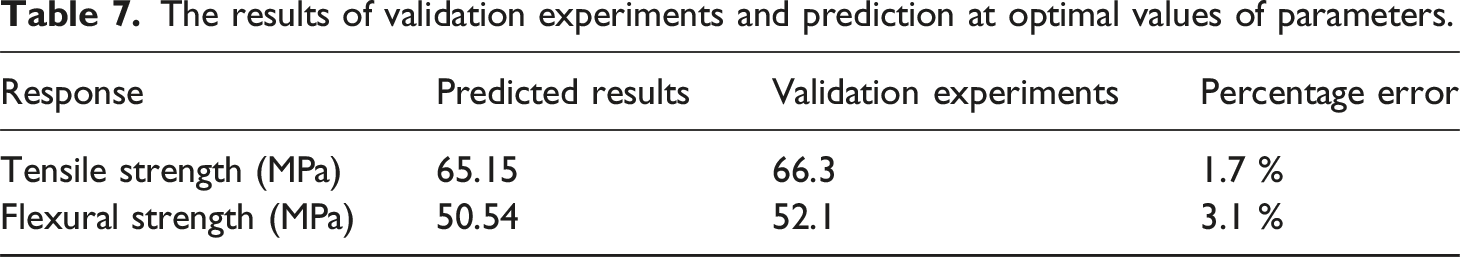
The results of validation experiments and prediction at optimal values of parameters.
Conclusions
This study optimized the thermal, electrical, and mechanical properties of PLA/HDPE/SiO2/GPN nanocomposites by integrating response surface methodology (RSM) with a desirability function approach. The key findings are summarized below: 1. Thermal analysis revealed that adding GPN and SiO2 nanoparticles to the PLA/HDPE blend increased its melting temperature, crystallization temperature, and percent crystallinity. This enhancement is attributed to the nanoparticles’ nucleating effect and their ability to partially absorb heat. 2. The electrical conductivity of the PLA/HDPE/SiO2/GPN nanocomposites was significantly enhanced by the addition of 2 wt% GPN and SiO2. Beyond this concentration, increasing the loading to 4 wt% resulted in only a marginal improvement, which is attributed to agglomeration effects. 3. The laser power and scan rate have a complex interaction. While increasing laser power from 12 to 18 W improved densification of the nanocomposite and thus enhanced its tensile strength and flexural strength, a laser power of 18 W combined with a low scan rate of 2200 mm/s induced thermal degradation, leading to a reduction in those same properties. 4. An enhancement in tensile strength and flexural strength was observed at GPN and SiO2 loadings of up to 2 wt%, which is attributed to the successful dispersion of the nanoparticles. Conversely, a further increase to 4 wt% degraded the mechanical properties as a consequence of agglomeration. 5. The optimal tensile strength and flexural strength for the nanocomposites were achieved at a laser power of 16.3 W, a scan rate of 2593 mm/s, a GPN content of 1.8 wt%, and a SiO2 content of 1.9 wt%. Under these conditions, the tensile strength and flexural strength were predicted to reach 65.15 MPa and 50.54 MPa, respectively.
Footnotes
Acknowledgements
The authors extend their appreciation to the Deanship of Research and Graduate Studies at King Khalid University, Saudi Arabia for funding this work through large group Research Project under grant number RGP. 2/531/46.
Author contributions
All authors contributed to the study conception and design. Material preparation, data collection and analysis were performed by Nafis Ahmad, Mohammad abushuhel and Laith Saheb. The first draft of the manuscript was written by Nafis Ahmad and all authors commented on previous versions of the manuscript. All authors read and approved the final manuscript.
Declaration of conflicting interests
The authors declared no potential conflicts of interest with respect to the research, authorship, and/or publication of this article.
Funding
The authors disclosed receipt of the following financial support for the research, authorship, and/or publication of this article: This work was supported by the Deanship of Research and Graduate Studies at King Khalid University under Grant number RGP. 2/531/46.
Data Availability Statements
The data supporting the findings of this study are available within the article