
Abstract
Three-dimensional (3D) printing has emerged as a versatile and sustainable manufacturing route for developing natural fiber–reinforced polymer composites. In this study, the objective is to enhance the mechanical performance and surface quality of 3D-printed polylactic acid (PLA) composites by incorporating powdered pineapple leaf fiber (PLF). Composite filaments were produced using a single-screw extruder and subsequently used to fabricate test specimens through fused deposition modeling. A response surface methodology based on a central composite design was employed to evaluate the influence of fiber content (SFC), infill density (SID), and printing speed (SPS) on ultimate tensile strength (UTS) and surface roughness (Ra). The developed models demonstrated strong statistical reliability, with R2 values of 0.9823 for UTS and 0.9689 for Ra, as supported by ANOVA. Multi-response optimization yielded an overall desirability of 0.973, corresponding to 34.80 wt% SFC, 77.42% SID, and 62.89 mm/s SPS, resulting in a maximum tensile strength of 73.89 MPa and a minimum surface roughness of 3.36 µm. The optimized composite was further examined to establish the processing–structure–property relationship. Hydrogen-bonding interactions between the hydroxyl groups of poly (lactide) fibers and the carbonyl groups of poly (lactide) were detected using FTIR spectroscopy. X-ray diffraction studies showed a moderate increase in the degree of crystallinity of the composite as a result of fiber-induced nucleation. Thermal gravimetric analysis (TGA) indicated an increase in the thermal stability of the composites. Differential scanning calorimetry (DSC) showed that the thermal transitions were more uniform. The results provide evidence that optimized processing results in good bonding between the polymer and the fiber; the composites are, therefore, characterized by structural uniformity, superior thermomechanical properties, and a data-driven approach to the creation of sustainable, high-performance PLA-based biocomposite materials for use in additive manufacturing processes.
Keywords
Introduction
As one of the foremost biodegradables and ecofriendly polymer, polylactic acid (PLA) has been found wide application in different fields with good mechanical properties, renewability and environmental benefits.1,2 It is used widely across various packaging, automotive components, biomedical devices and additive manufacturing applications good for its versatility, light weight nature and sustainability. However, despite its advantages, PLA faces limitations in terms of tensile strength, impact resistance, and durability can affect the performance of PLA in a challenging application. 3
As a promising approach to improving the properties of PLA based composites, the integration of natural reinforcements was sought to overcome these challenges. There is an increasing use of natural fibers, like hemp, jute or other plant-based fibers that can help improve mechanical properties, decrease weight and be more sustainable.4–7 Besides providing an excellent strength to weight ratio, these fibers boost stiffness as well as improve combined durability of polymer matrices. Both performance and environmental considerations have made PLA composites with natural fibers suitable for use in many domains: automotive parts, construction materials and packaging solutions. 3
3D printing has unlocked the fabrication of composites with higher flexibility and more control over the manufacturing process and has revolutionized composite materials adoption.8,9 Unlike traditional methods,10–12 which are typically constrained by fixed tooling and limited batch production, 3D printing implies the ability to manipulate critical process parameters such as the amount of fibe r present, level of infill density, printing speed, layer height, print nozzle diameter, and temperature 13 Specifically for these, there are important parameters like fiber content, infill density, printing speed that all contribute to the final composite determining it’s mechanical properties and surface quality. 11 The strength, surface roughness and dimensional accuracy of the 3D printed components depend on these parameters in a direct way, and therefore their optimization is crucial for high performance natural fiber reinforced polymer composite. 12
The process parameters of 3D printing must be optimized to obtain mechanical properties and surface quality for natural fiber-reinforced PLA composites. 14 The tensile strength, surface roughness, and overall durability may be enhanced through careful tuning of some crucial parameters, including fiber content, infill density, speed of printing, layer height, nozzle diameter, and temperature.15,16 Optimization, therefore, will lead to an efficient use of materials, reduction of part defects, and increase in consistency in final composite products. While there is a growing body of literature on natural fiber-reinforced composites intended for 3D printing, the knowledge is scant on the use of PLA and natural reinforcements17,18
Ahmad et al., 19 optimized FDM parameters for oil palm fiber composites, achieving tensile strength (0.95–35.38 MPa), Young’s modulus (0.11–1.88 GPa), and flexural strength (2.50–31.98 MPa). Optimal settings were 0.4 mm layer thickness, 0° orientation, 50% infill density, and 10 mm/s printing speed. Veeman et al., 20 optimized 3D printing parameters for PLA/almond shell composites using a Taguchi L27 orthogonal design to maximize compressive strength. Five factors—infill pattern, infill density, printing orientation, temperature, and speed—were varied at three levels. Results revealed infill density and printing orientation as the most impactful factors on compressive strength. A regression model with a 3.70% error accurately predicted compressive properties. Kechagias et al., 21 optimized 3D printing parameters for PLA/coconut flour composites to enhance ultimate tensile strength (UTS) and elasticity modulus (E). Using a Taguchi L18 design, the effects of layer thickness, nozzle temperature, raster deposition angle, and printing speed were analyzed. A Linear regression models predicted mechanical responses with errors below 3%. Guduru et al., 22 enhanced the mechanical properties of PLA by incorporating 20% short carbon fibers. Key properties—tensile strength (61 MPa), flexural strength (70 MPa), and Izod impact resistance (480 J/m)—improved by 30–40% compared to pure PLA. Using Taguchi methodology, layer height and nozzle material were identified as critical parameters for optimizing performance.
While several studies18–30 have explored natural fiber–reinforced PLA composites, most have emphasized either general property evaluation or individual fiber systems without offering a systematic optimization of critical 3D-printing parameters. Moreover, very limited work has examined pineapple fiber (PF)–reinforced PLA manufactured through fused deposition modeling, particularly with regard to parameter sensitivity, predictive modeling, and quantitative process optimization. This study aims to systematically investigate how fiber content, fill density, and print speed interact to affect the tensile strength and surface roughness of PF-PLA composites using response surface methodology. In addition to process optimization, it will also analyses how the processing, structure, and property relationships develop via multi-scale characterization using FTIR, XRD, TGA, and DSC to understand interfacial interactions, crystallization, and thermal stability. This study combines the process development to produce high-performance, sustainable PLA-PF biocomposites that meet the requirements of advanced 3D printed engineering applications by using micro-structural and thermal data to develop a data-driven framework.
Experimental approach
The general methodology followed for this study is represented in Figure 1, showing the structured sequence from selecting raw materials up to analytical evaluation. Using powdered pineapple leaf fiber as reinforcement in a PLA matrix, this work designs and optimizes a 3D-printed composite material. The strong mechanical qualities of pineapple leaf fiber, such as having a low density of about 1.3 g/cm3, Young’s modulus of about 32 GPa, and tensile strength between 172 MPa, made it an excellent choice. These virtues make it an ideal option for natural fiber reinforcement in PLA composite, as it enhances the strength of the composite while preserving its lightweight and biodegradable properties. Moreover, natural moisture resistance and good thermal stability of pineapple leaf fiber contribute to the reliability and durability of the composite. Sequential workflow of the experimental methodology.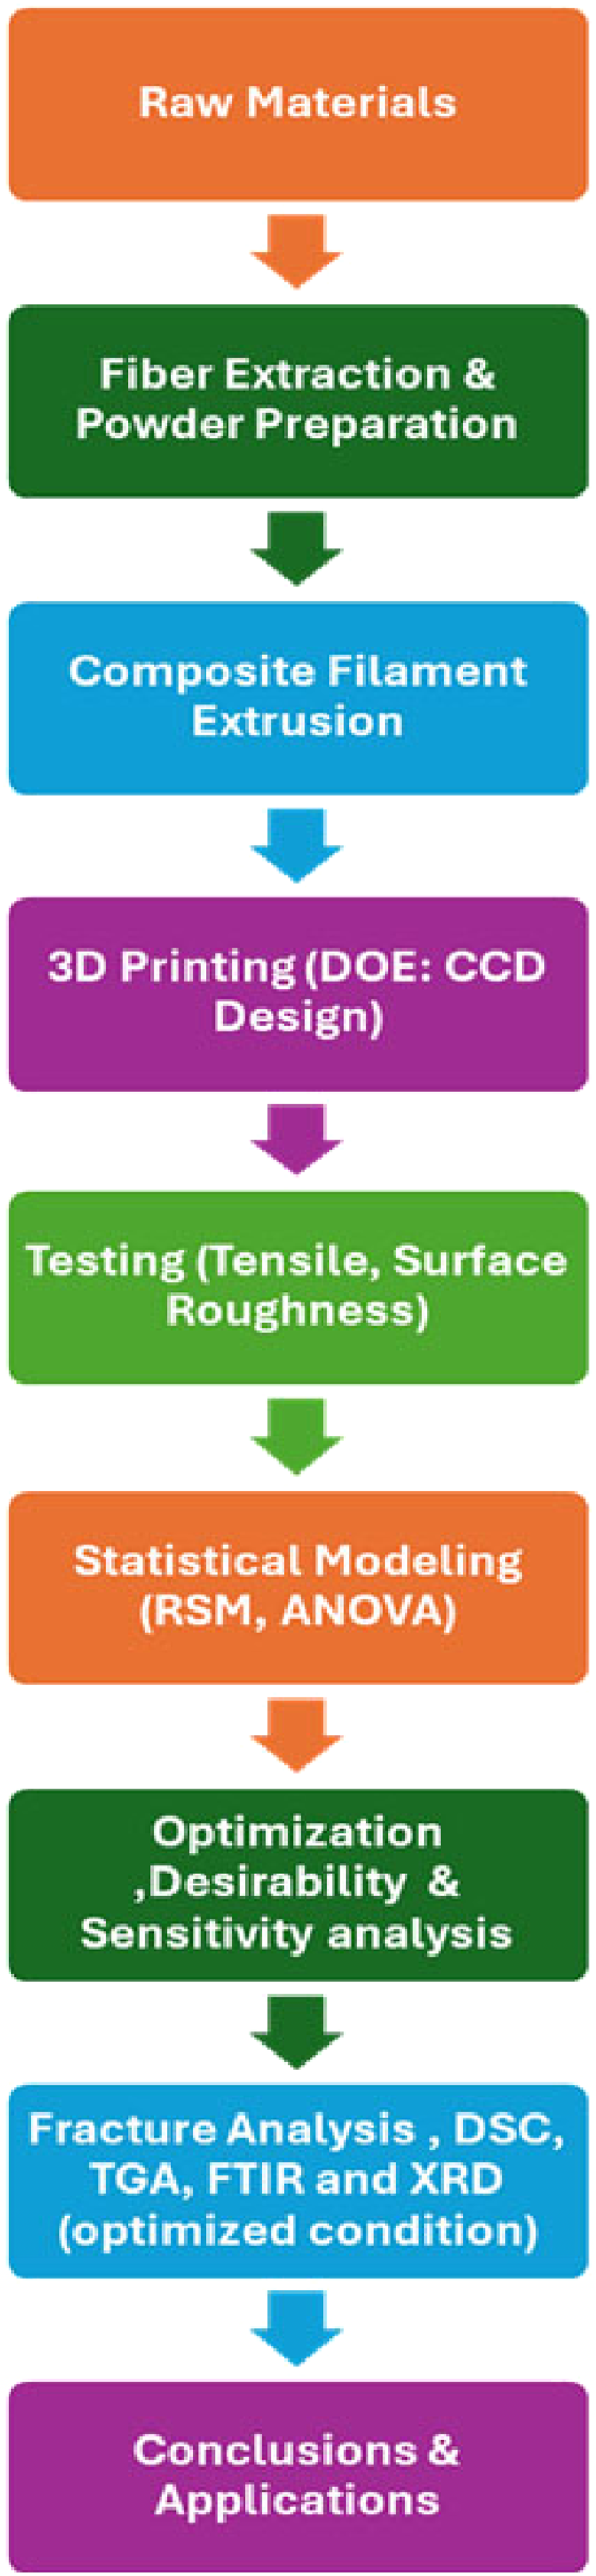
PLA, the matrix material, was purchased as commercial grade in pellet form as shown in the Figure 2(a). The pellets are quite suitable for 3D printing since it naturally decomposes. Fresh pineapple leaves (Figure 2(b)) were acquired which had been subjected to various processes for extracting and purifying fibers in order to make the reinforcement material, pineapple leaf fiber. The leaves were first rinsed with care and the ensuing water moisture then dried. Extracted fibers from leaf tissue using a combination of chemical retting and mechanical retting. The leaves were treated with an alkaline solution first, and this process would break the lignin and the pectin holding those fibers together. The lignin and the pectin-free leaves were then subjected to mechanical processing in order to separate the fiber bundles (Figure 2(c)). The fibers were dried further after extraction - before being ball-milled to a fine powder (Figure 2(d)). (a) Pure PLA (b) pineapple leaves (c) extracted Pineapple fiber (d) pineapple fiber powder, SEM micrograph of the (e) pineapple leaf fibers and (f) pure PLA (g) particle-size distribution of pineapple fiber powder.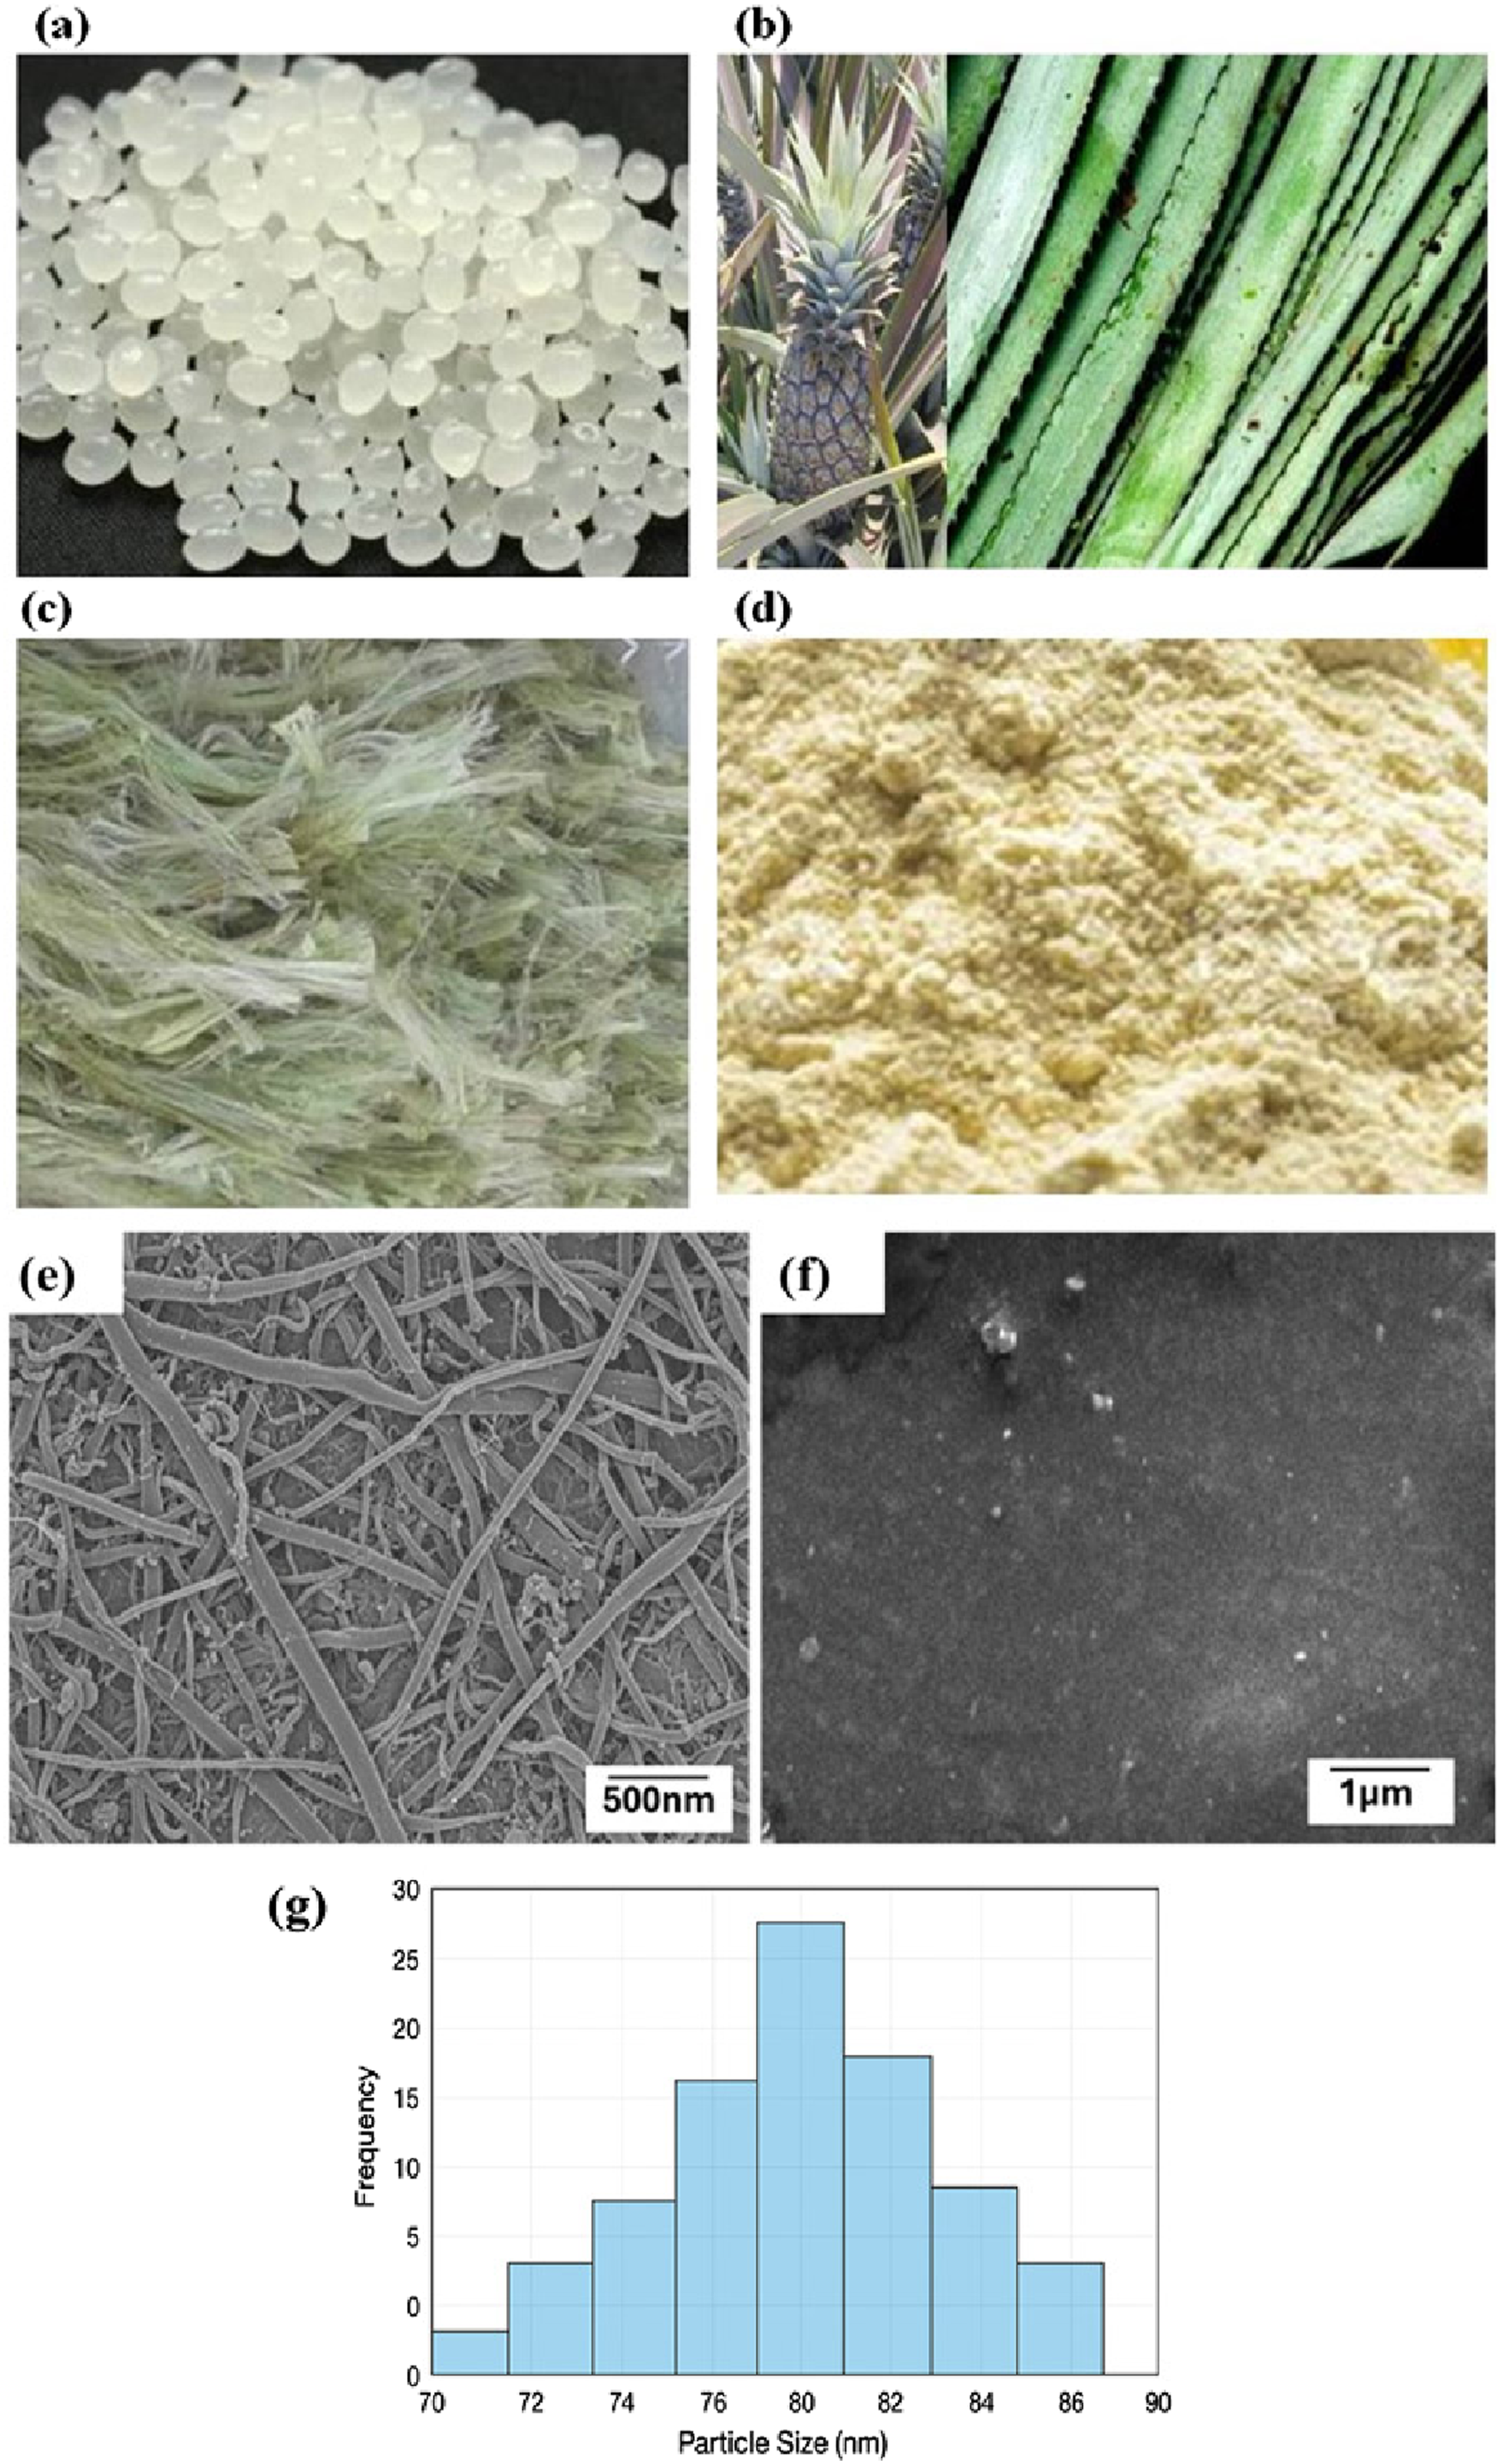
The morphological properties of raw pineapple leaf fibers and pure PLA were investigated using scanning electron microscopy, as shown in Figure 2. Figure 2(e) shows the microstructure of the fiber, characterized by a rough and irregular surface with a network of fibrils, which is a general characteristic of natural lignocellulosic fibers. These surface roughness and microfibrillar textures are particularly beneficial for mechanical interlocking with the PLA matrix, thus providing good interfacial adhesion in the composite.
By contrast, the SEM picture of the neat PLA, presented in Figure 2(f), reveals a smooth and featureless surface, with no evidence of reinforcement or structural heterogeneity. Such morphological differences indicate that the incorporation of reinforcement fibers has the potential to bring about micro-scale roughness and load transfer paths that enhance the tensile performance of the composite and its delamination resistance upon printing.
Production of pineapple-leaf fiber powder involved a planetary ball mill (Fritsch Pulverisette-6) operated at 400 r/min for 2 h with the use of 10 mm zirconia balls using 10:1 ball-to-powder ratio. The particle size distribution of the milled powder was determined by Dynamic Light Scattering (Malvern Zetasizer Nano ZS), which demonstrated a narrow range of nanometer sized powder 70–90 nm. The size distribution histogram is shown in Figure 2(g) which shows the close approximation of the sizes of the milled fiber powder, thus making it appropriate for composite filament extrusion. This nanoscale fiber powder, by expanding the interface surface area and boosting fiber-matrix adhesion, was mixed into the PLA matrix to improve the mechanical properties of the composite.
PLA pellets were mixed with the required weight percentages of pineapple leaf fiber (PLF) powder and dry-blended to achieve an initial uniform mixture. The combination of this material was achieved through the use of single-screw extruder (3devo Filament Maker ONE) (Figure 3(a)), which was operated at controlled speeds and temperatures, while shearing forces were applied to break up any agglomerated PLF particles and allow an even distribution of the powder in the liquid PLA at temperatures that did not cause thermal decomposition. The resulting composite material exhibited a uniformly reinforced PLF–PLA filament suitable for 3D printing, which was subsequently processed using the White Pratham X Large Format FDM printer (Figure 3(b)). In order to prepare standardized test specimens for tensile test analysis, the composite filament was extruded into a 3D printer. As process parameters were systematically varied during the printing process since they constitute an important set of determinants for the surface roughness and tensile strength of the composite, the printed surface quality has been evaluated along several surface roughness measures that strongly feature in various engineering applications where performance is sensitive to surface integrity. (a) Single-screw filament extruder (b) 3D printer setup with printer sample (c) universal testing machine with fractured sample (d) surface roughness profilometer.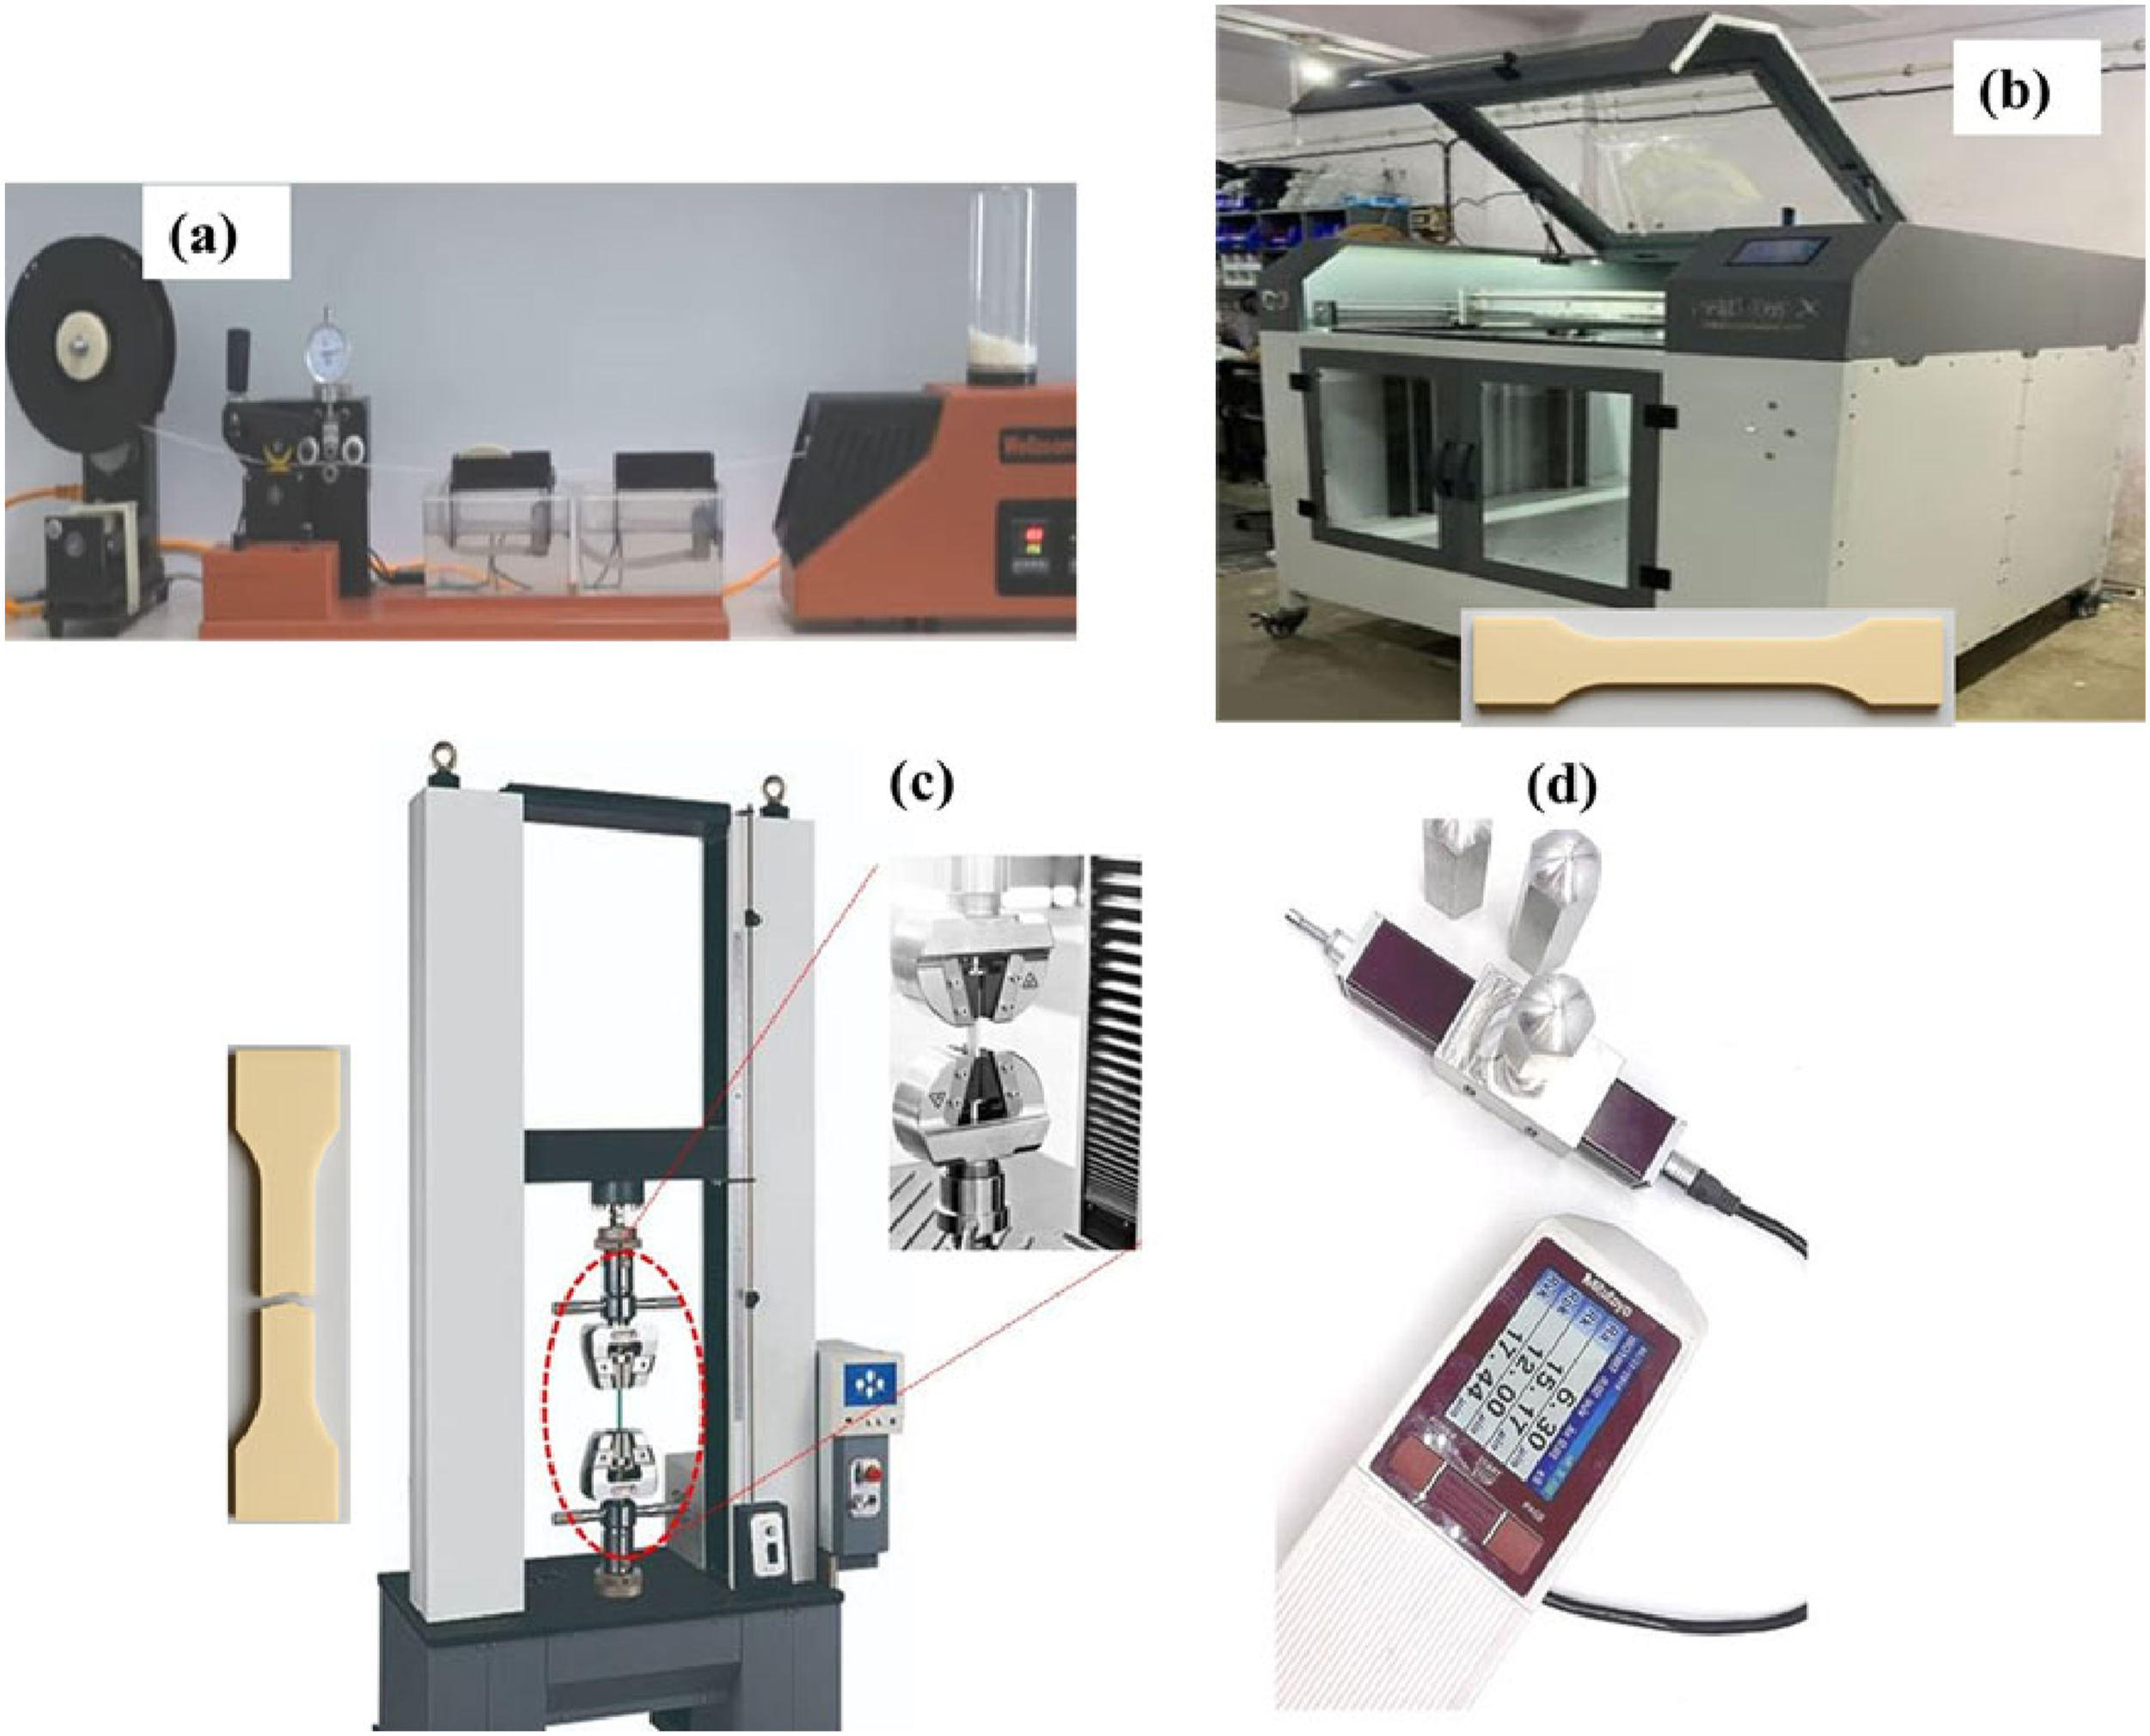
Composite characterization
The surface morphology of the samples was examined using Scanning Electron Microscopy (SEM, JEOL JSM-IT500) at 15 kV with Energy Dispersive X-ray Spectroscopy (EDS). The Ultimate tensile strength (Fine Group, TUE-C, 10 kN load cell) with a crosshead speed of 5 mm min−) were performed using dog-bone samples (L = 165 mm, W = 13 mm, T = 3.2 mm) and the gauge length of 50 mm according to ASTM D638-00 (2000) 26 to measure the mechanical properties of the printed composites. In addition, surface roughness was measured using a profilometer (Mitutoyo SJ-210, Japan) following the guidelines set by ISO 4287 standards to evaluate surface quality of the printed cross-sections. The data for UTS and Ra were fitted into a Central Composite Design (CCD)-based RSM pilot framework to evaluate an optimal parameter set that maximized tensile strength and minimized surface roughness.
After optimizing processes, detailed material characterizations were carried out on the composite printed with the optimized process parameters. The chemical compatibility and functional interactions between the PLA matrix and the pineapple fibers via Fourier Transform Infrared Spectroscopy (FTIR, PerkinElmer Spectrum Two) using wave numbers between 4000 and 500 cm−1 with a resolution of 4 cm−1. The crystalline structure of the pineapple fiber and PLA–PF composite was evaluated through x-ray diffractometer (Rigaku Ultima IV) using Cu Kα radiation (λ = 1.5406 Å) operating conditions at 40 kV and 30 mA, and diffraction scans were collected over 2θ = 10°–60° at 2° min−1, to examine phase distribution in the matrix of PLA.
Thermal stability and decomposition behavior were analyzed using a thermogravimetric analyzer (TGA, TA Instruments Q500). About 10 mg from each sample were heated from room temperature to 600°C at a rate of 10°C min−1 in the inert nitrogen atmosphere at a flow of 50 mL min−1. Differential Scanning Calorimetry (DSC, PerkinElmer DSC 8000) was performed. Samples weighing 5–8 mg were heated in the range of 40°C–200°C at a rate of 10°C min−1 under nitrogen flow (40 mL min−1).
Methodology
Determining the important process parameters
To the manufacturing process of pineapple fiber-reinforced PLA composites, identification and optimization of these key process parameters would guarantee desirable mechanical and surface-quality properties. Thus, from the above preliminary work for this study, three such critical parameters have been chosen namely: 1. Sample fiber content (SFC) 2. Sample infill density (SID) 3. Sample printing speed (SPS)
These parameters had great impact on composite tensile strength and surface roughness, which was revealed by prior research studies10–25 supported by preliminary experimentation.
It defines the weight percentage of the pineapple leaf fiber powder blended into the PLA matrix. This parameter is critical, as it has a direct influence on the mechanical reinforcement of the composite. Any change in fiber content also changes the interfacial bonding between the fiber and the matrix, which will affect tensile strength. The SID is the percentage of material that fills the internal structure during 3D printing. It impacts the total mechanical strength, weight, and surface quality of the printed composite. Infill densities usually improve tensile strength, increase material usage, and also the print time, but low-density in-fill reduces the weight at the cost of strength. SPS controls the deposition rate of the composite material in the process of 3D printing. It highly influences layer adhesion and surface finish of the printed specimen. High printing speeds may reduce bonding strength at the layer, while lower speeds may improve adhesion at the expense of productivity.
Finding the working limits of the parameters
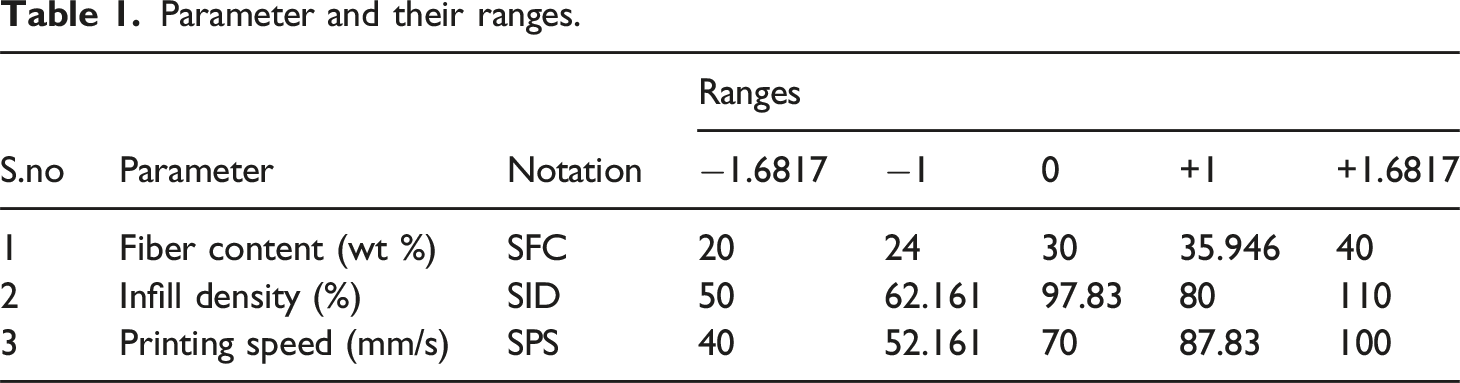
It is crucial that the working limits of the process parameters used for 3D printing of pineapple fiber-reinforced PLA composites are defined. The range for each variable in its upper and lower ranges was chosen based on a combination of literature,
23
experimental feasibility, and the physical constraints of the materials and equipment used. The working ranges for the three parameters are: SFC, SID, and SPS. i Under 20 wt%, the reinforcing ability of the fiber powders becomes insufficient for significant improvement in tensile strength and other mechanical properties. There would also be very little interaction between the fiber and PLA matrix at reduced fiber powder content. Beyond 40 wt%, however, the processability of the composite during extrusion into filament and 3D printing becomes compromised, as inadequate fiber flow ability leads to agglomeration. Other factors are triggering structural defects-voids and highly variable layering-are also pertinent and can significantly lower print quality and mechanical properties. ii When under 50% SID, the material in the internal structure becomes sparse, which means that porosity in the structure increases and interlayer bonding decreases. This leads to weak interfacial connections, and structural instability as a result, which dissatisfies these composites for practical applications. When more than 110% SID takes place, excessive material deposition leads to overstuffed regions, which adversely affect the surface finish and dimensional accuracy. In fact, this over-extrusion can lead to additional internal stresses and defects, including uneven distribution of material and dimensional inconsistency amongst the layers, thereby degrading the performance of the composite. iii For SPS below 40 mm/s, bonding was improved due to longer material interaction, though protracted exposure to nozzle heat also increased the risk of thermal degradation of the PLA matrix and fiber. The degradation leads to compromises in the strength of the composite structure as well as in surface finish. Additionally, slower speed will extend printing time by a substantial calculation and, therefore, makes the process unviable for practical considerations. At over 100 mm/s SPS, the rapid deposition gives less time for bonding between layers, resulting in poor interfacial adhesion. This problem contributes to the weak bonding between layers, delamination, and volume voids within the. iv Composition. Moreover, unequal material flow at excessive speeds leads to wild surface finish variations and dimensional inaccuracies, thus affecting the mechanical properties of the composite, notably tensile strength.
Developing the design matrix
Parameter and their ranges.
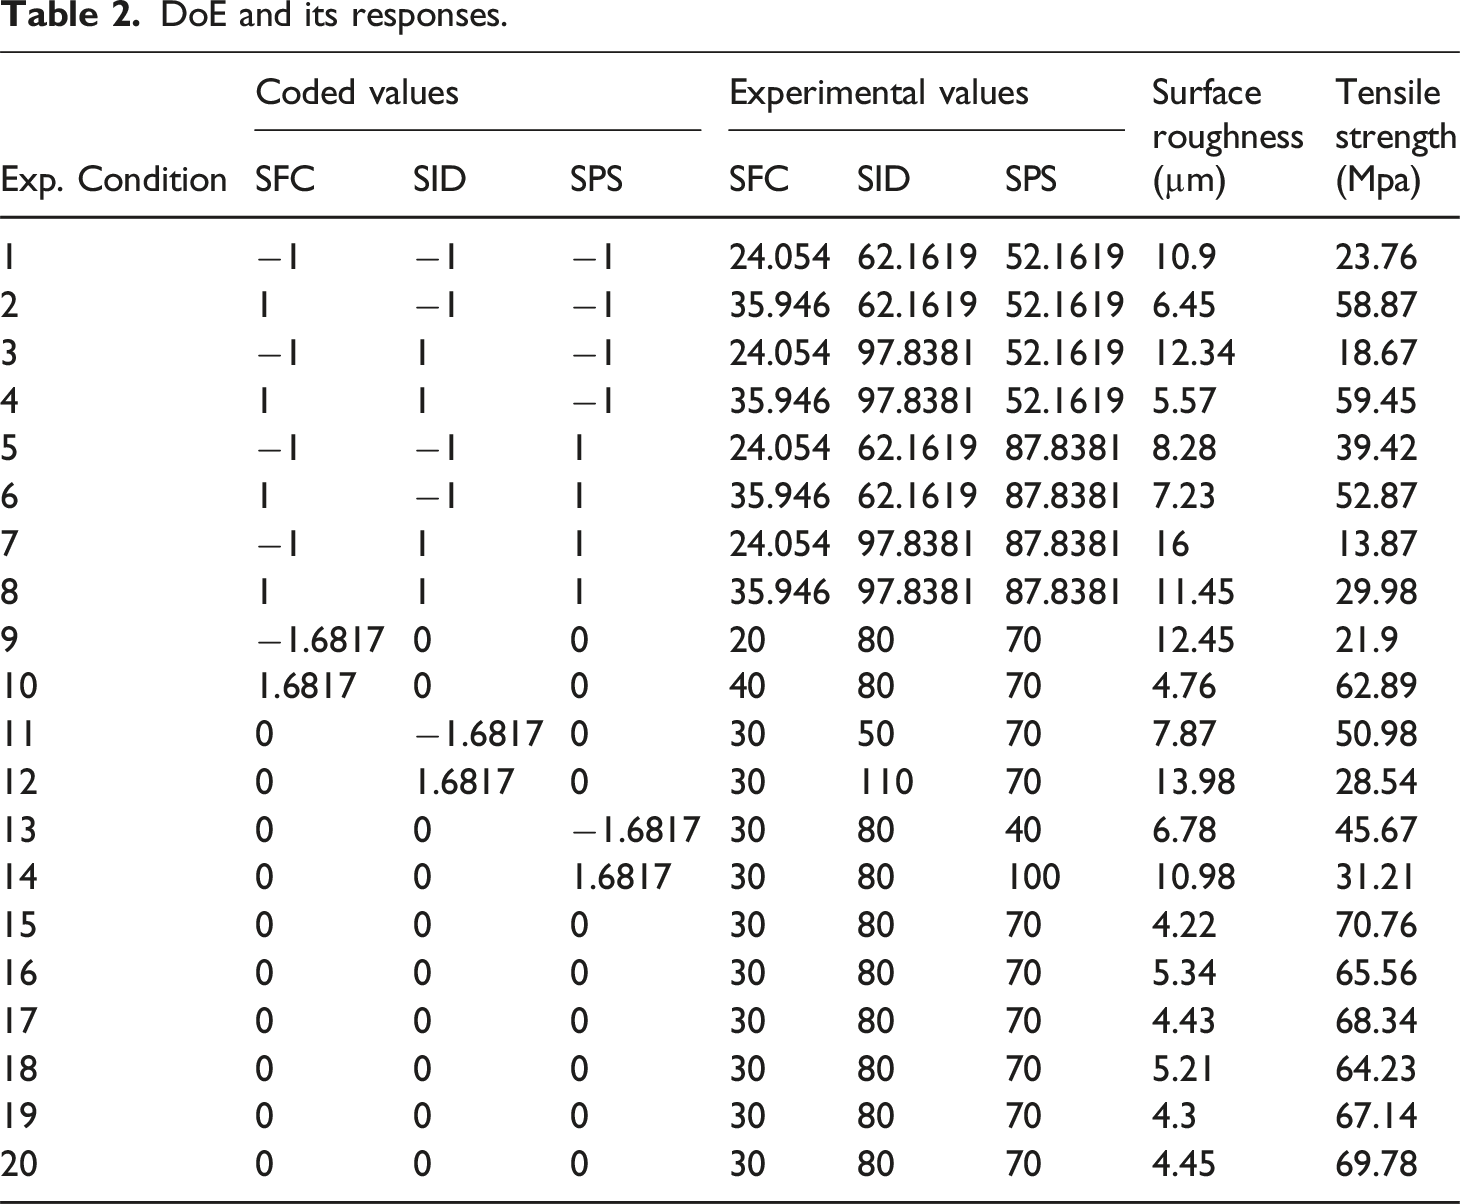
DoE and its responses.
Recording responses
In this investigation, two important responses: tensile strength and surface roughness were considered to investigate the behavior of pineapple fiber-reinforced PLA composites produced by 3D printing. This was definitely because of their importance in both of the aspects (i.e., determination of mechanical performance and surface properties) which are indirectly depended on the functionalities of actual composites as per practical application. All tests were repeated three times for each sample for reproducibility and accuracy of recorded data.
Tensile strength
Maximizing tensile strength (maximum stress the composite could bear before it fails) represented the cornerstone of mechanical properties at a compressive level in the composite system. ASTM D638 26 testing was conducted on dog-bone shaped samples with L165 mm × W13×T3.2 mm for tensile testing (Figure 3(c)). It was applied with a controlled loading rate of 5 mm/min until the specimens broke down, and final load values were taken. Those results were averaged for the trials so as to reduce variability and increase statistical significance to the response of every sample.
Surface Roughness
Surface roughness was employed to assess the cross-section surface quality of composite through ISO 4287 standard surface profilometer (Figure 3(d)). The parameter Ra (root mean square) was measured within separate locations of the specimen for better characterizing surface fluctuations. Surface roughness of each sample measured thrice and hence the mean for analysis. This method delivers solid, statistical data that explains precisely how the process parameters are affecting the surface property.
Development of the empirical relationship
Using empirical models, mathematical relationships were therefore developed that give a quantitative relationship between process parameters and responses (STS, SSR). The models were developed using regression analysis of data from Central Composite design (CCD). The models include linear and quadratic terms, as well as interaction effects to explain everything with all the input factors on responses.
The generalized second-order regression equation
19
for empirical modeling is expressed as:
The selected model incorporates both the main effects and the interaction effects of all variables. It is represented by a polynomial equation, stated as follows:
For three factors, the chosen polynomial can be presented as:
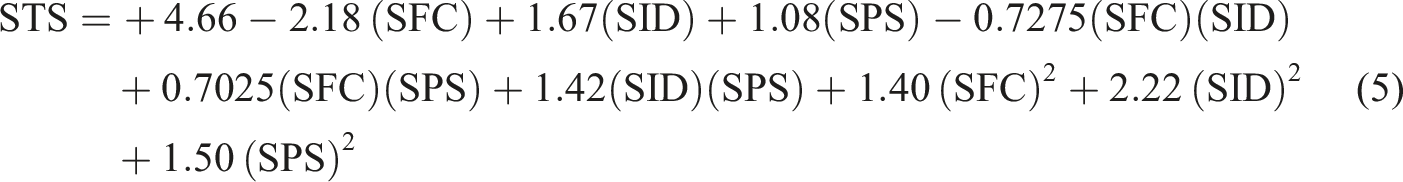
Based on the regression analysis performed using the CCD experimental data, the following equations were developed for the responses: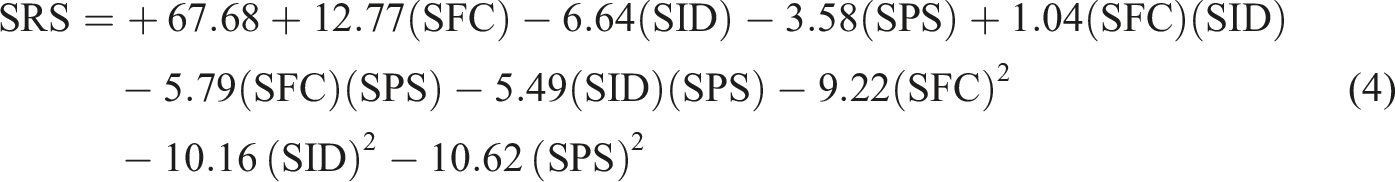
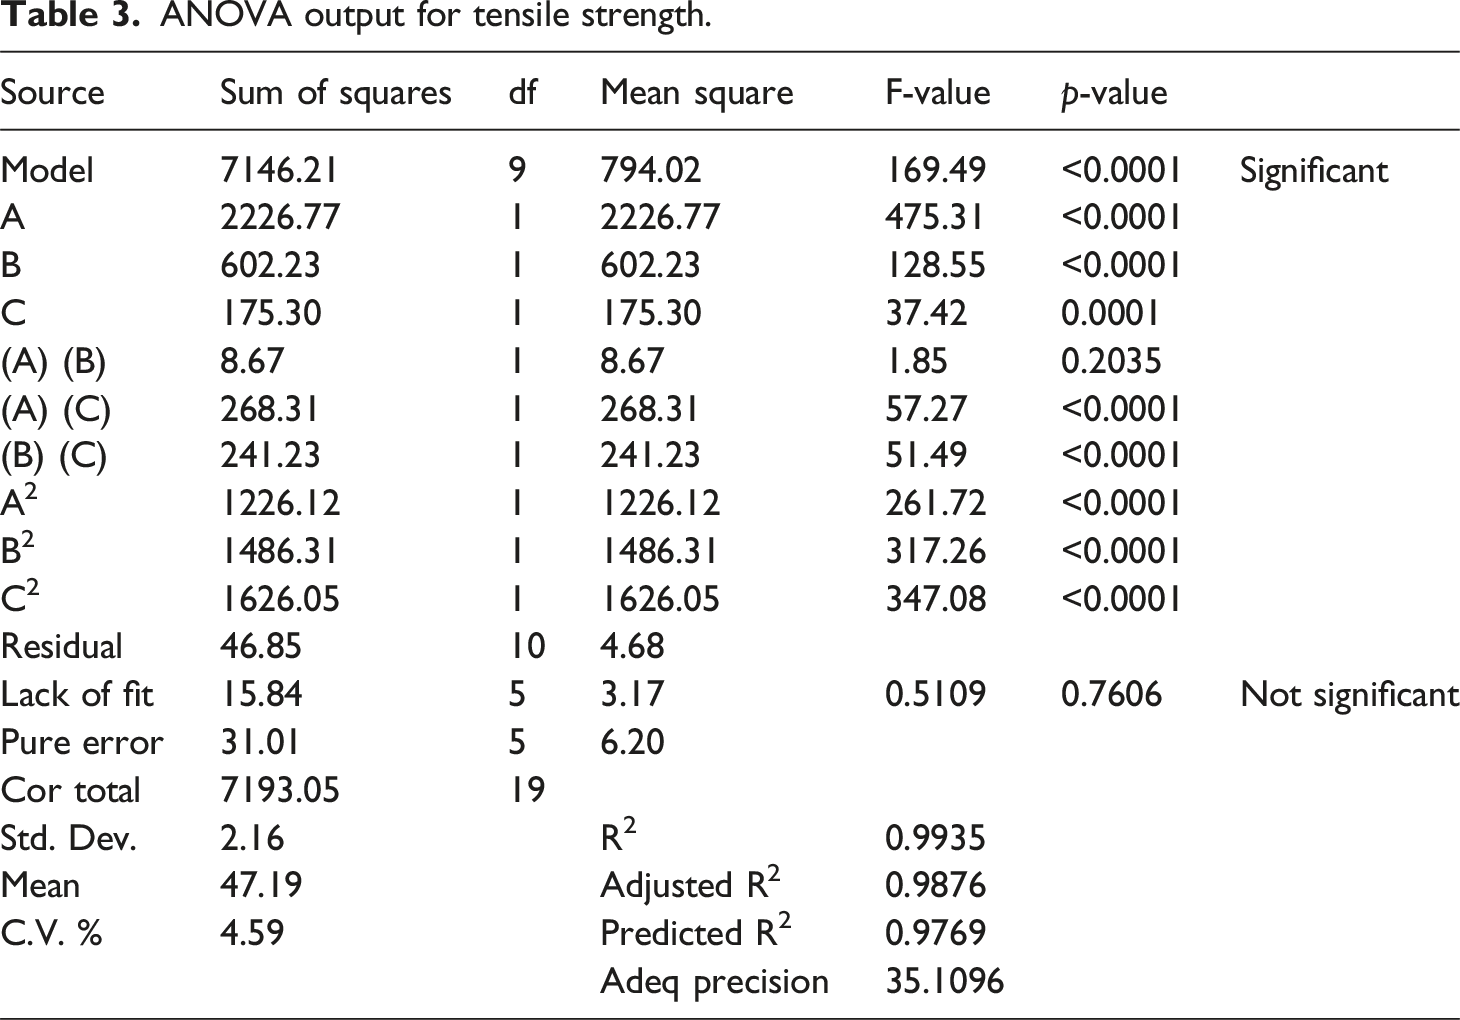
ANOVA output for tensile strength.
ANOVA output for surface roughness.
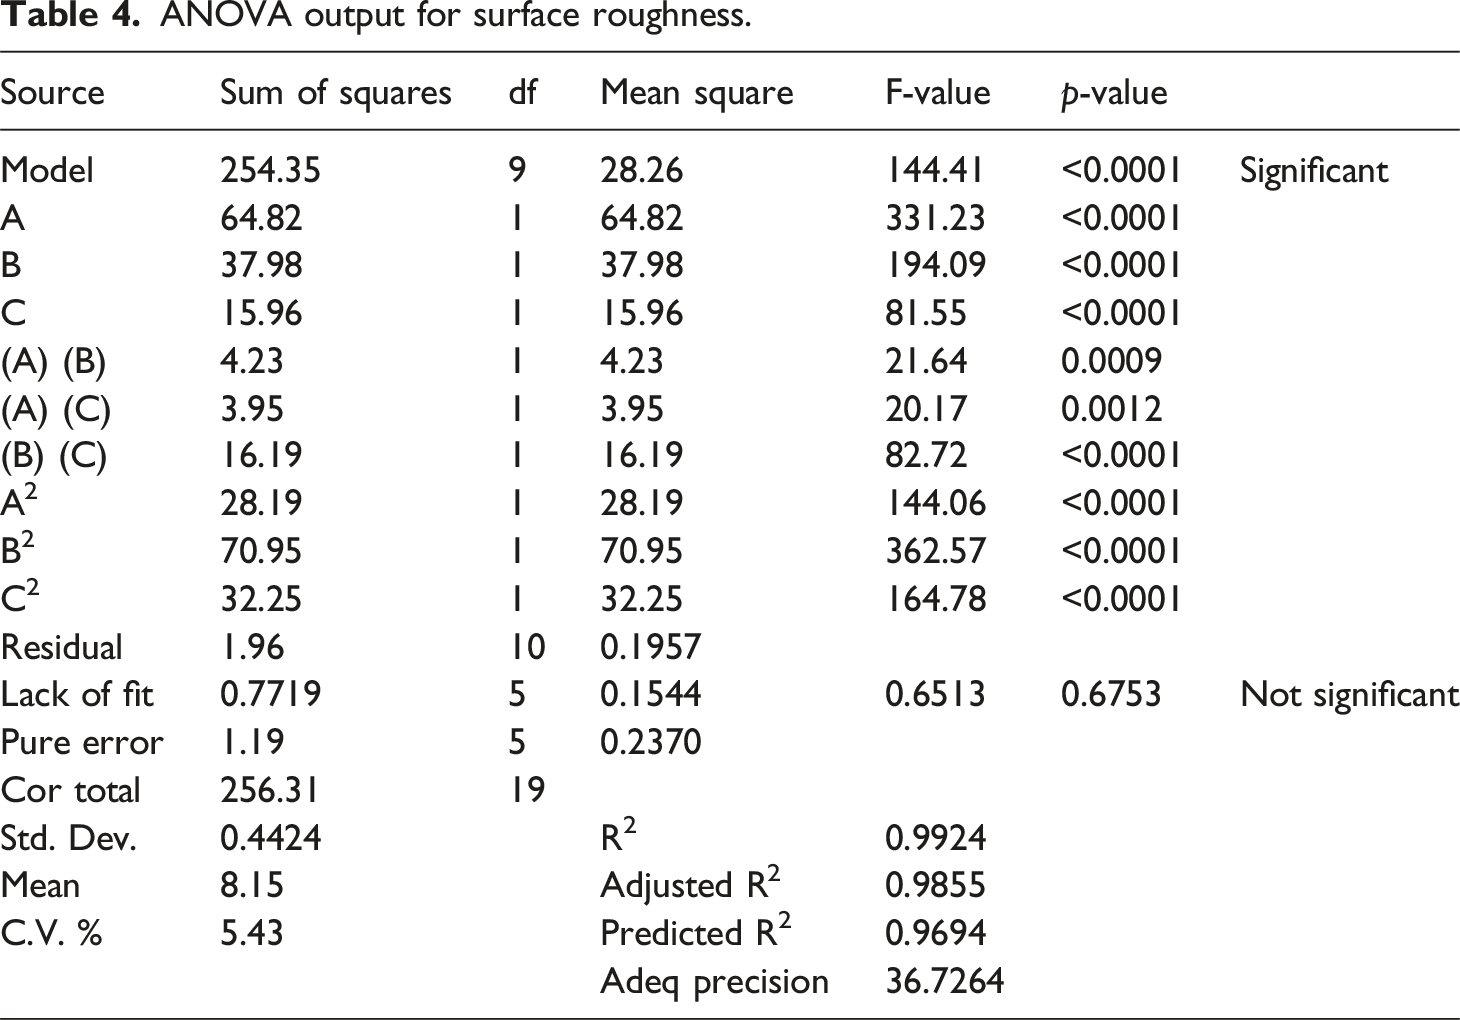
Likewise, the model for surface roughness was very highly significant (p < .0001). Among these SFC had maximum effect with an F-value of 331.23 followed by SID and SPS which had F-values of 194.09 and 81.55 respectively. Interaction effects ((SFC) (SID), (SFC) (SPS), (SID) (SPS)) were statistically significant with F-values ranging from 20.17 to 82.72, confirming that there were surprisingly significant interactive effects among the parameters themselves. Quadratic terms (SFC2, SID2, SPS2) were also appreciably significant with an F-value exceeding 144.06, indicating acknowledgment for curvature effects. The R2 value of 0.9924 pointed out that 99.24% variation of the surface roughness could be explained by the model with adjusted R2 and predicted R2 values of 0.9855 and 0.9694, respectively. Apart from that, the Adequate Precision of 36.7264 and the non-significant lack of fit (p = .6753) further validated the overall robustness of the model.
Figure 4 illustrates the predicted and actual plot of the SSR and the STS. The predicted to actual values regarding the surface roughness and tensile strength manifest the performance of the created model in yielding an accurate experimentally determined response. For SSR, the approximate linear alignment on the 45-degree reference line, as evident in the figure, shows very good agreement with actual values that have been experimentally determined. This correlation means that the model has an appropriate representation of effects due to the content of fibers, infill density, and printing speed on surface roughness. For example, the predicted values for experimental values of SSR from 4.22 µm to 16 µm indicate that there is a very high reliability of the model for surface quality assessment. Similarly, for tensile strength, the plot shows an excellent agreement between predicted and actual values, with data points lying consistently along the diagonal line. The model is able to predict tensile strength values ranging from 13.87 MPa to 70.76 MPa, thus showing its ability to account for complex interactions among the 3D printing parameters. The strong closeness between predicted and achieved values emphasizes the robustness of the regression model for successful optimization of the printing process to reach planned mechanical properties. Predicted versus actual plot (a) tensile strength (b) surface roughness.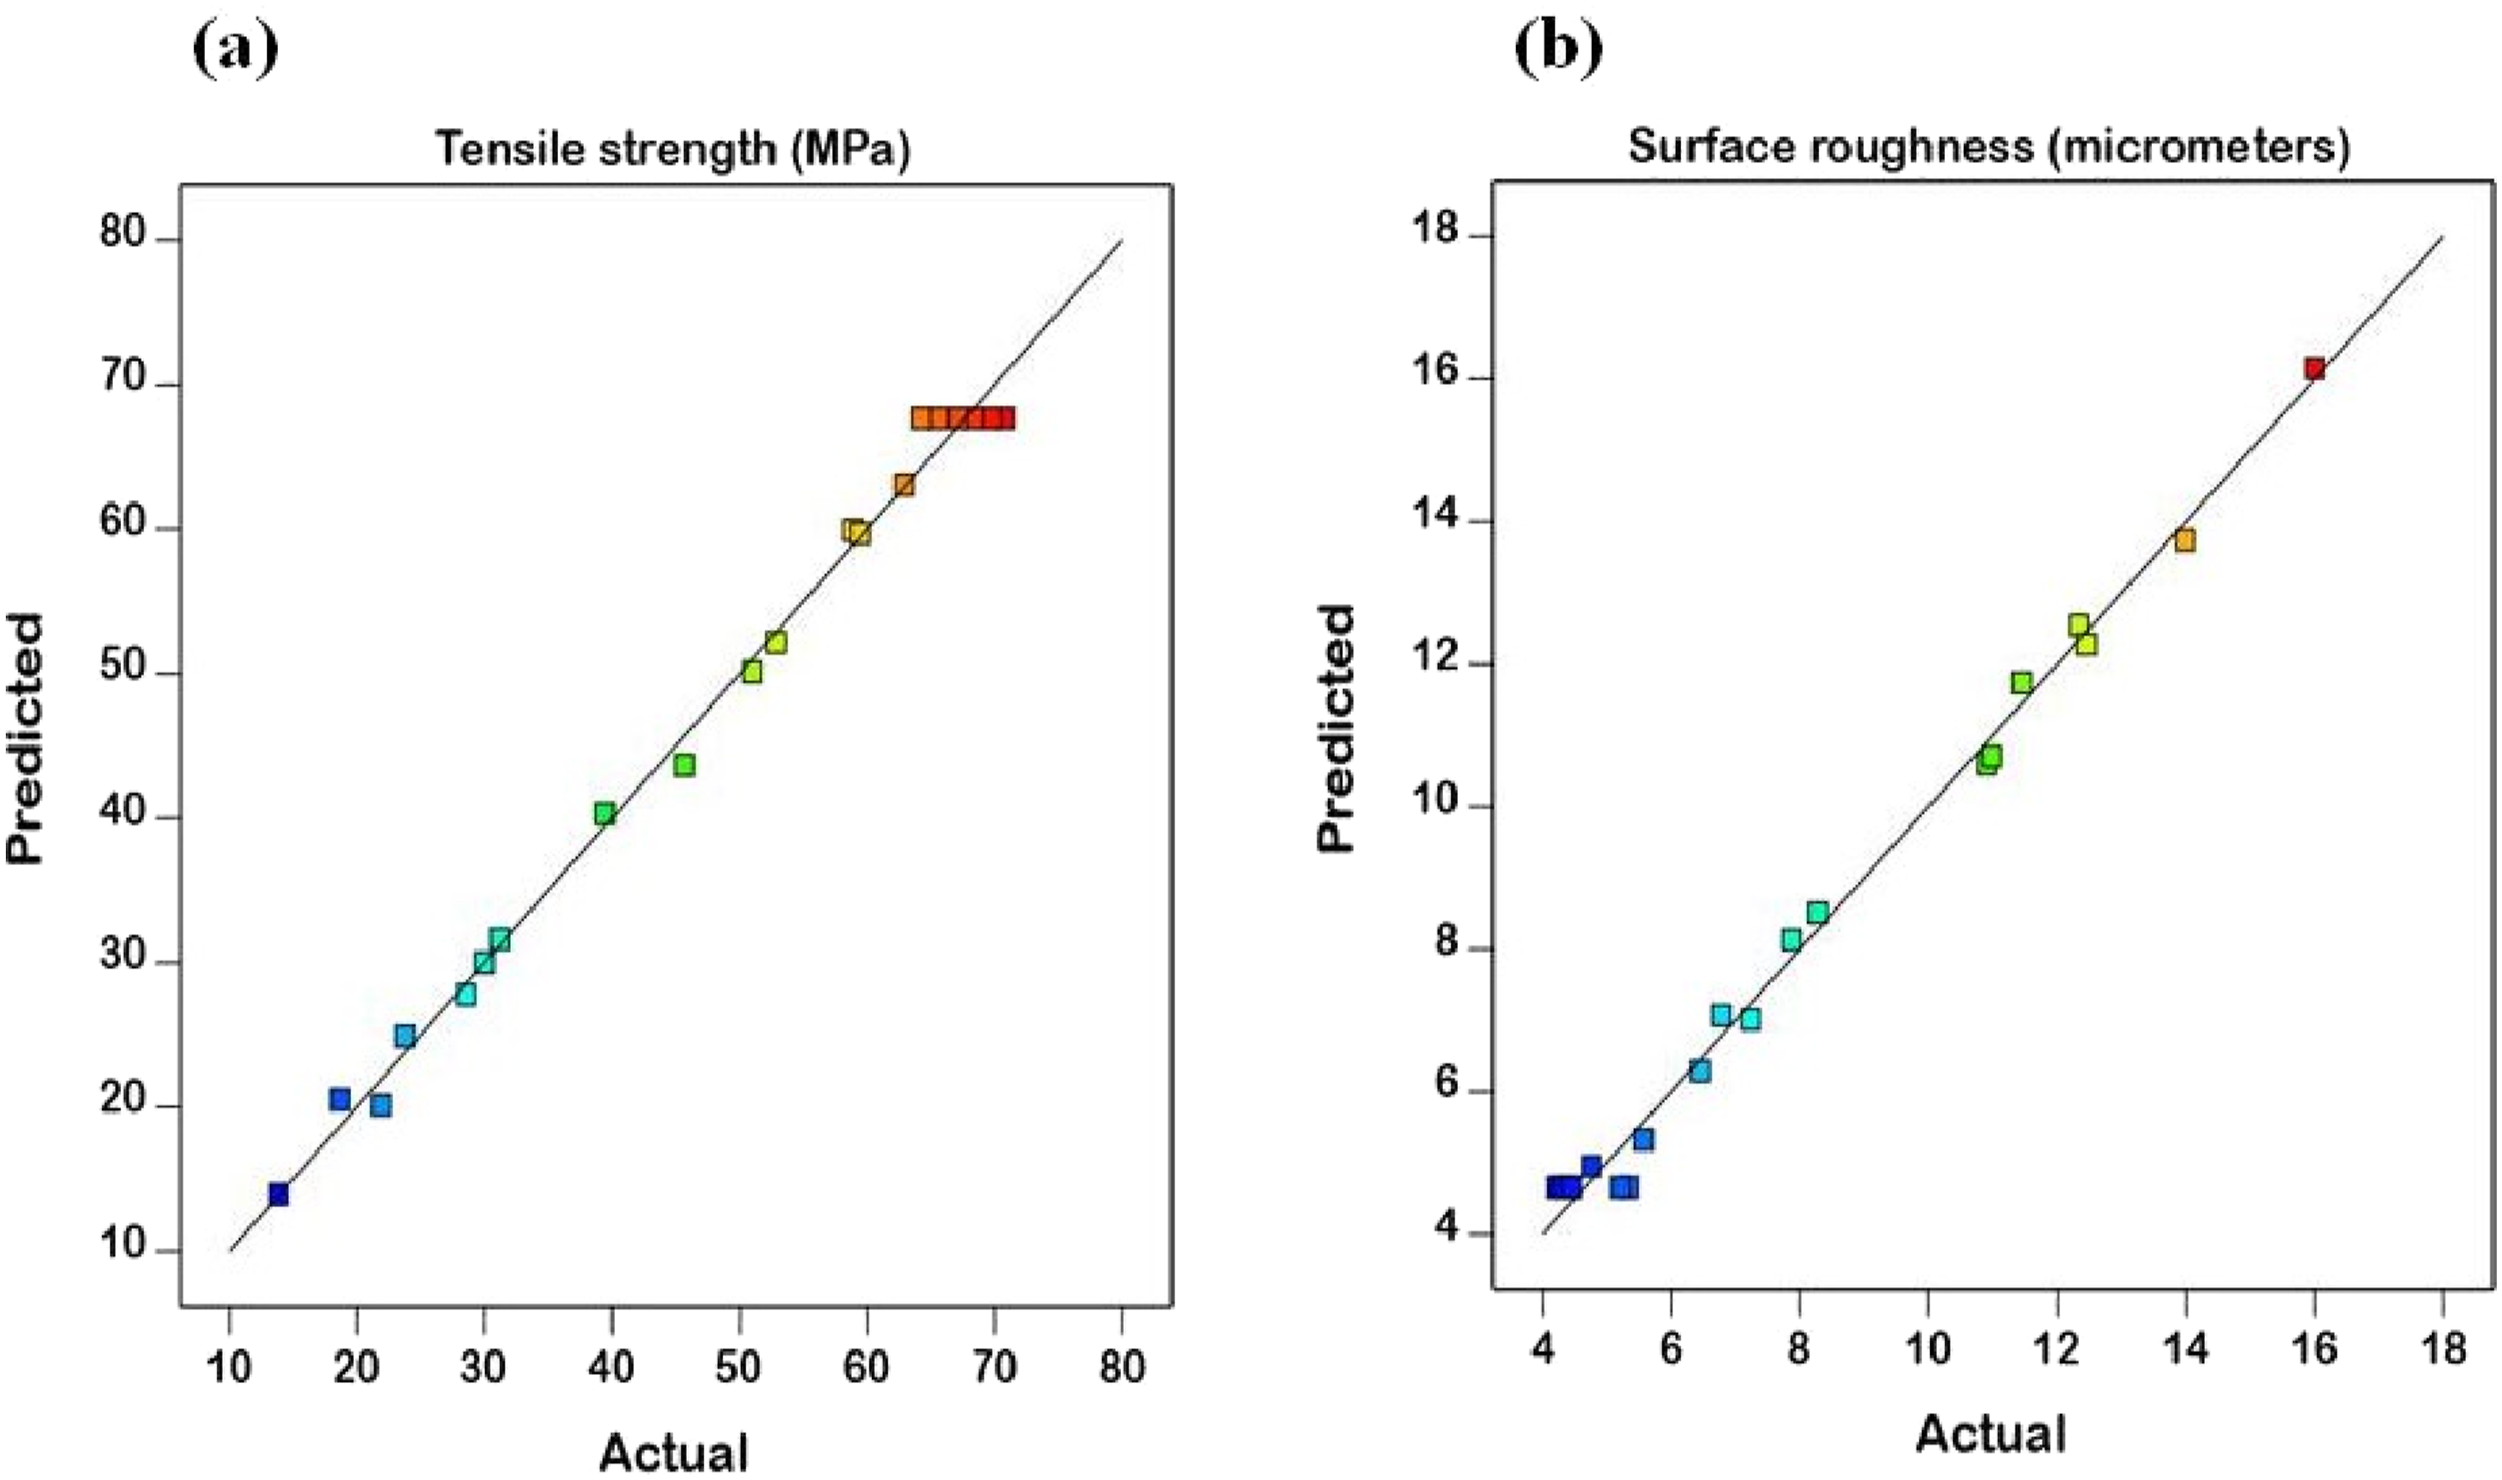
The normal probability plots for the externally studentized residuals presented in (Figure 5) exhibit that those residuals are distributed very close to a straight reference line indicating that normality of residuals is reasonable. The bounds for all residuals would fall well within, what is termed as, ±2 indicating the residuals do not exhibit any influential outlier characteristics. Furthermore, no funnel shaped distributions or systematic trends were observed within the distribution of the residuals, thereby verifying constant variance or homoscedasticity and independence of the residuals. Collectively, the results indicate that it is reasonable to conclude that the developed regression models are statistically valid and, therefore, suitable for prediction and optimization within the defined parameter space. Normal plot of residuals (a) tensile strength (b) surface roughness.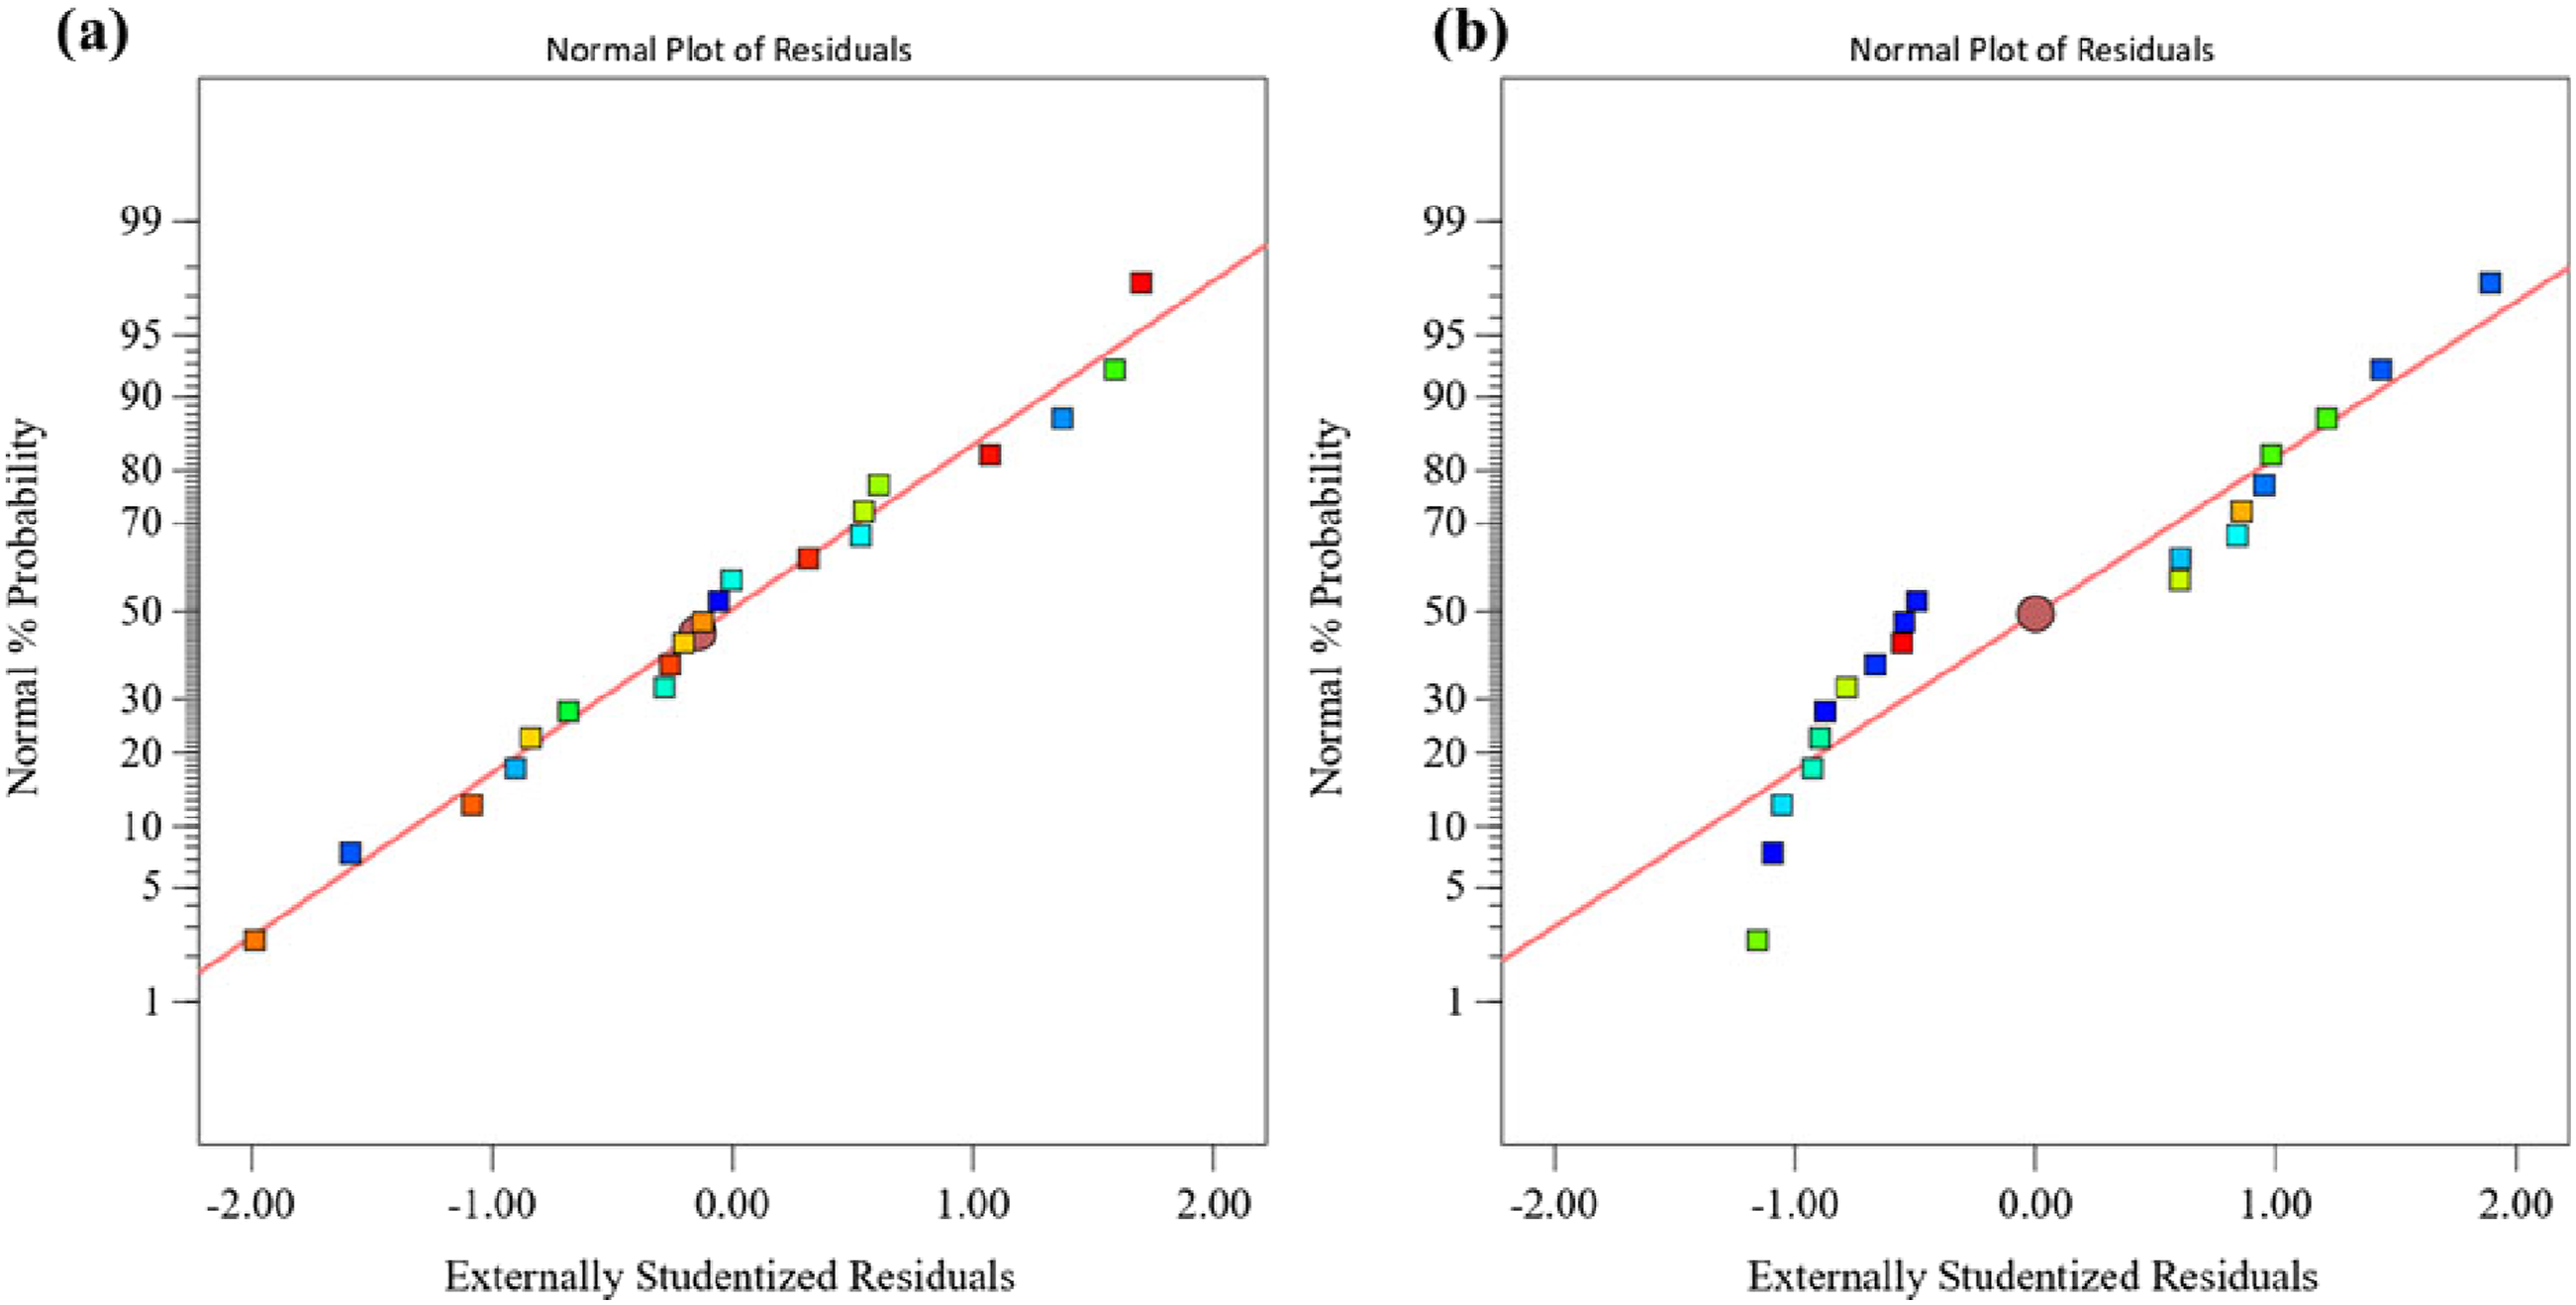
Result and discussion
Mechanism-based analysis of 3D response surface plots: Parameter interactions and effects
Figure 6 illustrates the interaction effects of 3D printing parameters on the response surface plot. The combination of SFC, SID, and SPS directly affects the surface roughness (SSR) and tensile strength (STS) mechanisms of material deposition and interlayer adhesion through distributing a reinforcement. In other words, interaction between fiber content and infill density is primarily due to the nature of the reinforcement distribution and the type of adhesion bond produced in the matrix. At lower fiber content (24.054 wt%), it is the matrix material that dominates the properties, while the reinforcement gives limited improvement with its tensile strength increment from 23.76 to 18.67 MPa within the 62.16%-97.83% range of infill densities, respectively. However, at infill densities exceeding 80%, stress localization and void saturation exhibit diminishing returns. Conversely, at elevated fiber content (35.946 wt%), the optimal tensile strength of 59.45 MPa is attained at the 97.83% infill density due to an increase in locking and reduction in voids. Conversely, for roughness, it increased with fiber content from (10.9 µm at 24.054 wt% and 62.16% infill density) to (16 µm at 35.946 wt% and 97.83% infill density) because of poor encapsulation of fibers and resultant rough surface. Effects of 3D printing parameters on the response surface plot.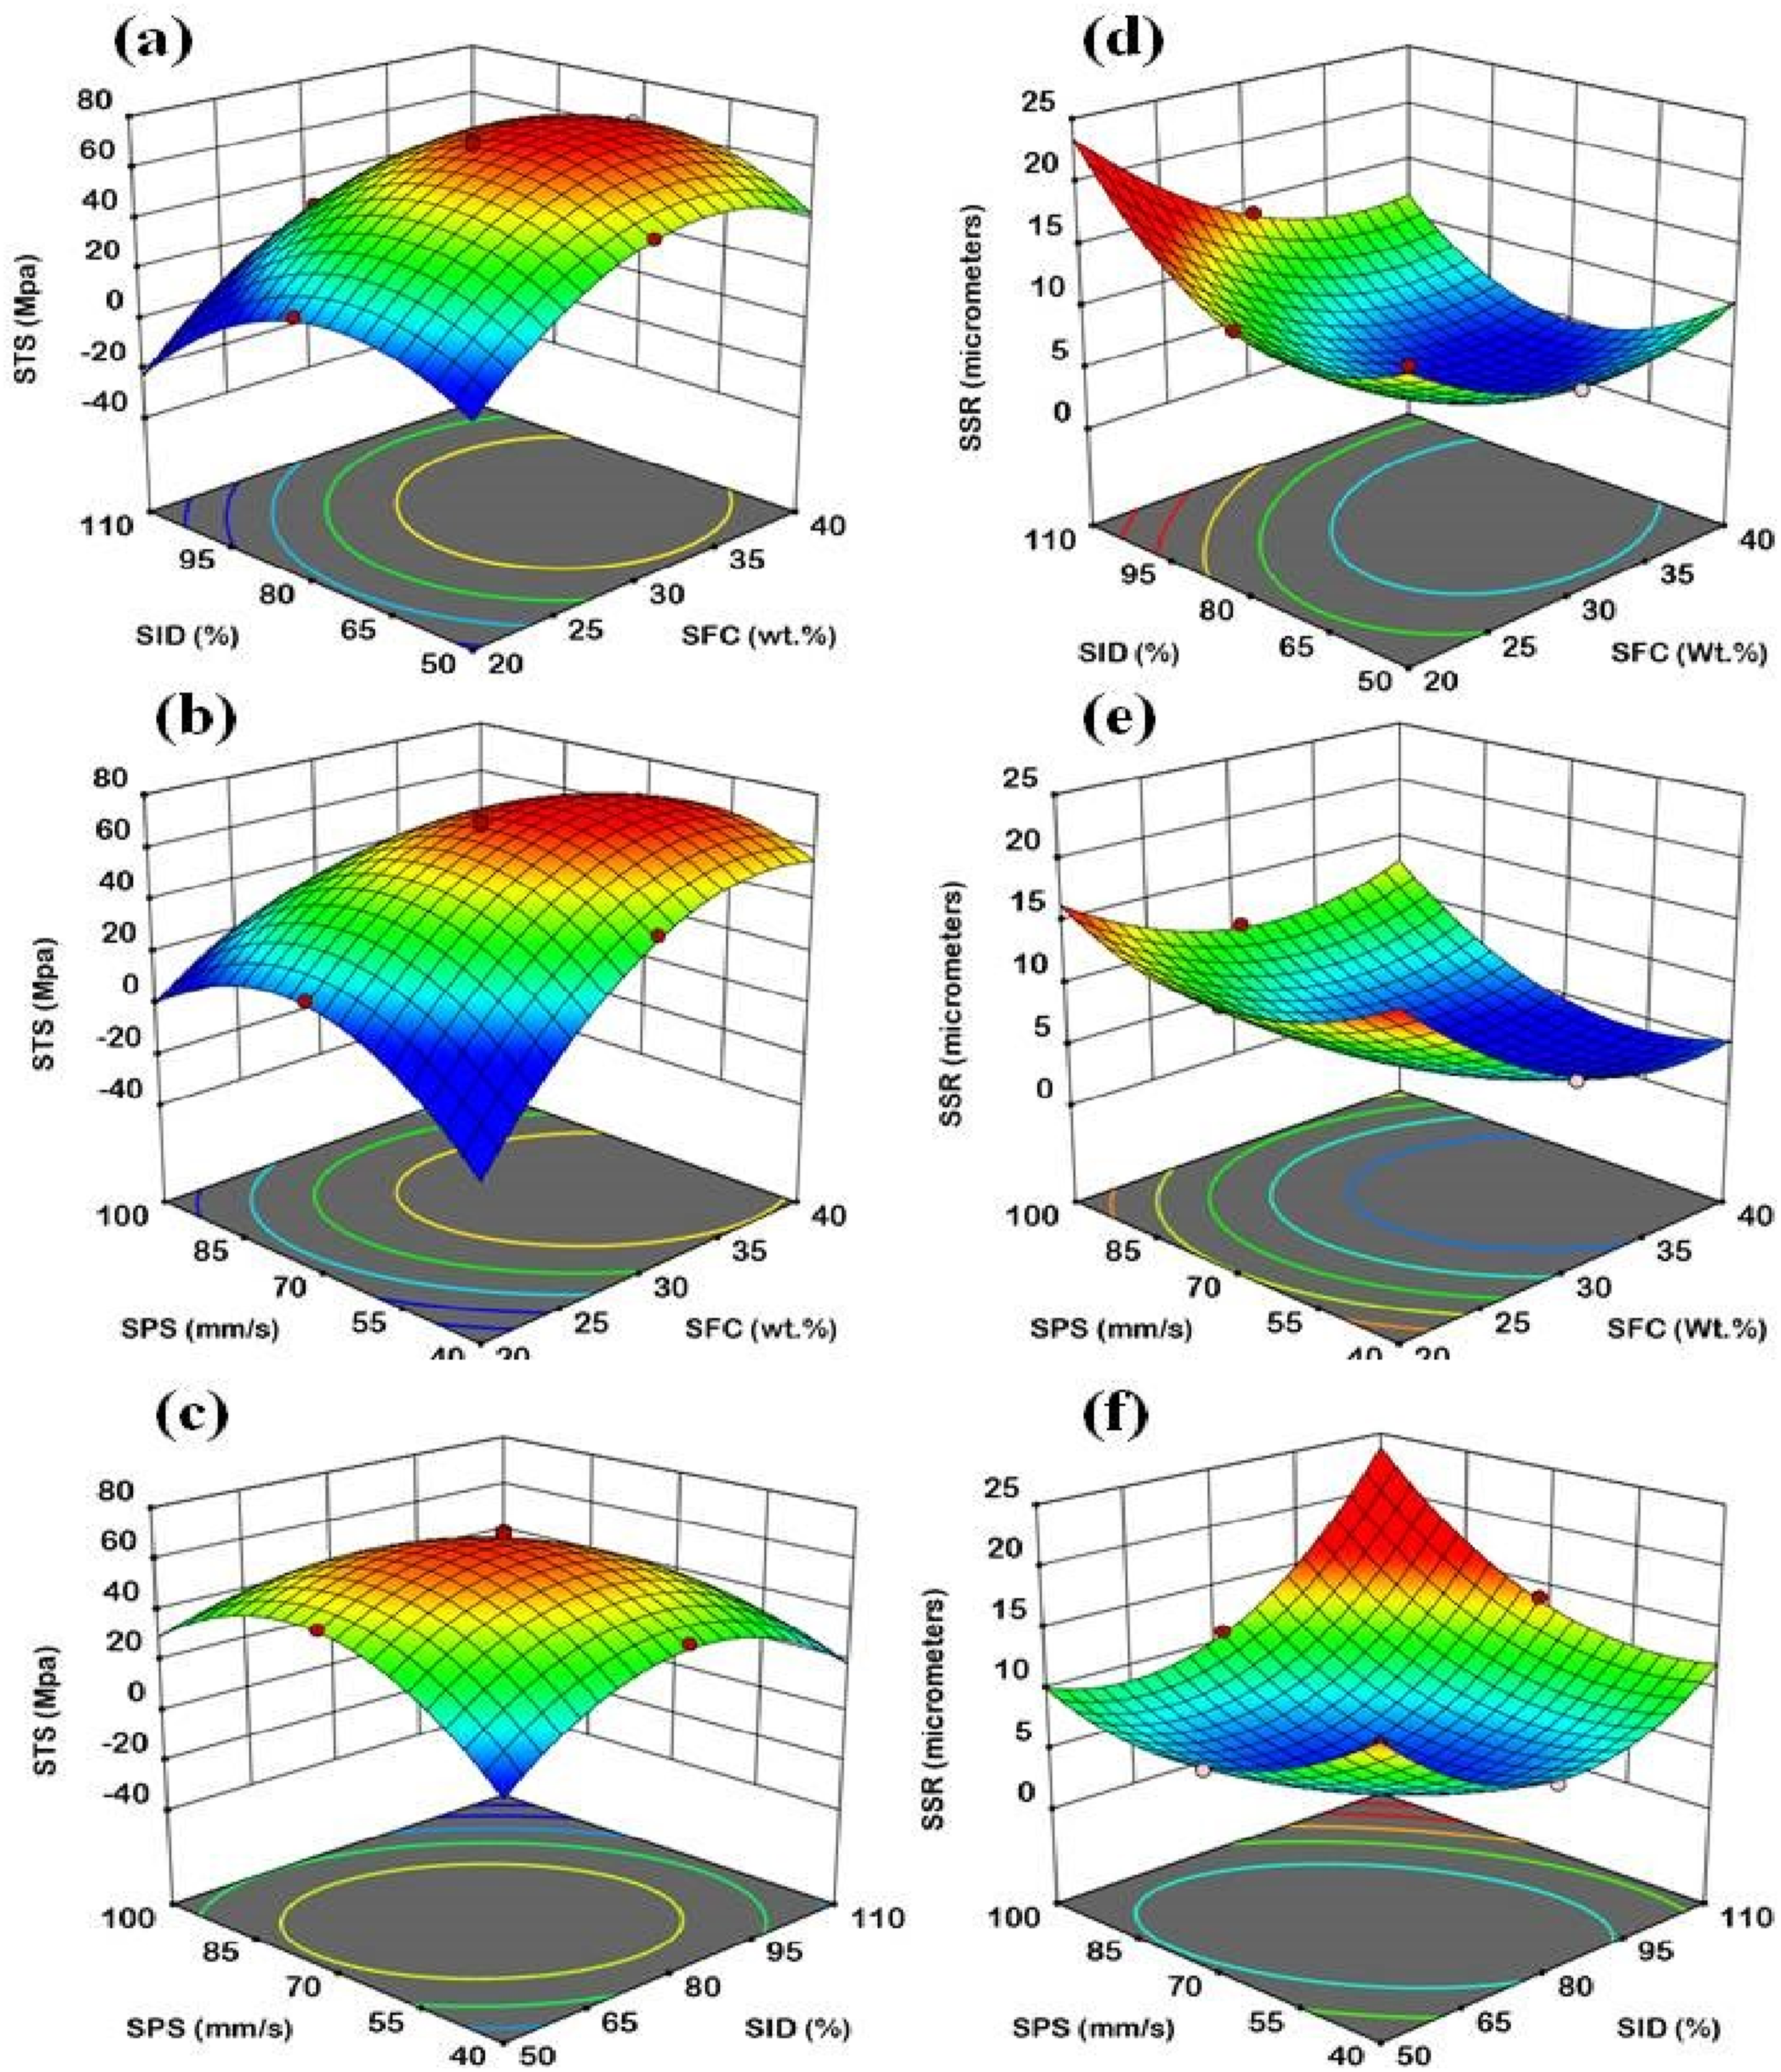
The interaction between fiber content and printing speed had a very noticeable effect on the dynamics of deposition, and layer fusion and thermal gradients during solidification were accordingly determined. In combination with slower printing speeds (52.16 mm/s), surface smoothness is obtained, reducing SSR to 6.45 µm when utilizing 24.054 wt% fiber content because of the time for polymer flow and fiber encapsulation. At higher printing speeds (87.83 mm/s), the very short solidification time led to the increase of SSR to 11.45 µm at 35.946 wt% fiber content because of insufficient fiber distribution and reduced material wetting. Tensile strength improved to reach its optimal value of 52.87 MPa at 35.946 wt% at reasonable printing speeds (between 52.16 and 70 mm/s) as a result of improved adhesion. However, excessive speeds reduced layer adhesion and tensile strength by rapid cooling and incomplete interfacial diffusion.
Combinations of infill density and printing speed regulate packing density and inter-layer cohesion. Low infill density (62.16%) reduces mechanical interlocking, and higher printing speed weakens the interfacial bonding between adjacent layers, resulting in a lower tensile strength range of 23.76–39.42 MPa. In addition, the presence of voids further limits effective load transfer and contributes to the reduced mechanical performance. 20 High infill density (97.83%) eliminates most voids and therefore the stress is distributed in a better way, tensile strength being 59.45 MPa at slow speeds but with high printing speeds, it reduces to 29.98 MPa due to reduced layer bonding. Spoiling the surface roughness is also higher at higher speeds, increasing to 16 µm at high speeds (counterclockwise).
In conclusion the fiber content decides on strength generating mechanisms, i.e. higher content with higher load transfer capability but also increased surface roughness due to fiber-exposure. Here, infill density controls the packing efficiency and hence the void fraction with porosity having optimal values (∼80%) for achieving both surface properties good, while mechanical properties at their maxima. Printing speed controls thermal conditions and resultant deposition, moderate speeds (52.16 -70 mm/s) yield smoother surface and harder inter-layers bonding. Tuning these parameters is actually deeply related with the means of molten flow, fibers-to-matrix bonding and inter-layer diffusion hence leading in appropriate performance for a wide scope of applications in additive manufacturing.
Optimization of 3D-printed PLA composite parameters
The 3D printed pineapple fiber-reinforced PLA composites was used to optimize high-performance mechanical and surface properties with advanced statistical tools to find the exact combination of process parameters leading to an increase in mechanical and surface performance.
The study, guided by overlay plots (Figure 7) generated using response surface methodology (RSM), established the optimal parameter levels as infill density (SID) of 77.42%, fiber content (SFC) of 34.802 wt%, and a printing speed (SPS) of 62.89 mm/s. These levels realized a maximum tensile strength of 73.89 MPa, indicating material ability to sustain high loads, and a minimized surface roughness of 3.36 μm, implying excellent surface finish with minute irregularities. This increase in tensile strength is due to the synergistic effect of high infill density and optimized fiber content. The 90% infill density is compact, ensuring good stacking of the layers and interlayer bond strength to resist mechanical deformation. The fiber content, in this case, reinforcement of a 34 wt% addition, is distributed along the PLA matrix such that it can assist in the load distribution thereby ensuring more mechanical stability. High printing speed provides a compromise between material deposition and cooling, so no defects like delamination or overheating can happen in the deposited layers and compromise mechanical properties and surface quality. Reduction in surface roughness down to 3.38 μm can be attributed to uniform deposition of the material due to optimized printing speed supported by structural homogeneity due to high infill density and controlled fiber dispersion resulting in smooth surface profiles. Overlay plot (optimization).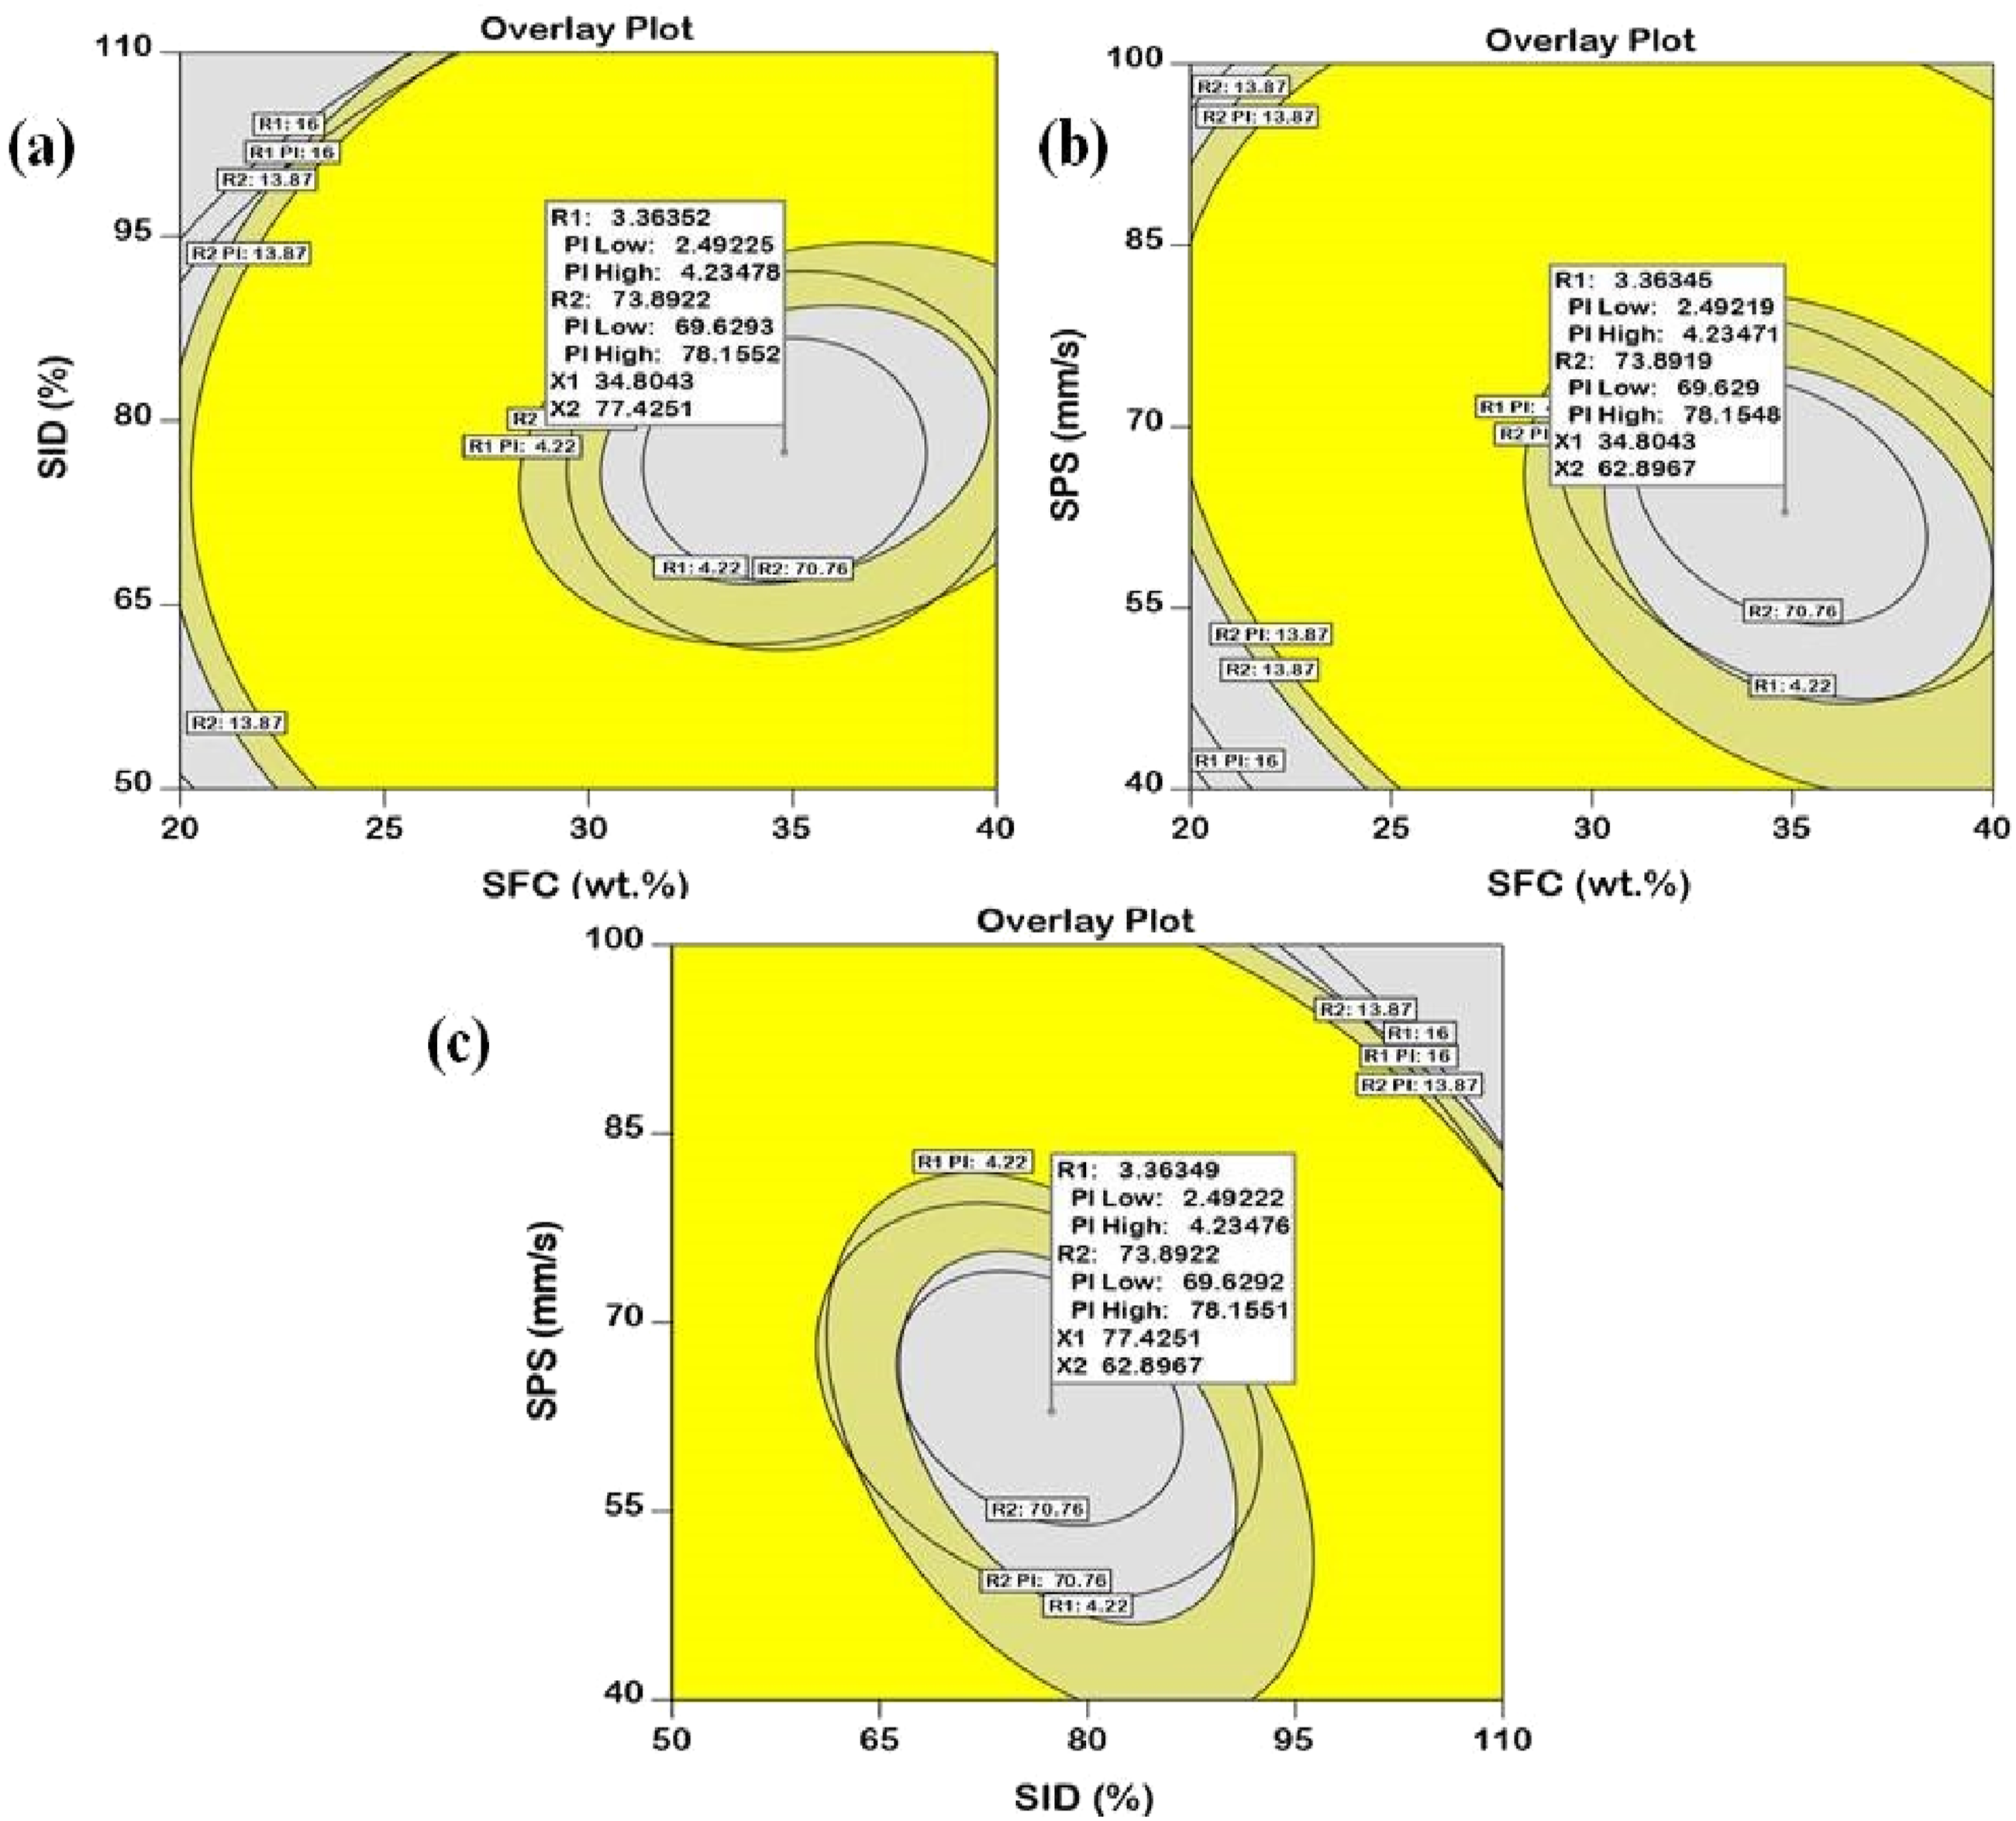
The present findings point to the evident significance of parameter optimization in improving the performance of 3D-printed composites, revealing how the dynamics of the interplay of infill density, fiber content, and printing speed is quite a catch when it comes to achieving multi-objective optimization. Provided that these parameters not only improve the mechanical integrity and surface quality but also serve as benchmarks for the development of high-performance composite materials.
The desirability function was used to obtain the optimal levels of the important parameters required to maximize tensile strength and minimize surface roughness, as shown in the Figure 8. The infill density (SID) of 90%, fiber content (SFC) of 34 wt%, and a printing speed (SPS) of 75 mm/s, with each desirability achieving a perfect value of 1. Both tensile strength and surface roughness have a desirability value near 1; R2 is 0.9988 as it indicates a remarkable improvement in mechanical properties, while R2 is 0.9815 because surface irregularities were effectively minimized. In terms of desirability, the combined result of 0.9901 shows that the optimization process is quite robust, effectively balancing both the responses. Desirability of the model.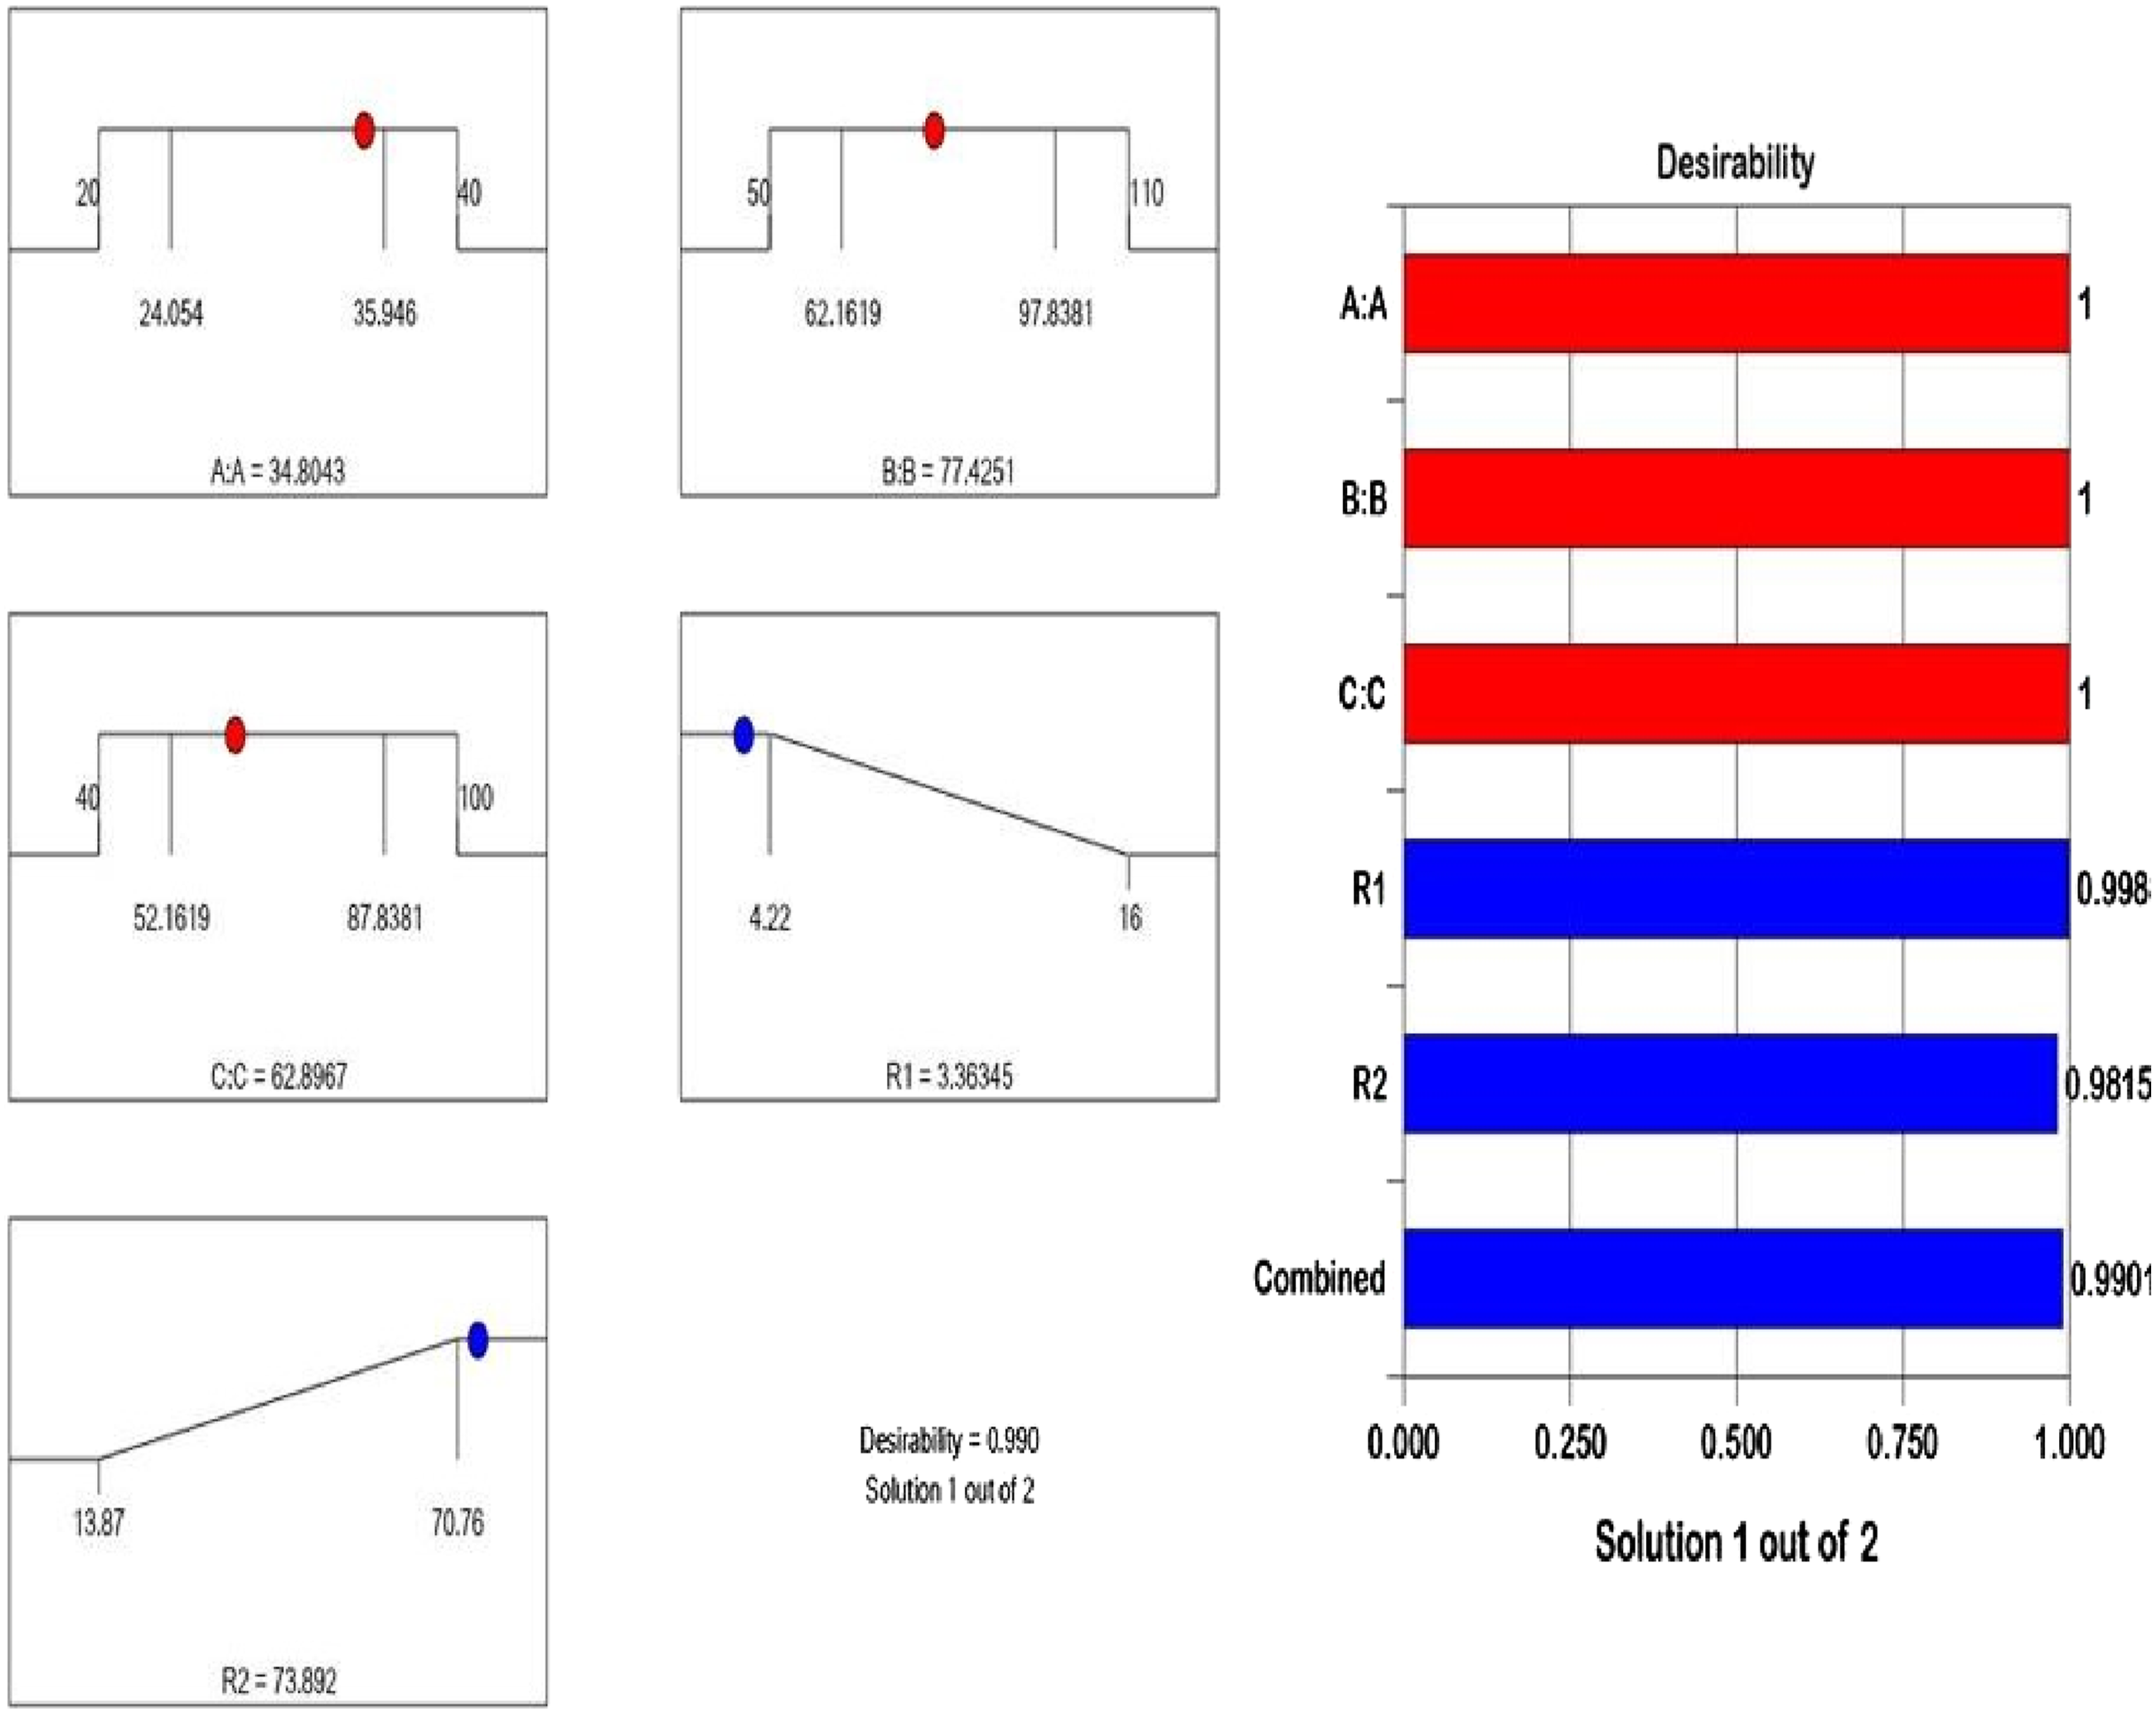
To verify that the selected combination of optimized parameters is reliable, three duplicate test specimens were manufactured using the same process parameters of (34.80 wt percent SFC, 77.42% SID, and 62.89 mm/sec SPS). The results presented a very small degree of variation as indicated by the low standard deviation of ±1.12 for tensile strength and ±0.09 for surface roughness, strongly supporting the fact that the optimized parameter combination was achieved in an extremely reliable manner. These results further confirm that the results derived through RSM were both repeatable and taken from a methodology that produced consistently superior results from the investigation of mechanical and surface properties.
Sensitivity analysis of input parameters using perturbation plots
The perturbation plots (Figure 9) in this work represent the effects of the input parameters—SFC (A), SID (B), and SPS (C)—on the key responses, namely surface roughness and tensile strength. These plots are provided to show a detailed sensitivity analysis by presenting the change in the responses with variations from the reference parameter values. Sensitivity analysis through perturbation plot (a) tensile strength (b) surface roughness.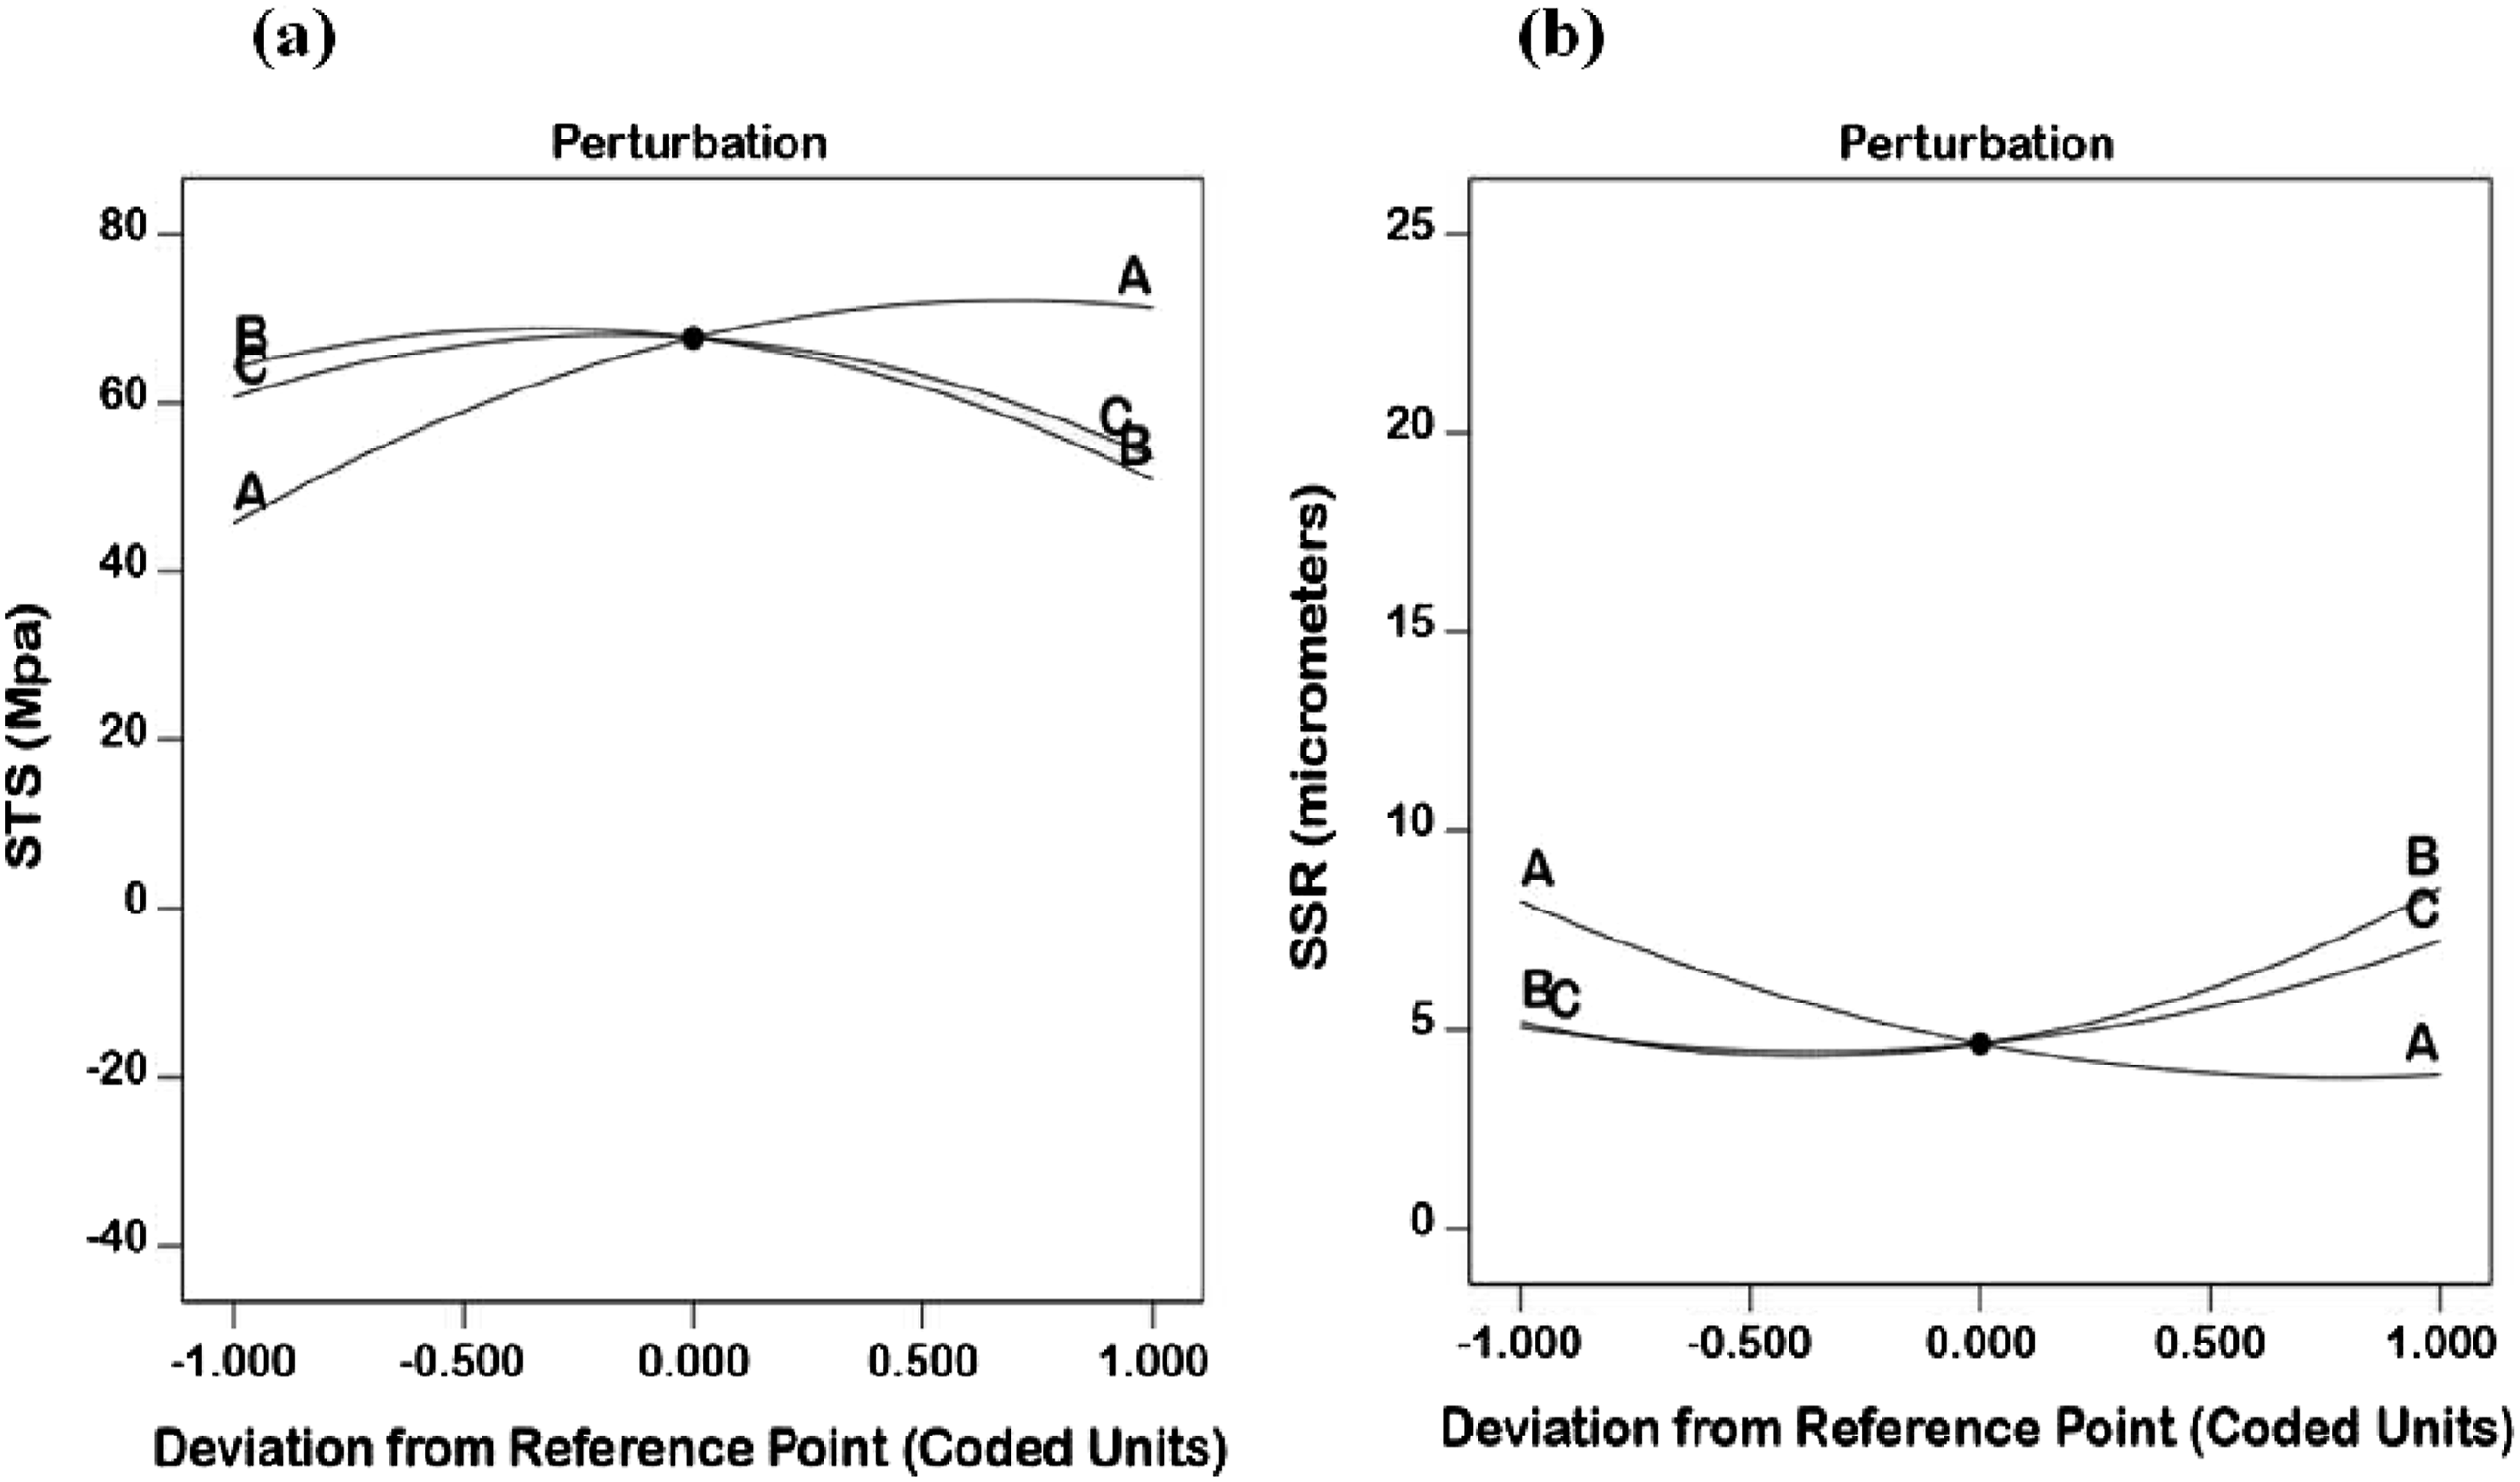
Effects on surface roughness (SSR)
The perturbation plot for the SSR displays how changes of input parameters affect the surface quality of the 3D-printed pineapple fiber-reinforced PLA composites.
SFC (A): The plot reveals that deviations from the reference fiber content (30 wt%) have strong effects on the SSR with a relatively steep slope. Once again, an increase of fiber content beyond optimal level increases SSR; this implies that surplus reinforcement affects the surface finish negatively through agglomeration or uneven dispersion of fibers.
SID (B): Infill density affects SSR to a moderate level with a slightly curved profile. Increasing infill density increases SSR probably because more densely layered in fills will introduce in homogeneities at the surface.
SPS (C): The effect of printing speed on SSR is high, and at higher speeds, it’s an upward trend. Fast speeds probably sacrifice the layer wise homogeneity of deposited material leading to a surface that’s more rough than it needs to be. The lowest SSR is obtained close to the reference settings of the parameters, which again confirms the critical role of balanced fiber content and controlled processing conditions.
Effect on tensile strength (STS)
The perturbation plot for STS gives insight into the mechanical performance sensitivity to parameter variations. The sensitivity to fiber content is very high, as can be derived from the steep slope in the graph. Increasing the fiber content enhances STS up to the optimum point where the interaction between fibers and the matrix is optimal. Beyond this point, further increases may reduce the value of STS due to fiber clustering or reduced interfacial bonding.
SID (B): Infill density demonstrates a notable effect on STS, with a steep slope indicating its critical role in determining the composite’s load-bearing capacity. A higher infill density generally improves STS due to increased structural rigidity, but excessive density might lead to internal stress concentrations, reducing mechanical performance.
SPS (C): This is the effect of the printing speed on STS, which is relatively lesser than that of fiber content and infill density. A moderate downward curvature is a sign that higher speeds might damage layer adhesion and fiber alignment, decreasing the tensile strength.
From the perturbation plots, it is clear that the fiber content is the most sensitive parameter for both responses, followed by infill density and printing speed This further emphasizes the need to optimize fiber content to achieve a balance between mechanical properties and surface quality. The interplay of these parameters underscores the complexity of the optimization process in 3D-printed pineapple fiber-reinforced PLA composites.
Tensile fracture analysis
Figure 10 shows the SEM micrographs of the tensile fracture surfaces of the 3D-printed PLA composites reinforced with pineapple leaf fiber powder, where the reinforcement appears as irregular nano–micro-scale particles rather than long fibers. The continuous phase of the PLA matrix is made up of PLA matrix and contains the PLF powder particles as bright angular particles that are partially or fully embedded within the matrix. The voids or cavities seen as dark and irregular are created as a result of either incomplete consolidation of the particles, or debonding of particles from the matrix. Tensile fracture morphology (a) experimental condition 7 (b) experimental condition 15 (c) optimization parameter condition (d) stress–strain curves of pure PLA and the optimized PLA–PLF composite.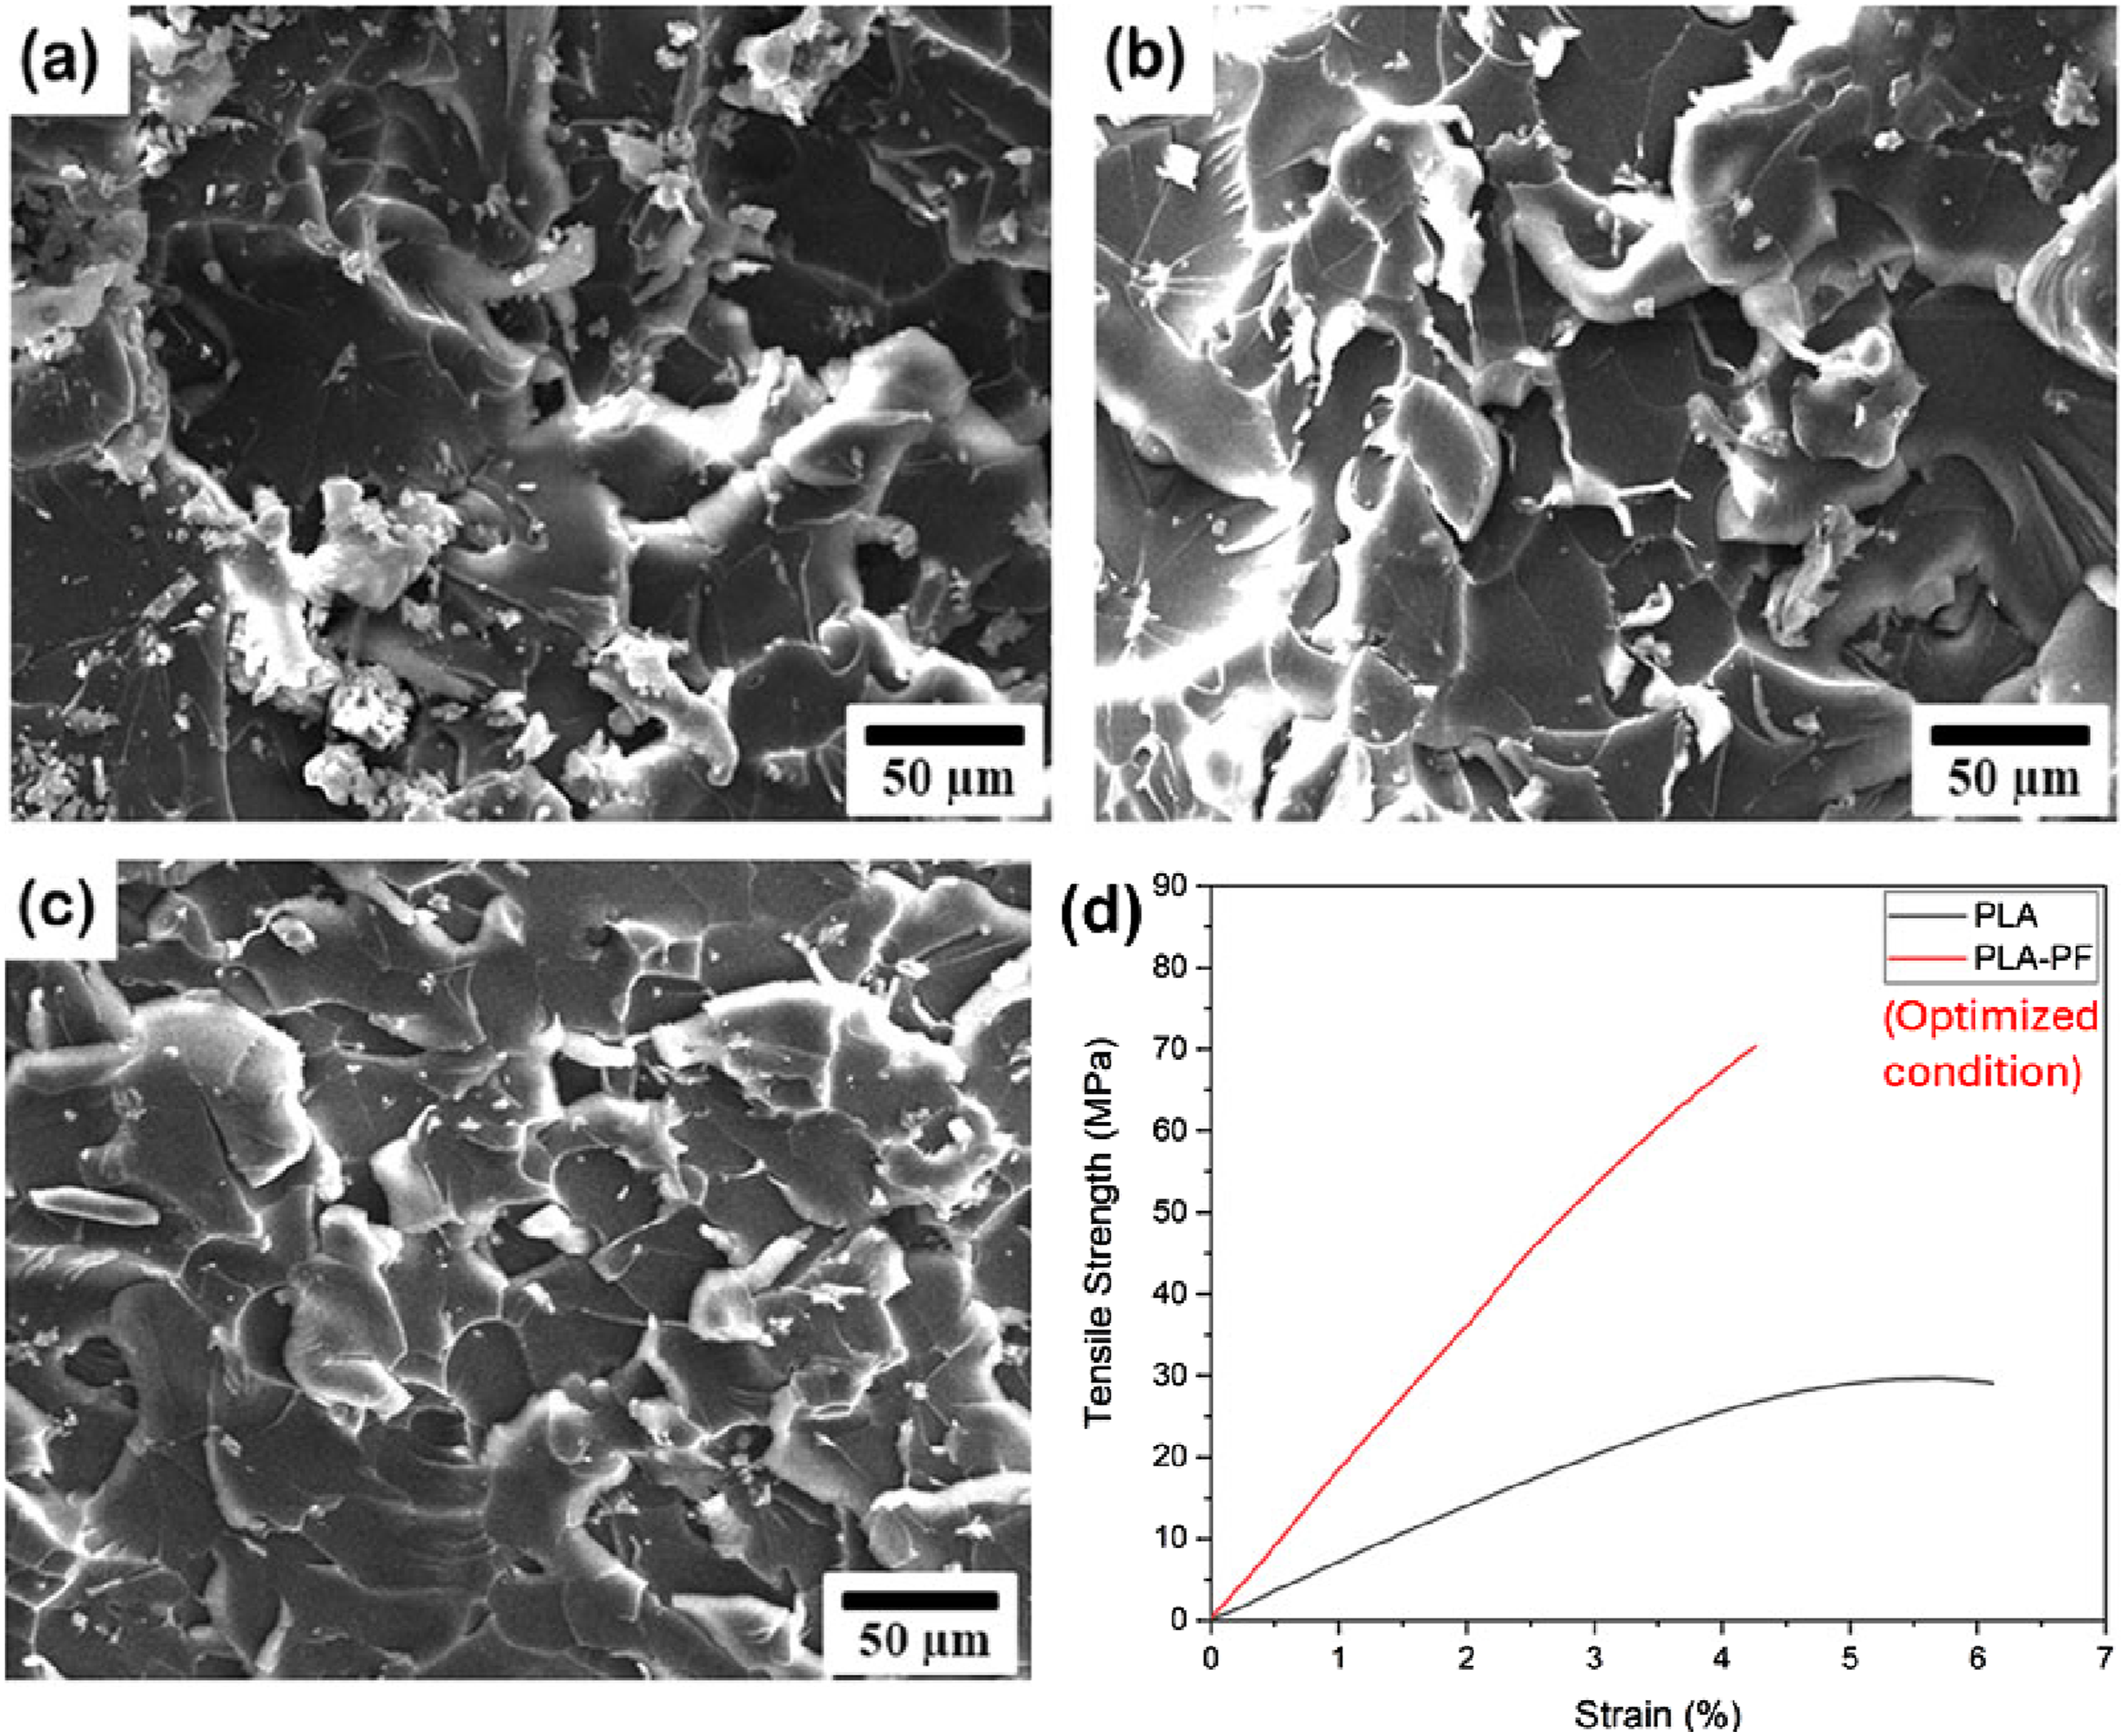
In Figure 10(a), which depicts a low strength condition, the fracture surfaces exhibit large interconnected voids that are indicative of inadequate consolidation of the melt during printing. Several PLF powder particles are either loosely held or completely detached, creating particle pull-out sites. The nano–micro fragments are sparsely distributed, supporting the reviewer’s observation that the reinforcement content appears visually low relative to void volume. The flaws are located within areas of high local accumulation of stresscausing faster initiation, growth and propagation of cracks, and faster brittle failure. 30 This results in lower measured tensile strength for this condition. Figure 10(b) shows a denser microstructure with better distribution of the PLF particles and less large voids. While some particle pull-out can be seen, most are better loaded into the PLA matrix. There’s evidence of some degree of minor plastic deformation of the matrix indicating better load transfer along with the presence of residual micro-voids and local debonding areas limiting performance of this composite. 31
In contrast, the optimized condition shown in Figure 10(c) reveals a densely consolidated fracture surface with minimal voids and well-embedded PLF nano–micro fragments. The presence of plastic deformation, tearing and fibrillation present in matrix is an indicator that matrix has the capacity to absorb more energy than other fractured models 32 during failure of sample. The combination of lower levels of particle pulls out and higher level of interfacial adhesion allows for efficient transfer of loads which contributes to the higher tensile strength of this composite than all other tested composites. The correlation of fracture properties and mechanical behavior was made in part by referring to the stress-strain curves shown in Figure 10(d) for both pure PLA and optimized PLA-PF composites. Stress-strain curve of optimized PLA-PF composite shows much higher tensile strength (73.89 MPa) and stiffness which corresponds to the compact fracture morphology and reduced amount of void formation as seen in Figure 9(c). These data verify that optimized printing conditions lead to improved particle bonding with matrix, less voids and greater overall mechanical integrity.
Validation of the RSM models
To further evaluate the predictive capability of the RSM models developed and to address a potential concern that high values of R2 may indicate overfitting, three confirmatory experiments were executed at combinations of parameters outside of the initial CCD. These validation points, within the allowable range of fibre content, infill density, and printing speed, were selected but kept outside of coded experimental levels to test the interpolation capabilities of the models under new conditions.
Validation of the RSM model.
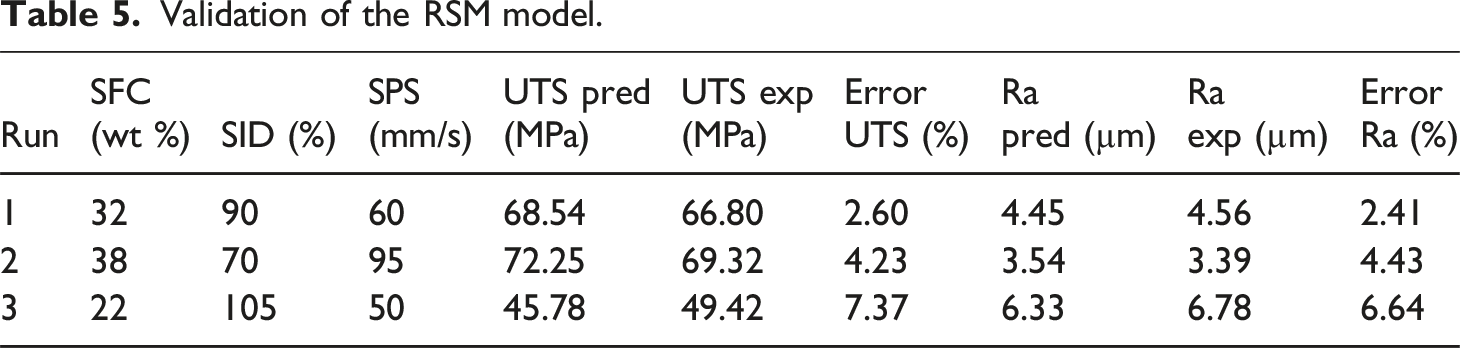
The tensile strength prediction errors fell between 2.60% and 7.37%, while surface roughness prediction errors varied between 2.41% and 6.64%. These small error values show great concurrence between the predicted and experimental findings and established the fact that the regression models developed possess excellent interpolation capability. The slightly high deviation for tensile strength at run 3 can be ascribed to inherent variability in fibre dispersion and interfacial interactions, which is common in bio-fibre-reinforced PLA composites. The results of external validation, in combination with the statistically insignificant values of lack-of-fit and the normally distributed, independently scattered residuals discussed above, prove that RSM models are not overfitted and remain robust, accurate, and reliable to predict and optimize both tensile strength and surface roughness within the studied process window.
Characterization of optimized composite
Fractographic and elemental analysis
Figure 11(a) depicts a fractography of the composite produced at the optimal setting, showing a well-integrated microstructure. It can be clearly seen that fibrous fragments are well embedded in the PLA matrix with minimum evidence of fiber pull-out, indicating a strong interfacial adhesion and thus a good load transfer between the reinforcement and matrix phases. Micro-dimples and roughened areas on the fracture surface imply ductile features at the fracture zone and indicate that during loading, the interfacial debonding and void nucleation were restricted. SEM and EDS spectrum of the pineapple-fiber-reinforced PLA composite fabricated under the optimized process condition.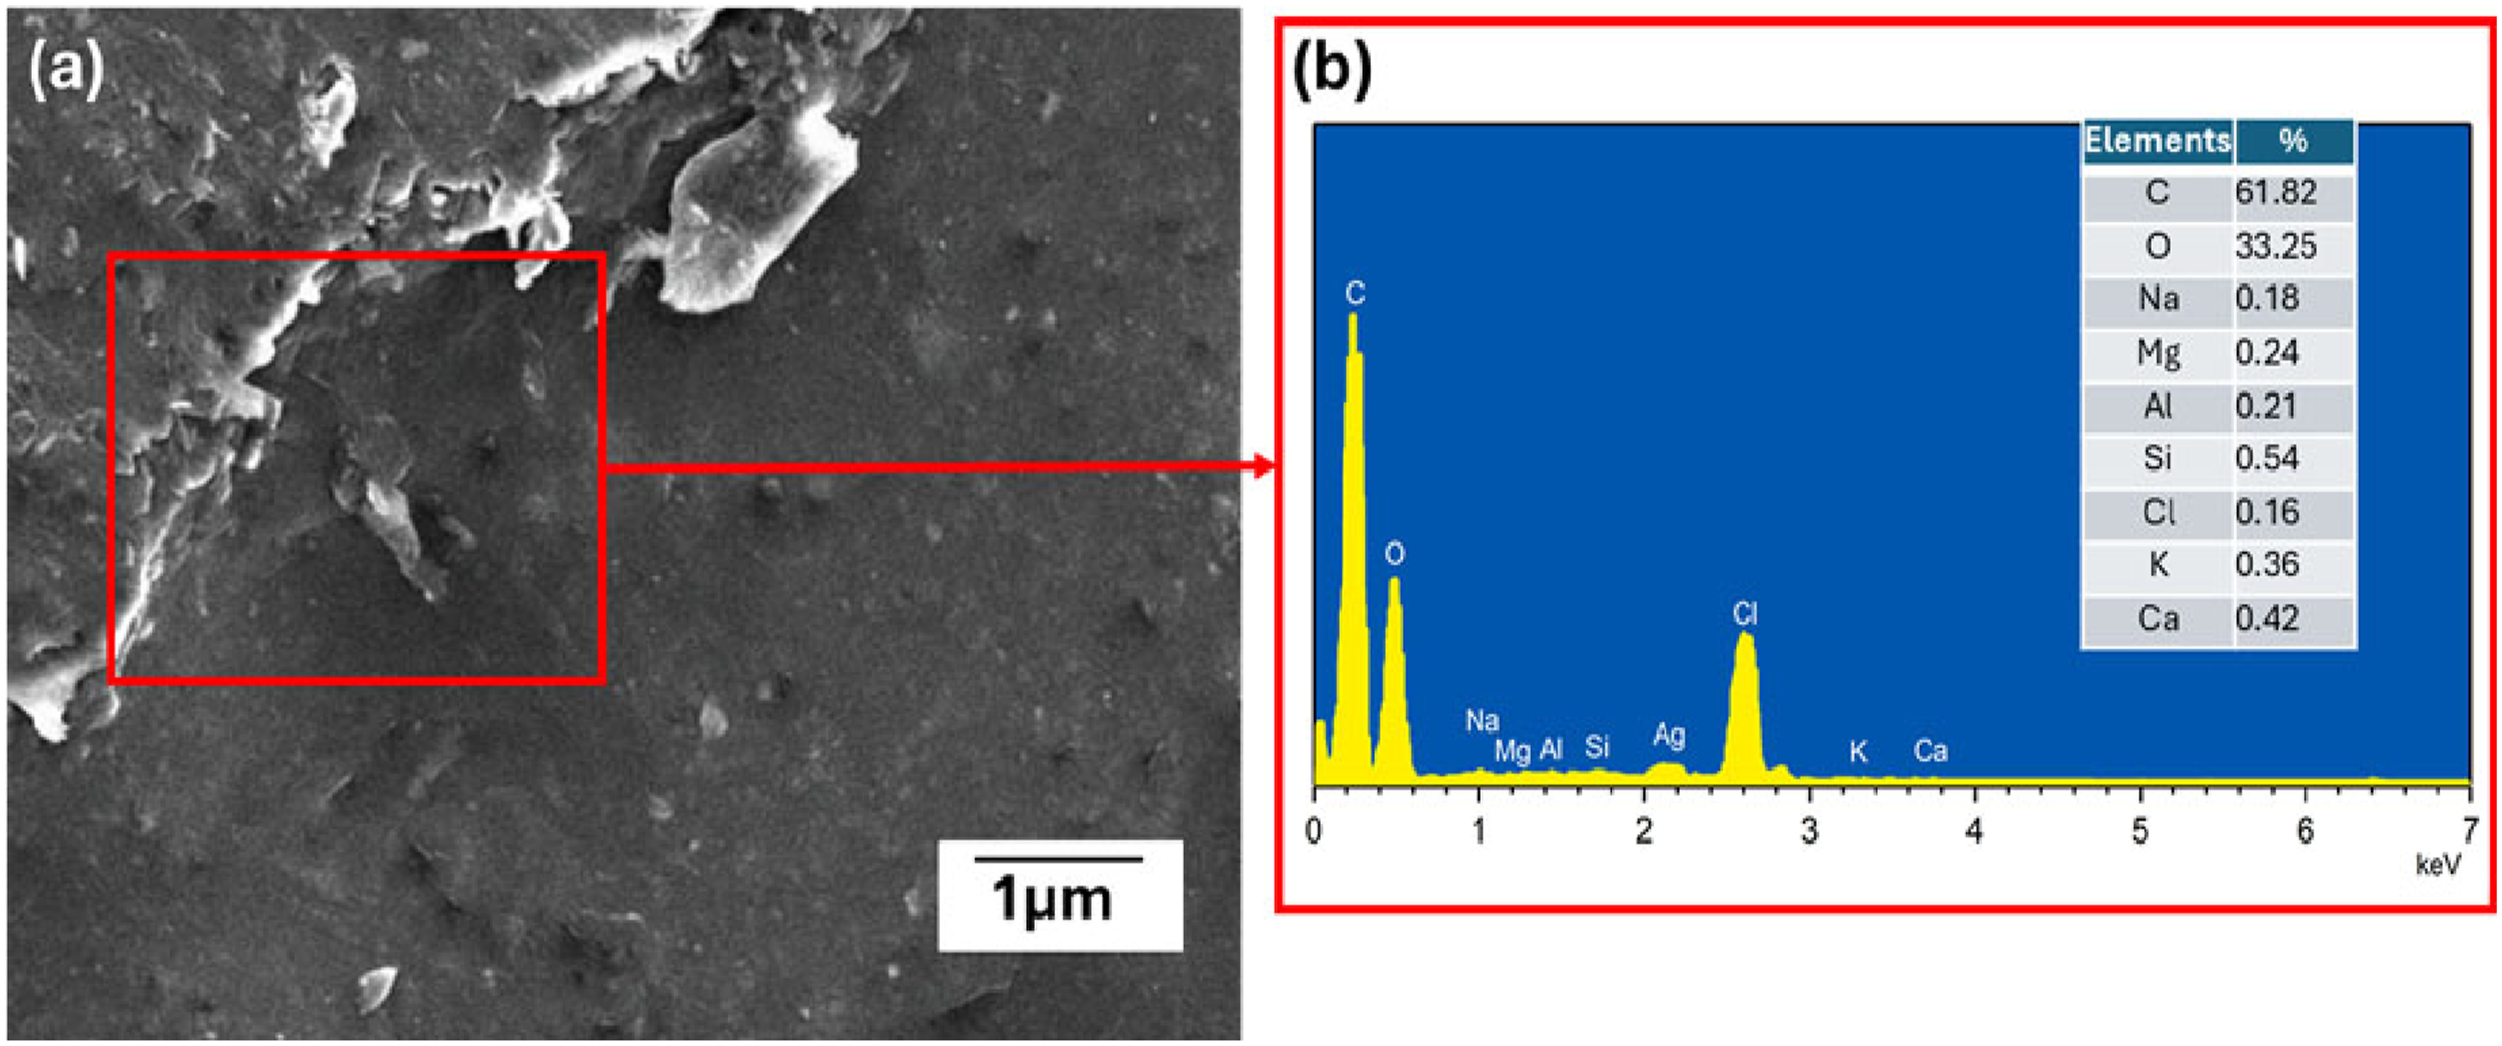
The corresponding EDS spectrum (Figure 11(b)) registers carbon (∼61.82 %) and oxygen (∼33.25 %) as the dominant peaks, consistent with the composite constituents (PLA plus lignocellulosic fibers). Trace elements — Na, Mg, Al, Si (∼0.54 %), Cl, K and Ca (∼0.42 %) — stem from the mineral/ash fraction of pineapple leaf fibers and possible processing residues. The detection of Si and Ca supports the presence of siliceous and calcareous particles adhering at the fiber‐matrix interface, which can promote minor polar interactions and improve interfacial shear strength. 33 The absence of extraneous metallic or contaminant peaks indicates that the twin-screw extrusion and subsequent 3D-printing process preserved chemical cleanliness and did not introduce unintended elements. Combining the morphological and chemical observations, it is clear that the optimized parameter set enabled (i) uniform filament production and 3D-printing flow, (ii) improved layer fusion (reduced interlayer voids), and finally (iii) good fiber dispersion with strong adhesion to the PLA matrix. This microstructural evidence also corroborates the high tensile strength and low surface roughness achieved under optimum conditions as predicted by the RSM–desirability model. The result demonstrates that moderate fiber loading combined with suitable infill density and printing speed effectively enables fiber bridging and matrix wetting to produce a composite with structural integrity and minimum defects.34,35
Fourier transform infrared (FTIR) spectroscopic analysis
Figure 12(a) shows the FTIR spectra of the pure PLA and the optimized pineapple-fiber-reinforced PLA (PLA–PF) composite recorded within the range of 4000–500 cm−1. The spectrum of neat PLA shows characteristic absorption peaks at 2995–2946 cm−1 (asymmetric and symmetric CH3 stretching), 1750 cm−1 (C = O stretching of ester group), and 1180–1080 cm−1 (C–O–C stretching vibration of the aliphatic chain) that are typical for semi-crystalline PLA.
36
(a) FTIR spectra (b) X-ray diffraction analysis of the composites.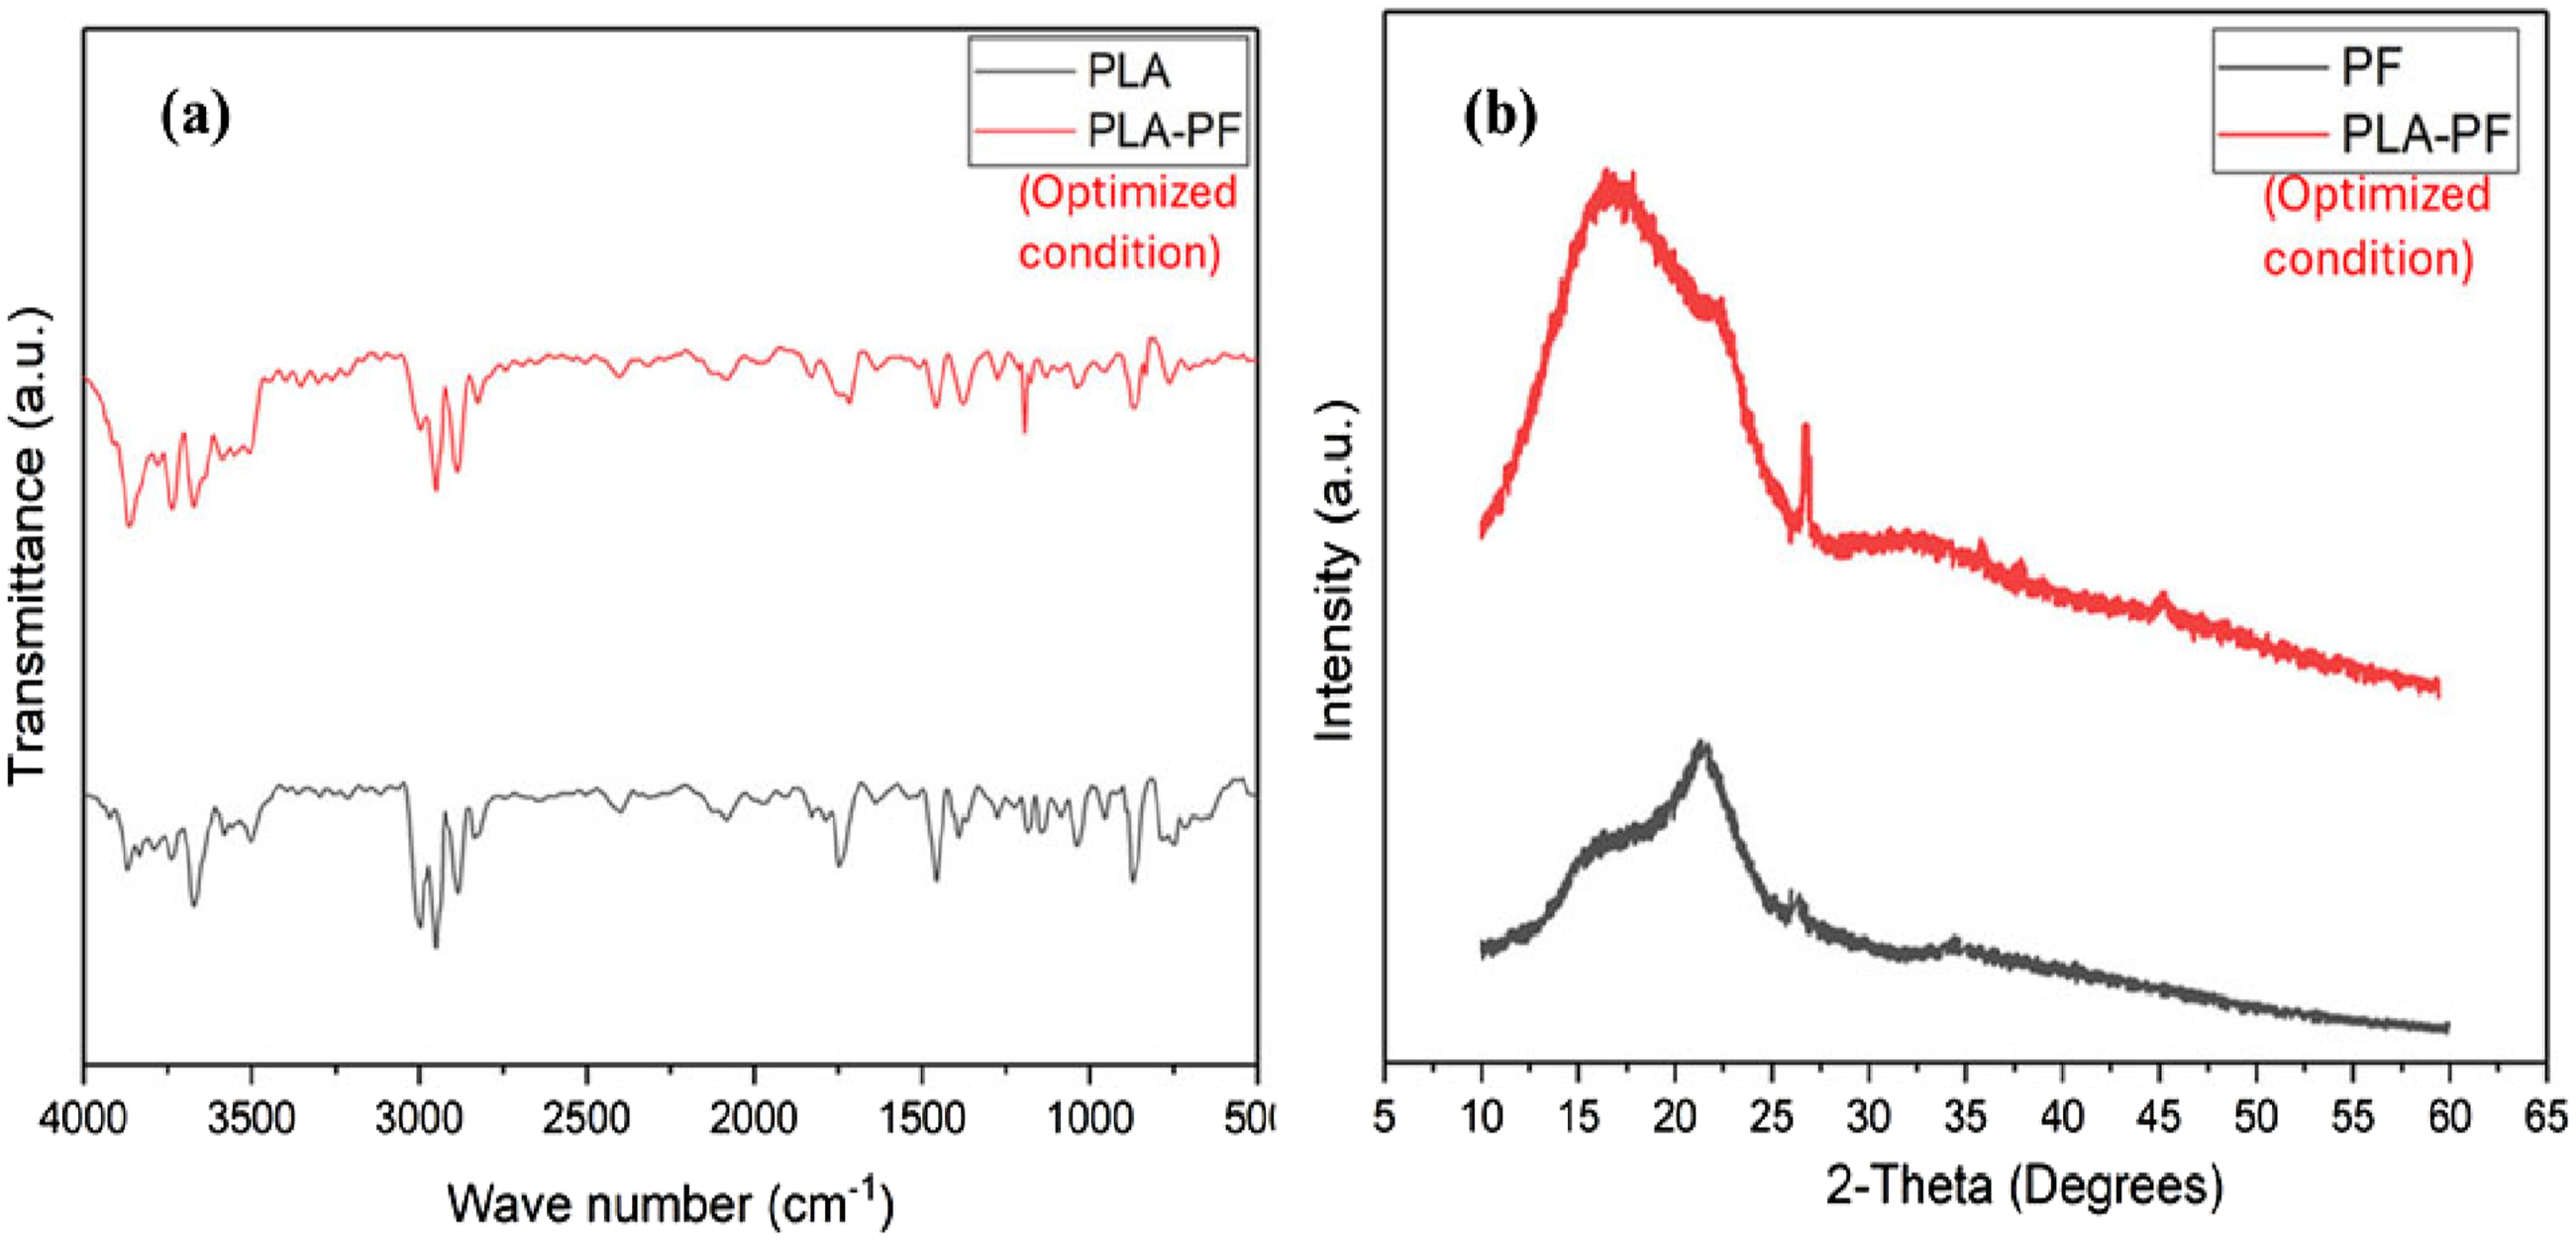
The composite spectrum maintains the major PLA absorption bands, suggesting that no new covalent bonds were formed between the matrix and the fiber during the extrusion and 3D printing steps. However, significant spectral changes are readily noticed. One can see a broadening and increased intensity of the O–H stretching band (3600–3200 cm−1) of the PLA–PF composite, which is due to the hydroxyl groups belonging to cellulose and hemicellulose fractions of the pineapple fiber. 37 This intensity increase confirms the insertion of the lignocellulosic moieties into the PLA matrix; the intermolecular hydrogen-bonding interaction between the –OH groups of the fiber and the carbonyl (C = O) groups of PLA is suggested. A slight red shift (≈3–5 cm−1) of the carbonyl band in the composite spectrum further supports this intermolecular interaction. 38 Beyond that, the increase in the relative intensity of the C–O–C stretching bands (1180–1080 cm−1) can be related to the improved molecular orientation and possible secondary bonding within the matrix due to the addition of fibers. Similar shifts and broadening effects of bands were observed in PLA composites with the addition of agricultural residues, such as banana, rice husk, and coir fibers, and have been attributed to hydrogen bonding and polar interactions, therefore enhancing matrix compatibility.39,40 Finally, the absence of any degradation-related peaks, such as those occurring around 1650–1620 cm−1 for unsaturated C = C, also confirms that optimized processing conditions preserved PLA’s chemical integrity during twin-screw extrusion and FDM printing.
X-ray diffraction (XRD) analysis
Figure 12(b) shows the XRD patterns of the pineapple fiber powder and the 3D-printed PLA–PF composite at the optimized condition. In the PF spectrum, the broad diffraction hump is centered around ≈2θ = 20 – 22°, attributed to the semi-crystalline cellulose I structure along with amorphous hemicellulose/lignin phases. Upon its incorporation into the PLA matrix and printing under the optimized parameters, the PLA–PF composite maintains the PLA characteristic halo peaks around 2θ ≈ 16–19° but appears with a modest increase in intensity and slight narrowing of the main diffraction feature at ∼19°, which is indicative of a modest enhancement in the crystalline order of the PLA matrix presumably induced by heterogeneous nucleation dispersed by the nano–micro PLF powder particles. 38
Also, no new diffraction peaks are observed which may be ascribed to crystalline filler phases or degradation by-products. Thus, this signals that fibre did not introduce unwanted crystalline inclusions or phase separations during filament extrusion and printing. This slight increase in crystalline ordering consistent with improved tensile strength and reduced surface roughness under the optimized print conditions. In similar studies, the addition of cellulose-based fillers into PLA improved crystallinity through the nucleation effect and improved mechanical behavior. 39
Thermogravimetric (TGA) analysis
TGA curves of neat PLA and the optimized pineapple-fiber-reinforced PLA composite are presented in Figure 13(a). A single-step major degradation process occurs for both materials, which is typical for PLA-based systems and confirms the thermal homogeneity of composites. It can be observed that the initial weight of both systems remains almost constant up to about 300°C, with high thermal stability and without any volatile residues or degradations due to moisture content. (a) TGA (b) DSC curves of the composites.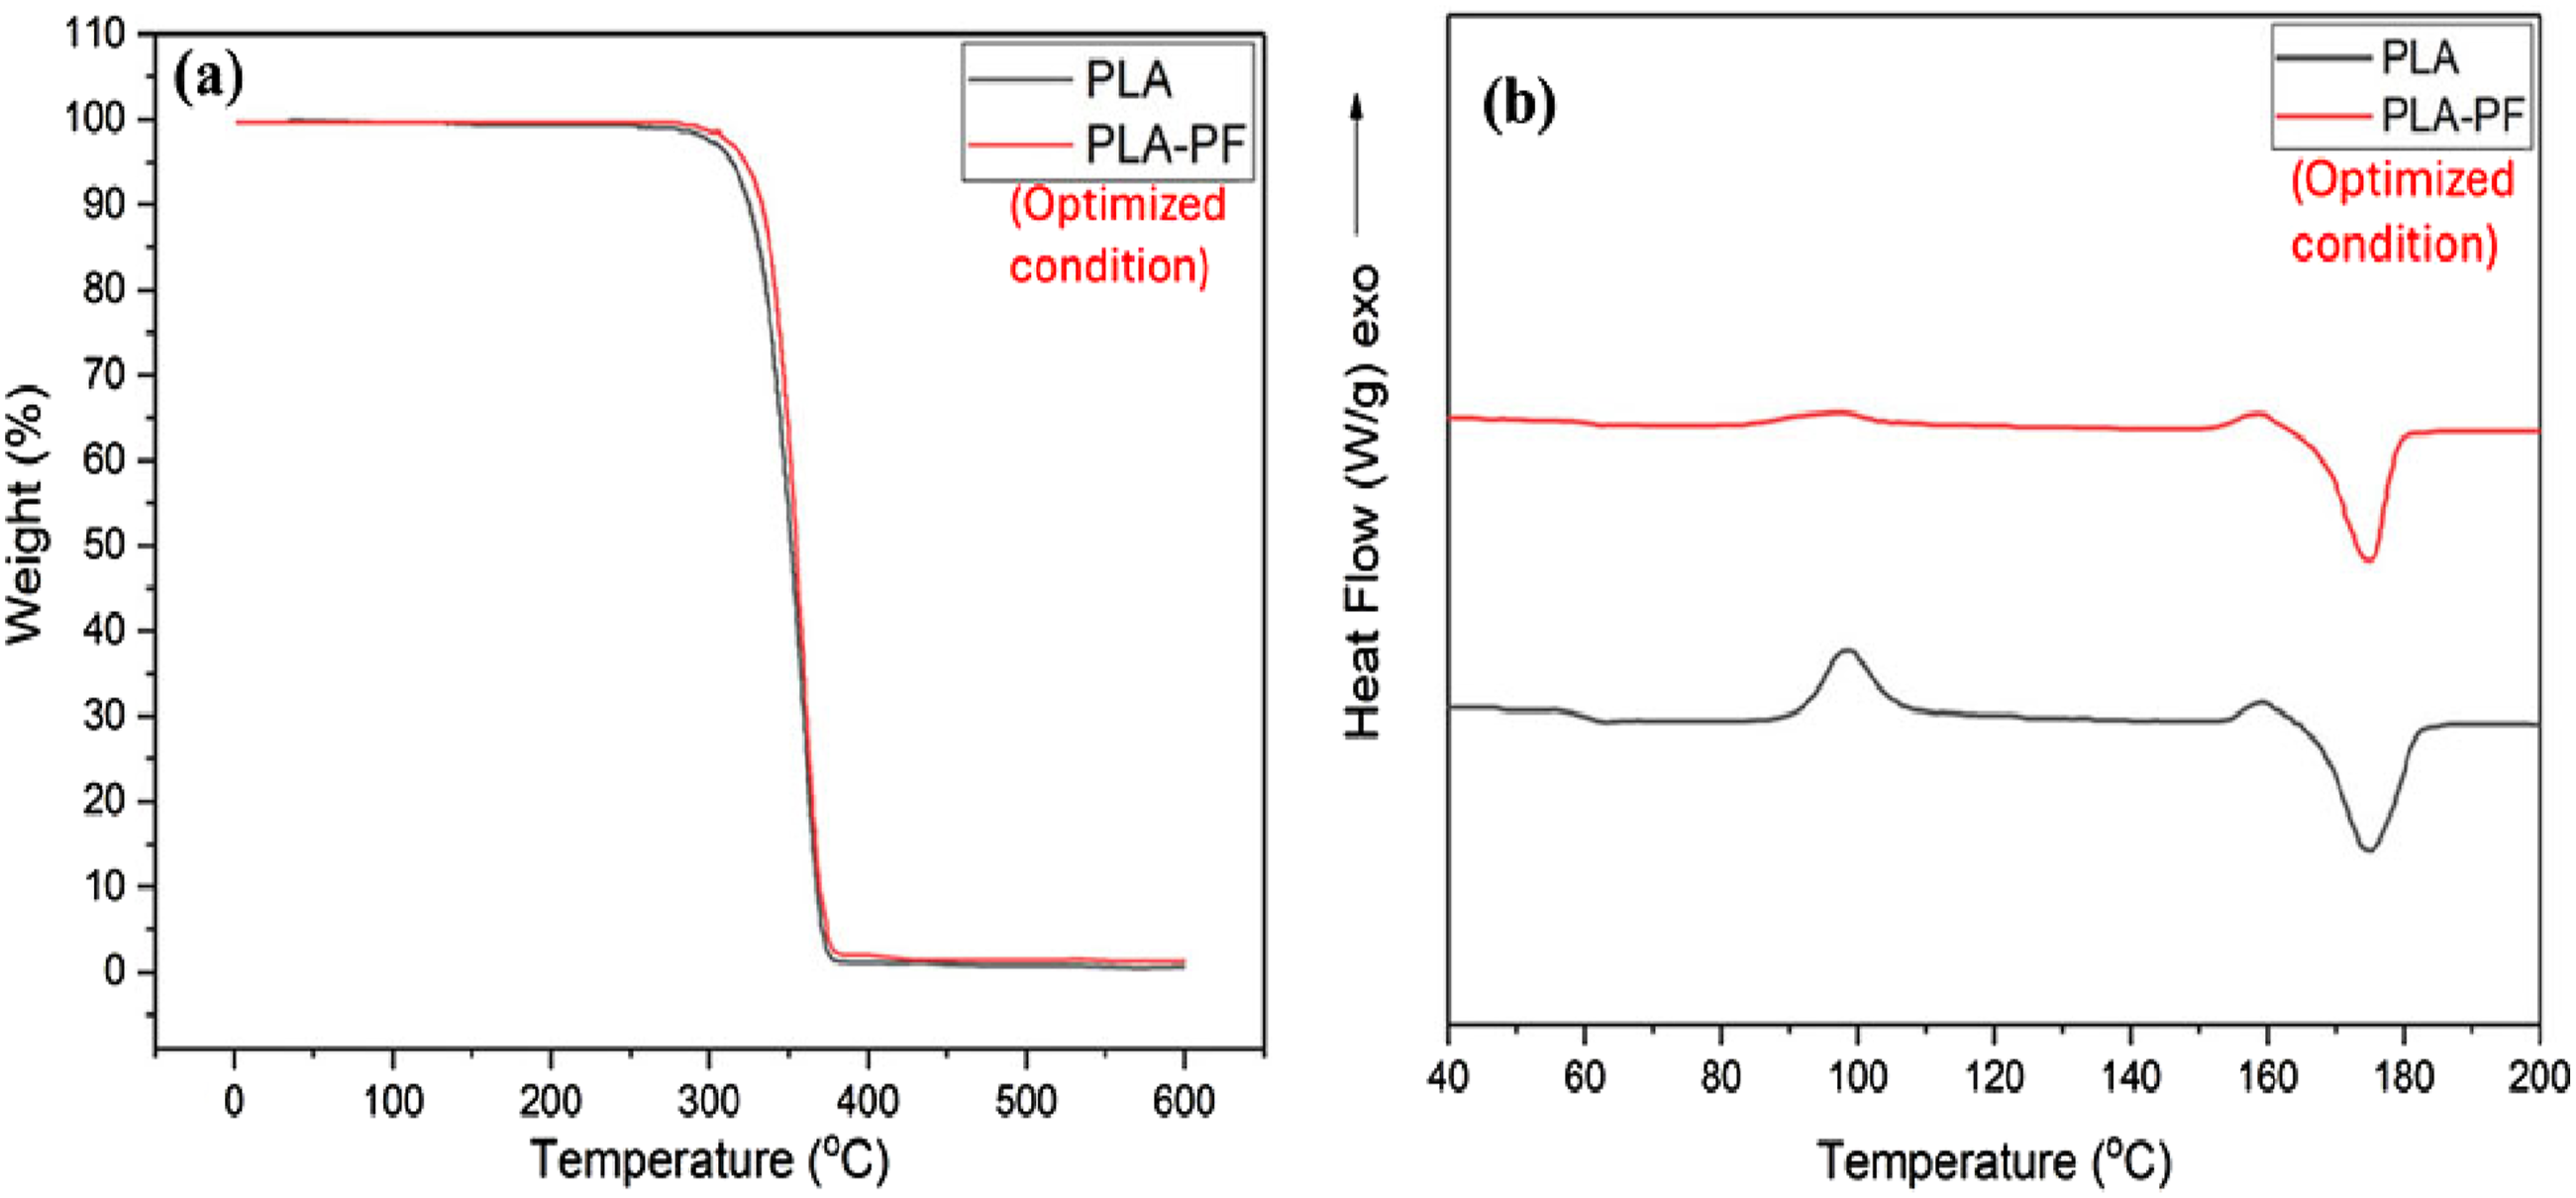
In the case of the PLA-PF composite, a slight shift of the main degradation onset temperature higher values is observed in comparison to neat PLA. This indicates that the presence of embedded natural fibers restricts polymer chain mobility and there is increased interfacial adhesion. The main decomposition falls in the temperature range of 320-390°C, which is attributed to the PLA backbone random scission and breakdown of the fiber’s cellulose and hemicellulose structures. The idea that the fiber functions as a barrier by postponing thermal diffusion and, consequently, the release of volatiles during pyrolysis is supported by the slight increase in thermal stability. 32 The relatively low residual (<2%) at 400°C indicates that the fiber and organic matrix components have largely volatilized and that no inorganic fillers or other contaminants are present. The composite’s degradation characteristics are in good agreement with those of natural fiber-reinforced PLA composites, which show slightly improved thermal resistance and unaltered degradation characteristics after fiber insertion.33,34 The steady residue and one-step weight loss profile further demonstrate that the printing conditions maintain the polymer fidelity during 3D printing and filament extrusion.
Differential scanning calorimetry (DSC) analysis
Figure 13(b) illustrates the DSC thermograms of neat PLA and the optimized pineapple-leaf-fibre-reinforced PLA composite. The PLA sample shows a glass transition at around ∼60–65°C, followed by a cold crystallization peak at around ∼90–110°C and a melting endotherm near ∼150 – 170°C, which are typical characteristics for semi-crystalline PLA materials.
Following reinforcement and 3D-printing under optimized parameters, the PLA–PF composite exhibits a number of important changes: (i) a shift of the cold-crystallization peak to higher temperatures and a decrease in its area, indicative of heterogeneous nucleation provided by pineapple fibres, which reduces the energy barrier for crystallization; (ii) a slight increase in the melting peak area along with narrowing of the endotherm suggests an enhanced crystalline order within the matrix; and (iii) the slight decrease in T9 may be related to restricted polymer chain mobility because of fibre embedding and consequent interfacial interactions. These are consistent with trends observed in natural fibre-reinforced PLA systems where fibre incorporation serves to expedite crystallization kinetics and raise the degree of crystallinity.35,36
These results are in good agreement with the mechanical improvements achieved through the RSM-based optimization, since enhanced crystallinity is often related to increased modulus, tensile strength, and thermal stability, in accordance with the morphological evidences of strong fibre-matrix bonding and porosity reduction. Finally, the well-preserved melting profile assured that the optimized filament/printing process did not degrade the PLA matrix significantly; hence, the composite retained structural and thermal properties as well. 40
Conclusion
In this study, the RSM incorporated with ANOVA, sensitivity analysis, and multi-response desirability approach was executed to optimize the 3D printing parameters of PLA-PF composites with statistical and practical reliability.41–44 i The regression models developed showed excellent predictive accuracy (R2 = 0.9823 for ultimate tensile strength (UTS) and R2 = 0.9689 for surface roughness (Ra)), reinforcing the strength of the optimization framework. ii SFC was found to be the most influential parameter in relation to tensile strength, owing to its reinforcement dispersion and load transfer role, while SPS was the most influential on surface roughness, mainly because it affects heat distribution and interlayer fusion. iii Consequently, the multi-response desirability function reached the maximum value of 0.973 for the overall desirability at an optimum parameter combination of 34.80 wt% SFC, 77.42 % SID, and 62.89 mm s−1 SPS that gave a tensile strength of 73.89 MPa with a surface roughness of 3.36 µm. iv Microstructural evaluation demonstrated homogeneous distribution of pineapple fibers in the PLA matrix and strong interfacial adhesion, which validated effective stress transfer and minimization of voids for the optimized parameter condition of the composites v The optimized condition FTIR spectroscopy evidenced hydrogen-bonding interactions between the hydroxyl groups of cellulose and the carbonyl groups of PLA, which suggested improved fiber–matrix compatibility. vi XRD analysis performed under optimal conditions provided peaks that were more intense and sharper, indicating improved crystallinity within the PLA matrix facilitated by fiber induced heterogeneous nucleation. vii TGA and DSC results indicated improved thermal stability, greater temperature for degradation onset, and favorable crystallization tendencies, all suggesting good thermal resiliency of the end hierarchical structure created for the optimal condition. viii This work establishes a future data-driven, experimental verification towards a high-performance and sustainable biocomposite based composite material. This proposed optimization framework can easily be extended to other natural fiber systems and can enable the design of lightweight, eco-efficient materials for automotive, aerospace, and consumer-product applications through additive manufacturing. ix The incompatibilities between PLA and PLF due to their polar/nonpolar properties are well established; however, it can also be demonstrated in this work that by optimising the parameters for 3D printing, the structural and mechanical characteristics of a PLA/PLF system can be improved upon significantly. The use of compatibilisers or treatments to modify the fibres’ surfaces may provide additional benefits. x Future studies will include predictive model integration using machine-learning based techniques as well as analysing both long-term thermal/mechanical performance and extending this approach to other naturally-derived fibre composites to further expand the use of environmentally-sensitive 3D-printed biocomposite materials into a wider number of potential applications. xi While this study provides a clear analogy to the industry, it does come with limitations that will limit the practical use of PF-PLA composites. While optimized PF-PLA composites had improved tensile properties and improved surface finish, limitations of printing PF-PLA composites were determined by the maximum amount of fibre loading permitted to be printed, along with other limitations such as an inability to print due to reduction of melt flow and clogging of the extruder/nozzle. Additionally, this study only examined the static tensile properties of PF-PLA composites, with no tests conducted on the long-term fatigue properties or durability of the material from thermal cycling or environmental ageing. Despite these limitations, PF-PLA composites developed in this study have strong commercial potential for use in lightweight and sustainable components for consumer products, automobile interior applications, packaging and rapid prototype development.
Footnotes
Declaration of conflicting interests
The authors declared no potential conflicts of interest with respect to the research, authorship, and/or publication of this article.
Funding
The authors received no financial support for the research, authorship, and/or publication of this article.