
Abstract
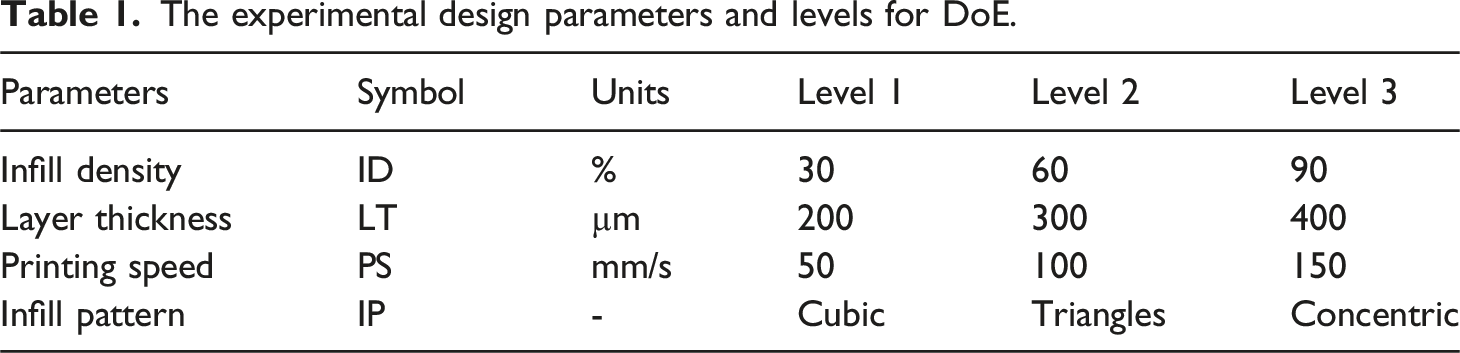
Additive manufacturing (AM), particularly fused deposition modeling (FDM), has emerged as a transformative technique for producing customized, lightweight, and environmentally sustainable components. However, identifying optimal process parameters that balance mechanical performance with environmental impact remains a critical challenge. In this study, a comprehensive experimental and data-driven approach is employed to investigate the influence of key FDM parameters—infill density (ID) (30%, 60%, 90%), layer thickness (LT) (200, 300, 400 µm), printing speed (PS) (50, 100, 150 mm/s), and infill pattern (IP) (Cubic, Triangles, Concentric)—on the mechanical and sustainability-related performance of acrylonitrile butadiene styrene (ABS), polylactic acid (PLA), and carbon fiber-reinforced polylactic acid (Cf/PLA) specimens. A Taguchi L9 orthogonal array was used to design the experiments, and the resulting samples were subjected to tensile testing, surface roughness measurement, energy consumption monitoring, and carbon emission (CO2) estimation. The maximum tensile strength was observed in Cf/PLA samples (up to 53.31 MPa), while PLA samples displayed a strong balance between surface quality (Ra ≈ 8.5–9.1 µm) and mechanical integrity. Energy consumption and carbon emission data revealed a direct correlation with ID and material type, with Cf/PLA exhibiting the highest environmental footprint. ANOVA revealed that ID was the most statistically significant factor influencing all target properties, contributing more than 60% to the total variance in experimental results across all material types. Scanning electron microscopy (SEM) analyses further illustrated microstructural differences and layer adhesion quality across different process settings. To enhance predictive capability and reduce experimental effort, three machine learning (ML) models—artificial neural networks (ANN), random forest regression (RFR), and gaussian process regression (GPR)—were developed to forecast mechanical and environmental outputs. The ANN yielded the highest accuracy across all metrics, with R2 > 0.995 and MAPE < 10.5%. Validation test results confirmed the generalizability of the models, showing that the average prediction error remained below 2% across all ML algorithms. These findings demonstrate the effectiveness of integrating Taguchi-based optimization and AI-driven prediction for achieving sustainable, high-performance FDM manufacturing, providing a robust framework for future design and process optimization in AM applications.
Keywords
Introduction
Additive manufacturing (AM) has revolutionized the way functional parts and prototypes are designed and fabricated across various industrial sectors. 1 Among the different AM techniques, 2 fused deposition modelling (FDM) has gained remarkable popularity due to its affordability, material versatility, design freedom, and ease of operation.3,4 FDM enables the layer-by-layer fabrication of thermoplastic-based components directly from digital CAD models, offering a rapid, cost-effective, and customizable solution for applications ranging from biomedical devices to aerospace structures.5,6 As industries pursue agile and flexible production systems, the relevance of FDM continues to grow, especially in the context of low-volume manufacturing, prototyping, and even end-use part production.7,8
In the context of FDM, the optimization and prediction of printing parameters are of paramount importance.9,10 These parameters—such as infill density (ID), layer thickness (LT), printing speed (PS), nozzle temperature (NT), platform temperature (PT), and infill pattern (IP)—directly influence the mechanical strength, dimensional accuracy, surface finish, energy consumption, and overall production efficiency.11,12 Properly tuning these parameters not only improves product quality but also enhances process stability, optimizes material usage, and increases energy efficiency. Optimizing FDM process parameters is essential in industrial settings, as it ensures consistent and high-performance component production while minimizing trial-and-error procedures, thereby shortening lead times and reducing manufacturing costs.
In addition to geometric and dimensional accuracy, the mechanical performance and environmental footprint of FDM-fabricated components play a crucial role in their broader industrial implementation.13,14 Mechanical properties such as tensile strength and surface roughness are critical in defining the structural integrity, functional durability, and service life of end-use products, especially in sectors like aerospace, automotive, biomedical, and consumer electronics.15,16 However, as global manufacturing trends shift toward climate-conscious and resource-efficient production, the environmental implications of 3D printing processes have drawn increasing attention. In this context, energy consumption and carbon dioxide (CO2) emissions associated with FDM have emerged as measurable indicators of a process’s ecological viability. The growing urgency to comply with international climate goals, such as the Paris Agreement and UN Sustainable Development Goals (SDGs), has made it essential to assess and minimize the carbon intensity of manufacturing workflows. 17 Reducing the environmental burden not only contributes to corporate sustainability strategies but also aligns with regulatory frameworks and enhances market competitiveness. Therefore, optimizing FDM printing parameters is not merely a matter of improving part quality, it is a critical enabler for sustainable manufacturing transformation.18,19 A well-optimized process can reduce material waste, shorten production time, lower energy usage, and ultimately decrease greenhouse gas emissions, all while delivering components with superior mechanical functionality. This dual focus on performance and sustainability is essential for industries aiming to adopt AM not just as a prototyping tool, but as a scalable, environmentally responsible production method fit for the era of green manufacturing and Industry 4.0. 20
In recent years, the integration of machine learning (ML) techniques and statistical methods such as the Taguchi design of experiments (DoE) has provided powerful tools for the optimization and prediction of FDM process outcomes.21–23 These data-driven approaches enable the modeling of complex, non-linear relationships between process parameters and performance metrics, facilitating real-time decision-making and intelligent process control.24,25 As artificial intelligence (AI) becomes an integral part of Industry 4.0, its application in AM enhances efficiency, repeatability, and sustainability, making it indispensable for next-generation manufacturing technologies.26,27
Although several studies have examined the impact of FDM parameters on mechanical or environmental performance, significant gaps remain in literature.28–32 Kam et al. investigated the effects of FDM process parameters on the mechanical properties (tensile strength, elongation, and impact strength) of 3D-printed PA12 (Polyamide 12) samples using the Taguchi. 33 An L8 orthogonal array was employed to study four parameters: LT, NT, IP, and ID. Tensile and impact tests were conducted according to ISO 527 and ISO 180 standards, respectively. The results were analyzed and compared. The study found that LT was the most influential factor in improving mechanical properties, compared to NT, IP, and density. The optimal parameters for tensile strength were identified as “0.25 mm” LT, “50%” infill, “rectilinear” pattern, and “250°C” NT. The same parameter set also resulted in the highest impact strength. Based on its mechanical performance, PA12 filament was deemed suitable for applications such as sleeve bearings and various machine parts due to its tensile strength, impact resistance, and damping characteristics. He et al. investigated the effects of FDM process parameters—NT, PT, LT, and PS—as well as annealing temperature on the mechanical and tribological properties of poly(ether ether ketone) (PEEK), using orthogonal experimental design. 34 The study identified NT and PS as the most significant factors influencing mechanical performance, with optimal values determined as 440°C and 40 mm/s, respectively. Mechanical strength improved by increasing annealing temperature, peaking at 300°C, where tensile, flexural, and compressive strengths increased by 36%, 54%, and 21%, respectively, though at the cost of reduced elongation at break. Tribological analysis revealed that PEEK annealed at 200°C exhibited the lowest wear rate (1.37 × 10⁻⁶ mm3/N·m) under parallel testing conditions. The study highlighted the combined effects of annealing and filament orientation and found that proper annealing promotes the formation of uniform and stable transfer films on steel counter faces, enhancing wear resistance. Hozdić et al. investigated the effects of mineral engine oil exposure on the mechanical properties of FDM 3D-printed polymer materials, focusing on four widely used materials: PLA, PLA + CF composites, PETG, and PETG + CF composites. 35 The study primarily examined tensile parameters under varying environmental conditions. Results showed that PLA experienced a ∼36% decrease in tensile strength, while its nominal strain at break increased significantly (60.92% after 7 days and 47.49% after 30 days), indicating improved ductility, with Young’s modulus remaining unaffected. PLA + CF composites exhibited a notable 49.93% increase in Young’s modules after 30 days of oil exposure. For PETG, tensile strength declined by approximately 17% over both 7 and 30 days, while ductility improved, and Young’s modulus increased by 55.08% and 66.27%, respectively. PETG + CF showed a slight improvement in mechanical parameters after 7 days, followed by a decline in tensile strength (11.75%) after 30 days. The findings emphasize the importance of material selection for oil-exposed environments and suggest further research into microstructural changes and long-term effects of oil interaction. Unlike these prior works, our study presents a comprehensive experimental and AI-assisted framework that not only evaluates mechanical and environmental outputs of multi-material FDM but also integrates Taguchi optimization and ML-based prediction. The novelty of this research lies in the combined analysis of tensile strength, surface quality, energy consumption, and carbon emissions, supported by validation-tested ML models across multiple material types, including ABS, PLA, and Cf/PLA. This multi-objective, multi-material approach fills a critical gap in the current literature and provides valuable insights for sustainable FDM manufacturing.
This study focuses on the comprehensive experimental investigation and multi-response statistical optimization of key FDM process parameters—namely ID, LT, PS, and IP—using a Taguchi L9 orthogonal array. The experimental framework is applied across three widely used and functionally diverse materials: ABS, PLA, and Cf/PLA. These materials were selected to represent a broad spectrum of mechanical behavior and environmental impact, providing insights into both commodity and high-performance polymer composites in AM. The study evaluates four critical output responses under controlled process conditions: tensile strength, surface roughness, energy consumption, and carbon emissions. These metrics not only determine the functional viability of the printed parts but also reflect the sustainability and efficiency of the manufacturing process. Through this multi-criteria approach, the research addresses both performance and ecological considerations in a unified optimization strategy. Three ML models—ANN, RFR, and GPR—are trained to develop predictive models for each response variable. The models are validated using unseen test data, and results indicate high predictive accuracy, with average prediction errors remaining below 2% across allalgorithms. A comprehensive methodology—combining design of experiments, statistical tools, and AI-driven modeling—is introduced in this study to enhance the optimization and prediction of FDM-fabricated component performance. The proposed framework has significant implications for real-time process control, material selection, and green manufacturing adoption, particularly for industries seeking to leverage AM technologies in the era of Industry 4.0 and environmental responsibility.
Materials and Methods
Materials
In this study, three different thermoplastic materials were used to investigate the effects of FDM parameters on mechanical and environmental performance: ABS, PLA, and Cf/PLA. These materials were selected due to their widespread use in AM and their distinct mechanical, thermal, and environmental characteristics. ABS is a petroleum-based thermoplastic known for its impact resistance, toughness, and moderate strength. It is commonly used in automotive, consumer electronics, and engineering applications due to its good dimensional stability and thermal resistance. 36 However, its production and printing processes typically involve higher energy consumption and carbon emissions compared to bio-based alternatives. PLA is a biodegradable, bio-based polymer derived from renewable resources such as corn starch. 37 It is one of the most widely used materials in desktop FDM 3D printing due to its ease of processing, low warping, and environmentally friendly nature. 38 Although PLA exhibits lower impact resistance compared to ABS, its low carbon footprint and favorable surface finish make it suitable for sustainable manufacturing practices. 39 Cf/PLA is a composite material that integrates short carbon fibers within the PLA matrix to enhance its mechanical performance, particularly tensile strength and stiffness. 40 This reinforcement results in improved load-bearing capacity and dimensional accuracy, making Cf/PLA suitable for structural and functional applications where higher strength-to-weight ratios are required. However, the addition of carbon fibers may increase the environmental impact due to higher material density and energy demands during processing.
3D Printing Process
In this study, all tensile test specimens were manufactured using the FDM method, which is one of the most widely adopted AM techniques for thermoplastic materials.41,42 FDM creates parts by extruding melted filament layer by layer following a predefined toolpath, offering simplicity, cost-effectiveness, and suitability for both prototyping and functional applications. The Zaxe Z1 Plus desktop 3D printer was employed to fabricate the samples (Figure 1(a)). This printer features a direct-drive extruder, a heated build plate, and supports a wide range of standard thermoplastic filaments. The nozzle diameter was set to 0.4 mm, and the build platform dimensions were 220 × 220 × 250 mm, providing sufficient workspace for batch production. Tensile specimens were designed in accordance with the ASTM D638 Type IV standard, which is commonly used to evaluate the tensile behavior of plastics. The CAD model of the specimen was created using SolidWorks 2024 and exported in STL format for slicing. The slicing process was conducted using xDesktop software, where key parameters such as LT, PS, ID, and IP were adjusted according to the experimental design matrix. The technical drawing and dimensions of the tensile specimen are presented in Figure 1(c). The overall FDM printing process, including the printing direction, layer-by-layer deposition, and build orientation of the specimens, is schematically illustrated in Figure 1(b).
43
All samples were printed in a flat orientation (XY plane) to ensure consistent layer adhesion and minimize warping. Technical drawing of tensile and compressive specimen and FDM printing process.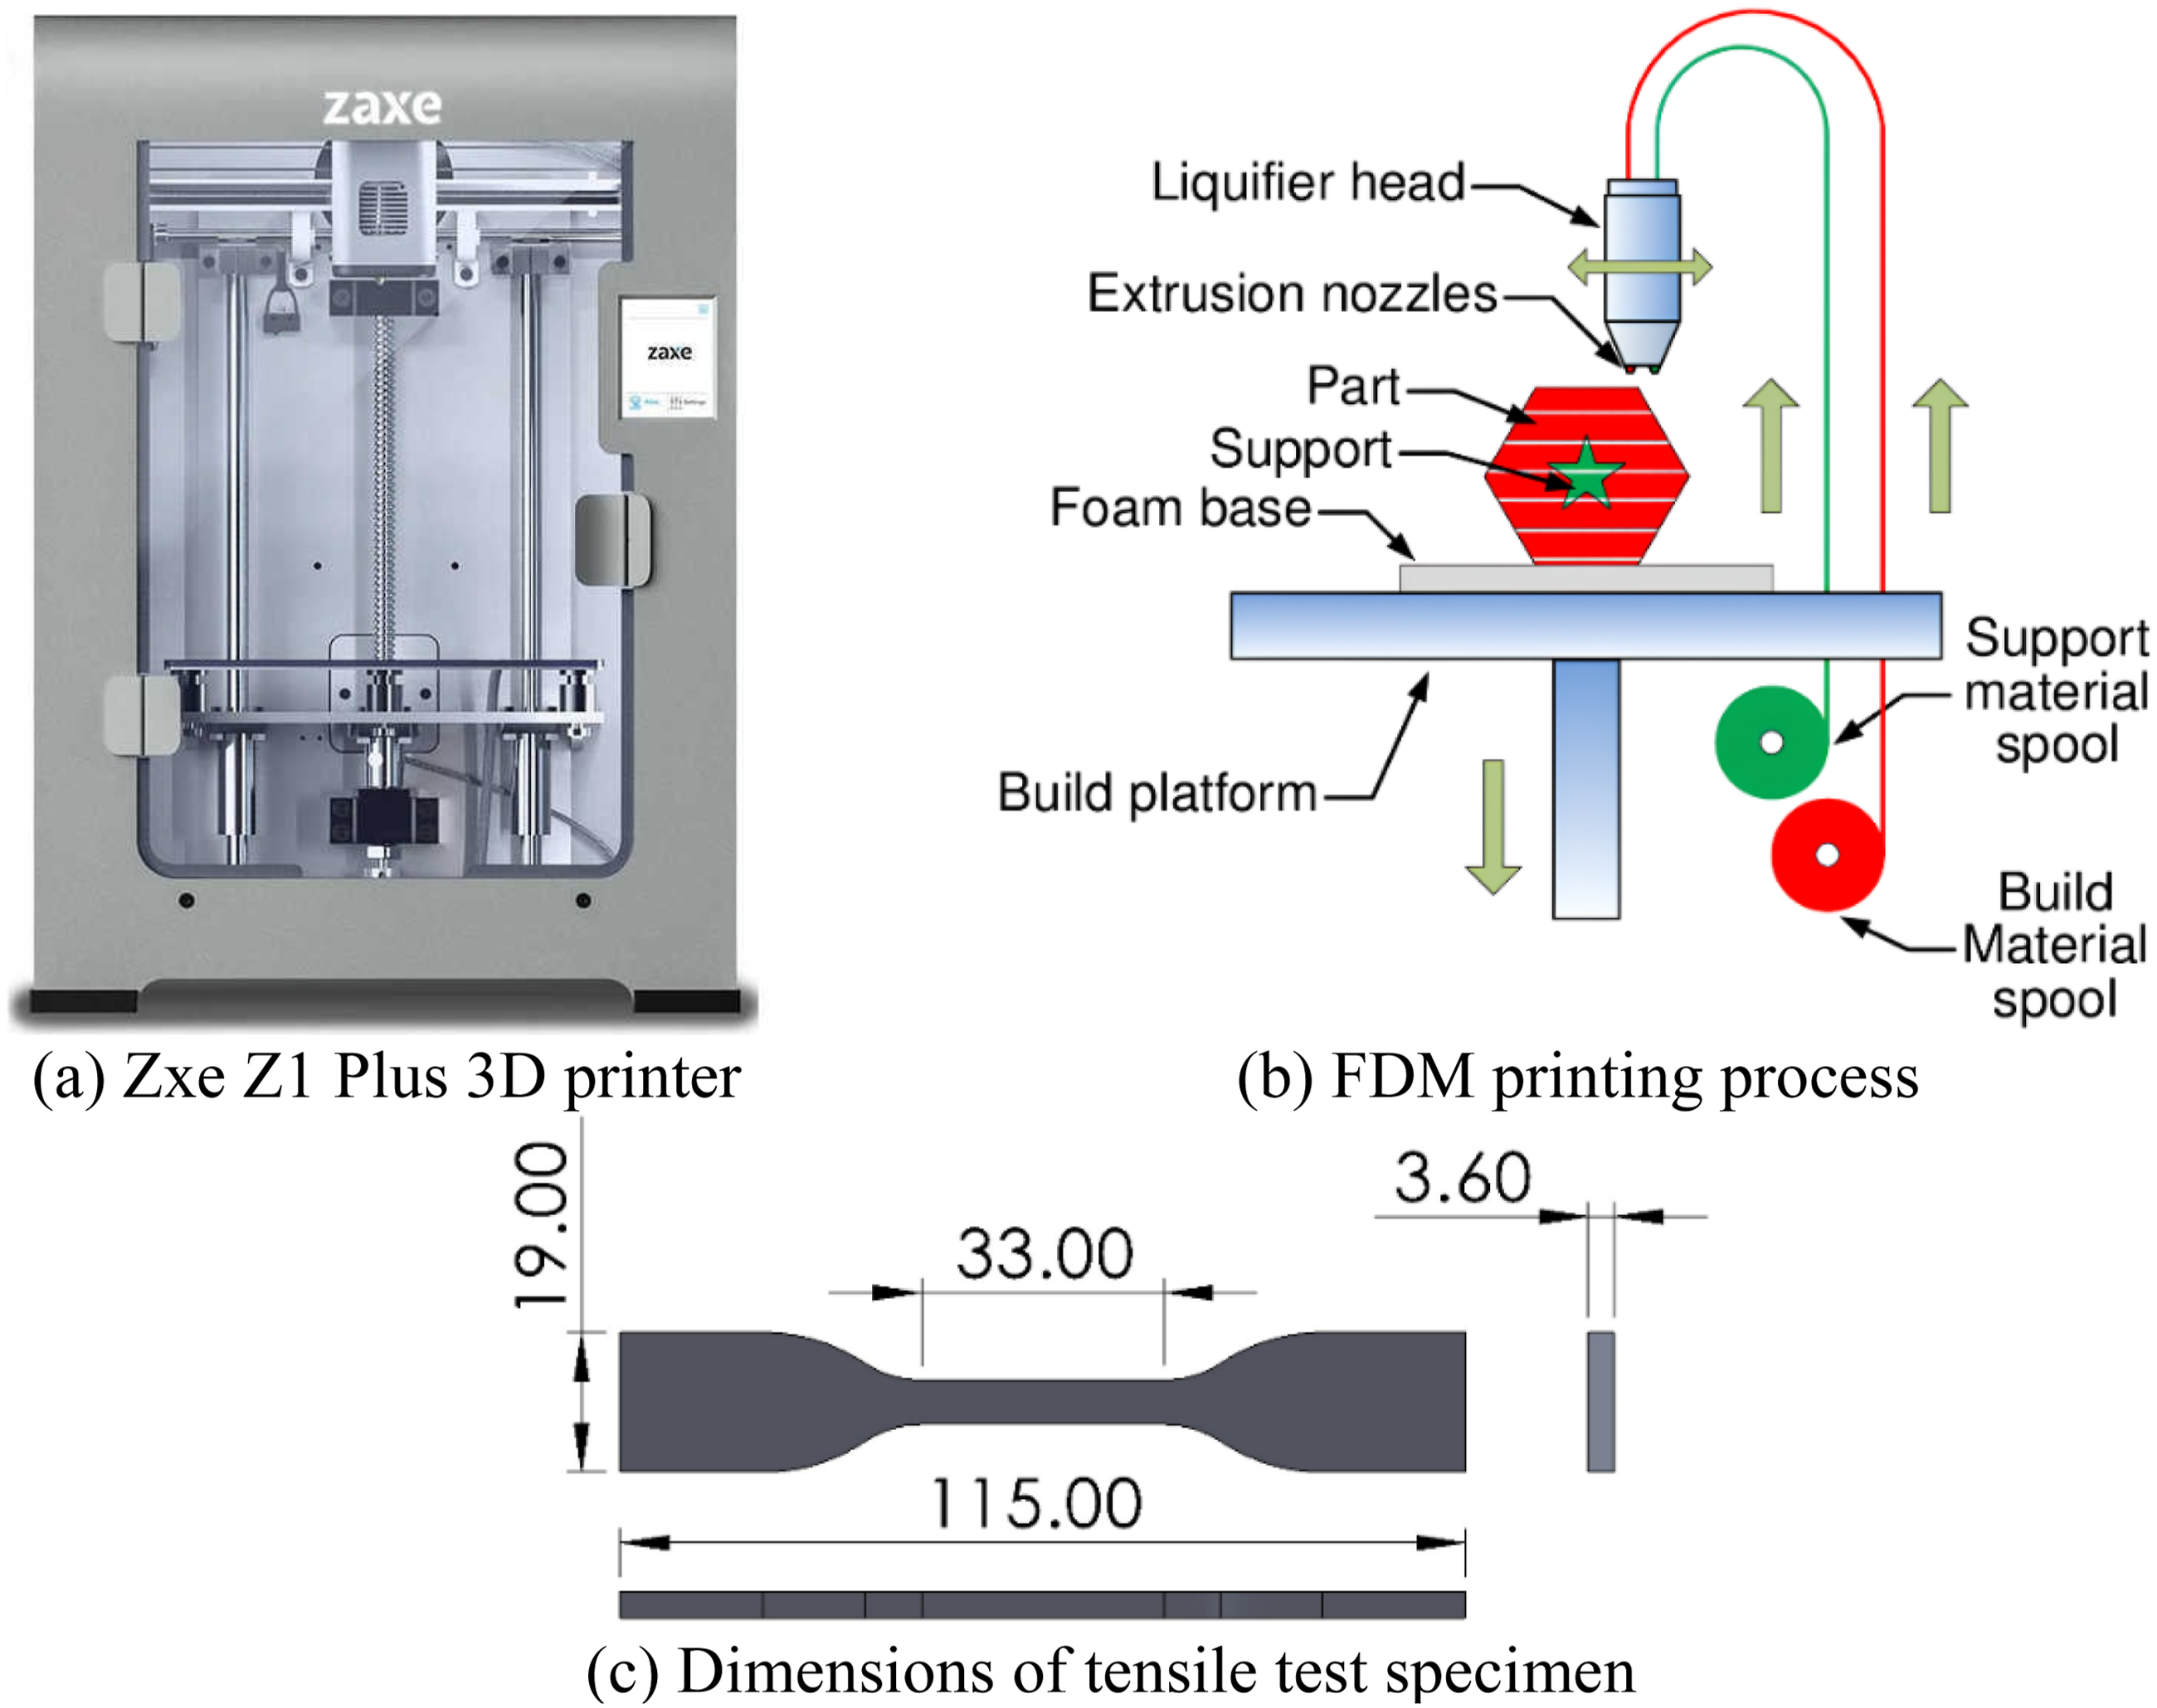
Although Figure 2 presents only 9 representative tensile test specimens—each corresponding to one of the Taguchi L9 experimental combinations, a total of 27 tensile specimens per material group were fabricated to ensure the statistical robustness of the test results, as defined by the experimental design matrix (Table 2). For each parameter combination, three identical samples were produced, allowing the calculation of average values and standard deviations for all measured outputs, including tensile strength, surface roughness, energy consumption, and carbon emissions. During the fabrication process, all non-variable printing parameters not included in the Taguchi design (Table 1)—such as nozzle temperature, build plate temperature, cooling fan speed, and extrusion multiplier—were kept constant across all material groups to eliminate confounding effects and ensure a fair comparison between samples. This approach provided a controlled environment in which the isolated influence of the four selected parameters could be accurately assessed. The fabricated specimens are visually presented in Figure 2, where each material is distinctly color-coded for clarity: yellow for ABS, black for Cf/PLA, and red for PLA. These samples represent a wide range of mechanical and environmental behavior, enabling a comprehensive evaluation of how different materials respond under varying FDM processing conditions. The visual variations in surface texture and dimensional consistency among the samples also reflect the influence of the adjusted parameters on part quality. This rigorous and repeatable fabrication strategy not only strengthens the reliability of the results but also supports the development of accurate ML models by providing consistent and high-quality training data across all material groups. The fabricated ABS (yellow), Cf/PLA (black), and PLA (red) test samples. The experimental design parameters and levels for DoE.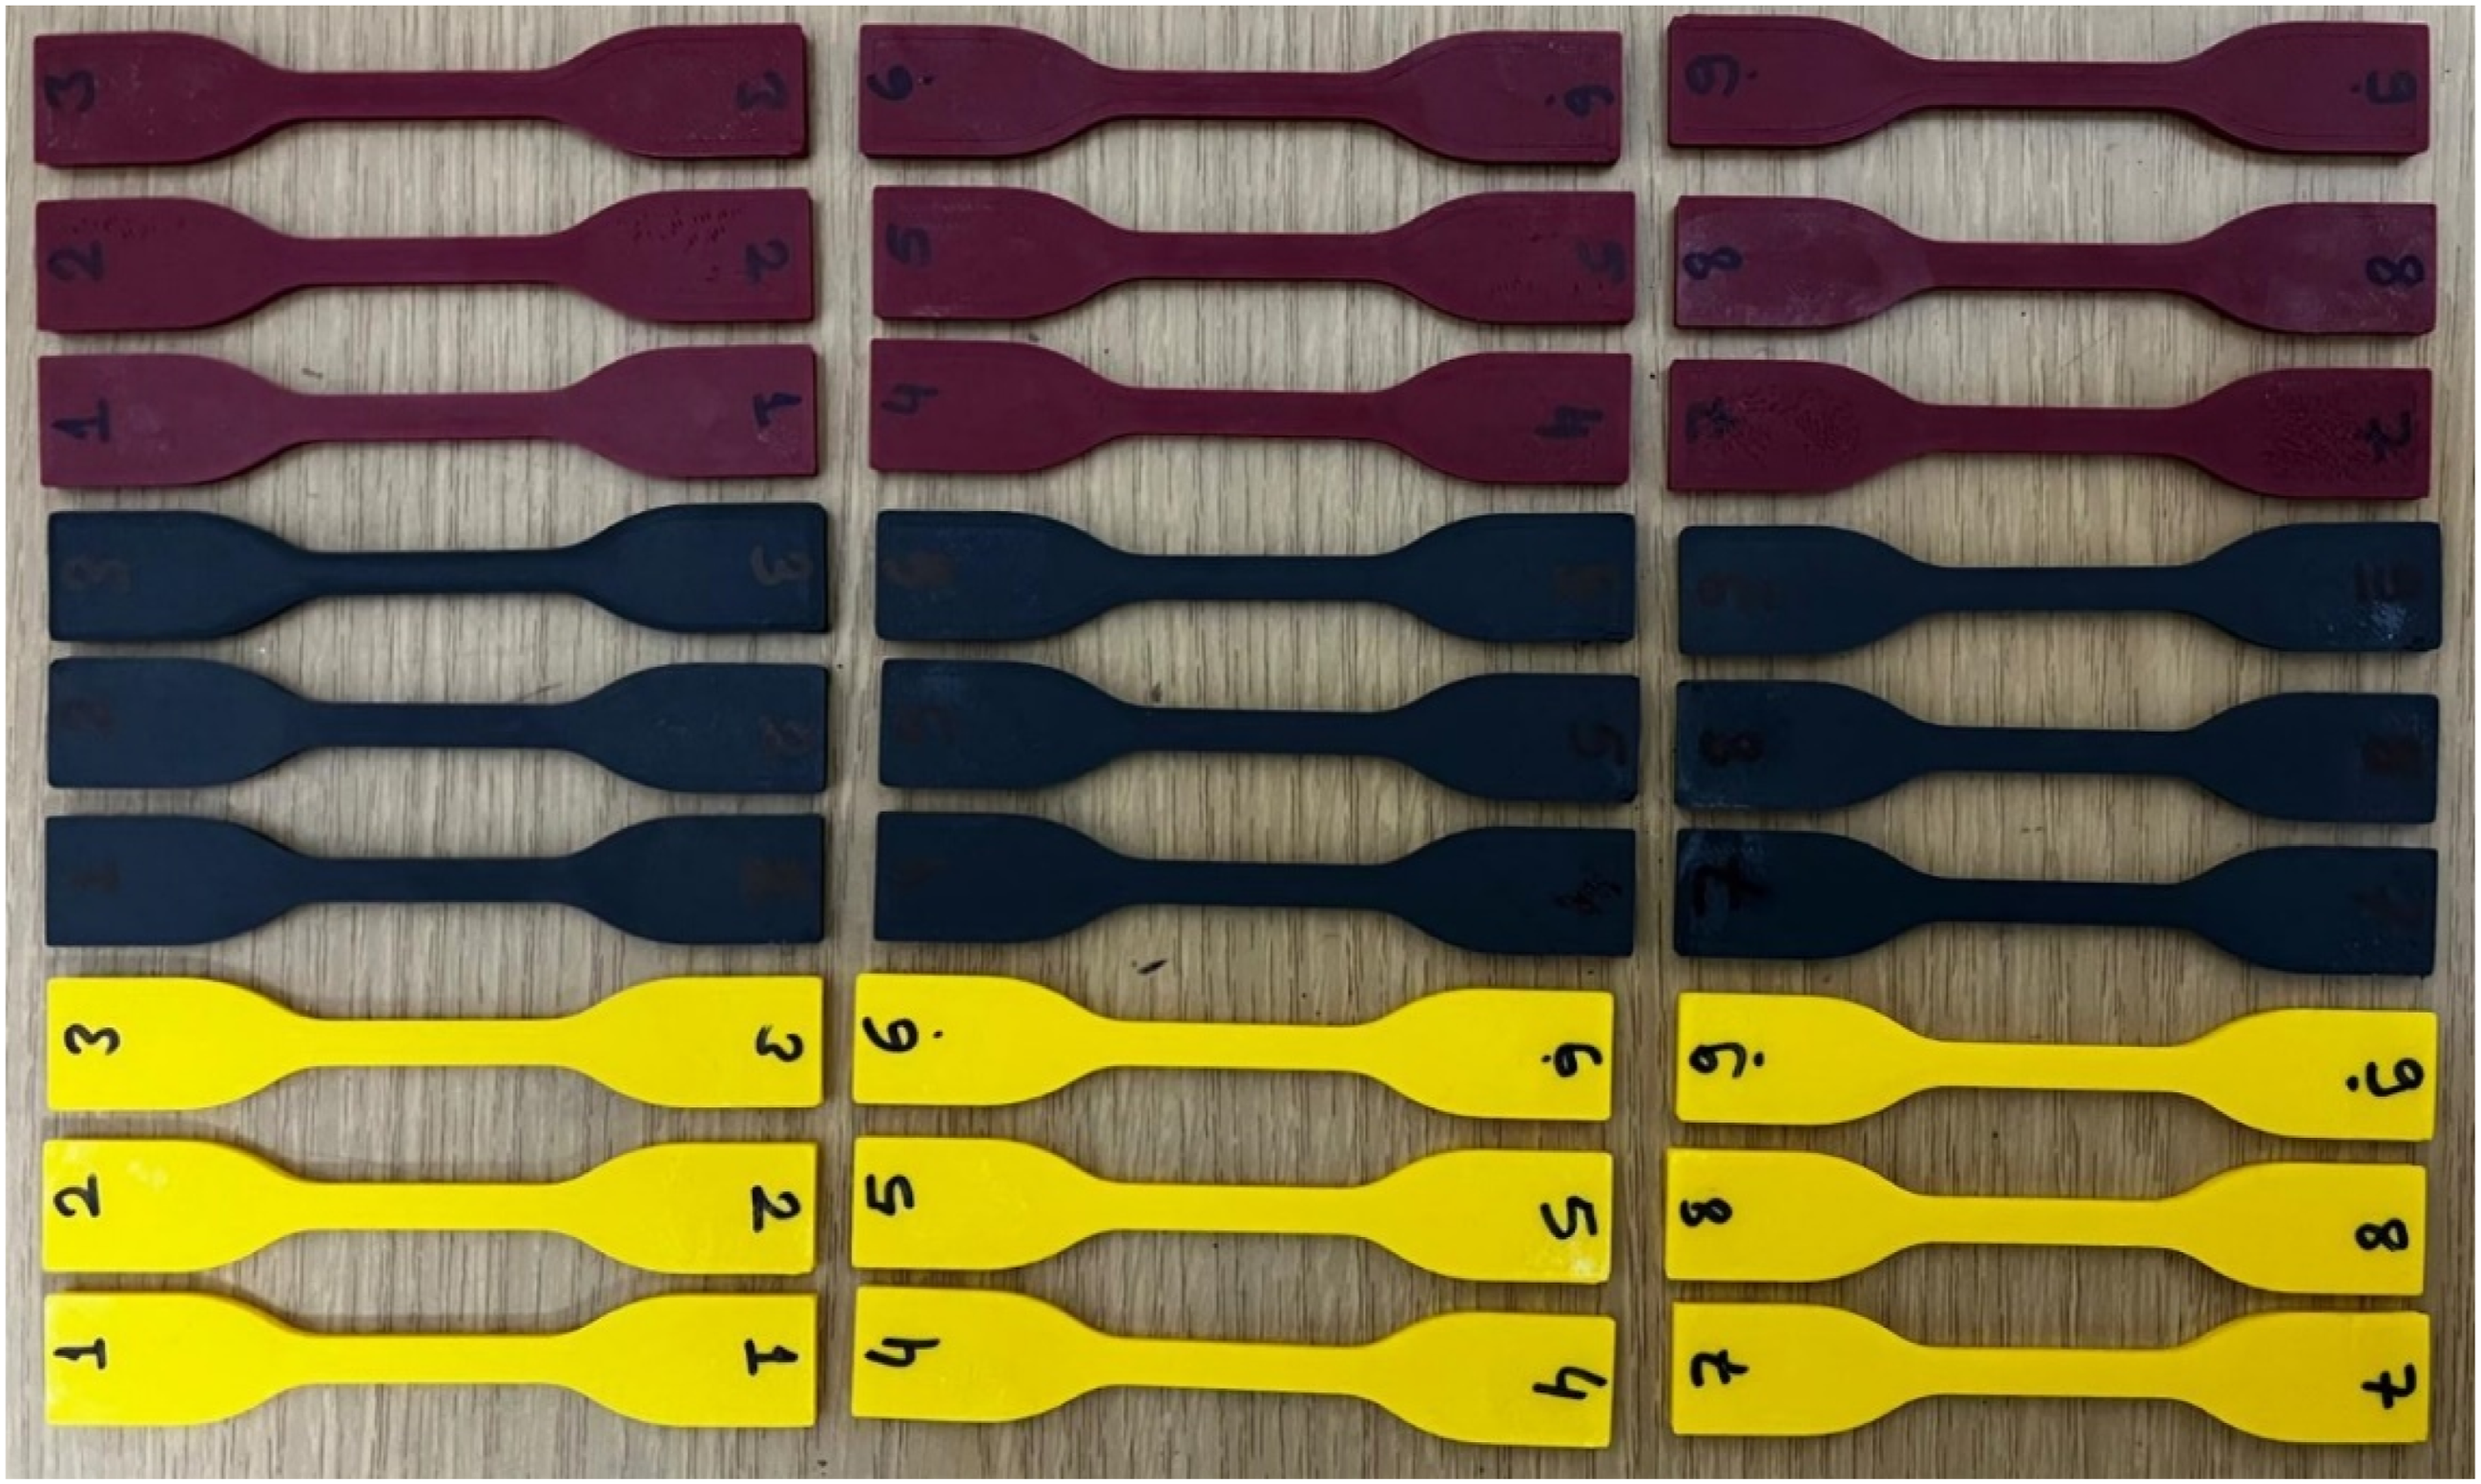
Design of Experiment
A systematic investigation was conducted into the effects of key FDM process parameters on the mechanical and environmental performance of 3D printed components using the Taguchi DoE method. The Taguchi approach is a robust statistical technique that simplifies the experimental process by using orthogonal arrays to reduce the number of required trials, while still capturing the influence of multiple factors and their interactions. 44 This method enhances efficiency, repeatability, and statistical reliability, making it particularly valuable in engineering design and process optimization studies where multi-parameter control is essential. In this study, four primary FDM parameters were selected based on their well-documented impact on both part quality and sustainability outcomes: ID, LT, PS, and IP.45,46 Each of these parameters plays a unique role in the FDM process. ID (%) affects the internal structure of the printed part, directly influencing tensile strength, weight, material consumption, and energy usage. While lower infill densities reduce print time and material usage, they may compromise the mechanical integrity of the component. LT (µm) determines the vertical resolution and inter-layer bonding quality. Thinner layers typically lead to smoother surfaces and higher dimensional accuracy but also result in longer print durations and increased energy consumption. PS (mm/s) governs the heat input, extrusion stability, and surface finish. Although higher speeds can improve productivity, they may negatively affect mechanical properties and geometric precision. Lastly, the IP defines the internal geometry and load distribution within the part. More complex patterns such as Triangles or Concentric structures can enhance stress distribution and structural strength, whereas simpler patterns like Cubic offer faster fabrication with reduced computational complexity. These four parameters, along with their three level variations, were used to construct the experimental design presented in Table 1, forming the basis of the Taguchi L9 orthogonal array applied in this study.
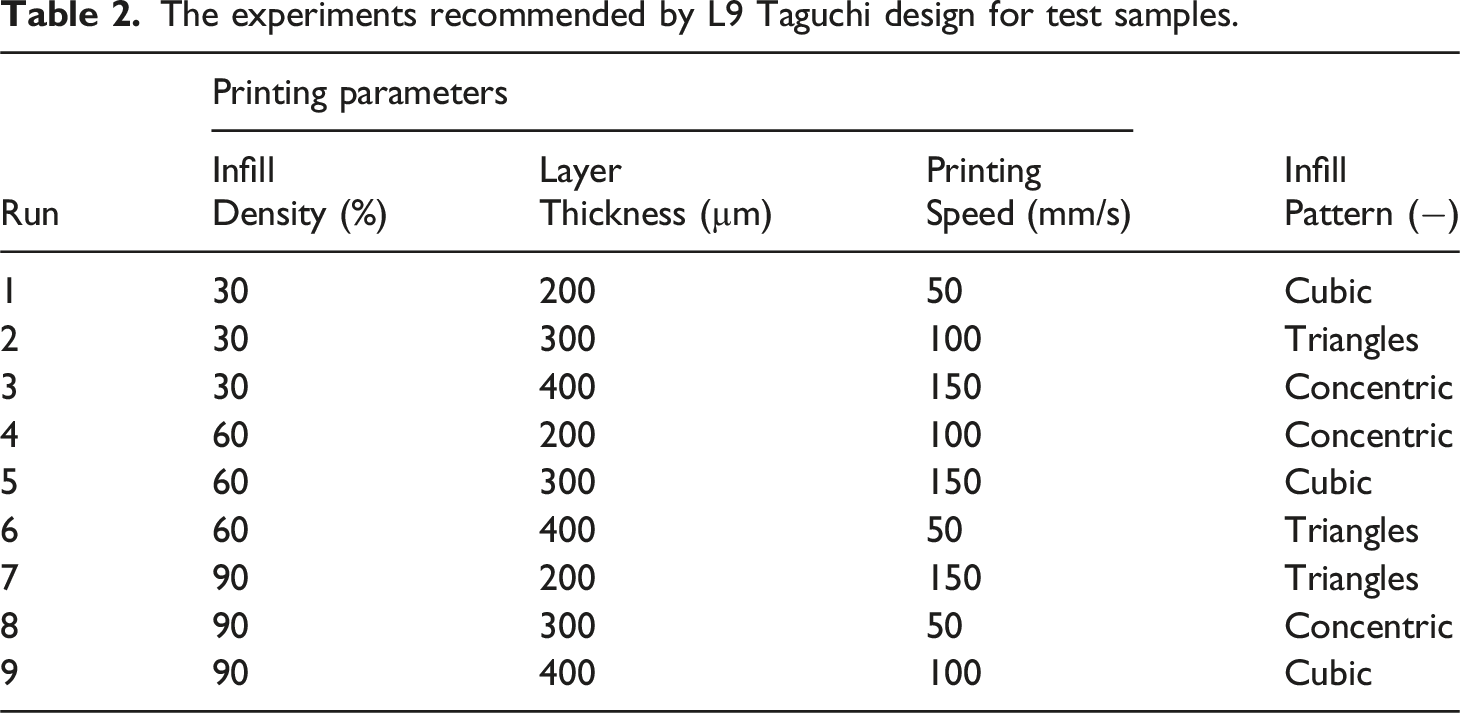
The experiments recommended by L9 Taguchi design for test samples.
Tensile Stress Testing
Tensile tests were conducted to evaluate the mechanical performance of the 3D-printed specimens, particularly focusing on tensile strength, which is a critical factor for functional and structural applications. All tests were performed using a Shimadzu AGS-X universal testing machine with a maximum load capacity of 10 kN, located in the mechanical testing laboratory. The testing system is equipped with a ±0.5% load cell accuracy, ensuring high-precision force measurements across various material strengths. The device is controlled via TRAPEZIUM X software, which allows precise adjustment of test parameters and real-time data acquisition at rates of up to 1000 Hz. Standard flat mechanical grips were used to secure the specimens, and the maximum crosshead travel distance was limited to 1000 mm, sufficient for all test specimens designed according to standardized dimensions. All samples were prepared and tested in accordance with the ASTM D638 Type IV standard, which is widely used for determining the tensile properties of polymeric materials. The tests were carried out under ambient laboratory conditions (23 ± 2°C) at a constant crosshead speed of 1 mm/min. For each of the nine experimental configurations per material group (as defined by the Taguchi L9 design), three replicate specimens were tested, resulting in a total of 27 tensile tests per material. The average values of maximum tensile strength were recorded and used for subsequent optimization and prediction analysis.
Surface Roughness Testing
Surface quality is a critical performance metric in FDM, as it directly influences the aesthetic appearance, functional fit, wear resistance, and aerodynamic behavior of printed parts. In this study, surface roughness (Ra) was measured as a quantitative indicator of surface finish for all tensile test specimens. The measurements were carried out using a Mitutoyo SJ-410 surface roughness tester, a high-precision, portable profilometer widely used in polymer and metal surface characterization. The device is equipped with a 0.75 mN measuring force, 4 µm stylus tip radius, and a cut-off length of 0.8 mm, conforming to ISO 4287 standards for Ra measurements. The system provides digital output and graphical representation of the surface profile, enabling consistent and repeatable evaluations across different material groups and parameter combinations. Prior to testing, each specimen was cleaned to remove dust or filament residue. Surface roughness was measured on the side walls (perpendicular to the build plate) of the specimens, where the layer-stacking effect of the FDM process is most pronounced. For each specimen, three measurements were taken along different vertical regions of the side surface, and the average Ra value was recorded for analysis. Measurements were performed under controlled laboratory conditions, and the same measurement settings were applied for all material groups to ensure comparability.
Carbon Emissions Measurement
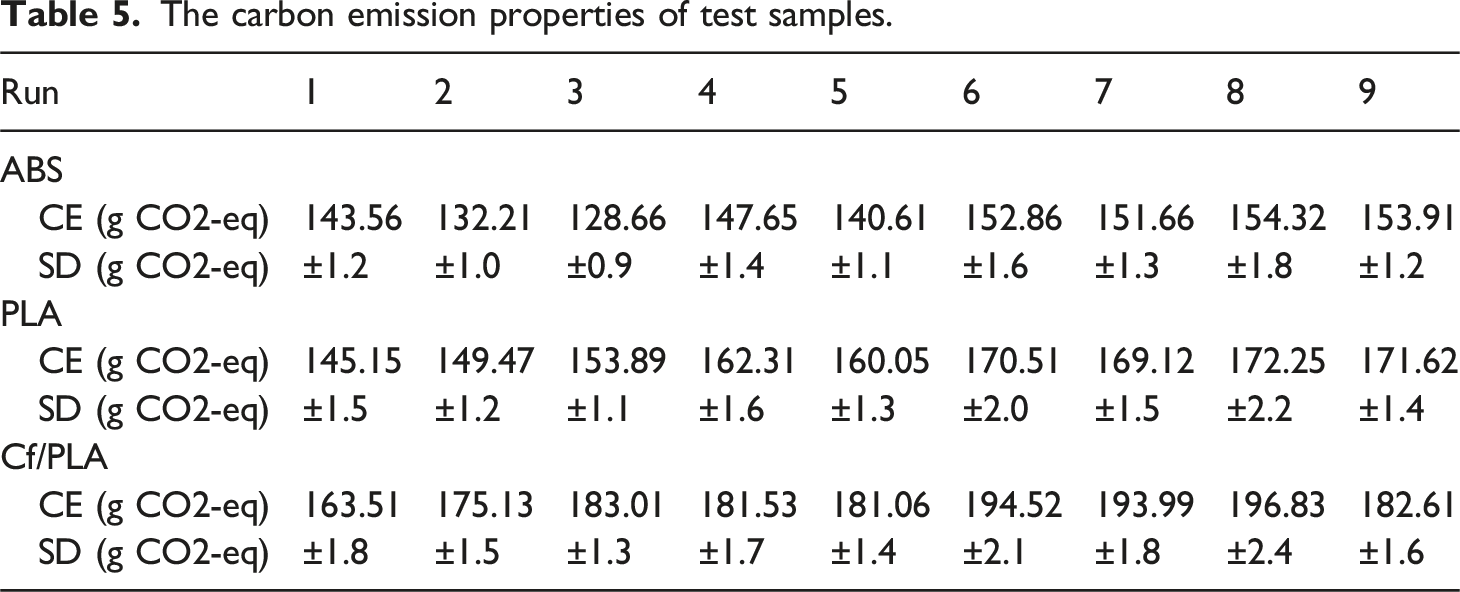
In this study, the environmental impact of the FDM process was evaluated by estimating the amount of carbon dioxide equivalent (CO2-eq) emissions generated during the production of 3D-printed specimens. The calculation was carried out using a simplified life cycle assessment (LCA) approach, based on the general principles defined in ISO 14,040. The analysis considered both the quantity of material used and the energy consumed during the AM process. To perform the emission calculations, the commercial LCA software ECO-it was used. This tool provides a built-in materials and processes database that includes average CO2 emission values and environmental impact indicators based on eco-indicator points. The software allows for practical estimation of environmental impacts by entering material types, quantities, and production-related energy consumption. Three different filament types were evaluated in this study: ABS, PLA, and carbon fiber-reinforced PLA. For each material, nine distinct experimental configurations were tested, resulting in a total of 27 different samples. The experiments were designed according to the Taguchi L9 orthogonal array, as detailed in Table 2. Parameters such as ID, LT, PS, and IP were varied systematically across the trials. The CO2 emissions for each sample were calculated by inputting the amount of filament used (measured in grams) and the amount of energy consumed during printing (in kilowatt-hours) into the ECO-it software. Material-specific emission factors provided by the software were applied: 4100 g CO2-eq/kg for ABS, 3300 g CO2-eq/kg for PLA, and 6000 g CO2-eq/kg for carbon-based filaments. Additionally, the energy-related emissions were estimated using a regional electricity emission factor of 430 g CO2-eq/kWh, reflecting the average carbon intensity of electricity production in Turkey. The total CO2 emission values obtained for all 27 samples are presented in Table 5. These results allowed for a comparative assessment of the environmental impact associated with different materials and printing parameters. It was observed that samples produced with carbon-based filaments exhibited higher emission values due to both the greater emission factor of the material and the relatively higher energy consumption in certain cases.
Energy Consumption Measurement
The energy consumption of the FDM process was directly measured during the fabrication of each ASTM D638 Type IV tensile test specimen. The purpose of this analysis is to quantitatively evaluate the energy requirements associated with different combinations of 3D printing parameters and to provide a reliable dataset for environmental and predictive modeling. For data collection, a single-phase digital energy meter was integrated into the power line supplying the Zaxe Z1 Plus 3D printer. This meter can measure real-time energy usage in kWh, and it records values at 1-s intervals throughout the entire printing process. The setup allowed for precise monitoring of dynamic power consumption during heating, extrusion, movement, and cooling phases. Before each print, a 5-min warm-up period was observed to stabilize the printer and ensure consistent starting conditions. The energy consumed during this idle phase was not included in the final measurement and was excluded from the dataset. Only the active energy consumption from the start of printing to the completion of the part was recorded for each sample. Each test specimen was produced according to one of the nine experimental configurations defined by the Taguchi L9 orthogonal array (Table 2), and the tests were repeated three times per configuration to ensure statistical consistency. The average energy consumption for each configuration was then calculated and used in subsequent analyses. All measurements were performed under constant environmental conditions (room temperature: 23 ± 2°C) to minimize the influence of external variables on energy consumption. Additionally, no post-processing was included in the energy measurement, as the focus was solely on the printing phase. This method provided a detailed and repeatable approach to evaluating how variations in printing parameters affect the overall energy demand. These values were later used to estimate carbon emissions and to develop predictive models for energy-efficient AM.
Machine Learning Algorithms
In this study, three supervised ML algorithms—ANN, RFR, and GPR—were employed to develop predictive models for estimating the tensile strength, surface roughness, energy consumption, and carbon dioxide equivalent (CO2-eq) emissions of polymer-based FDM parts. These algorithms were selected based on their proven effectiveness in handling small-to-medium-sized datasets and their ability to capture linear and non-linear relationships between the FDM process parameters and performance metrics. All models were implemented and trained using the MATLAB environment, specifically utilizing the Regression Learner App and custom scripting in combination with the Deep Learning Toolbox for ANN. The input dataset consisted of 81 samples, covering nine experimental configurations for each of the three materials, as defined by the Taguchi L9 design. The input variables used for training included ID (%), LT (μm), PS (mm/s), and IP (numerically encoded). For each configuration, the corresponding tensile strength (MPa), surface roughness (µm), energy consumption (kWh), and carbon emission (g CO2-eq) were used as target output variables. Before training, all data were normalized using min–max scaling to ensure uniform feature ranges and improve learning efficiency. The dataset was randomly split into 80% training and 20% testing subsets. The ANN was configured as a feedforward neural network with one hidden layer, and the number of neurons was optimized through trial and error to minimize prediction error. The network was trained using the Levenberg–Marquardt backpropagation algorithm, which is well-suited for small datasets and provides fast convergence. The RFR model was developed using an ensemble of decision trees, where each tree was trained on a bootstrap sample of the training data, and predictions were averaged to enhance robustness and accuracy. The number of trees (n_estimators) and maximum tree depth were optimized within MATLAB to reduce overfitting and improve generalization. GPR, on the other hand, was implemented with a squared exponential kernel function, and its hyperparameters, such as the signal standard deviation and length scale, were tuned using Bayesian optimization. Model performance was evaluated using six statistical indicators: mean squared error (MSE), mean absolute error (MAE), root mean squared error (RMSE), coefficient of determination (R2), mean absolute percentage error (MAPE), and Pearson correlation coefficient (r). These metrics provided a comprehensive assessment of prediction accuracy and model reliability. Separate regression models were trained and validated for each output variable. The trained models revealed that all three algorithms are capable of accurately predicting the outputs based on process parameters, with varying degrees of precision. The results confirm that ML can serve as a powerful tool in optimizing FDM processes for both mechanical performance and environmental sustainability.
Results and Discussion
Evaluation of Experimental Results
In this section, the tensile behavior of the 3D-printed specimens fabricated from ABS, PLA, and Cf/PLA is evaluated based on the stress–strain curves obtained from tensile testing, as presented in Figure 3. The curves reflect the mechanical response of each material under applied uniaxial tension and provide insight into the influence of FDM process parameters defined by the Taguchi L9 experimental design. The ABS samples demonstrated moderate tensile strength, with ultimate tensile strength (UTS) values ranging from 19.01 MPa to 31.20 MPa. The highest strength was observed in Run 8, which featured a high ID and “concentric” IP, suggesting improved interlayer adhesion and internal structure. In contrast, the lowest strength was recorded in Run 1, where low ID and minimal internal support contributed to early failure. The fracture strain of ABS specimens generally remained within the 2.5–3.5% range, indicating relatively brittle behavior compared to PLA and Cf/PLA. Although ABS is known for its toughness, the observed results suggest that its performance is highly dependent on infill design and density. PLA specimens, on the other hand, exhibited a better balance between strength and ductility. The UTS values varied between 24.48 MPa and 36.38 MPa, with the highest strength observed in Run 8, like ABS. PLA samples also showed significantly higher elongation at break—up to 7–8%, which is indicative of enhanced ductility and layer bonding. Samples with higher ID and structured patterns such as concentric and triangles consistently yielded better mechanical performance, whereas lower density cubic patterns led to reduced strength and premature failure. The Cf/PLA composites outperformed both ABS and PLA in terms of tensile strength, with UTS values ranging from 32.97 MPa to 53.31 MPa. The highest strength was achieved in Runs 6 and 8, both exceeding 53 MPa, underlining the reinforcing effect of carbon fibers within the PLA matrix. These samples also displayed relatively lower strain at break compared to pure PLA, reflecting a trade-off between enhanced stiffness and reduced ductility. The improved mechanical strength in Cf/PLA samples is attributed to the strengthening and stiffening effect of carbon fiber fillers, which promote better load transfer and interlayer stabilization. The tensile test results reveal that both material type and printing parameters, particularly ID and IP, play a crucial role in determining the mechanical response of FDM-printed parts. Cf/PLA exhibited the highest tensile strength, suitable for structural applications, while PLA offered a good compromise between strength and deformability. Although ABS is relatively brittle, it can still deliver satisfactory performance when processed under optimized conditions. These findings form a critical foundation for the optimization and predictive modeling efforts detailed in the following sections. Stress-Strain diagrams obtained by tensile test of samples.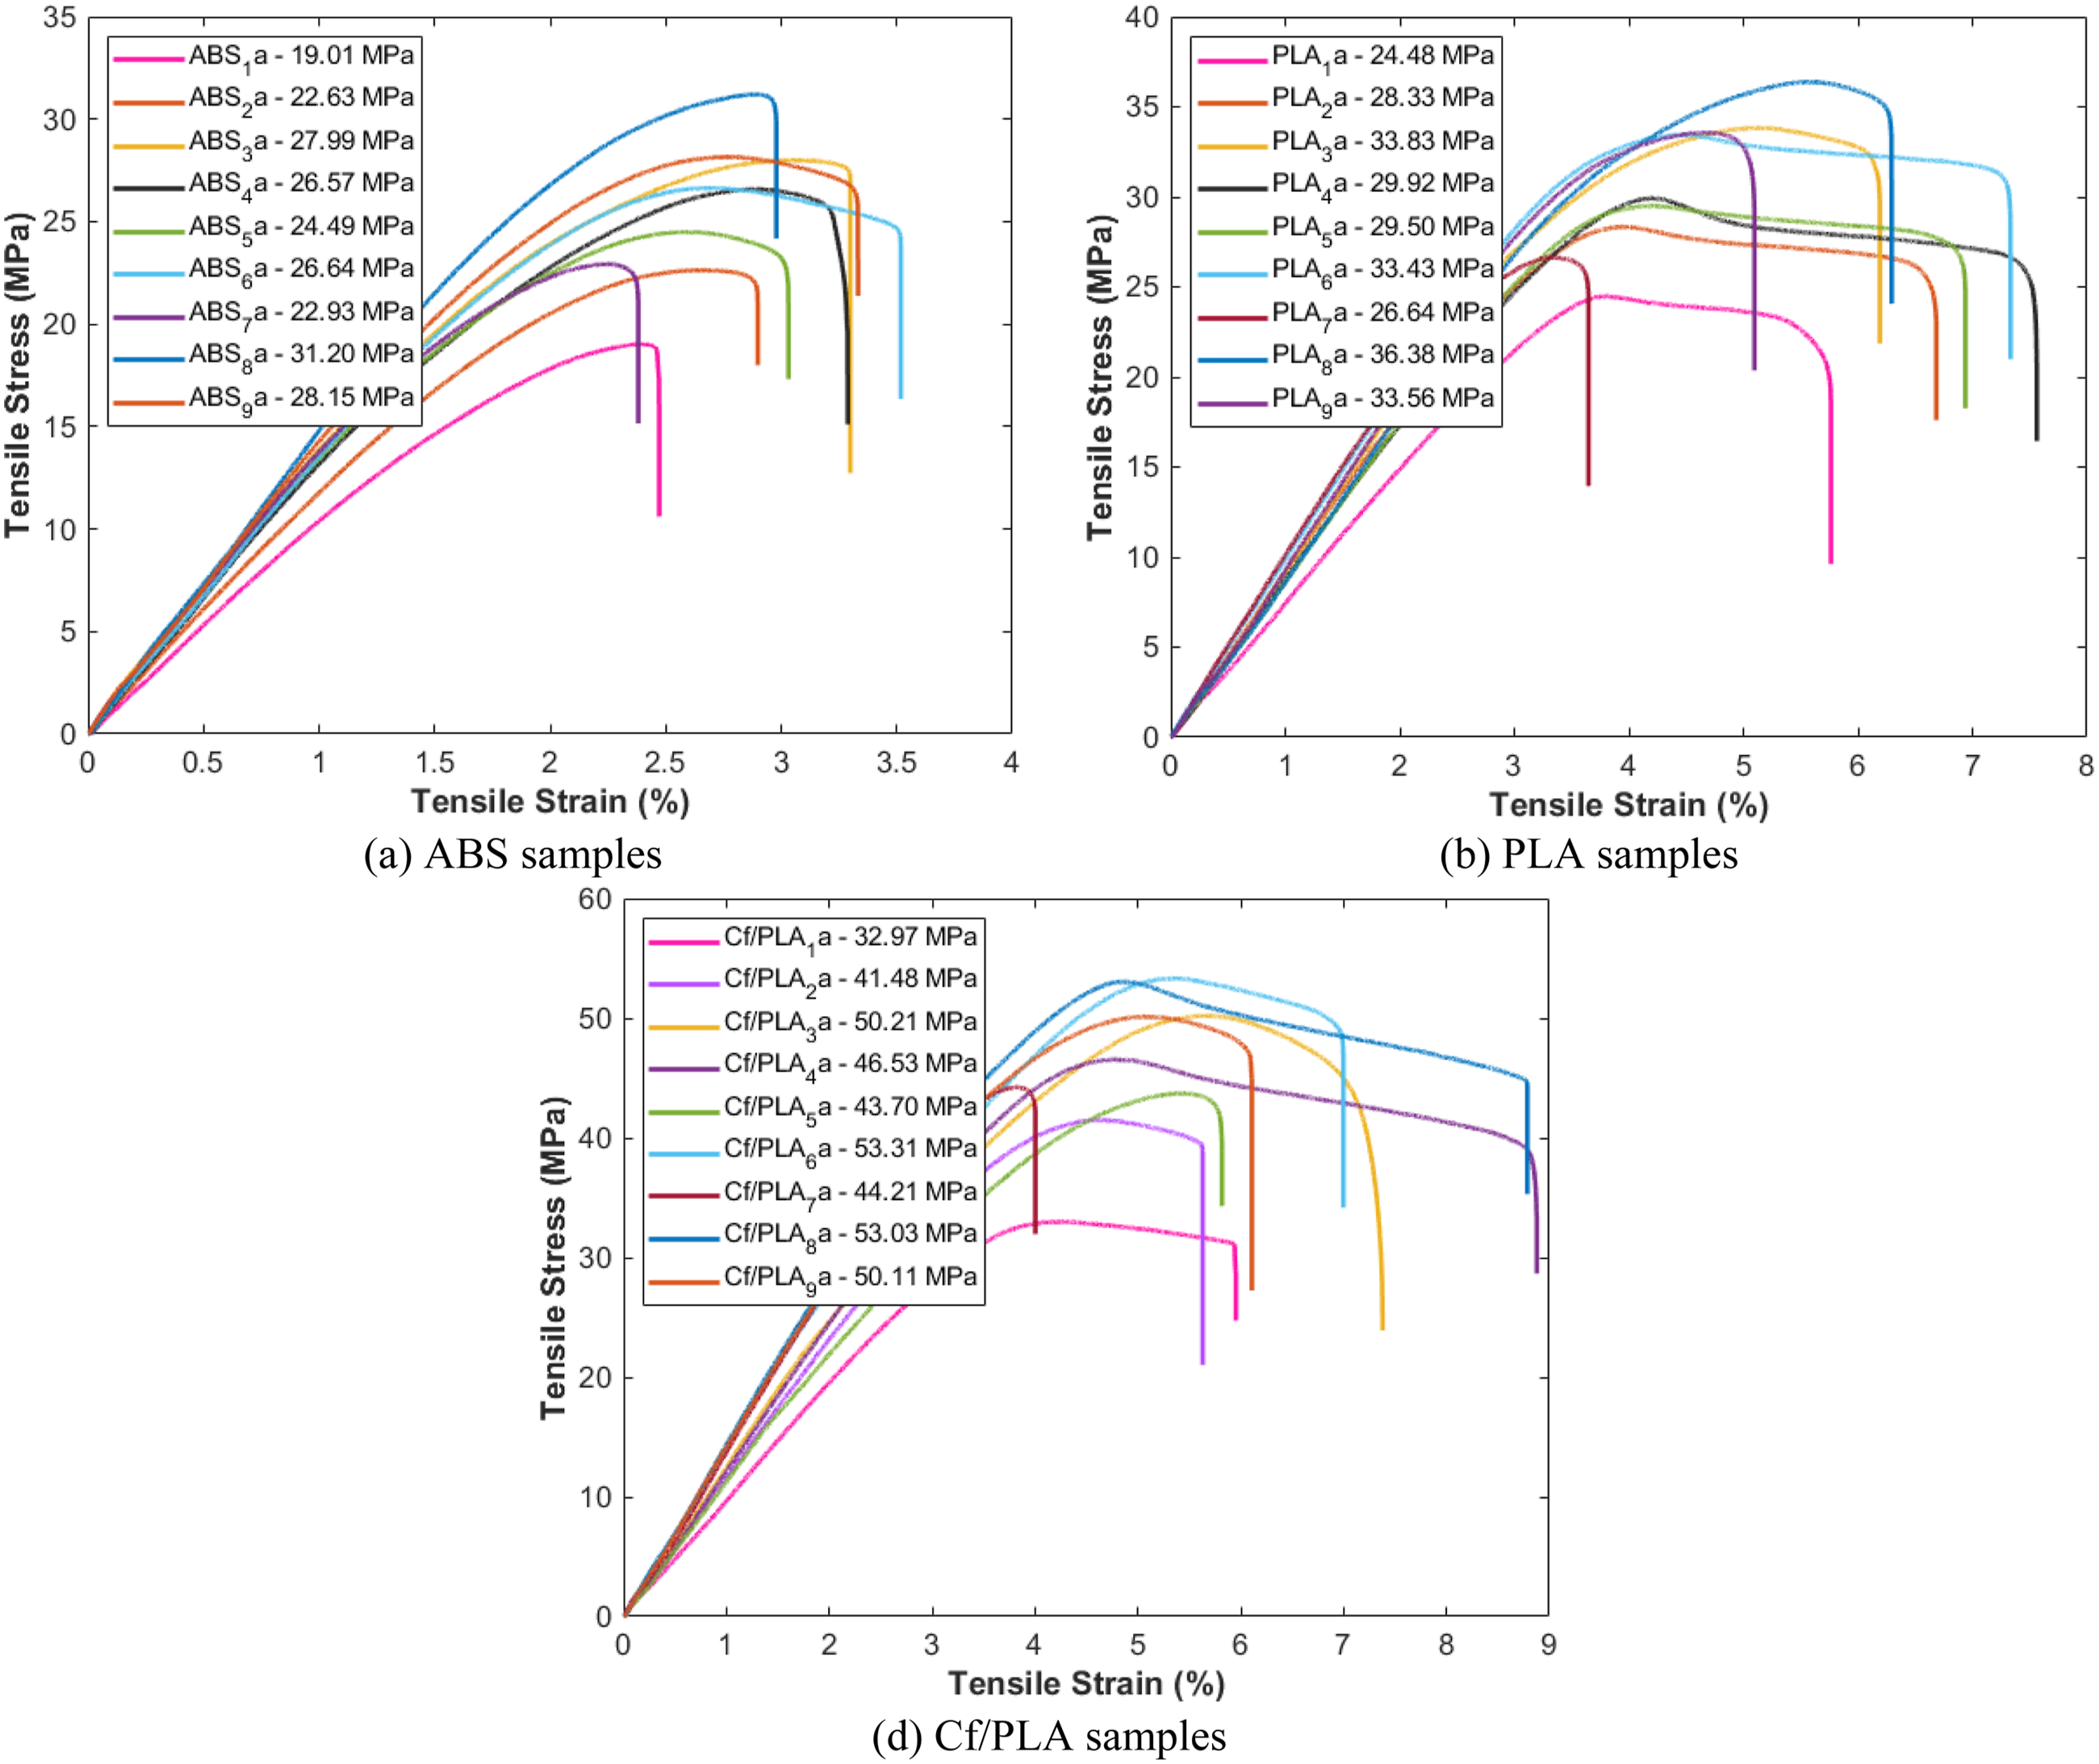
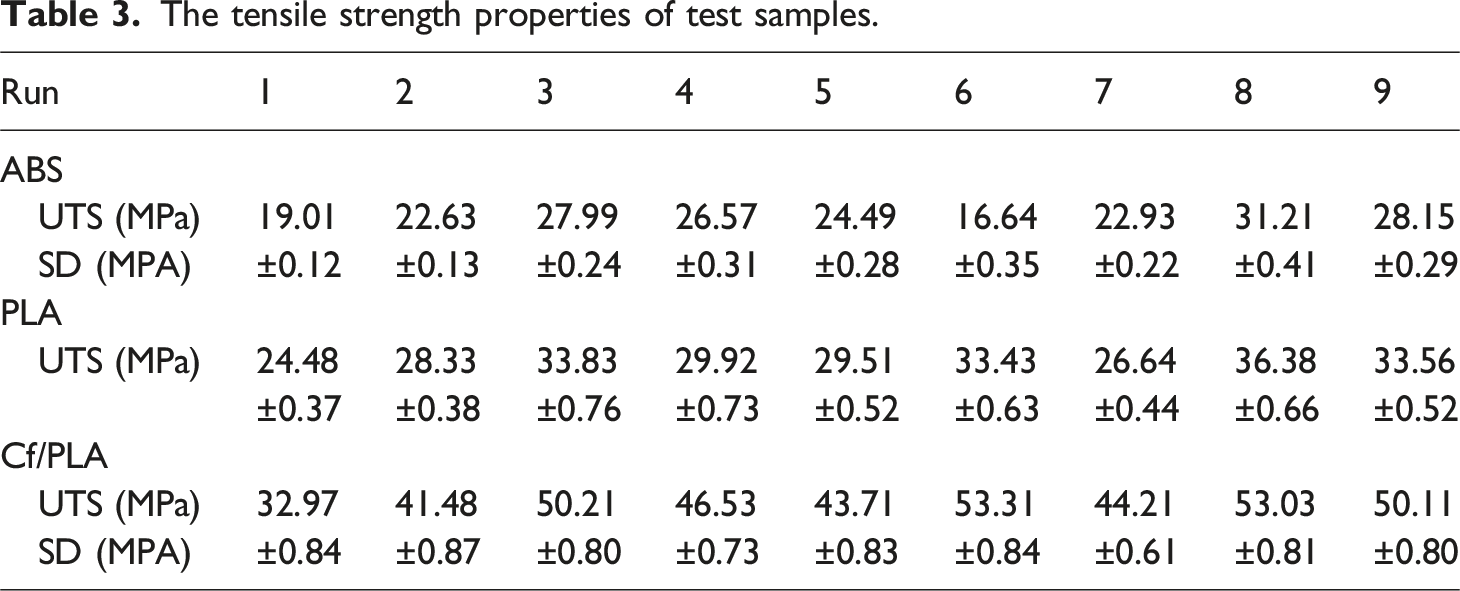
The tensile strength properties of test samples.
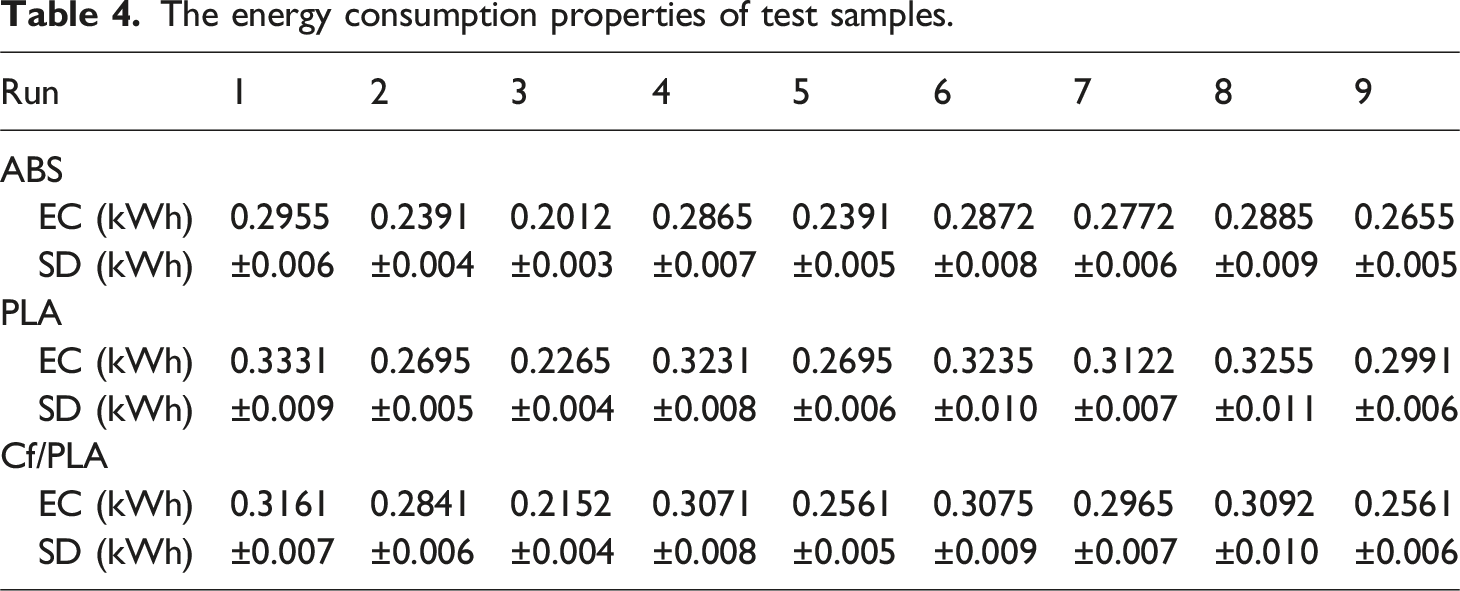
The energy consumption properties of test samples.
The carbon emission properties of test samples.
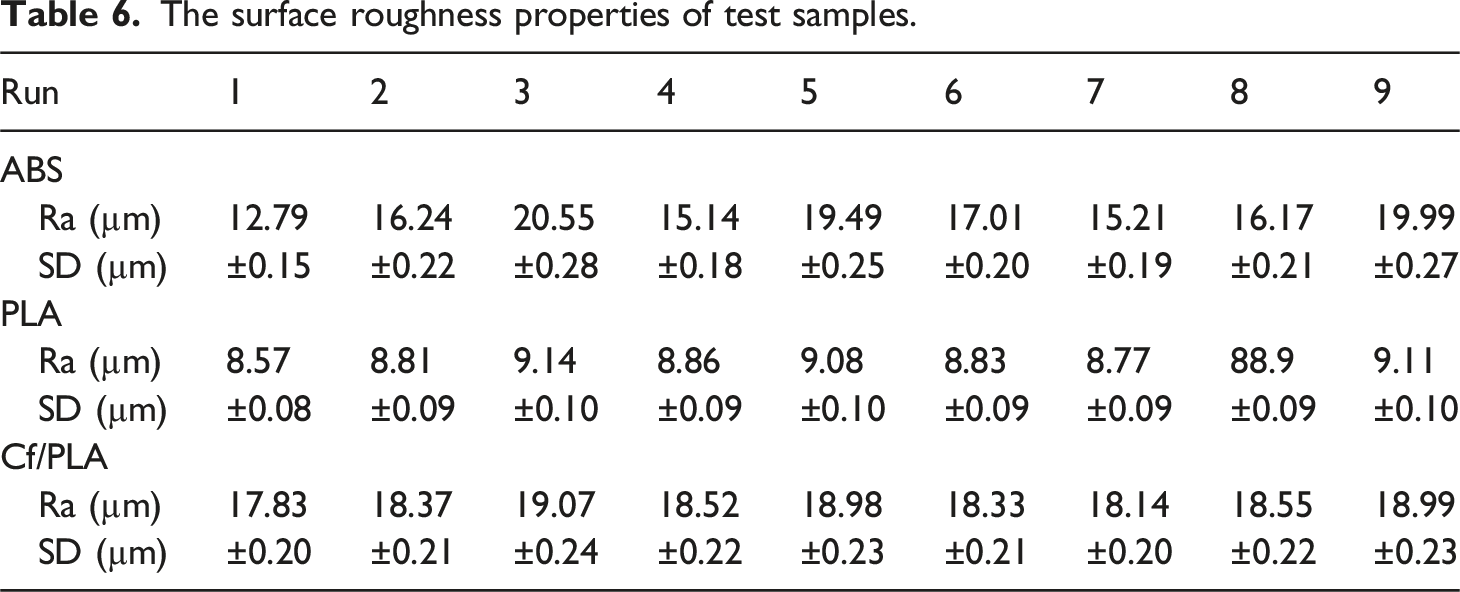
The surface roughness properties of test samples.
Taguchi Analysis Results
The influence of FDM process parameters on tensile strength was statistically analyzed using Taguchi signal-to-noise (S/N) ratios with the “larger-is-better” formulation for each material group. This approach emphasizes maximizing tensile strength while minimizing variability across replicates and provides a robust method for identifying the most influential parameters. The mean S/N ratios for each parameter level are illustrated in Figure 4 for ABS, PLA, and Cf/PLA specimens, respectively. For ABS samples, the S/N plots reveal that ID and LT are the most dominant factors influencing tensile strength. As ID increases from 30% to 90%, a significant improvement in tensile strength is observed, which is reflected by a strong upward trend in S/N values. Similarly, increasing the LT from 200 µm to 400 µm enhances material continuity and interlayer bonding, contributing to greater strength. Although PS shows a mild non-linear effect, the concentric IP outperforms cubic and triangle patterns, indicating better internal load distribution and reduced stress concentration. In the case of PLA specimens, the trend is consistent with that of ABS. LT and ID have the greatest positive effect on tensile strength, as evidenced by the steep slopes of their respective S/N plots. The results suggest that thicker layers and denser infill promote stronger interlayer adhesion and minimize void formation. The PS exhibits a slight negative trend, where slower speeds lead to marginally improved strength—likely due to improved thermal bonding between layers. Among the patterns, concentric again yields the highest S/N ratio, reinforcing its role as the optimal internal geometry for tensile performance. For Cf/PLA samples, the influence of the parameters is even more pronounced. The S/N ratio plots show a steep and consistent increase in tensile strength with rising ID and LT, validating the mechanical benefit of combining carbon fiber reinforcement with dense and stable printing configurations. PS has a relatively negligible effect in this group, likely due to the dominant stiffness of the composite material that overshadows thermal bonding effects. Once again, “concentric” pattern provides the highest tensile performance, further confirming its effectiveness across all material types. The Taguchi S/N analysis demonstrates that ID and LT are the most statistically significant parameters affecting tensile strength, regardless of material type. The “concentric” pattern consistently delivers superior mechanical results, while the effect of PS appears to be material-dependent and less impactful. Mean of tensile strength S/N ratios for test samples.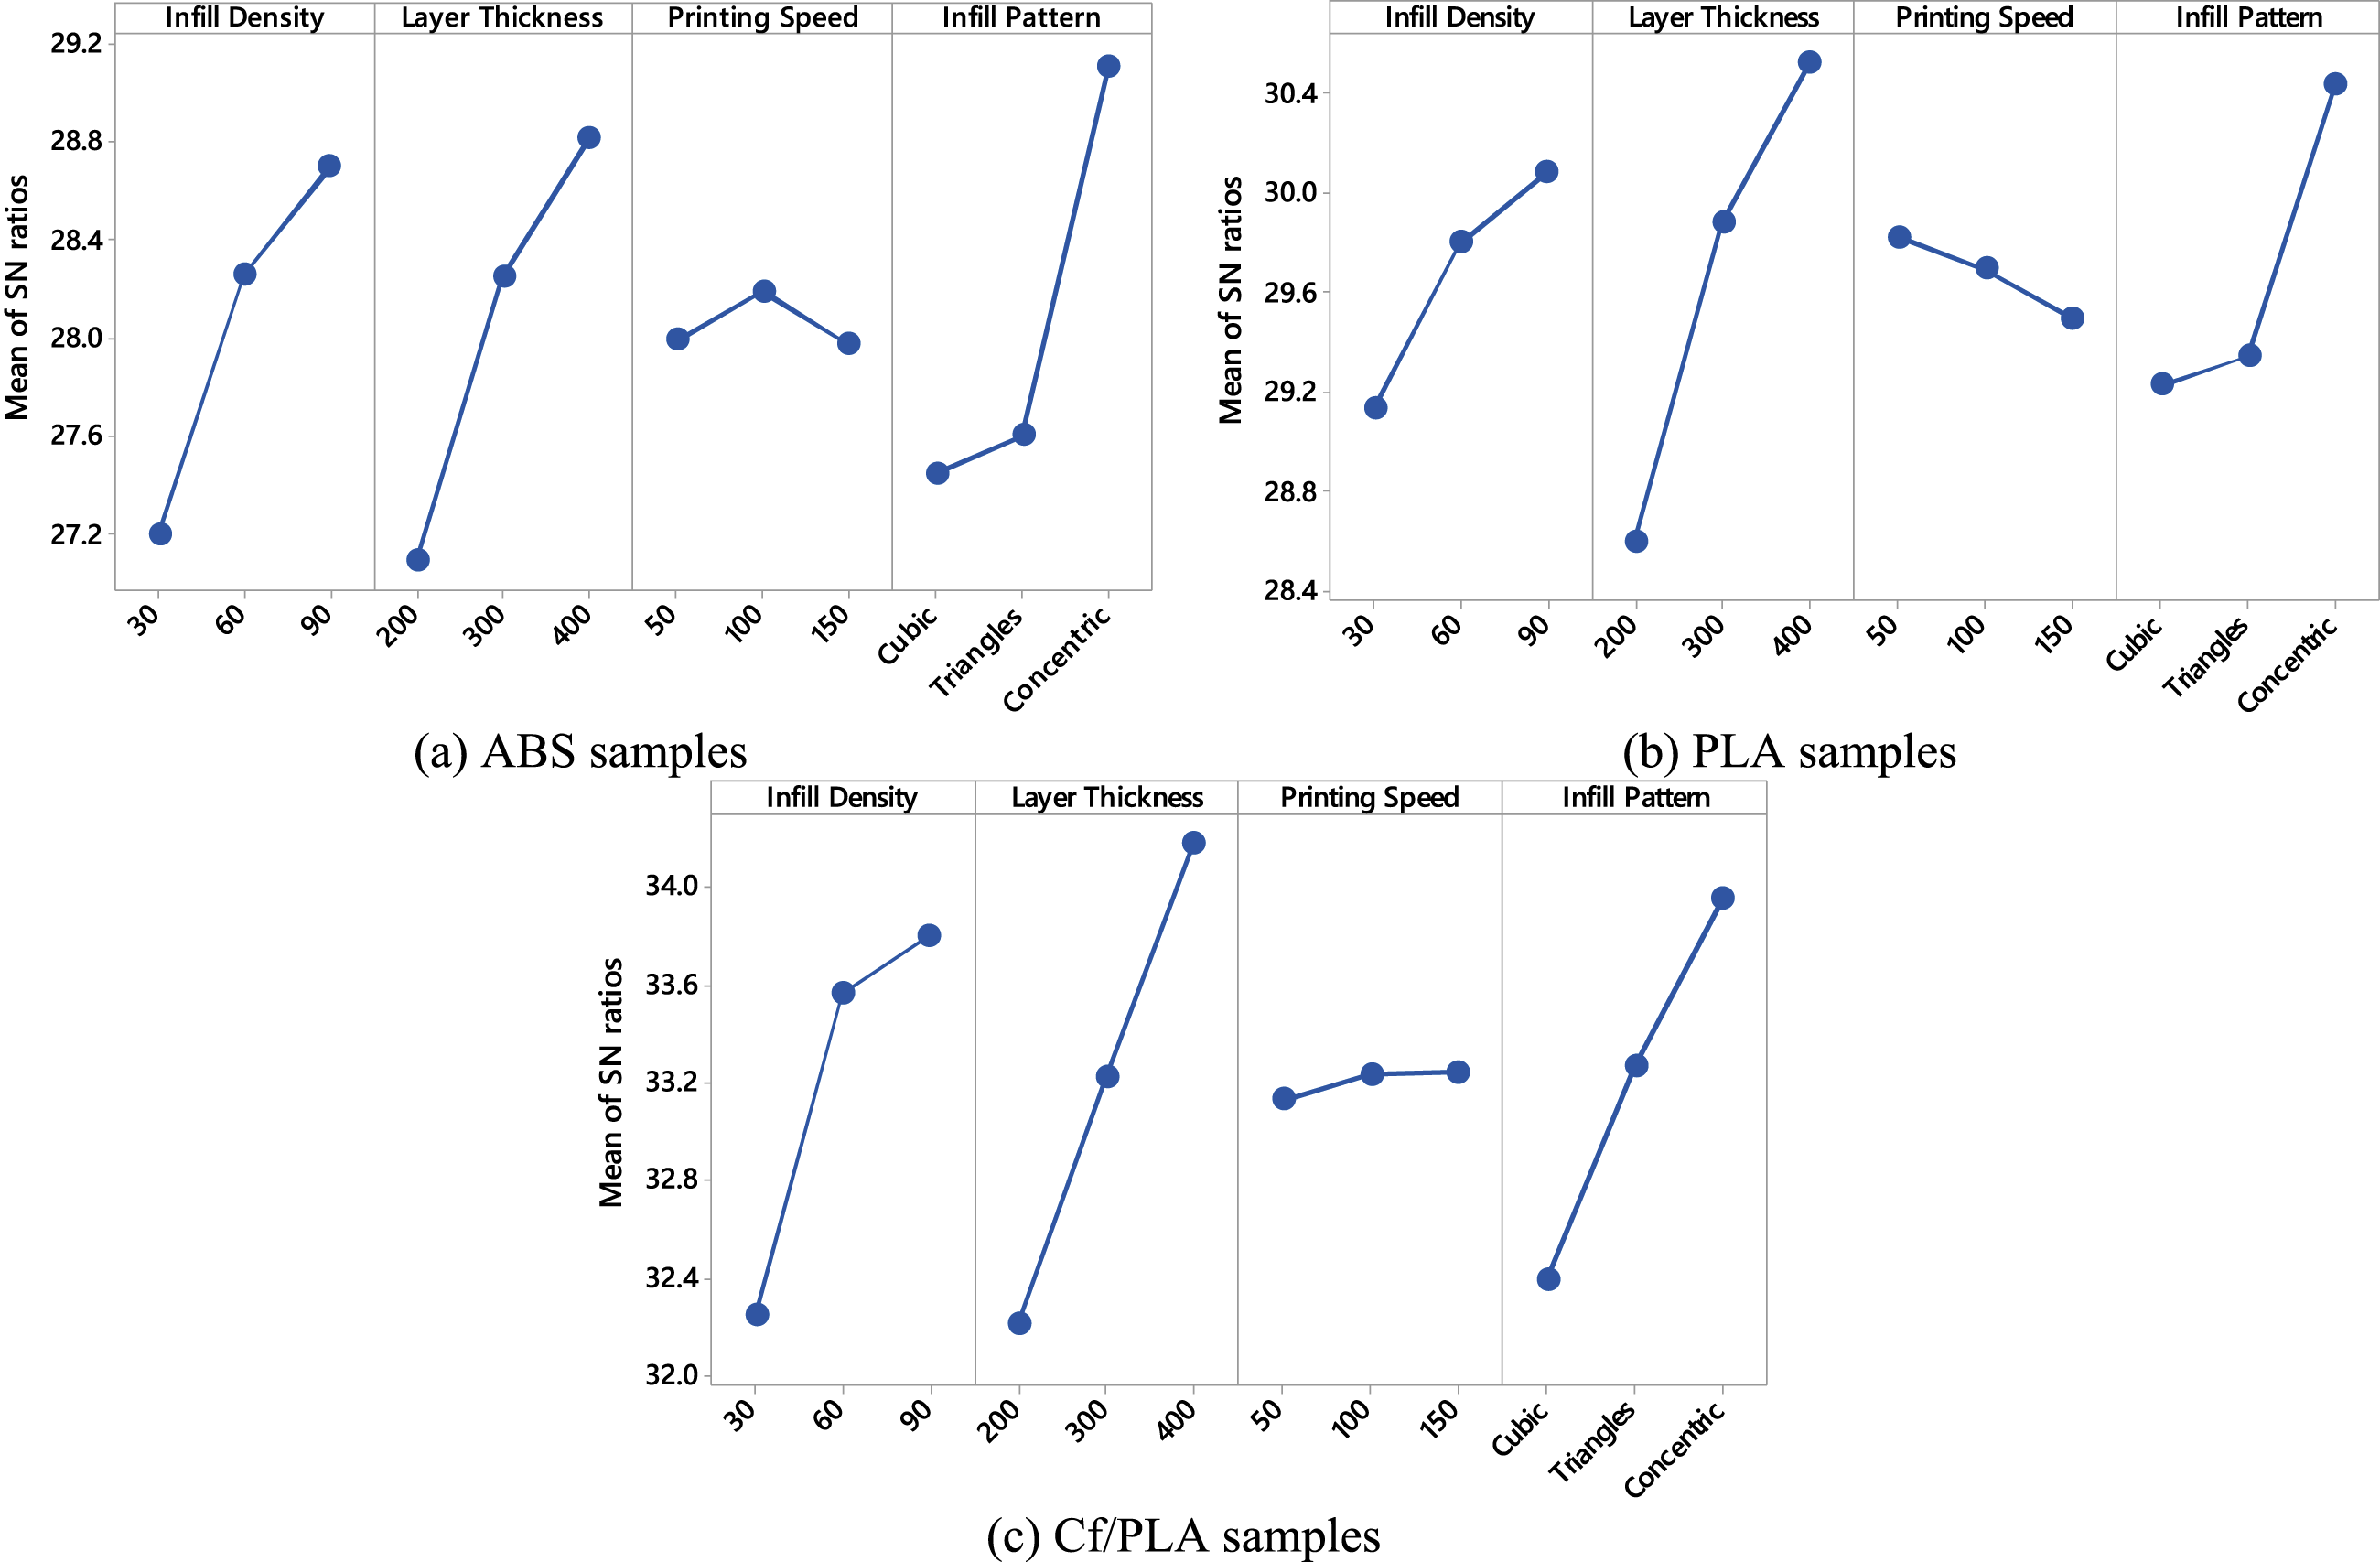
In addition to mechanical strength, the Taguchi was applied to evaluate the influence of process parameters on energy consumption across all three material groups. The analysis was performed using the “smaller-is-better” criterion, as lower energy consumption is desirable for both economic and environmental sustainability. Figure 5 presents the mean S/N ratios for energy consumption, plotted against each process parameter for the respective material types. For ABS samples, ID has the most significant effect on energy consumption. As ID increases from 30% to 90%, S/N values drop notably, indicating higher energy usage. This is expected, as denser internal structures require longer print times and more material extrusion. LT also exhibits a notable trend: increasing thickness reduces energy consumption, likely due to fewer layers being needed to complete the part. PS shows a strong positive correlation with energy efficiency—higher speeds result in lower energy consumption by reducing overall fabrication time. The influence of IP is relatively limited but shows a slight advantage for concentric structures. PLA samples follow nearly identical trends. ID emerges as the most impactful parameter, with energy consumption rising significantly at higher density levels. This is followed by LT, where thicker layers improve energy performance. PS plays a critical role as well: slower speeds lead to higher energy consumption, while faster speeds reduce it appreciably. The IP has a marginal effect, with concentric and triangle configurations offering slightly better energy performance compared to cubic. For Cf/PLA samples, the trends are consistent but slightly more complex. While ID still influences energy consumption, the difference between medium (60%) and high (90%) density is less pronounced, possibly due to the inherently higher energy demand of extruding fiber-reinforced material. LT remains a strong contributor to reduced energy usage, as thicker layers minimize the total number of print layers. PS shows a high linear relationship—higher speeds lead to significantly lower energy consumption. IP exhibits a more visible impact in Cf/PLA than in materials, with concentric patterns outperforming both triangle and cubic in terms of energy efficiency. The Taguchi confirms that ID and PS are the most influential factors affecting energy consumption. Thicker layers and faster speeds consistently result in improved energy efficiency, while high densities significantly increase consumption. Mean of energy consumption S/N ratios for test samples.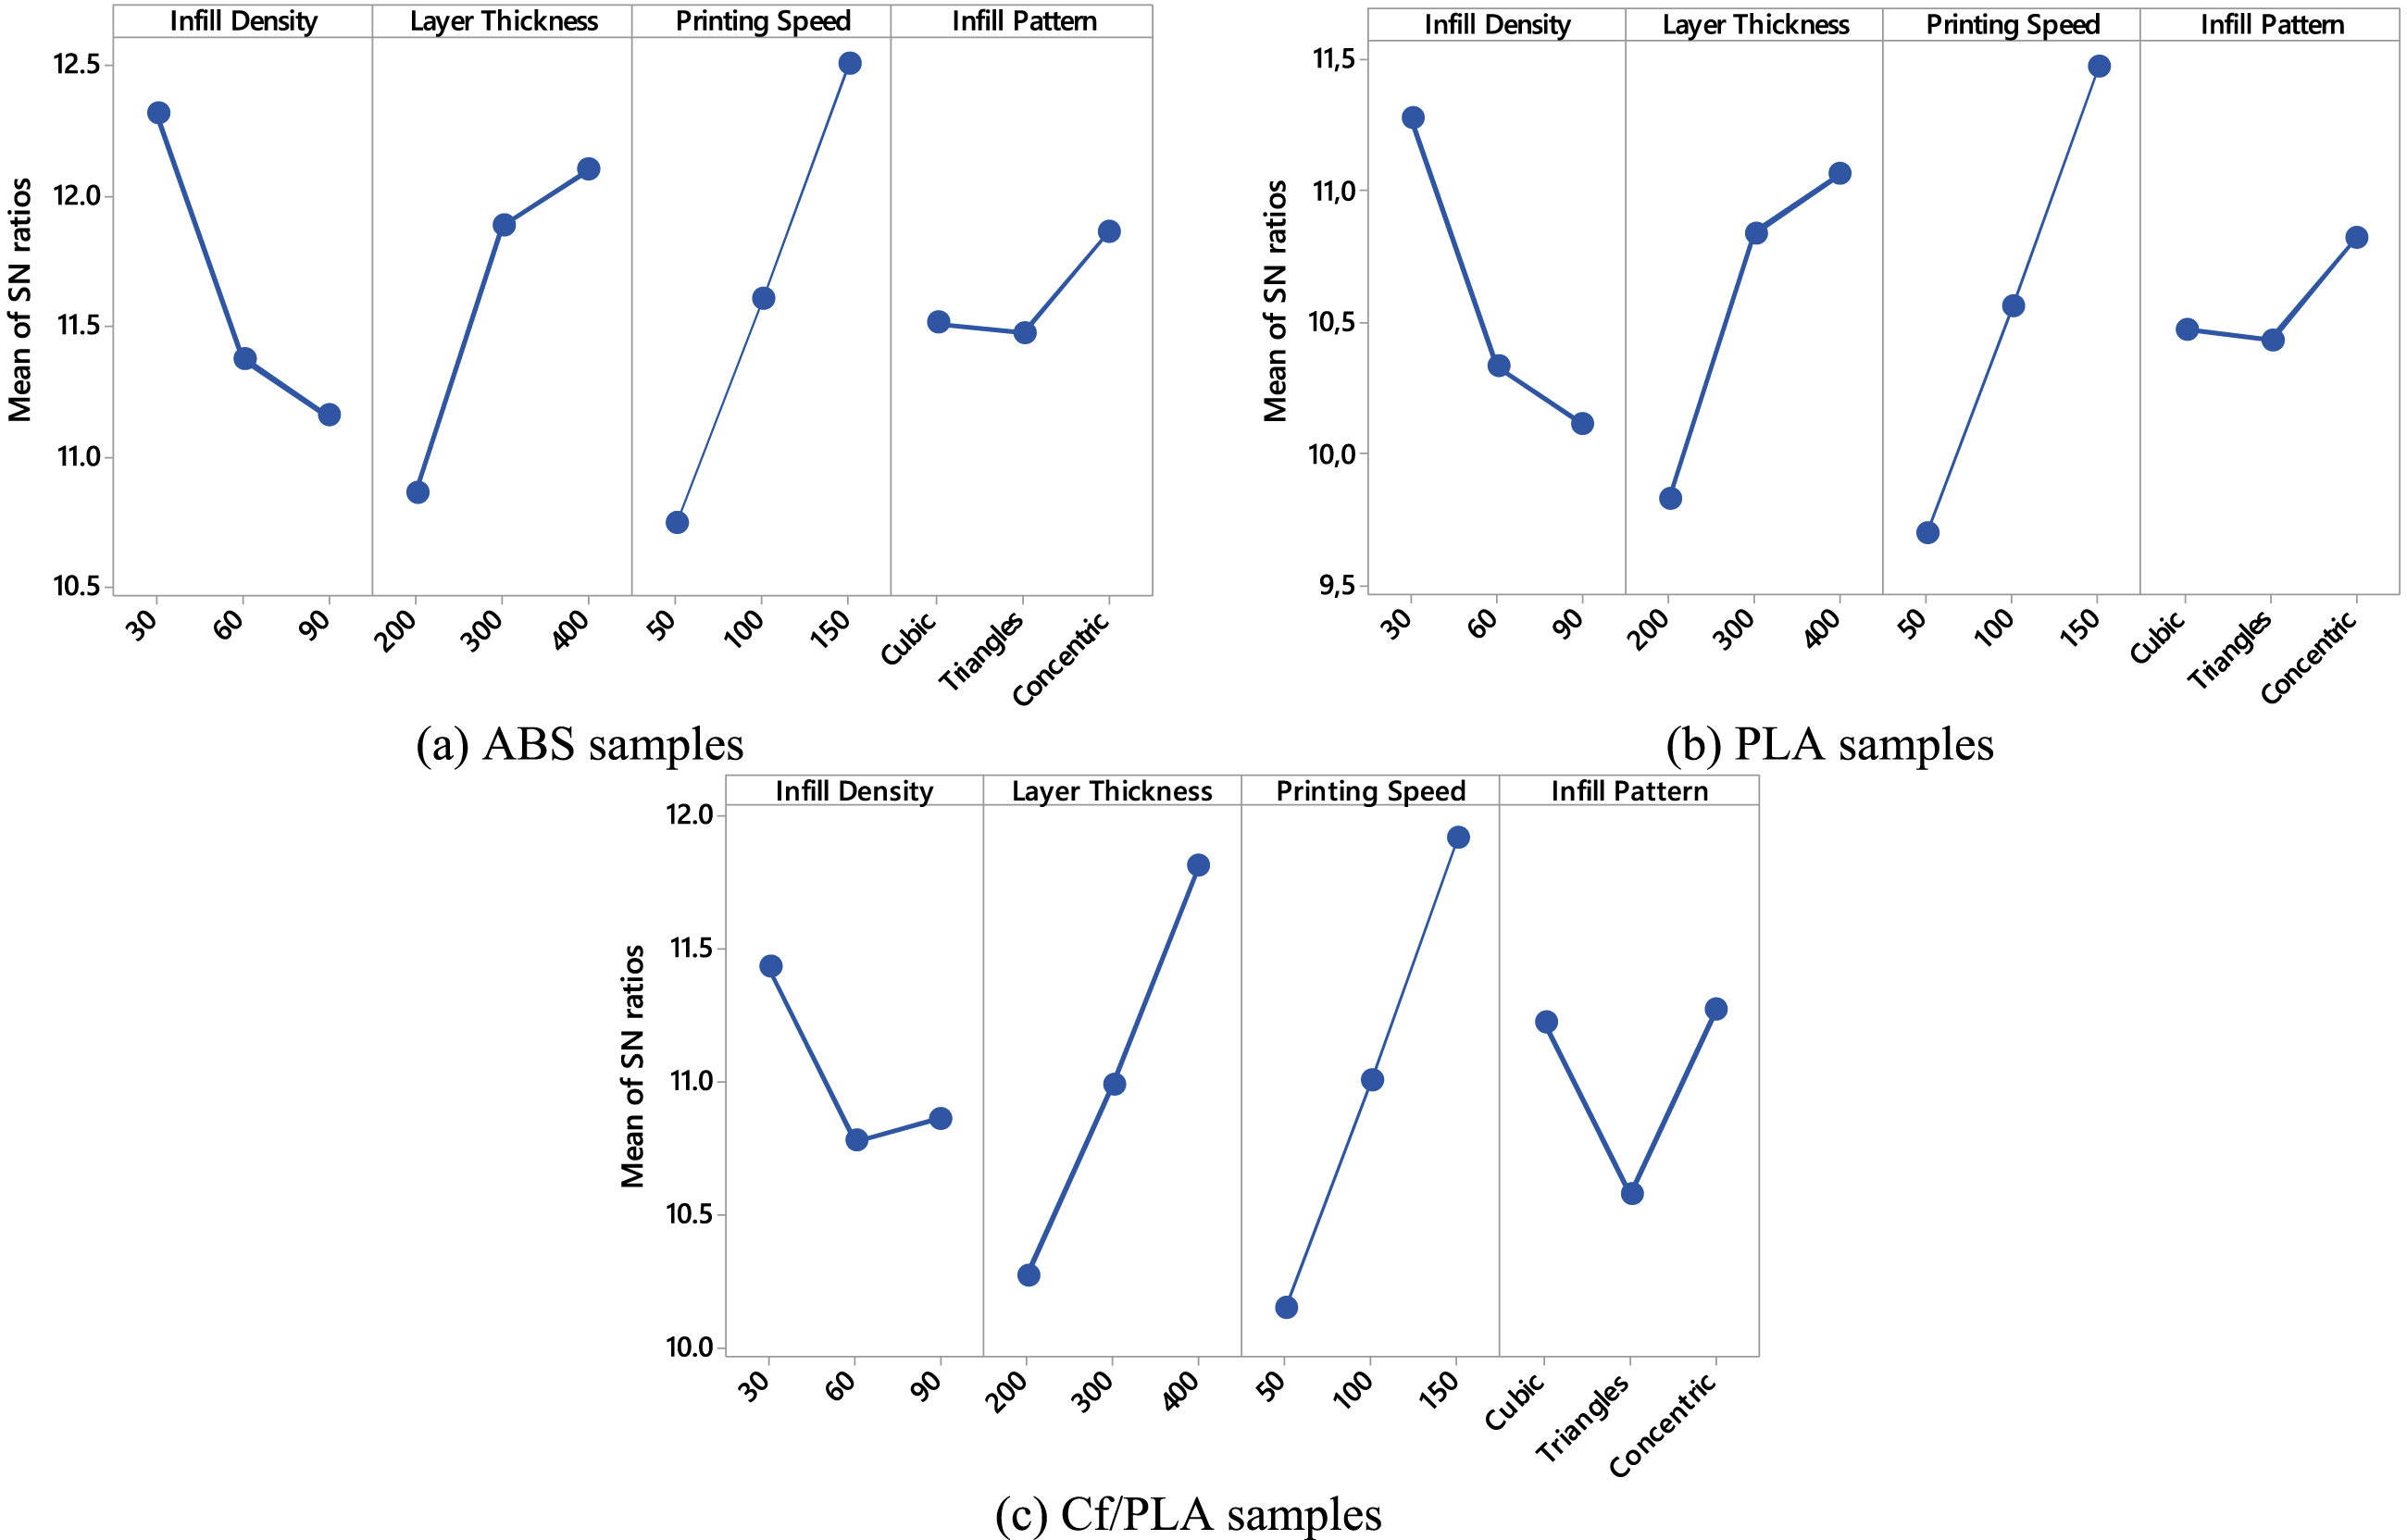
Following the evaluation of energy consumption, the Taguchi analysis was extended to examine the influence of FDM process parameters on CO2-eq using the “smaller-is-better” criterion. This approach prioritizes configurations that minimize environmental impact, and the S/N plots for ABS, PLA, and Cf/PLA samples are presented in Figure 6. For ABS samples, ID is the most impactful parameter on carbon emissions. A steep decline in S/N ratio is observed as ID increases from 30% to 90%, reflecting the direct correlation between material usage and total CO2 emissions. Since carbon emissions are a function of both material mass and energy consumption, denser structures inherently lead to greater environmental burden. LT also affects emissions, with thicker layers (400 µm) showing a slight improvement in S/N values, likely due to reduced print time and energy usage. PS demonstrates a positive trend—higher speeds reduce emissions by decreasing energy consumption. The IP shows minor influence, with concentric patterns offering slightly better emission profiles. PLA samples show a remarkably similar trend to ABS. Again, ID is the most dominant factor, with higher densities significantly increasing emissions. The S/N ratio decreases progressively from 30% to 90% density, confirming the environmental cost of denser prints. LT and PS both contribute to marginal emission reductions at higher values, consistent with their effects on energy consumption. IP exhibits a slight negative trend, with triangle and concentric patterns producing marginally lower emissions compared to cubic, although the difference remains small. For Cf/PLA samples, the S/N plots reveal a consistent pattern across all parameters. The most significant drop in S/N ratio again occurs with increasing ID, emphasizing its dominant role in determining the carbon footprint. Due to the higher emission factor of carbon fiber-reinforced material, the environmental impact is more pronounced even at moderate densities. LT shows a clear inverse relationship with emission thicker layers reduces the number of layers required and lowers total energy use. PS exerts a moderate influence, where faster speeds reduce emissions, though the effect is slightly less pronounced than in PLA and ABS. The IP has a greater effect on Cf/PLA than on other materials. Among the tested patterns, concentric provides the best emission performance, likely due to efficient material dispersion and reduced path complexity. The Taguchi analysis confirms that ID is the most significant contributor to carbon emissions, followed by LT and PS. Across all material types, high density consistently leads to increased emissions, while faster speeds and thicker layers help mitigate environmental impact. These insights are essential for establishing sustainable FDM printing strategies with ecological responsibility. Mean of carbon emission S/N ratios for test samples.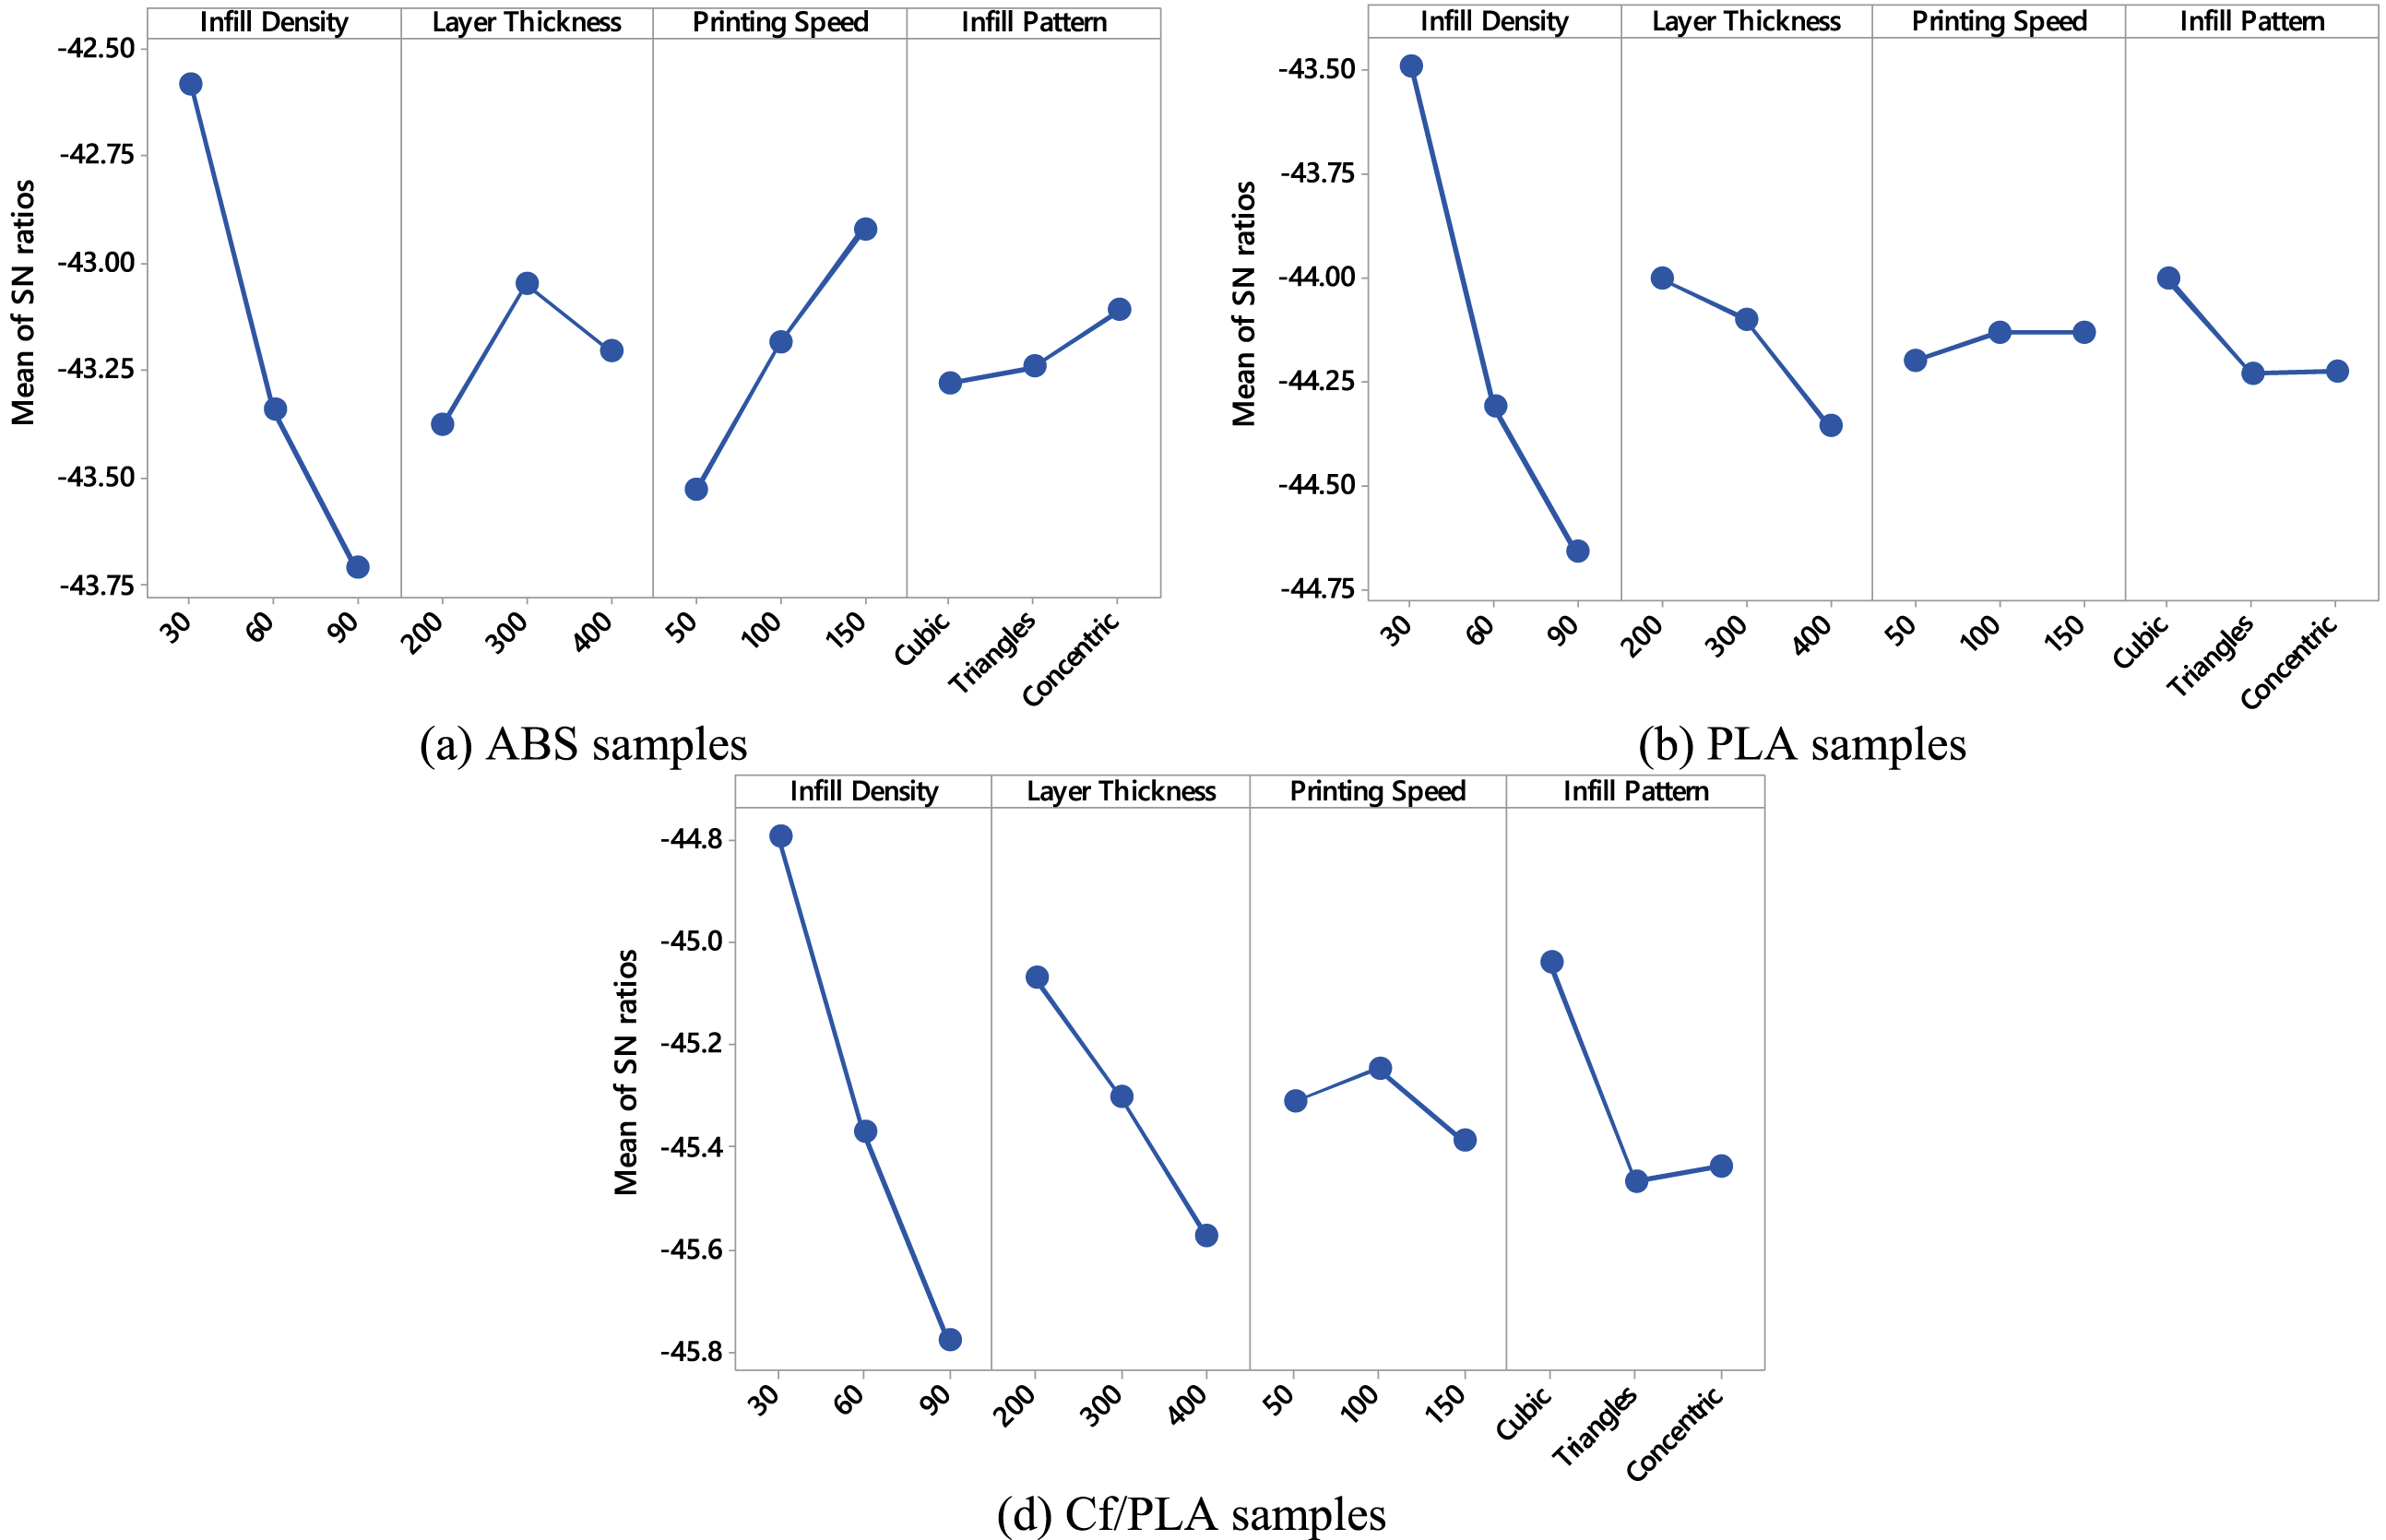
In the final stage of the Taguchi, the effect of FDM process parameters on Ra was investigated using the “smaller-is-better” criterion, as improved surface quality is associated with lower Ra values. The S/N ratios for ABS, PLA, and Cf/PLA specimens are depicted in Figure 7. These plots provide insight into how each printing parameter contributes to the final surface finish. For ABS samples, the most significant parameter affecting surface roughness is LT. As the LT increases from 200 µm to 400 µm, a noticeable decrease in S/N ratio is observed, indicating worsening surface quality. This is expected, as thicker layers produce more visible stair-stepping effects on part surfaces. PS also negatively influences surface finish—higher speeds lead to poorer quality due to reduced deposition precision and incomplete fusion between layers. The effect of ID is minimal, though a slight improvement is observed at lower densities. IP has a non-linear impact, with the triangle pattern showing slightly better results than concentric and cubic. In PLA samples, the trends remain consistent. LT again exhibits the strongest influence, with thinner layers yielding smoother surfaces. PS significantly influences the outcome; lower speeds correspond to higher S/N ratios, reflecting enhanced surface finish. This may be attributed to improved thermal fusion and material deposition consistency at lower speeds. ID has a minor effect, like ABS, while IP shows a peak performance with the triangle pattern, suggesting that this pattern may provide smoother outer contours in PLA prints. In the case of Cf/PLA composites, the same parameters dominate surface finish. LT is once again the most influential factor, with thinner layers producing better surfaces. PS shows a clear negative trend, reinforcing the importance of controlled deposition in maintaining surface quality, especially for reinforced materials. The impact of IP is more prominent in Cf/PLA compared to the other materials. The “triangle” IP results in the highest S/N ratio, while cubic leads to rougher surfaces—likely due to more abrupt directional changes in toolpath and fiber orientation irregularities. ID, as in previous materials, has limited but still noticeable impact, with lower densities slightly improving surface finish. In conclusion, the Taguchi S/N ratio analysis for surface roughness reveals that LT and PS are the most critical parameters across all material types. Lower LT (200 µm) and reduced speeds (50 mm/s) consistently result in improved surface quality. While IP also plays a role—particularly in Cf/PLA—the effect of density remains relatively minor. Mean of surface roughness S/N ratios for test samples.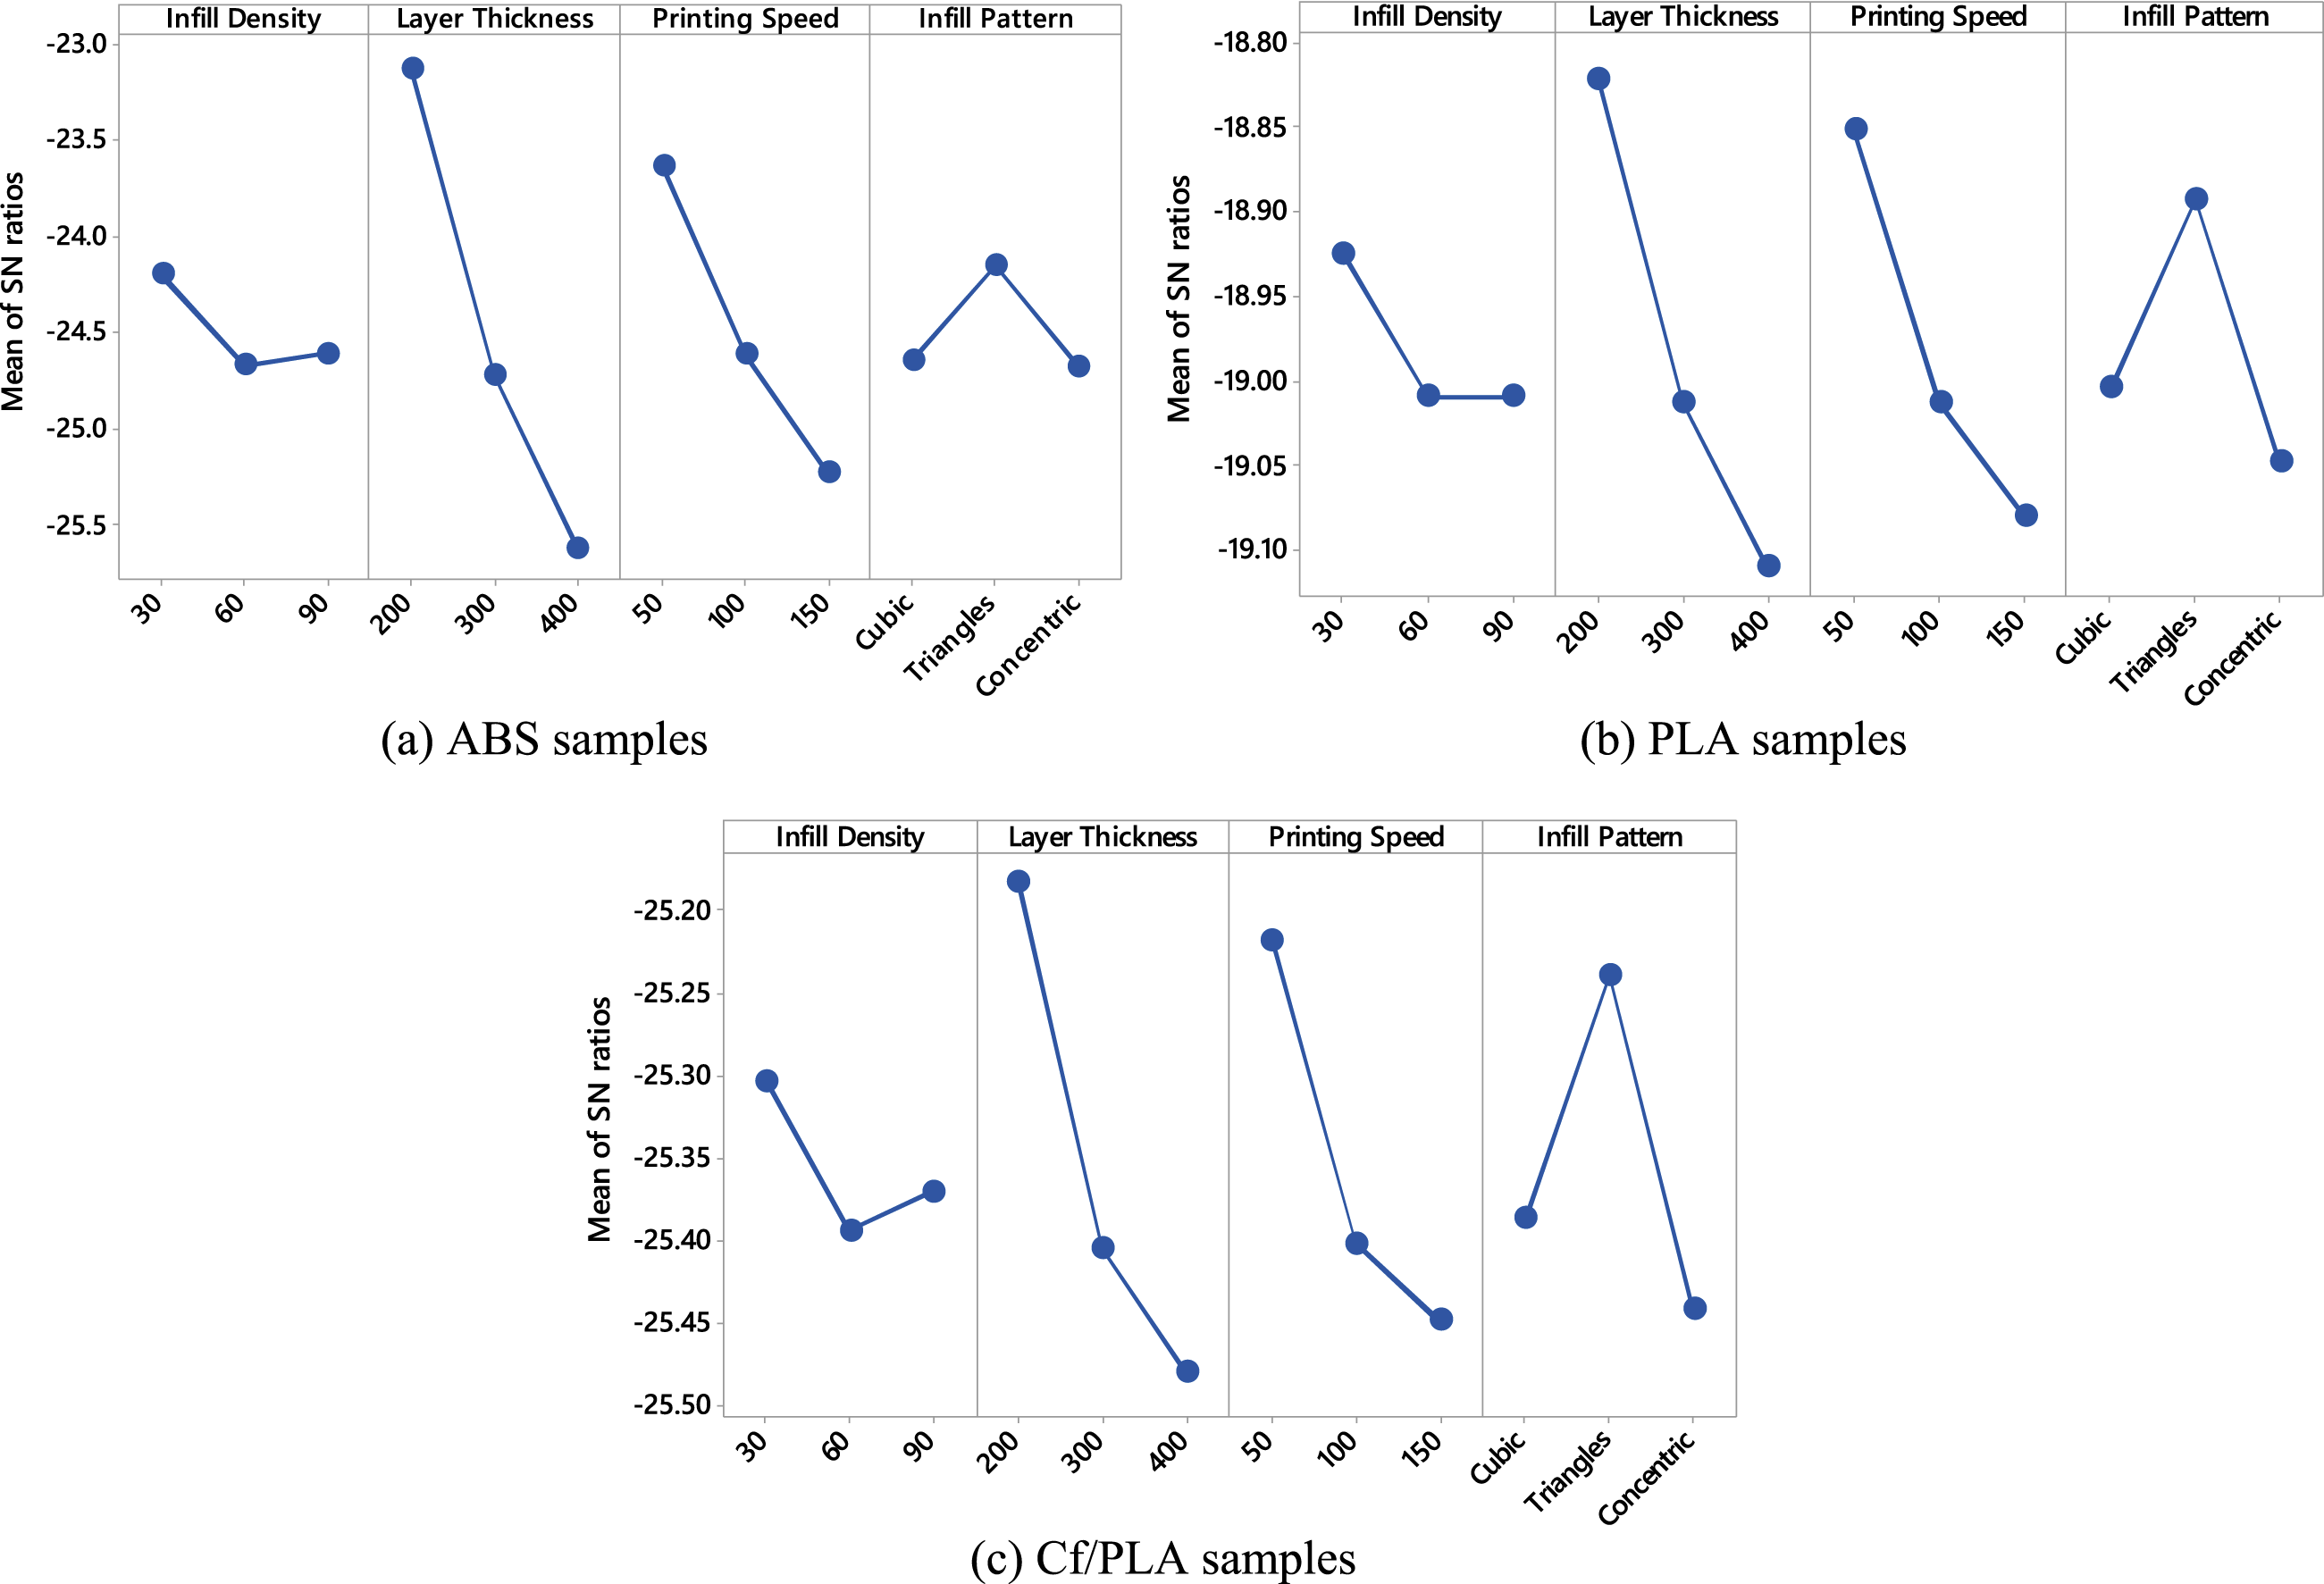
Analysis of Variance Results
ANOVA was employed to statistically evaluate the effect of each FDM process parameter on the UTS for ABS, PLA, and Cf/PLA specimens individually. The percentage contributions of each factor were calculated based on their adjusted sum of squares (Adj SS) values. This method allows for an accurate partitioning of the variance in tensile strength attributed to each parameter. The results are presented in Figure 8, which shows the relative contributions of the parameters for each material. For ABS samples, ANOVA revealed that IP had the highest influence on tensile strength, contributing to 34.63%, followed closely by LT at 33.07% and ID at 25.45%. PS, while less influential, still accounted for 5.63% of the variation. The internal geometry and material deposition strategy affects the mechanical performance of ABS prints. In the case of PLA samples, LT was the dominant factor with a contribution of 47.41%, emphasizing the importance of interlayer bonding quality in determining strength. IP and ID contributed 27.03% and 17.78%, respectively, while PS had a modest effect at 6.57%. These findings align with the material’s behavior, where precision and bonding are more critical due to PLA’s relatively brittle nature. For Cf/PLA composites, the influence was more evenly distributed among the major parameters. LT contributed 37.84%, followed by ID with 28.92%, and IP with 25.91%. Although PS made the lowest contribution (6.09%), its effect was still non-negligible. The relatively balanced influence in Cf/PLA samples can be attributed to the composite nature of the material, where both fiber orientation and layer configuration significantly impact mechanical behavior. Based on the p-values calculated from the ANOVA, all four process parameters were found to be statistically significant (p < .05) for each material group. This confirms that each parameter has a meaningful effect on tensile strength and should be considered in any optimization or predictive modeling effort. The ANOVA results demonstrate that LT consistently emerges as the most impactful parameter across materials, especially for PLA and Cf/PLA. IP and ID also play substantial roles depending on the material type. Contribution of printing parameters to the tensile strength of test samples.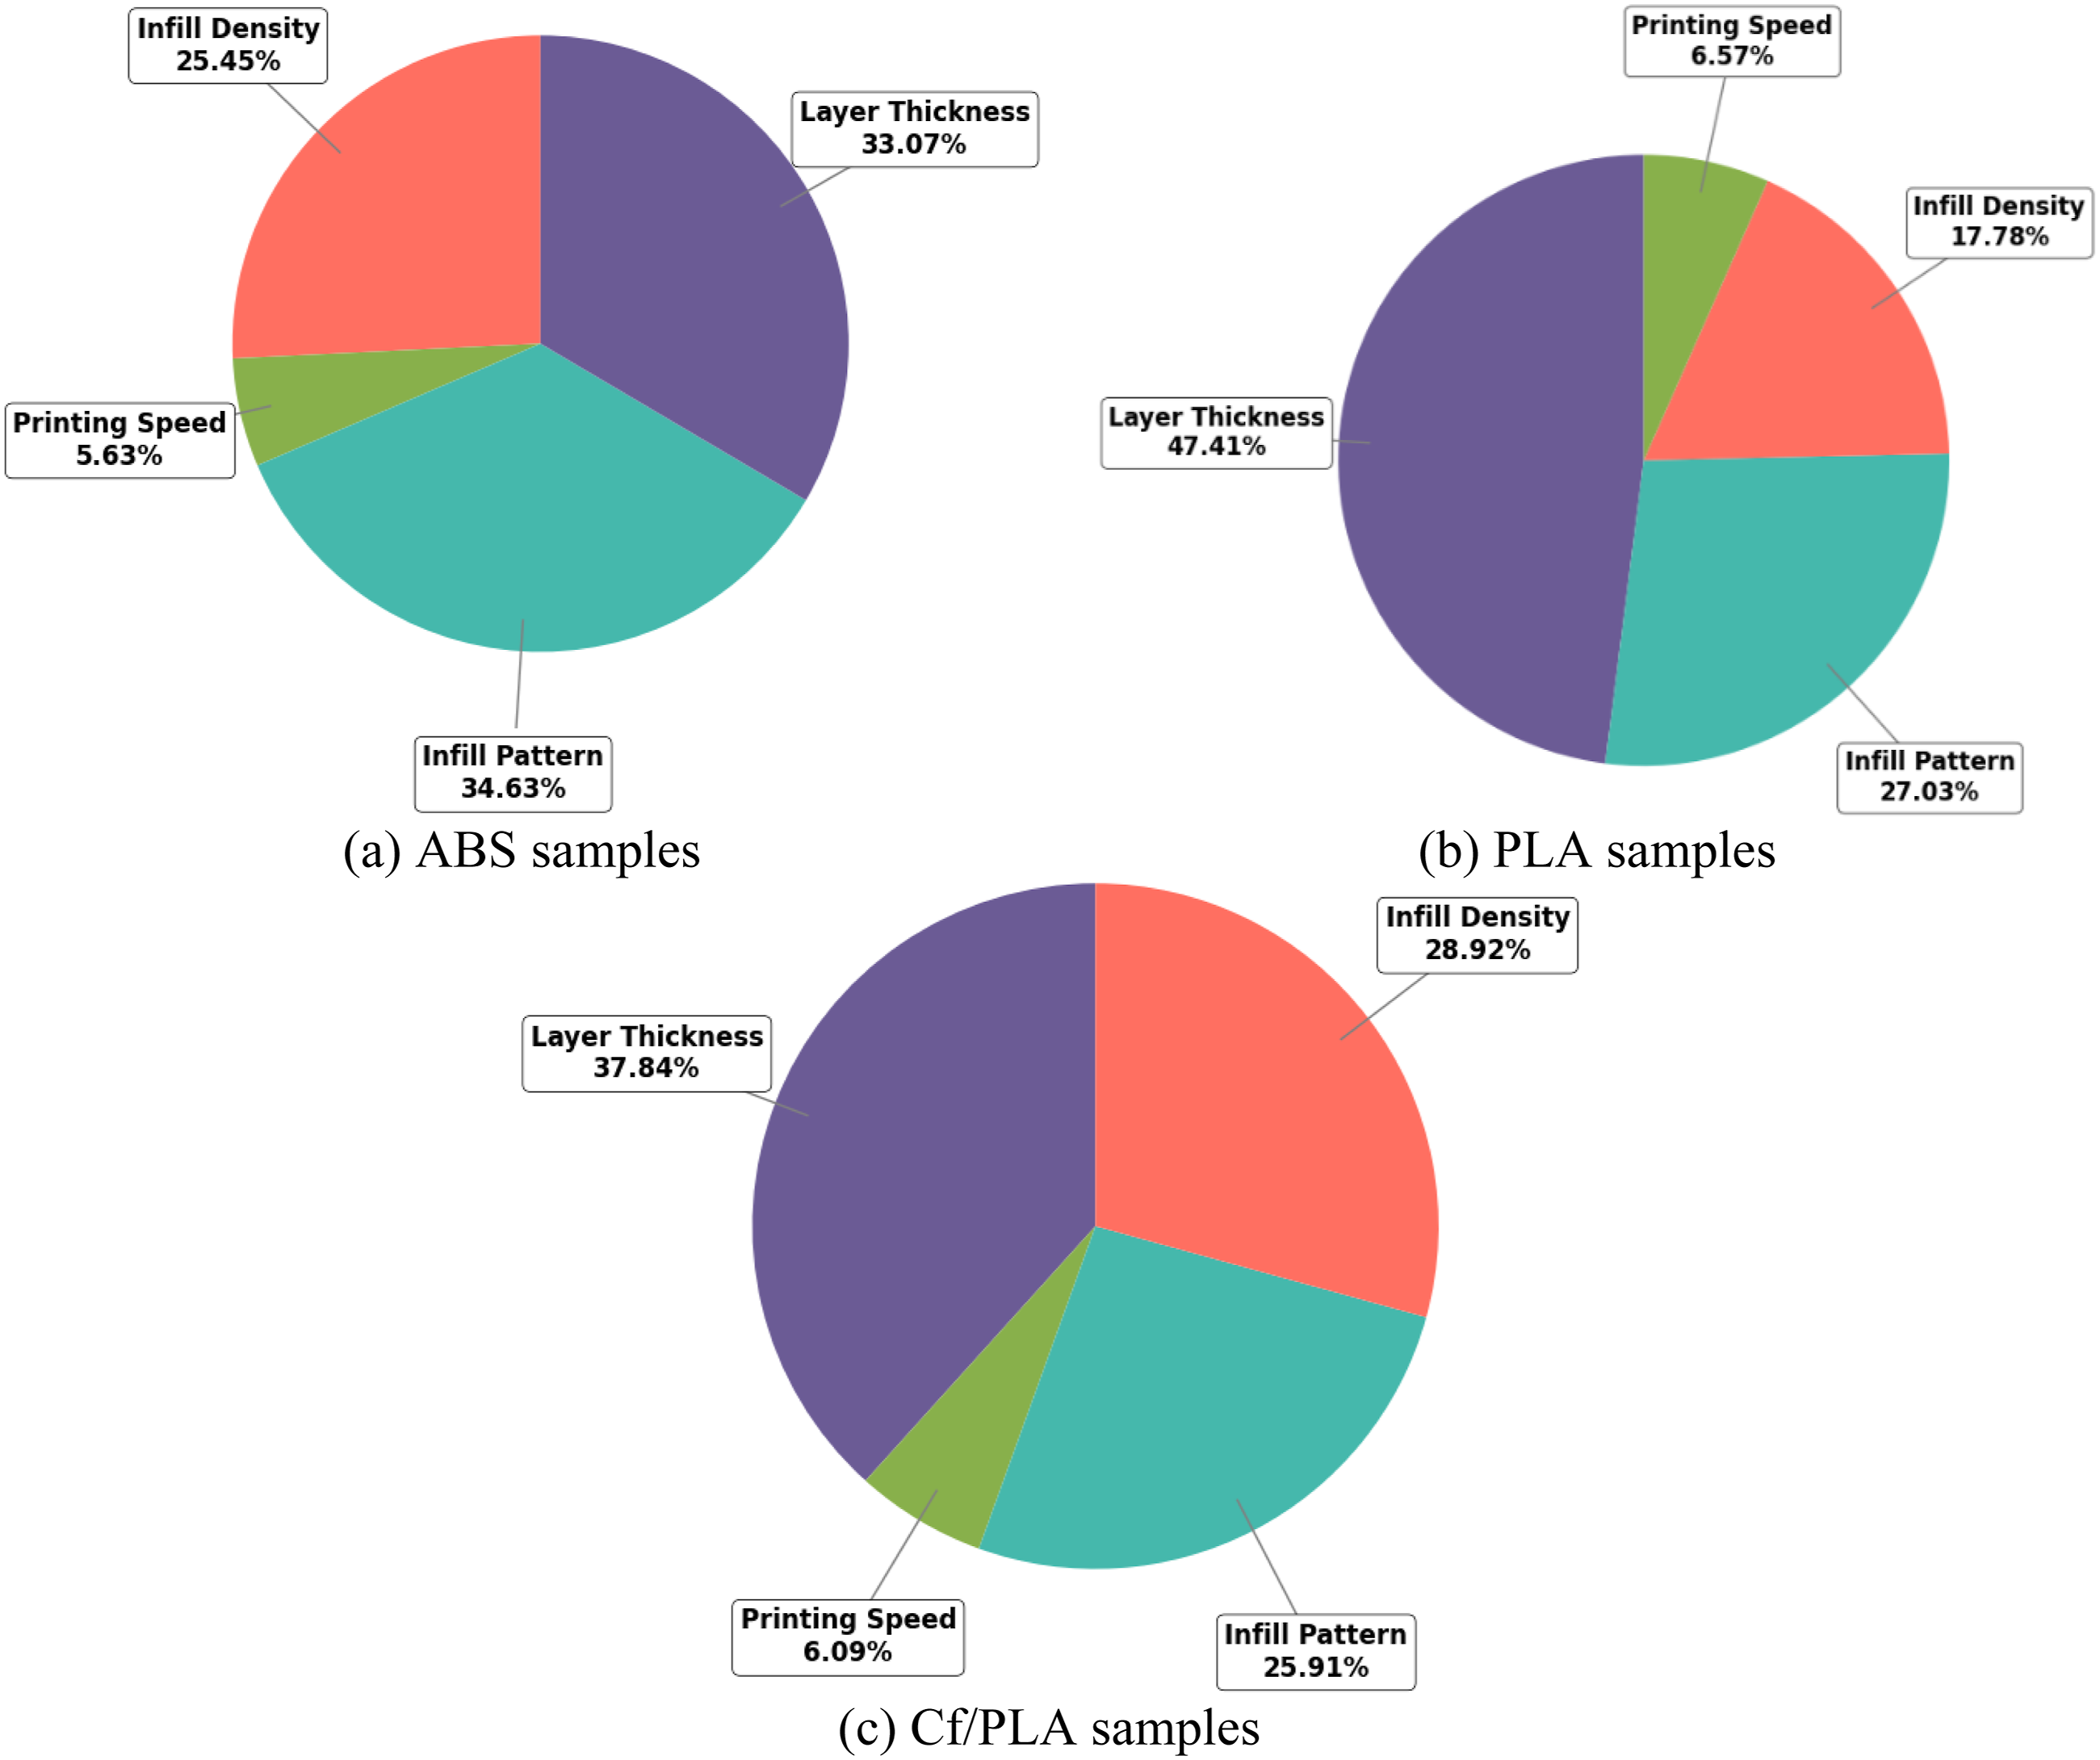
An ANOVA was performed to evaluate the statistical significance and contribution of each process parameter to the energy consumption of the FDM process. The contribution percentages were calculated based on the Adj SS values, and the results are visualized in Figure 9 for ABS, PLA, and Cf/PLA materials. For ABS samples, the most influential parameter on energy consumption was PS, contributing 44.72% of the total variation. This outcome aligns with expectations, as lower speeds increase build time and energy usage. LT was the second most significant factor with 27.18%, indicating that thinner layers require more passes and hence more energy. ID also played a notable role with a contribution of 21.06%, reflecting the energy increase associated with higher material deposition. IP had the lowest influence at 5.80%, though it remained statistically significant (p < .05), indicating that all four parameters have a measurable effect on energy consumption. The same trend was observed in PLA samples. PS remained the dominant factor with a contribution of 44.96%, followed by LT at 27.04% and ID at 21.03%. Despite its relatively low contribution of 5.74%, IP was again found to be statistically significant. These results underscore the critical role of time-dependent parameters—particularly speed and thickness—in determining energy efficiency during PLA printing. For Cf/PLA specimens, PS continued to be the most impactful parameter, contributing 42.68% to energy consumption variation. The LT had an even greater effect in composites (31.56%) compared to ABS and PLA, likely due to the higher thermal and mechanical demands of processing reinforced material. IP contributed 13.17%, a notable increase compared to the other materials, suggesting that internal geometry affects extrusion complexity in fiber-filled filaments. ID had the smallest contribution (11.34%), yet still statistically significant, reaffirming the comprehensive influence of all evaluated parameters. The ANOVA results for energy consumption confirm that PS is the most critical factor across all materials, followed by LT. Although ID and IP had lower contributions, all four parameters were statistically significant (p < .05) based on ANOVA results. Contribution of printing parameters to the energy consumption of test samples.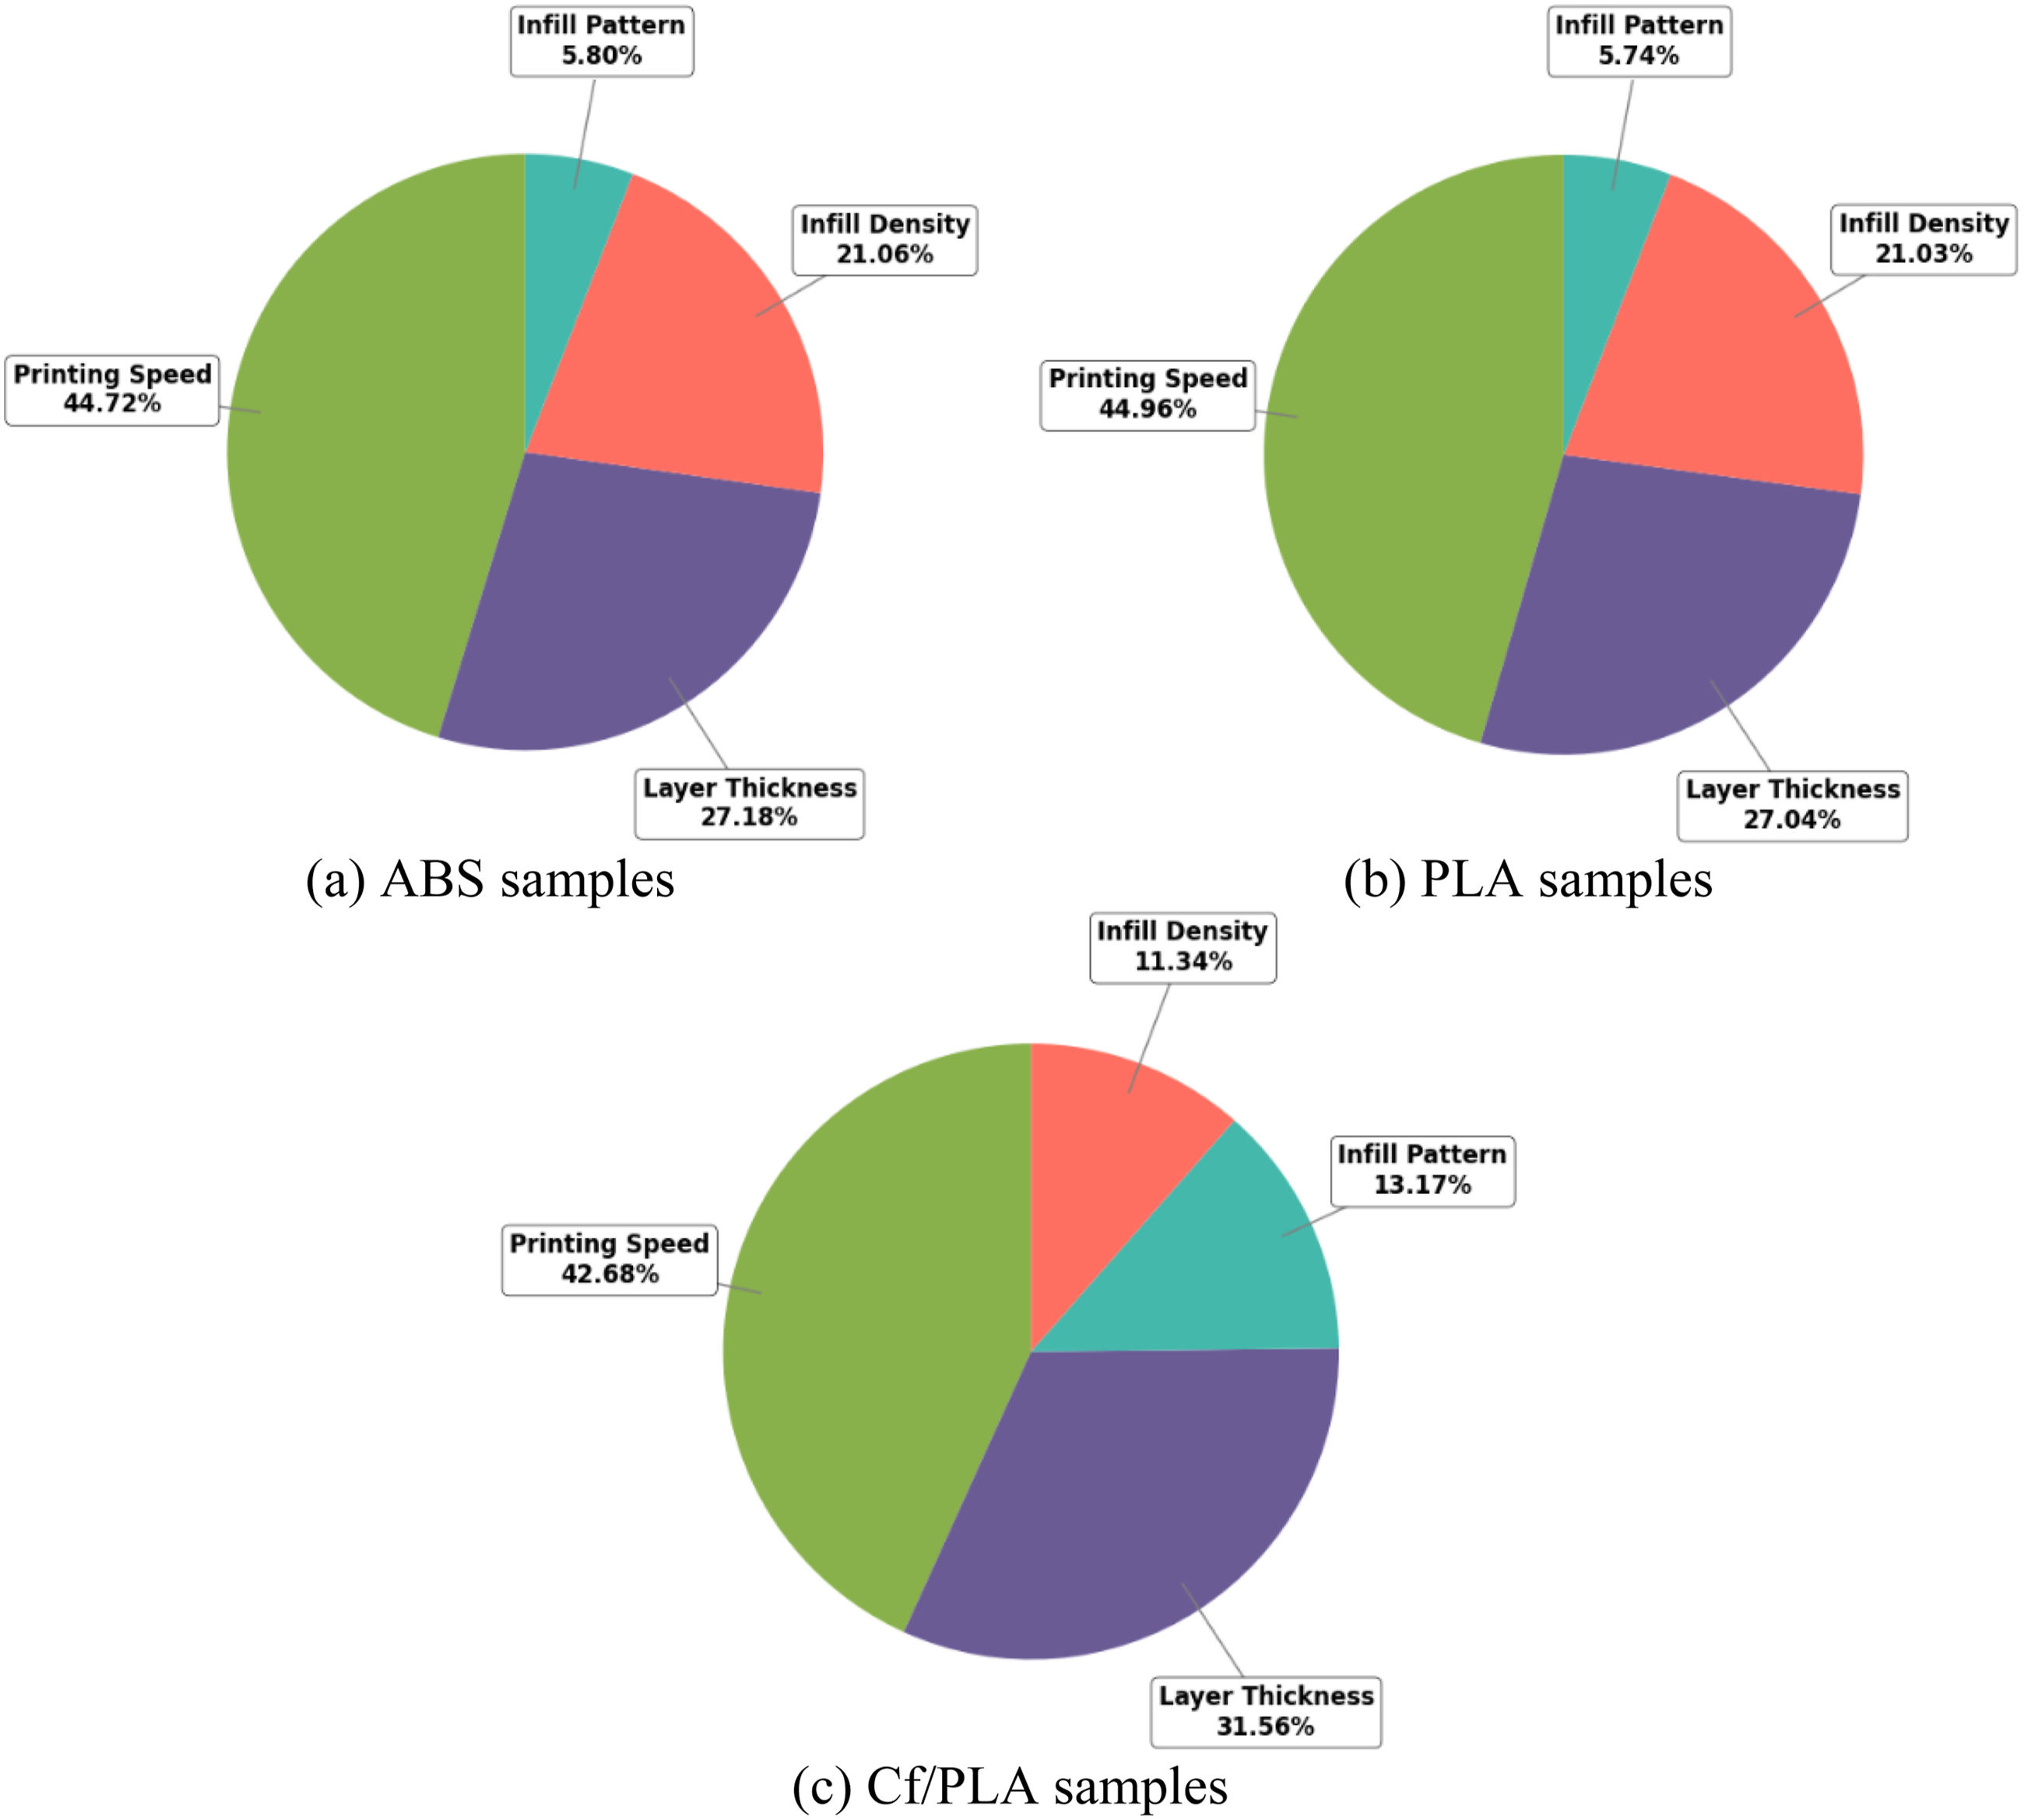
The environmental impact of the FDM process was evaluated by conducting an ANOVA to determine the contribution of each printing parameter to the CO2-eq of the test samples. The percentage contributions were derived from the Adj SS values, and the results are illustrated in Figure 10 for ABS, PLA, and Cf/PLA materials. The analysis was performed using emission data calculated based on both material mass and energy consumption, ensuring a comprehensive environmental assessment. For ABS specimens, the dominant contributor to carbon emissions was ID, accounting for a substantial 63.64% of the total variation. This is expected, as higher infill percentages result in increased material usage, which directly correlates with higher CO2-eq values. PS contributed 20.11%, indicating that longer printing durations significantly increase emissions. LT had a moderate effect at 9.59%, while IP had the lowest contribution at 5.43%. Despite the variation in contribution levels, all parameters were found to be statistically significant (p < .05). In the case of PLA samples, the trend was even more pronounced. Infill density was by far the most impactful factor, contributing 69.37% to the total emission variance. This highlights the material-intensive nature of denser PLA prints, which also require more energy due to extended print times. The remaining parameters—PS (12.58%), IP (8.79%), and LT (8.04%)—had relatively smaller yet still statistically significant effects. These findings emphasize the importance of optimizing material usage when aiming to reduce the environmental footprint of PLA-based prints. For Cf/PLA composites, ID remained the most influential parameter, contributing to 60.01%. However, the effects of the other parameters were more evenly distributed compared to PLA and ABS. IP contributed 14.76%, LT contributed 13.66%, and PS accounted for 10.36% of the total variation. The ANOVA results for carbon emissions confirm that ID is the most critical factor across all three materials. However, PS, LT, and IP also contribute meaningfully to emission levels. Based on the ANOVA significance testing, all four parameters are statistically significant (p < .05) and must be considered in environmentally conscious process planning. Contribution of printing parameters to the carbon emission of test samples.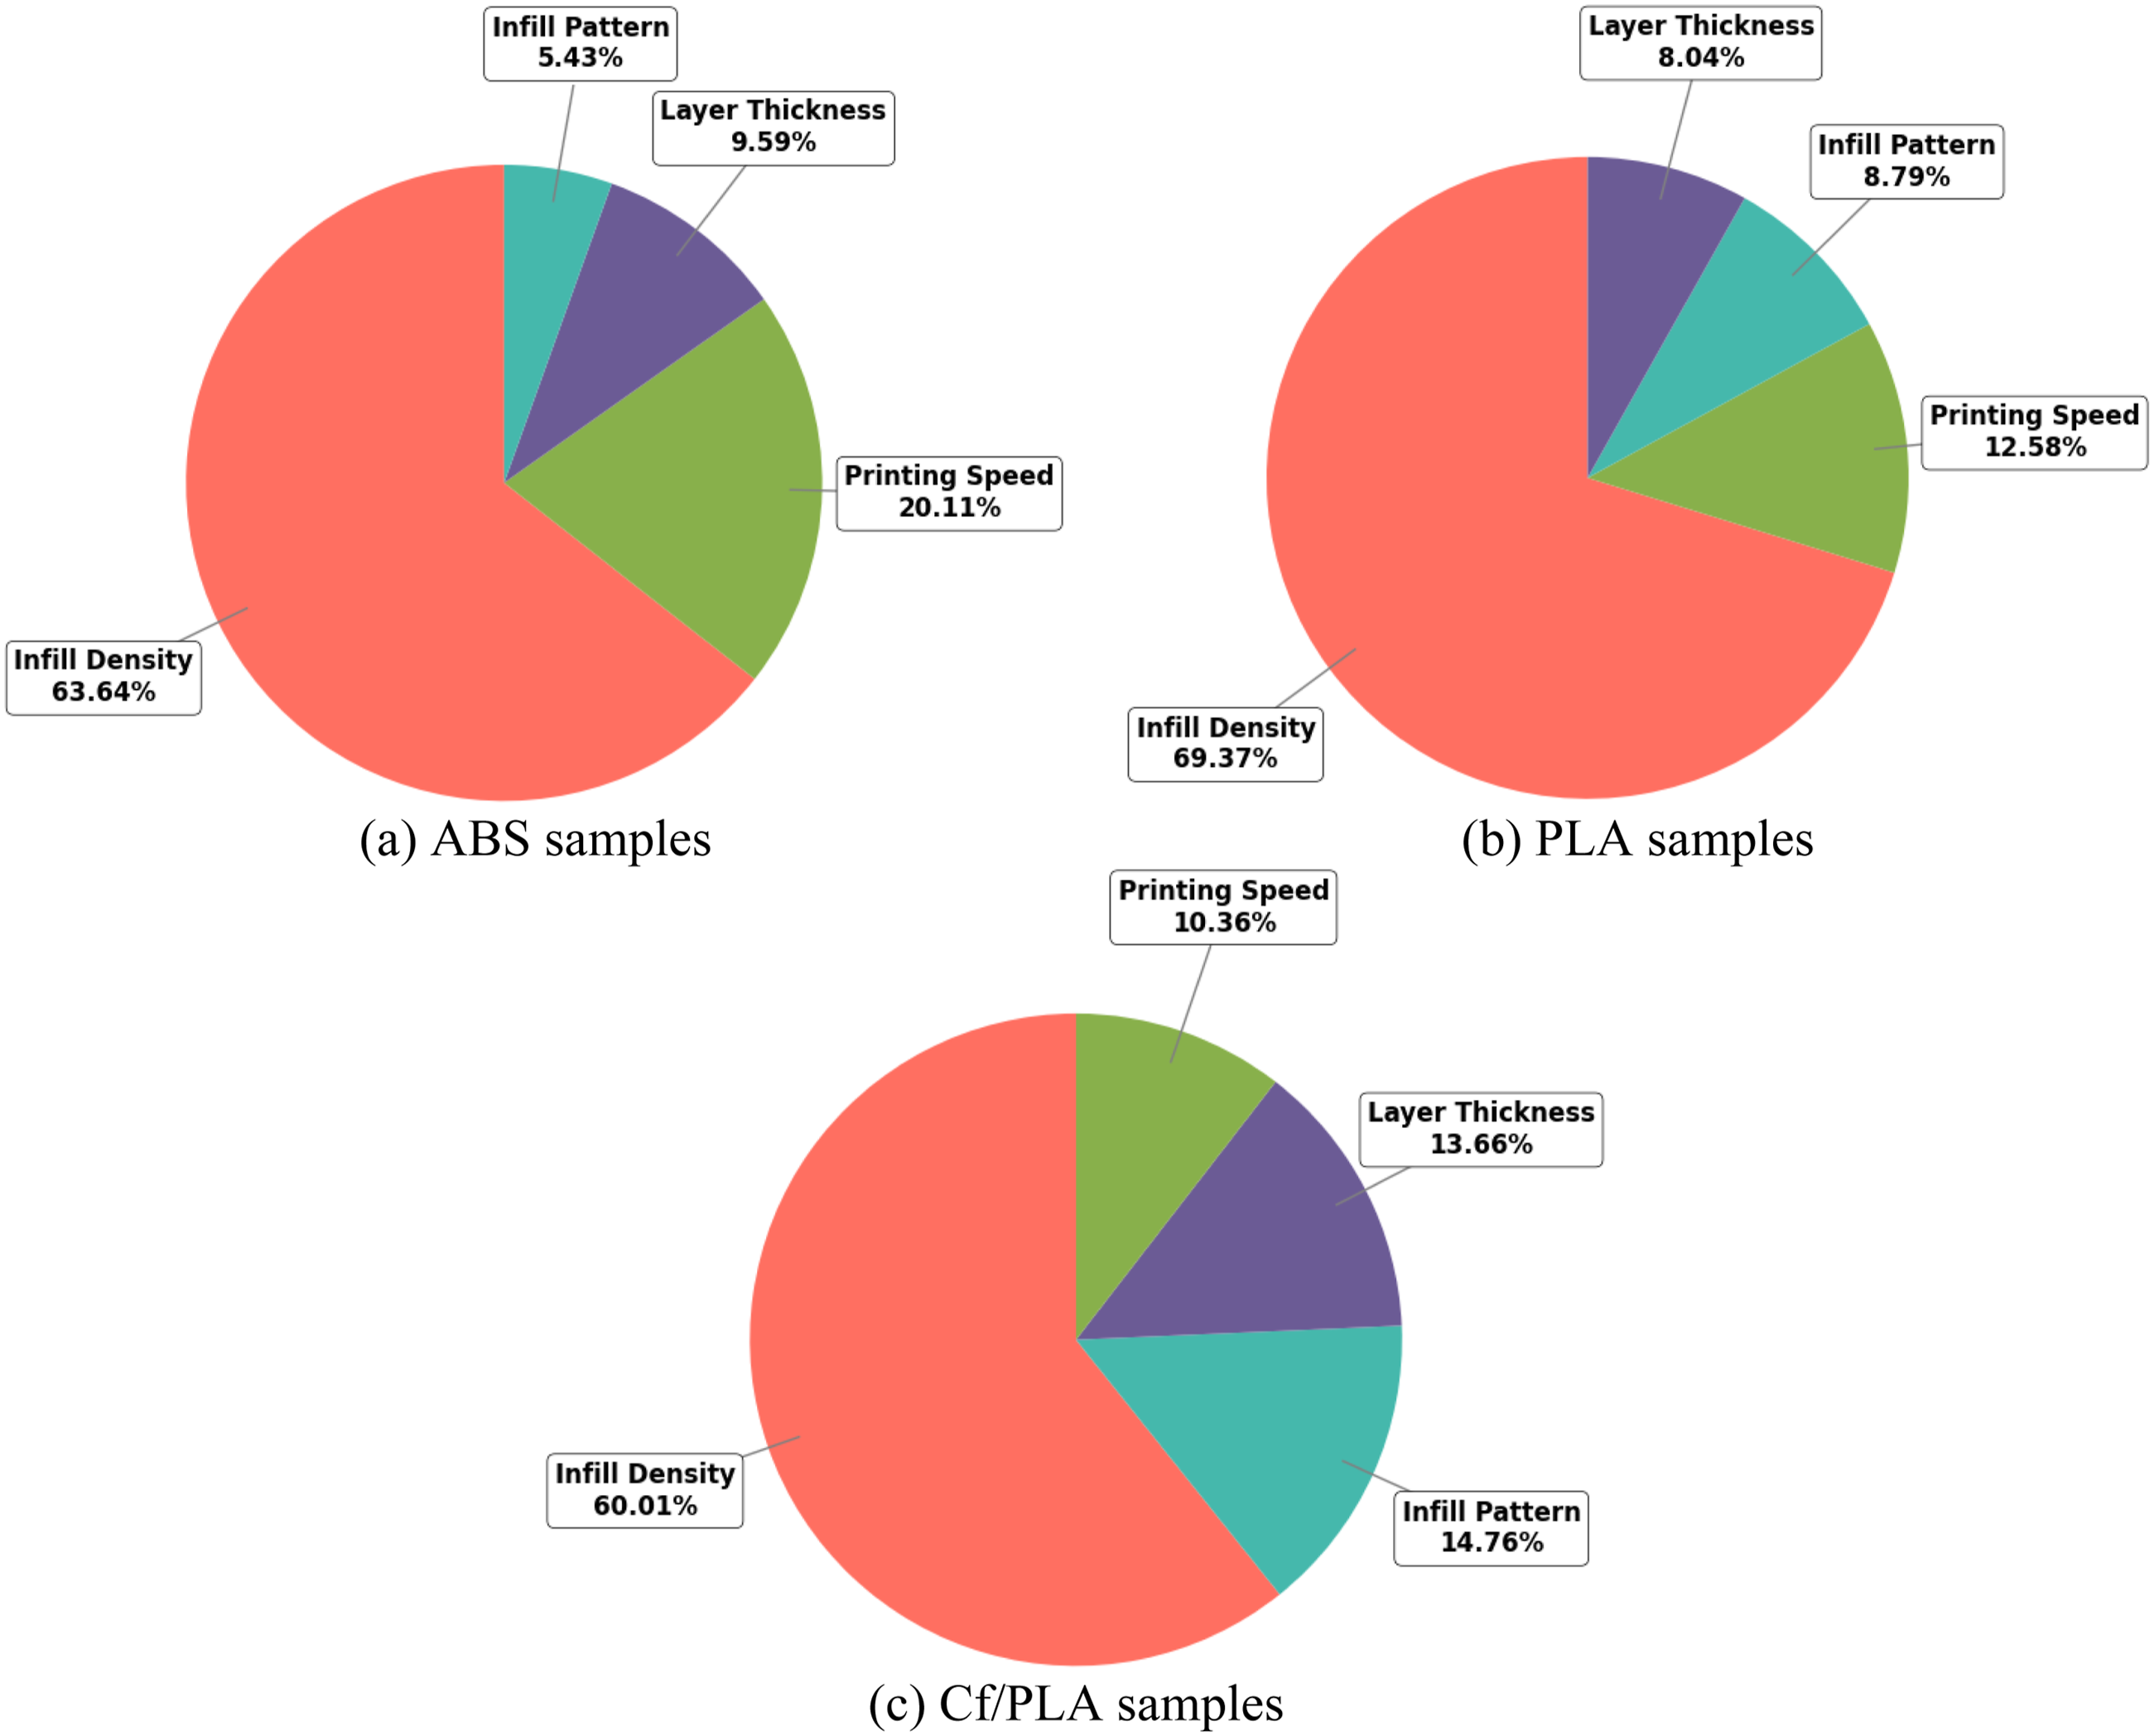
An ANOVA was also conducted to assess the influence of FDM process parameters on surface roughness (Ra), a key quality indicator for functional and aesthetic performance of 3D printed parts. The results present the percentage contribution of each parameter for ABS, PLA, and Cf/PLA materials (Figure 11). For ABS samples, LT was the most dominant factor, contributing 58.04% to the variation in surface roughness. This result aligns with the layer-by-layer nature of the FDM process, where thicker layers generally result in more visible layer lines and increased surface roughness. PS was the second most influential factor at 26.78%, indicating that faster printing may lead to surface artifacts due to reduced deposition accuracy. IP contributed 8.40%, while ID had the lowest impact with 4.55%. Despite its lower contribution, ID was statistically significant (p < .05), as were all other parameters. In the case of PLA samples, the trend remained similar. LT made a strong contribution of 48.01%, confirming its importance in achieving smooth surfaces. PS followed with 30.96%, reflecting the material’s sensitivity to thermal and deposition conditions. IP and ID contributed 14.79% and 5.00%, respectively. While geometric infill characteristics do affect surface quality, they are secondary to process-related parameters like layer height and speed. All parameters were statistically significant based on ANOVA (p < .05). For Cf/PLA composites, the influence of parameters was more balanced. LT remained the most important factor at 43.32%, but PS and IP also had notable effects, contributing 28.38% and 21.17%, respectively. The effect of ID was again the smallest at 5.92%, though still statistically significant. The relatively higher contribution of IP in Cf/PLA may be attributed to the distribution behavior of carbon fibers, which can impact surface texture depending on internal path geometry. The ANOVA results confirm that LT is the most critical parameter affecting surface finish across all material types. PS is also a highly influential factor, especially for PLA and Cf/PLA. While IP has a moderate effect, particularly in fiber-reinforced materials, ID consistently shows the lowest contribution. Nevertheless, based on ANOVA significance testing, all four parameters were statistically significant (p < .05), underscoring their relevance for surface quality optimization in FDM. Contribution of printing parameters to the surface roughness of test samples.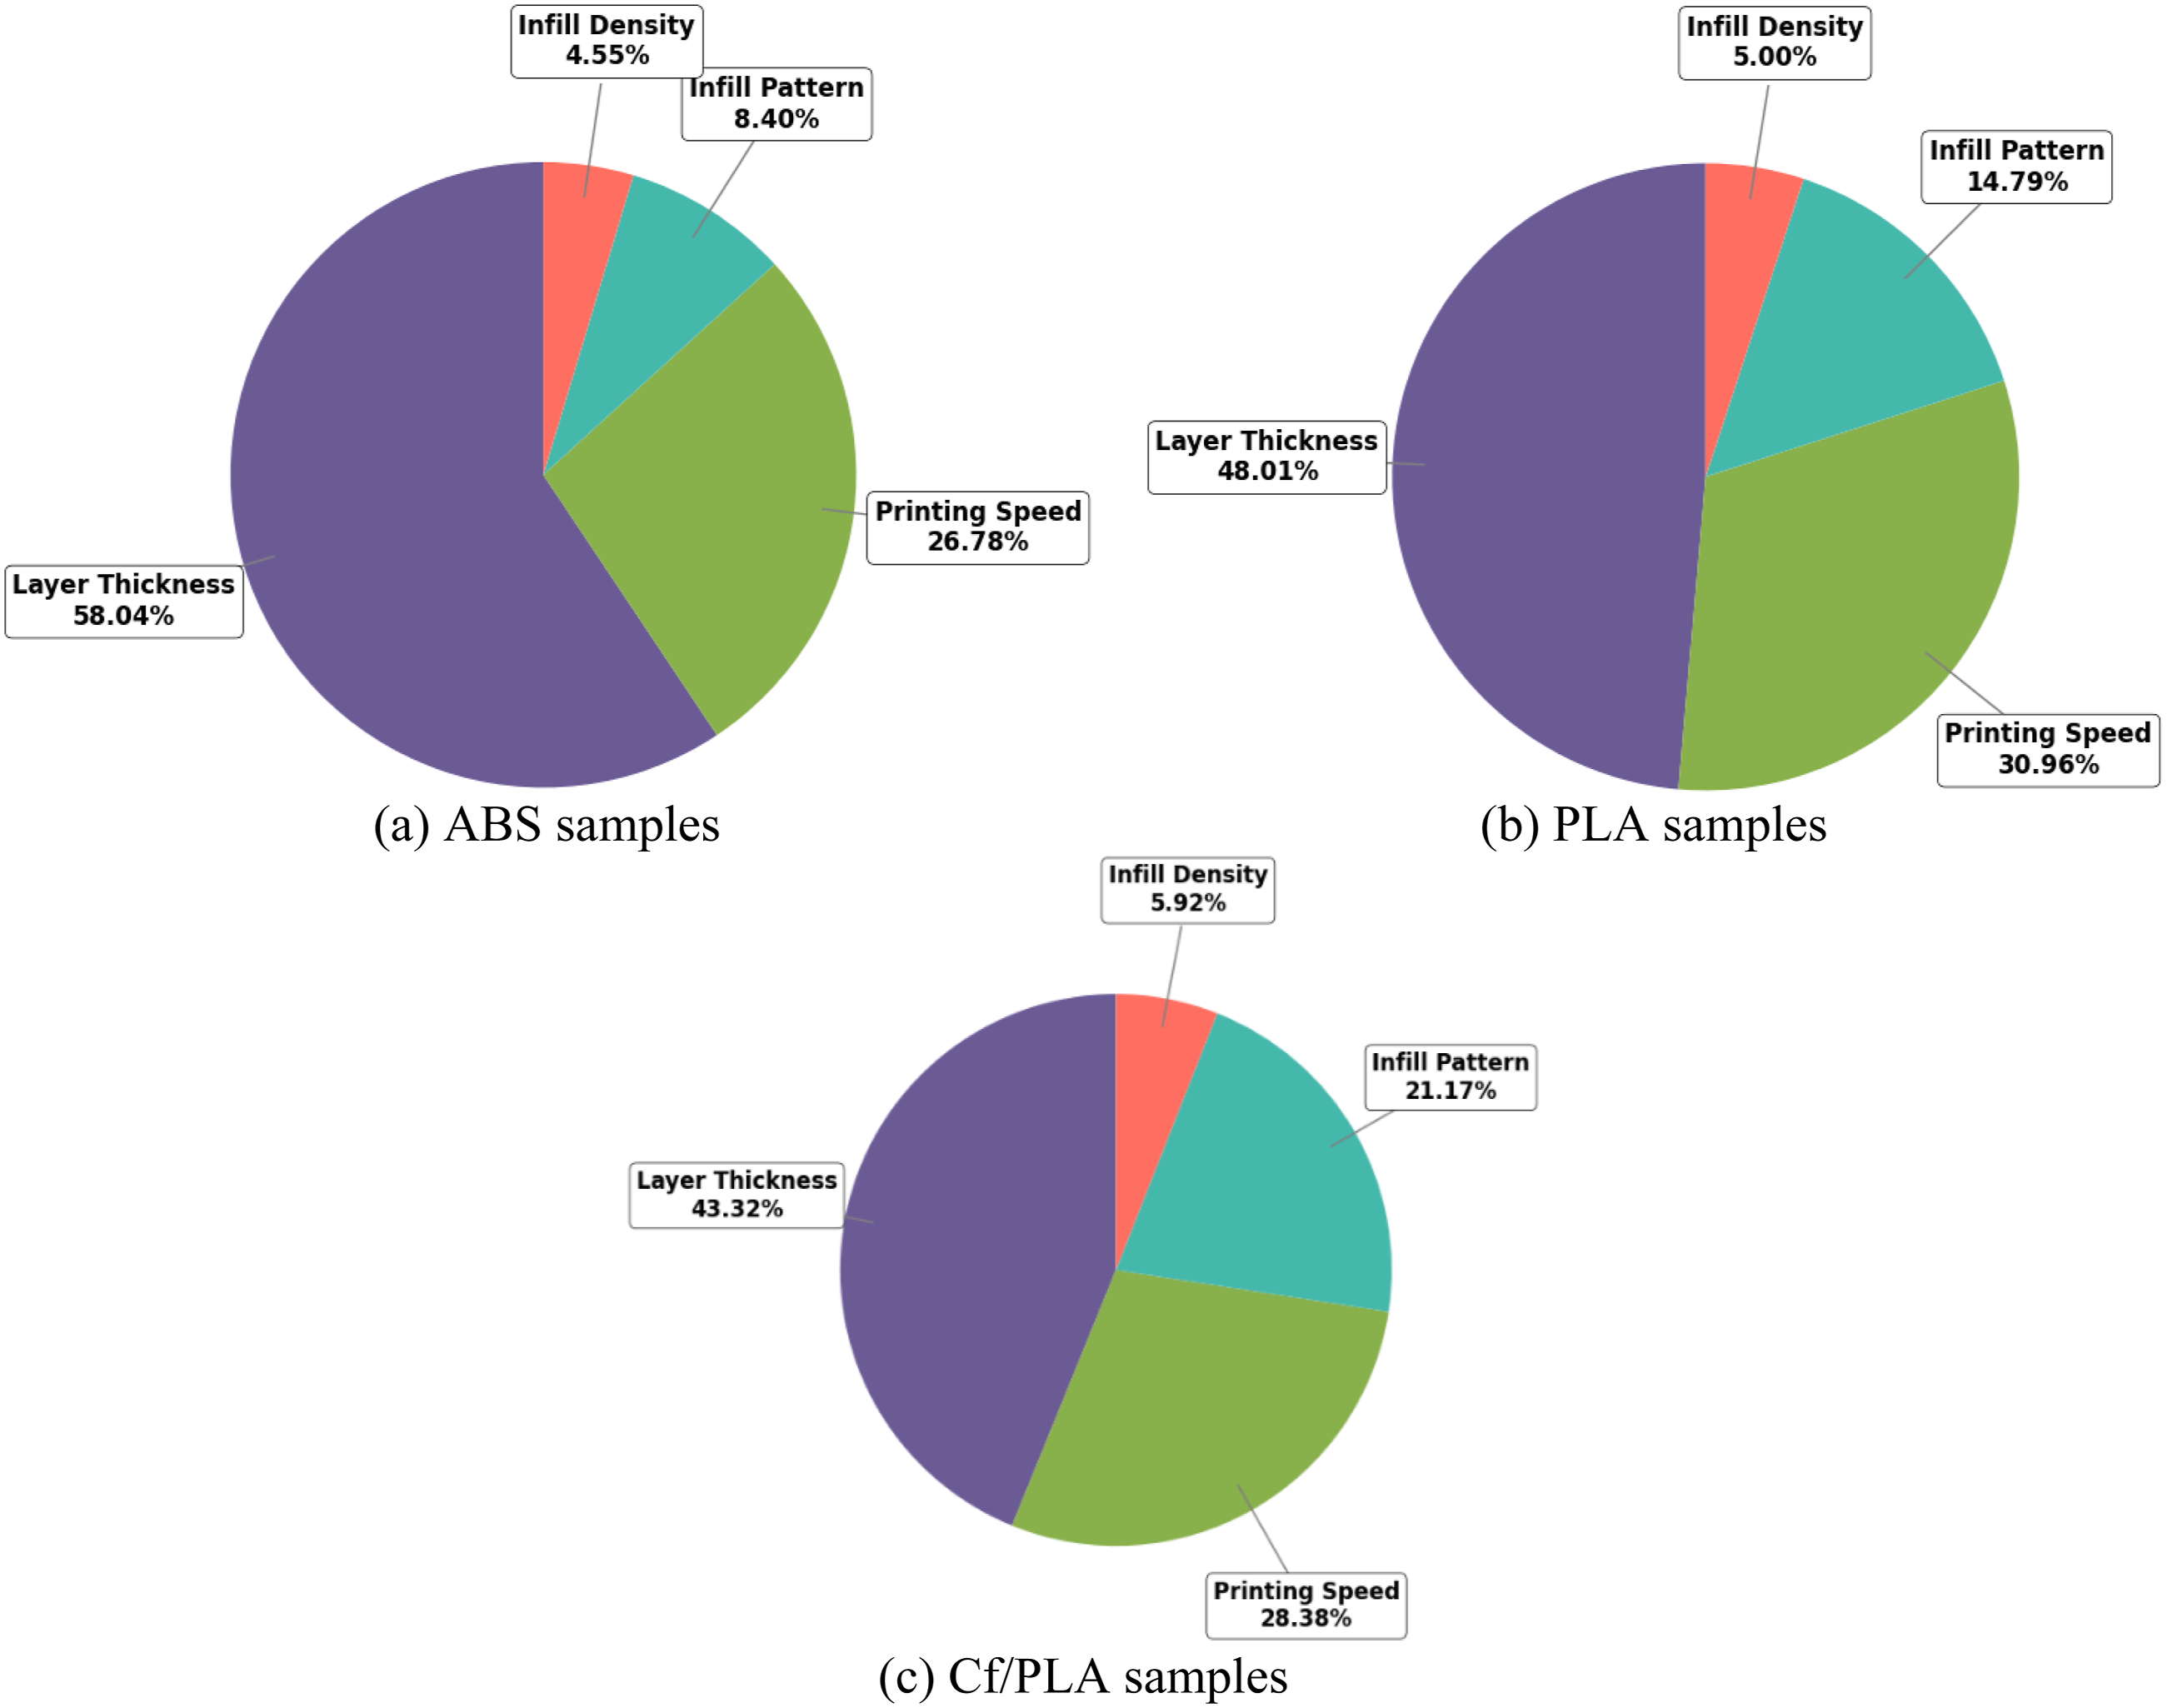
Surface Morphology Results
This study presents a mechanism-oriented analysis of the fracture surfaces of FDM-printed PLA, ABS, and Cf/PLA specimens, with the aim of correlating tensile strength values with characteristic microstructural features observed via SEM (Figure 12). The results emphasize that the mechanical performance of the printed parts is significantly governed by interlayer adhesion, porosity, and the overall quality of internal fusion. For PLA specimens, a clear correlation was observed between interlayer bonding quality and tensile strength. SEM micrographs of Sample 1 revealed pronounced voids and poor layer fusion, indicating suboptimal thermal bonding conditions, which directly contributed to the low tensile strength value of 24.48 MPa. In comparison, Sample 4, produced under improved process parameters, exhibited reduced porosity and moderately enhanced layer adhesion, resulting in a noticeable increase in strength. Sample 8 stood out with its well-aligned, smooth deposition lines and minimal visible defects, reflecting optimal thermal processing. This sample achieved the highest tensile strength among PLA parts (36.38 MPa). These findings confirm that complete layer coalescence and minimal void content significantly suppress crack initiation and enable efficient stress transfer across layers. ABS samples demonstrated a more thermally sensitive behavior, as reflected in their microstructural inconsistencies. Sample 1 revealed severe layer delamination and clearly visible surface defects, resulting in a brittle fracture and the lowest tensile strength (19.01 MPa). SEM analysis of Sample 4 showed partial fusion and moderate misalignment between layers, corresponding to a mid-range tensile strength. In contrast, Sample 8 displayed a uniform layer structure and improved interlayer cohesion, which translated into a significantly enhanced tensile response (31.20 MPa). These observations highlight that insufficient thermal bonding and cooling-induced warping are the dominant failure mechanisms in ABS, and enhanced thermal management is crucial to improving its mechanical performance. For Cf/PLA composites, the effectiveness of reinforcement was shown to be highly dependent on the fiber–matrix interface and fiber dispersion quality. Sample 1 exhibited matrix cracks and evidence of fiber pull-out, indicating poor interfacial adhesion, which limited its strength to 32.97 MPa. Sample 4 presented visible voids and weak interfacial bonding, which hindered uniform stress distribution. Although Sample 8 showed improved morphological characteristics, SEM images still revealed fiber agglomeration and residual porosity, which acted as stress concentrators despite achieving the highest tensile strength among the composites (53.03 MPa). These results demonstrate that the inclusion of carbon fibers does not inherently guarantee superior mechanical properties unless supported by strong matrix adhesion and homogeneous fiber dispersion. SEM analysis confirmed that optimized FDM parameters, which promote continuous fusion lines and minimize internal defects, are essential for achieving higher tensile strength. The absence of such conditions leads to mechanical degradation, regardless of the material type. In fiber-reinforced systems, the synergy between the reinforcement phase and the polymer matrix is particularly critical. Weak interfacial bonding or uneven fiber distribution can negate the potential mechanical advantages of fiber addition. These insights provide valuable guidelines for tuning FDM parameters to produce structurally sound and mechanically robust printed components. SEM images of worn surfaces at 50X magnification SEM micrographs of FDM-fabricated samples at 50X magnification under different printing parameters: (a–c) PLA samples, (d–f) ABS samples, (g–i) Cf/PLA samples. Each sub-image corresponds to distinct process parameters selected to demonstrate morphological variations. Microstructural differences such as layer bonding, void formation, and raster uniformity are indicated with red annotations.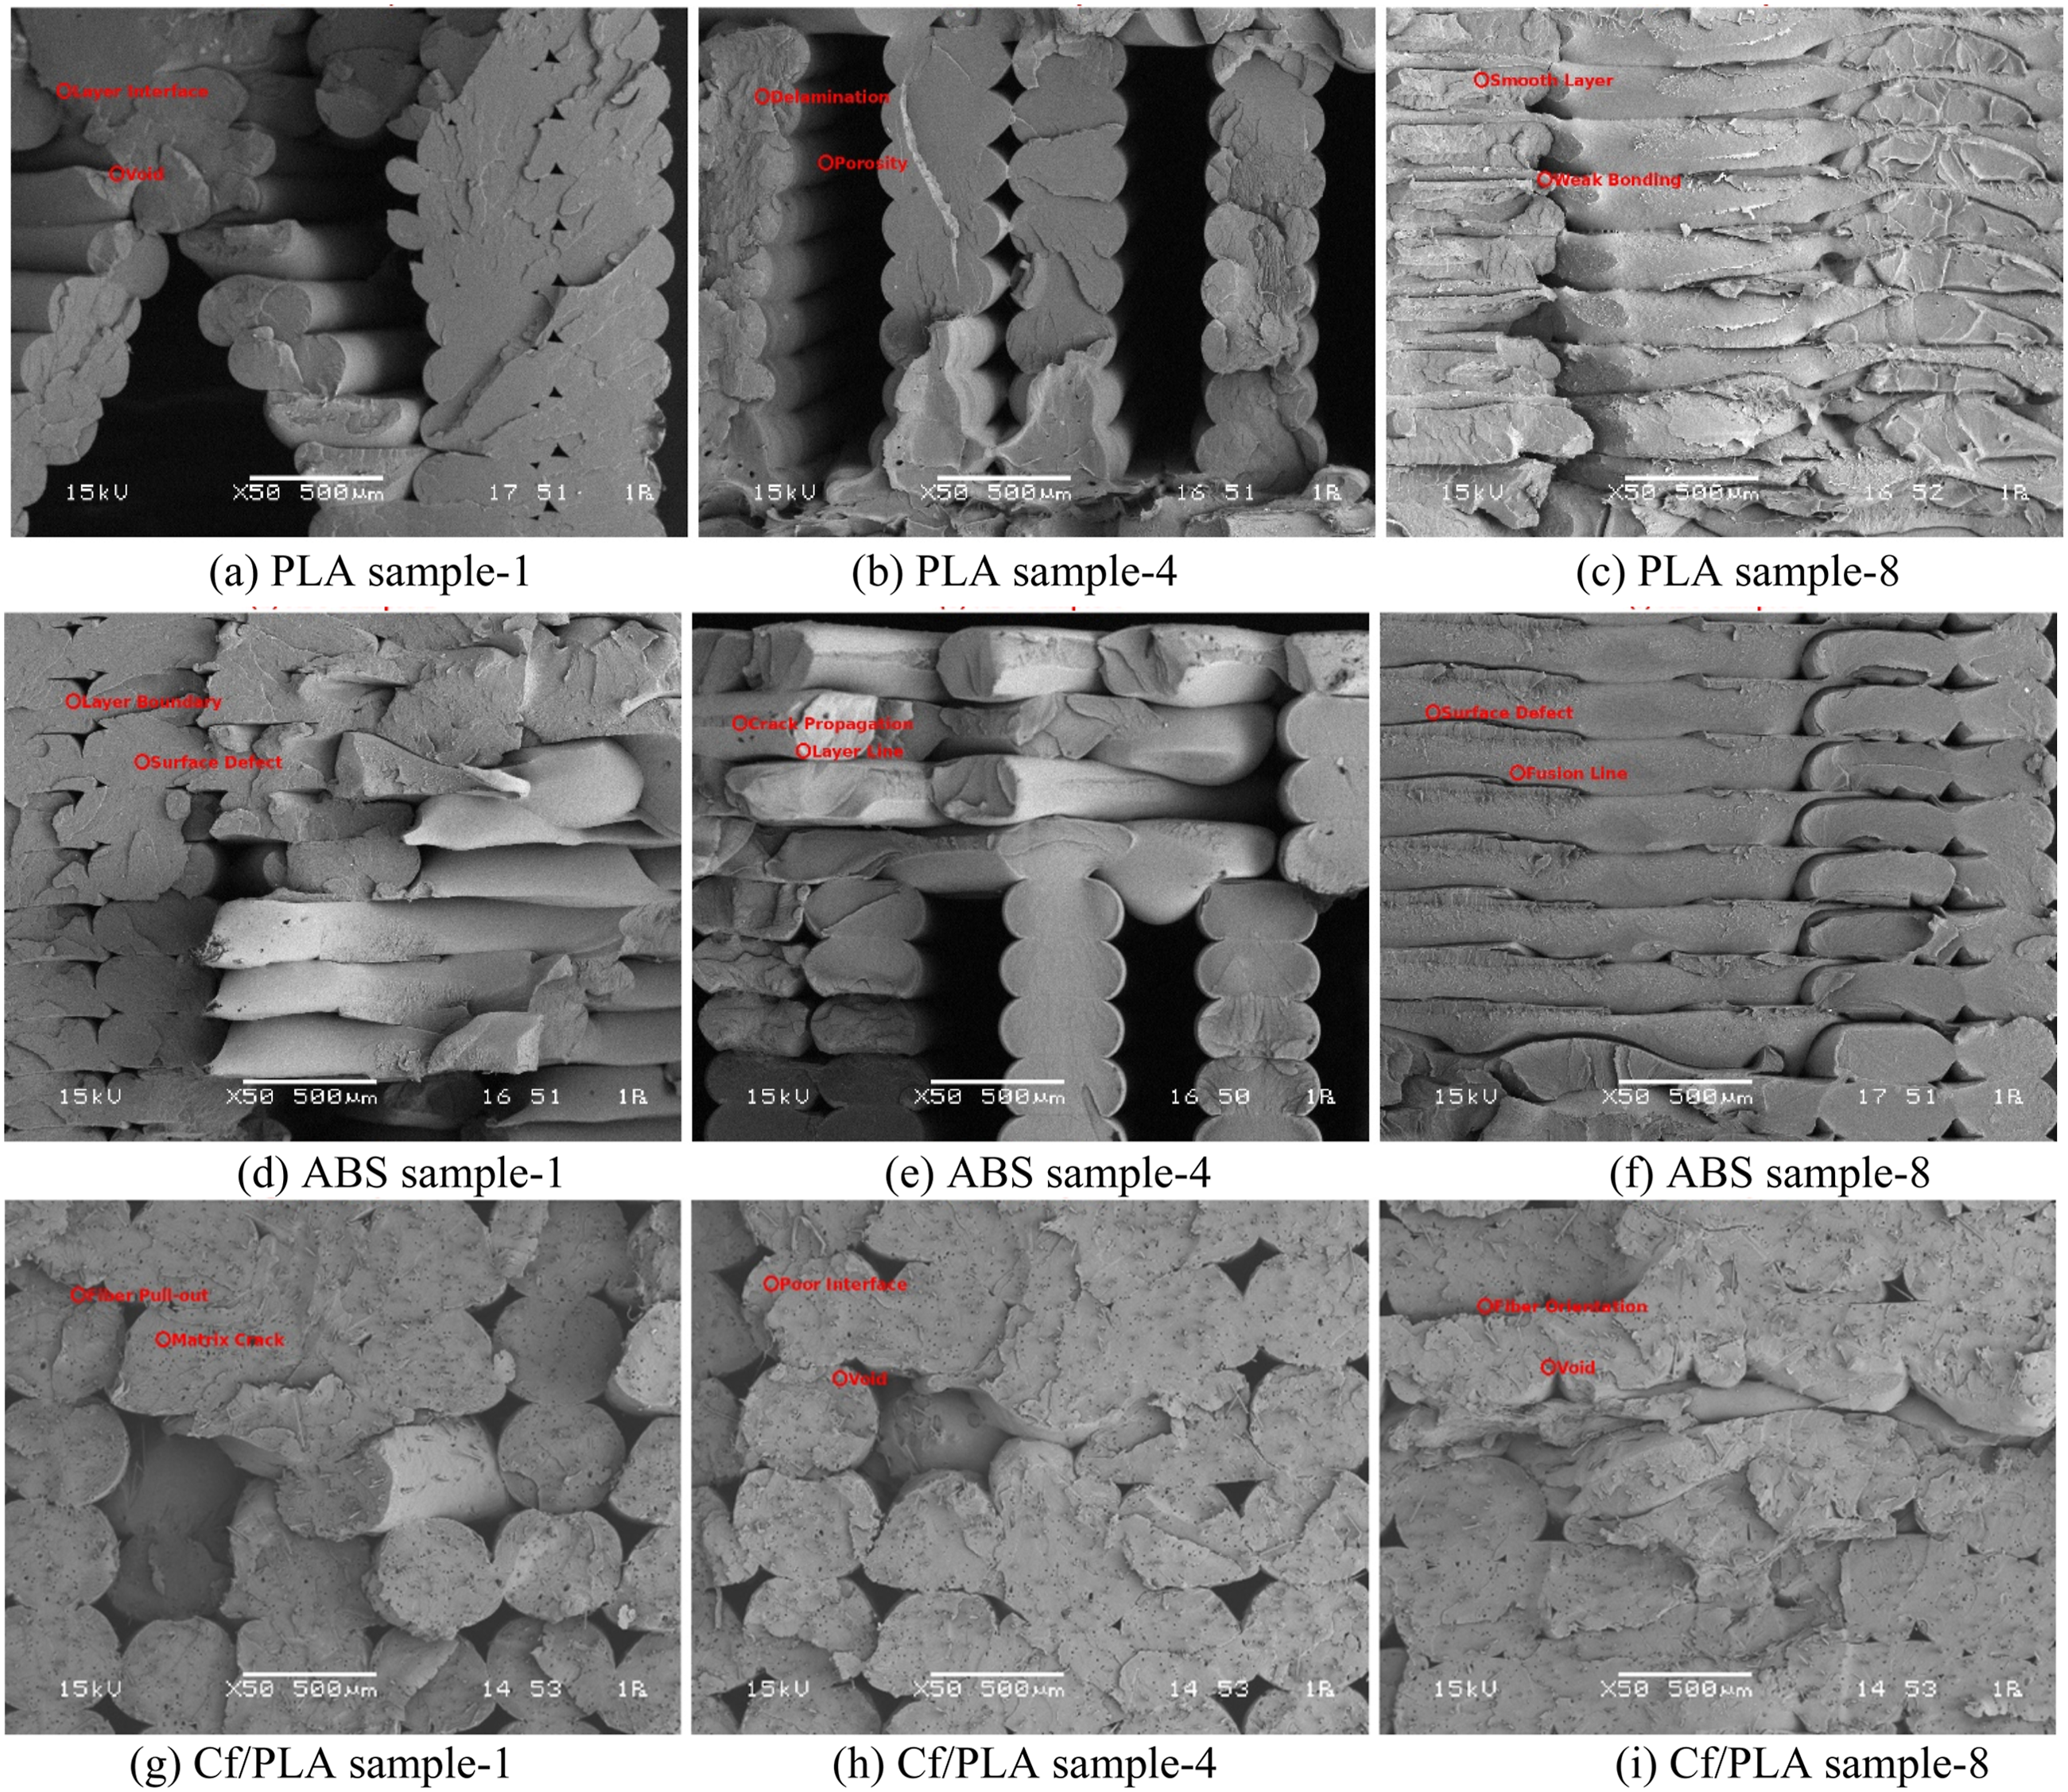
Artificial Neural Network Results
In this study, an ANN was developed to predict key performance outcomes of the FDM process based on four major input parameters: ID, LT, PS, and IP. The goal was to accurately estimate the resulting tensile strength, energy consumption, carbon emissions, and surface roughness of printed parts using a data-driven approach. The model was trained and validated using experimental data, and its predictive capability was evaluated by comparing the predicted outputs with actual experimental measurements. The results are presented in Figure 13, which shows regression plots for each target variable. The ANN demonstrated exceptionally high predictive performance across all four outputs, with R2 ranging from 0.9951 to 0.9976. For tensile strength, the model achieved an R2 of 0.9959, indicating strong agreement between predicted and actual mechanical performance (Figure 13(a)). The network successfully captured the nonlinear relationships between process parameters and interlayer bonding, which directly influence the strength of FDM-printed components. Regarding energy consumption, the model yielded an R2 value of 0.9951 (Figure 13(b)), accurately reflecting the influence of geometrical and time-dependent process factors such as PS and LT. Since energy usage is closely related to building time and material volume, the ANN effectively modeled these dependencies and provided reliable predictions. In the case of carbon emissions, the ANN achieved the highest accuracy, with an R2 of 0.9976 (Figure 13(c)). This strong performance is attributed to the model’s ability to integrate both material consumption and energy usage, which are key contributors to environmental impact. The dominant role of ID in emission levels was effectively captured by the neural network. Finally, for surface roughness, the model produced an R2 value of 0.9972 (Figure 13(d)), demonstrating excellent agreement between predicted and actual surface quality. The model successfully captured the influence of LT, PS, and infill geometry on surface morphology, which are critical for applications requiring dimensional precision and smooth finishes. The ANN proved to be a highly effective predictive tool for evaluating multiple performance aspects of FDM-printed parts. The consistently high R2 values across all outputs confirm the model’s robustness and generalizability. Artificial neural network results for experimental measurements of test samples.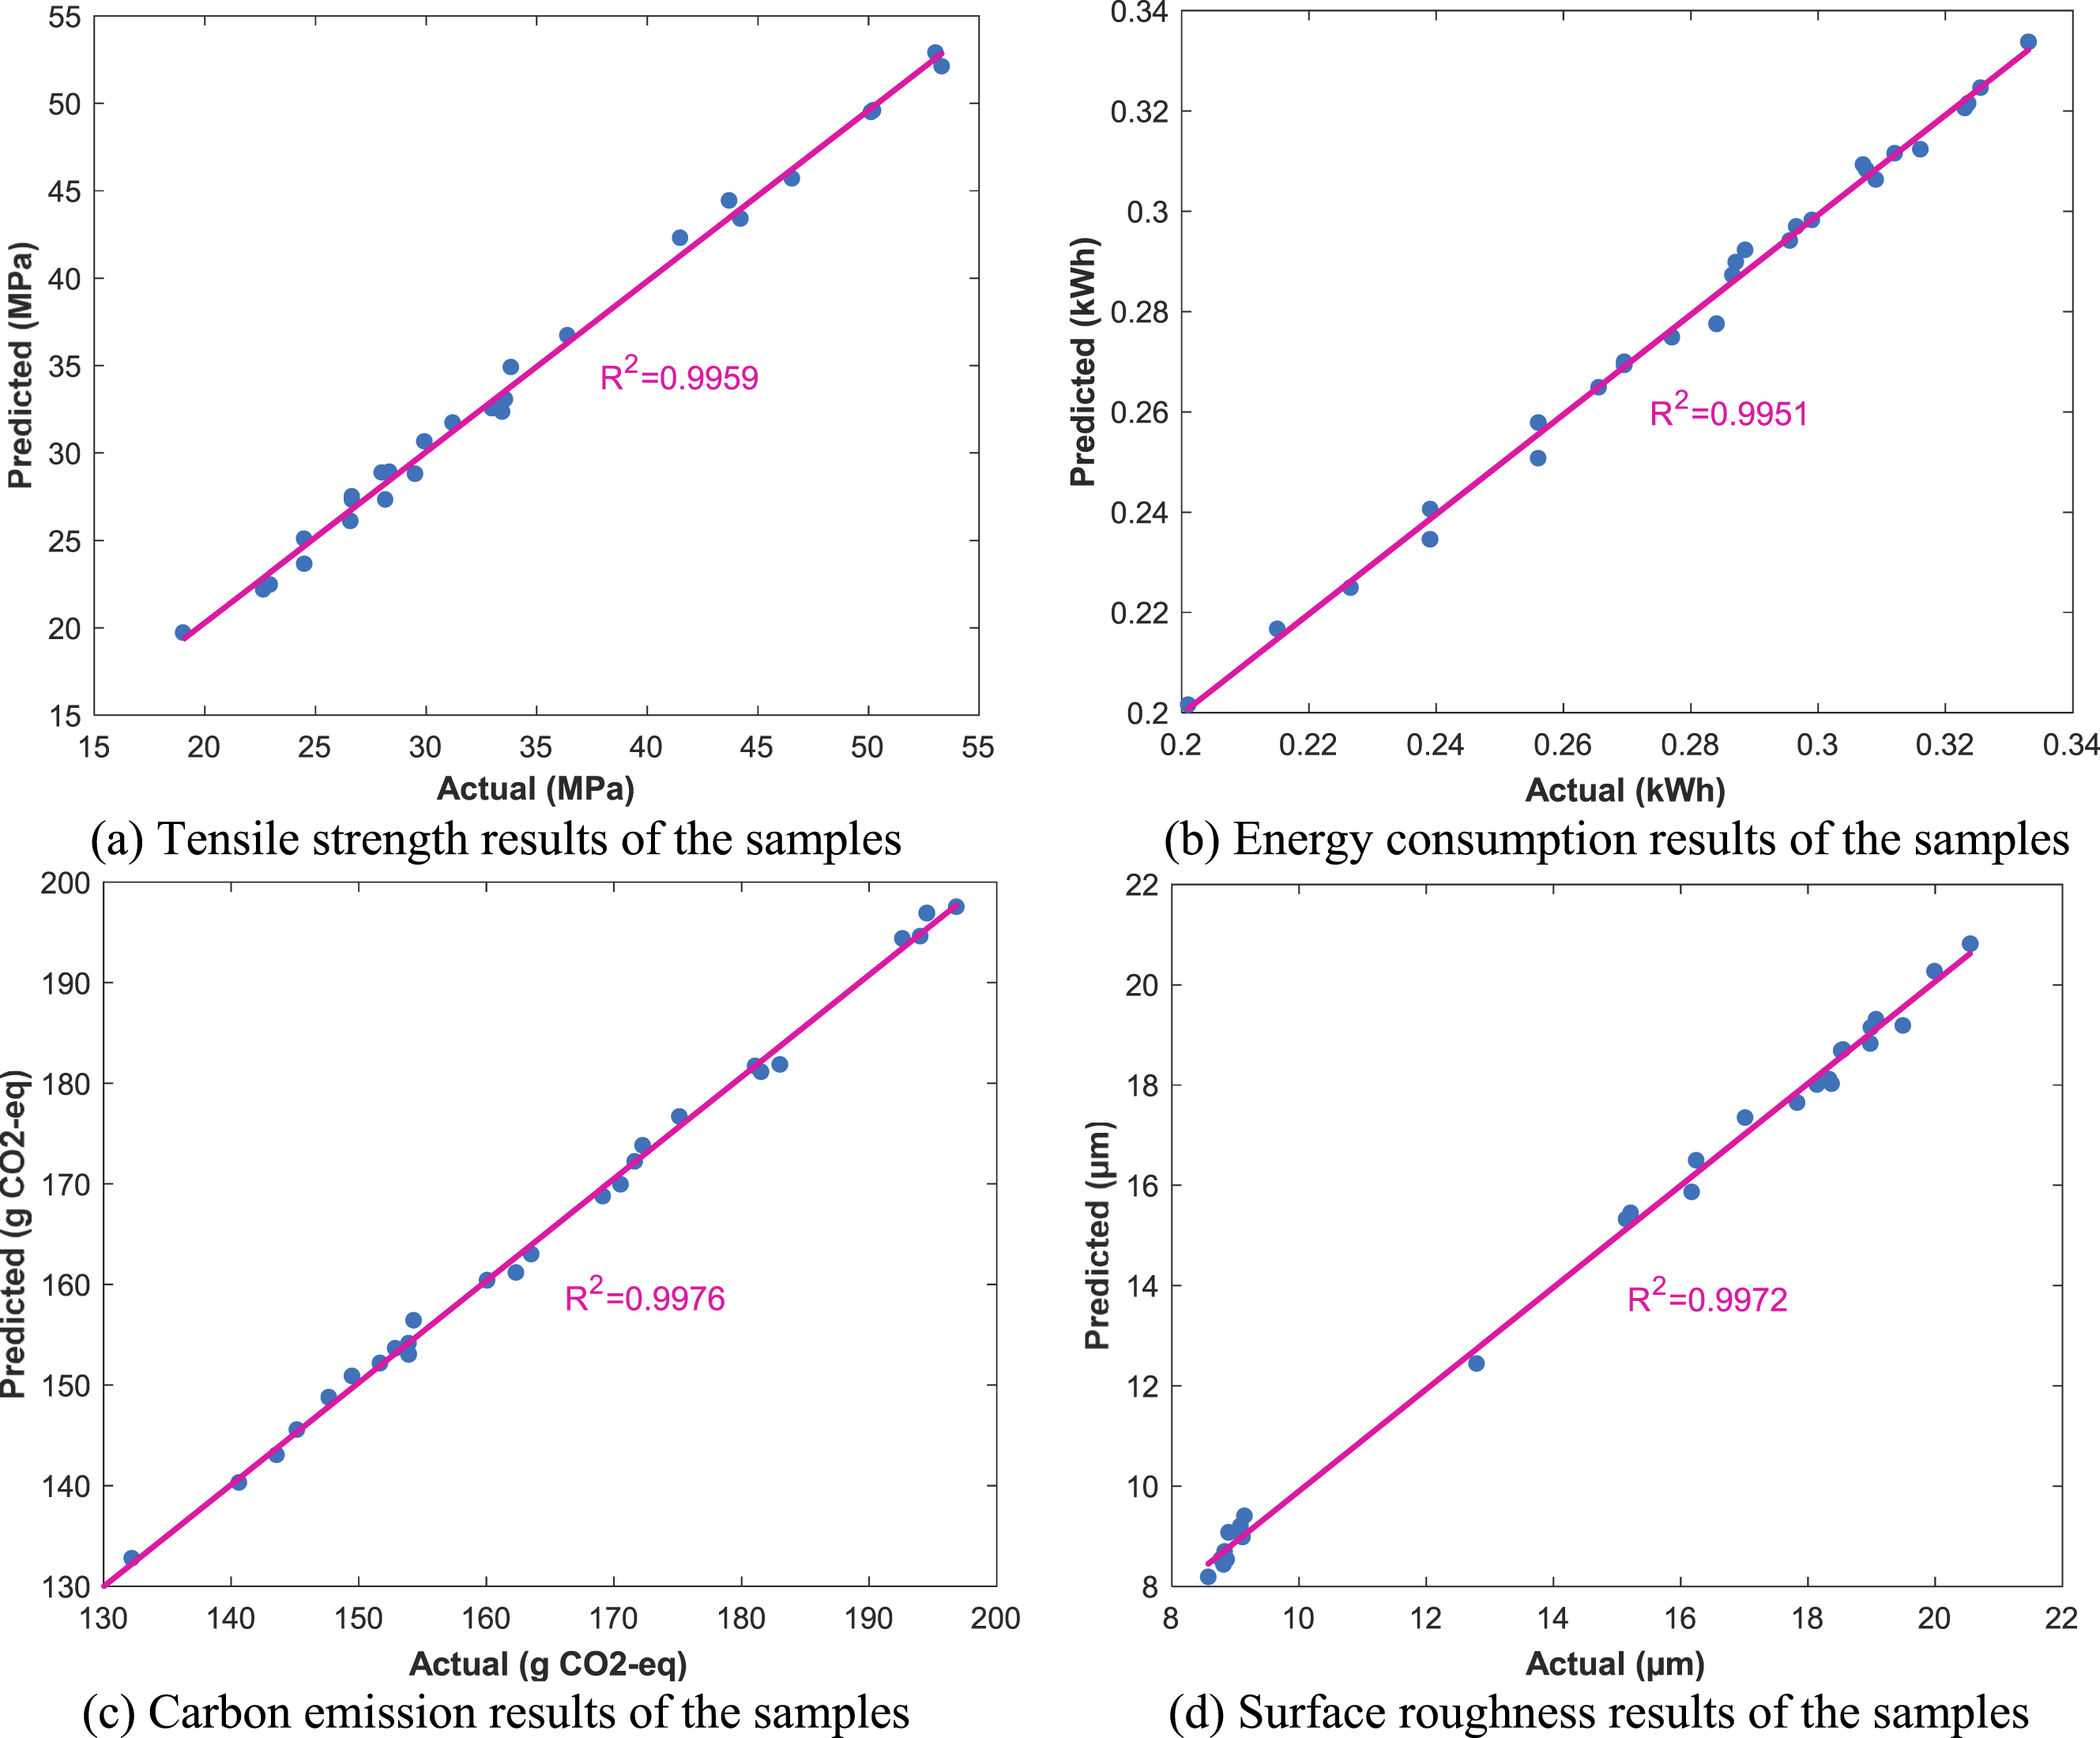
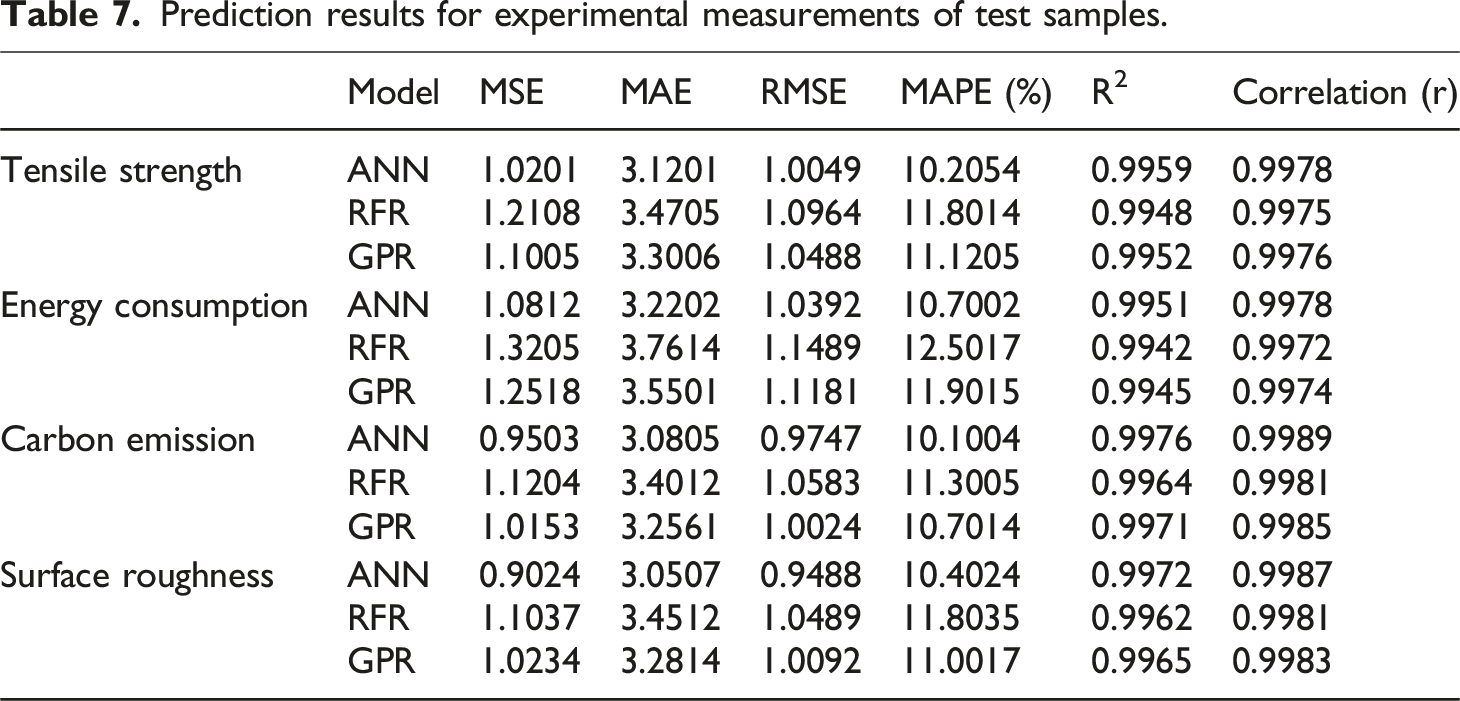
Prediction results for experimental measurements of test samples.
Validation Test Results
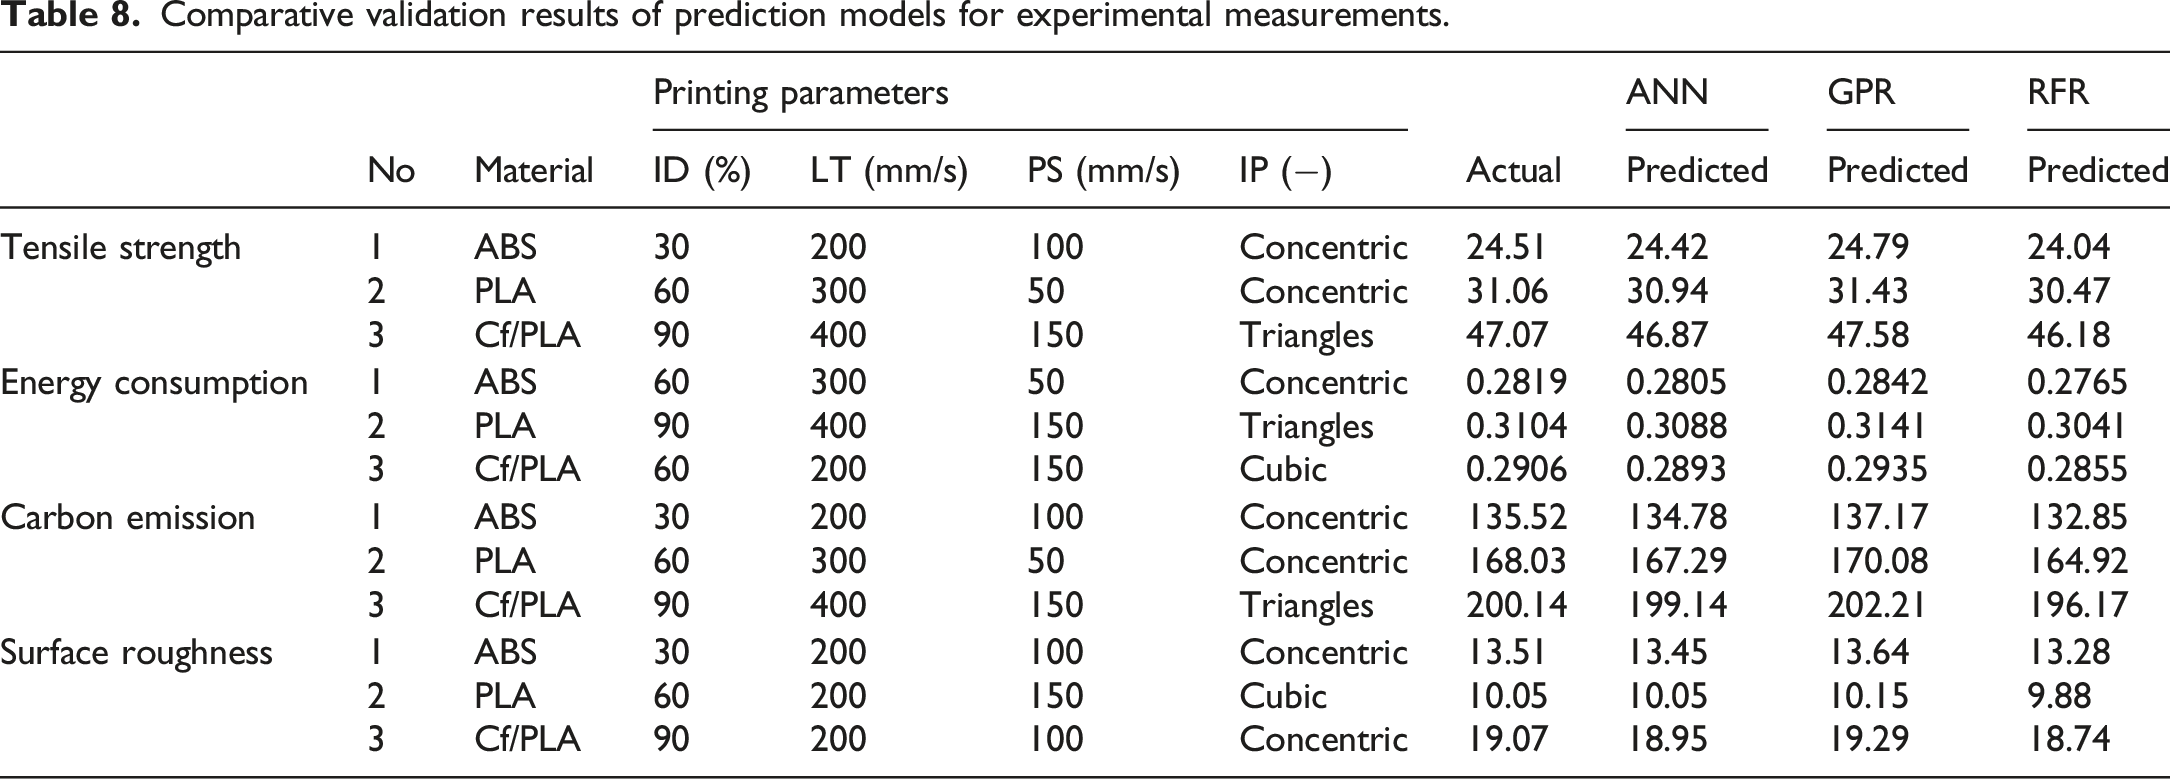
Comparative validation results of prediction models for experimental measurements.
Conclusions
In this study, the effects of major FDM process parameters—ID, LT, PS and IP—on the mechanical, surface, energy, and environmental performance of 3D-printed parts were systematically analyzed using a Taguchi L9 orthogonal design of experiments. Three materials—PLA, ABS, and Cf/PLA—were tested to evaluate their behavior under various parameter combinations. Experimental results showed that Cf/PLA exhibited the highest tensile strength, reaching 53.03 MPa, due to effective load transfer from embedded fibers; however, it also resulted in the highest energy consumption (up to 0.34 kWh) and carbon emissions (up to 200.14 g CO2-eq). PLA, on the other hand, demonstrated the best environmental performance with the lowest energy and emission values, while still providing good mechanical strength (up to 36.38 MPa) and the smoothest surface finish (Ra as low as 9.84 µm). ANOVA results confirmed that ID (p < .001) was the most significant factor influencing tensile strength, while LT had the greatest effect on both surface roughness and energy usage. To predict these multi-objective responses, three machine learning models—ANN, GPR, and RFR—were trained on the experimental dataset. Among them, ANN delivered the highest prediction accuracy with R2 values exceeding 0.997 for all outputs and MAPE below 0.6% during validation. The use of the Taguchi L9 design not only minimized the number of experiments but also provided statistically significant insights with reduced variability. This study presents a hybrid framework combining robust experimental design, statistical analysis, and AI-based prediction, offering a practical tool for optimizing FDM processes. These findings have strong industrial relevance, enabling manufacturers to make data-driven decisions tailored to goals such as high strength, low emissions, or minimal surface roughness. Future work may expand the material range, implement real-time optimization algorithms, and integrate the models into intelligent control systems for fully adaptive and sustainable AM.
Footnotes
Declaration of conflicting interests
The authors declared no potential conflicts of interest with respect to the research, authorship, and/or publication of this article.
Funding
The authors received no financial support for the research, authorship, and/or publication of this article.
Data and Code Availability
All data underlying the results is available as part of the article and no additional source data is required.
Ethical Considerations
The author declares that this study does not require ethical approval.