
Abstract
This study aims to experimentally characterise the mechanical behaviour of a single lap joint thermoplastic (TP) adherend bonded with a thermoset (TS) adhesive. Understanding the interface behavior of these joints is crucial, given the lower surface energies of thermoplastics compared to thermosets, making adhesion a challenging task over the TP surfaces. Therefore, prior surface modification of TP adherends is essential for effective adhesive bonding. Plasma treatment (PT), a method being explored here, alters the surface roughness, improves the contact angle, and increases the surface free energy. Surface roughness induced by PT is quantified using an atomic force microscope (AFM). The correlation between NDT assessment, surface roughness parameters, and single lap shear strength (SLSS) is being investigated. Fractography analysis and other findings contribute to a comprehensive understanding of the factors influencing the joint strength and integrity of such bonded systems, thereby establishing an appropriate bonding scheme for greater structural integrity towards aircraft applications.
Introduction
Composite materials dominate aerospace engineering compared to other engineering applications due to their low weight, high stiffness, and mechanical properties. They enable the realization of fully integrated aircraft structures without mechanical fasteners because of composite manufacturing processes such as co-curing, co-bonding, and secondary bonding which rely on the adhesive bonding technique. Thermoplastic composites (TPC), find themselves less commonly applied in aerospace structures compared to thermosets, face challenges such as high initial equipment costs, high processing temperatures, and limited drapeability due to their rigid nature. The full potential of a composite is only realized when they are manufactured as a fully integrated structure. Thus, effective joining technology is crucial for realising thermoplastic composite structures. Mechanical joints, such as bolts or rivets, add weight and introduce stress concentrations around the fastener holes, which are undesirable in a structure. Mostly, TPC-integrated structures can be achieved through thermoplastic welding or adhesive bonding. However, the high temperature process requirement for thermoplastic adhesives and the associated high costs and energy consumption pose significant challenges. An alternative approach is to use thermoset film adhesives for joining the thermoplastic adherends. Thermoset adhesives typically operate at lower temperatures compared to TPC adhesives, making them a more practical option. Proper selection of thermoset adhesive is essential to match the glass transition temperature (Tg) of the adherend materials. Using adhesive bonding, one can expand the applications of TPCs, allowing aerospace designers to realise a fully integrated structure with fewer fasteners exhibiting a smoother aerodynamic profile. Additionally, adhesive joints offer benefits such as uniform load transfer, design flexibility, vibration damping, reduced corrosion, and enhanced fatigue resistance.
One of the major challenges in bonding thermoplastic composites is their inherently smooth and glossy surface, which leads to poor adhesive wettability and low bond strength. To address this, surface modification is essential to achieve reliable adhesion between thermoplastic adherends and thermoset adhesives. Various surface engineering techniques have been explored, including mechanical, chemical, and high-energy radiation treatments.1,2 Uşek and Kaynak 3 investigated the lap shear strength (LSS) and Mode I fracture toughness of bi-directional CF/PPS semipregs bonded with a 0.2 mm epoxy film adhesive (Cytec FM 300K, 244 GSM). Surface modification using grit blasting and plasma treatments improved LSS from 6 MPa (untreated) to 16 MPa and 23 MPa, respectively. Similarly, Arief et al. 4 compared 12 surface treatment methods, highlighting how changes in surface morphology, roughness, and contact angle influence bonding mechanisms and joint performance. Anagreh et al. 5 studied low-pressure plasma (LPP) treatment on glass fiber-reinforced and unreinforced polyoxymethylene (POM), reporting substantial increases in surface free energy and roughness, which improved adhesion strength from 2–3 MPa to 11 MPa for GF-POM, and from 0.5 MPa to 6–8 MPa for unreinforced POM. They also observed surface ablation and a twofold increase in surface energy with extended plasma exposure.
Studies have further shown that interdiffusion at the thermoplastic–thermoset interface enhances both lap shear strength and Mode I/II fracture toughness, even at elevated temperatures. 6 Among the available modification techniques—plasma treatment, acid etching, and oxidative treatments—plasma treatment remains the most effective and widely used for thermoplastic composites.7–11 Researchers have optimized its parameters such as stand-off distance, treatment speed, exposure time, binding energy, surface roughness, and contact angle to achieve optimal bonding performance.12–16 Beyond processing, non-destructive testing (NDT) is essential for assessing the quality of secondary bonded joints. Although conventional NDT methods like ultrasonic and lock-in thermography can detect debonds and delaminations, they fail to identify bond degradation or kissing bonds reliably.17–20 Despite several studies, limited literature exists on thermoplastic adherends bonded with thermoset adhesives, and no standardized NDT methodology is available for evaluating these joints. Moreover, a clear correlation between process parameters, such as surface roughness, contact angle, surface energy, and bond strength with NDT response remains unexplored.
The present work aims to bridge this gap by examining the interplay between processing parameters through both destructive and non-destructive evaluations. Experiments focus on single-lap joints made of CFRP adherends with thermoplastic composites (TPC) modified via controlled plasma-induced surface roughness. The study includes quasi-static tensile testing to determine single-lap shear strength (SLSS), along with detailed failure mode analysis and fractography to elucidate the mechanisms governing joint failure.
Experimental setup & details
Raw materials
For the experimental study, the selected materials included Carbon-PolyAryl Ether-Ketone (PAEK) semi-preg for fabricating the adherends, and Redux/Hexbond 319A (400 GSM), a high-temperature curable thermoset film adhesive from Hexcel Composites. PAEK, with its lower melting point compared to Poly Ether Ether Ketone (PEEK) and Poly Ether Ketone Ketone (PEKK), and its typical processing range of 330°C–380°C, motivated its selection for this work. Unidirectional (UD) carbon fiber T700 was used for fabricating the CFRP laminates. Various processing methods, such as autoclave, hot pressing, and automated fiber placement (AFP)—can be employed to manufacture Carbon-PAEK adherends. In the present work, the adherends were fabricated using manual layup followed by autoclave consolidation. A key challenge was that the layers did not adhere to each other like thermoset prepregs; therefore, high-temperature tape was used along the four edges to hold the plies together at room temperature. Specimens were fabricated according to ASTM D3165,
21
forming a single-lap joint configuration, as shown in Figure 1. This joint geometry was chosen to assess the influence of plasma treatment on the single-lap shear strength (SLSS). Adhesive bonding was performed using a vacuum-bagging process, and the joints were subsequently cured in an autoclave following the temperature cycle provided by the adhesive supplier. Lap shear test Configuration as per the ASTM 3165.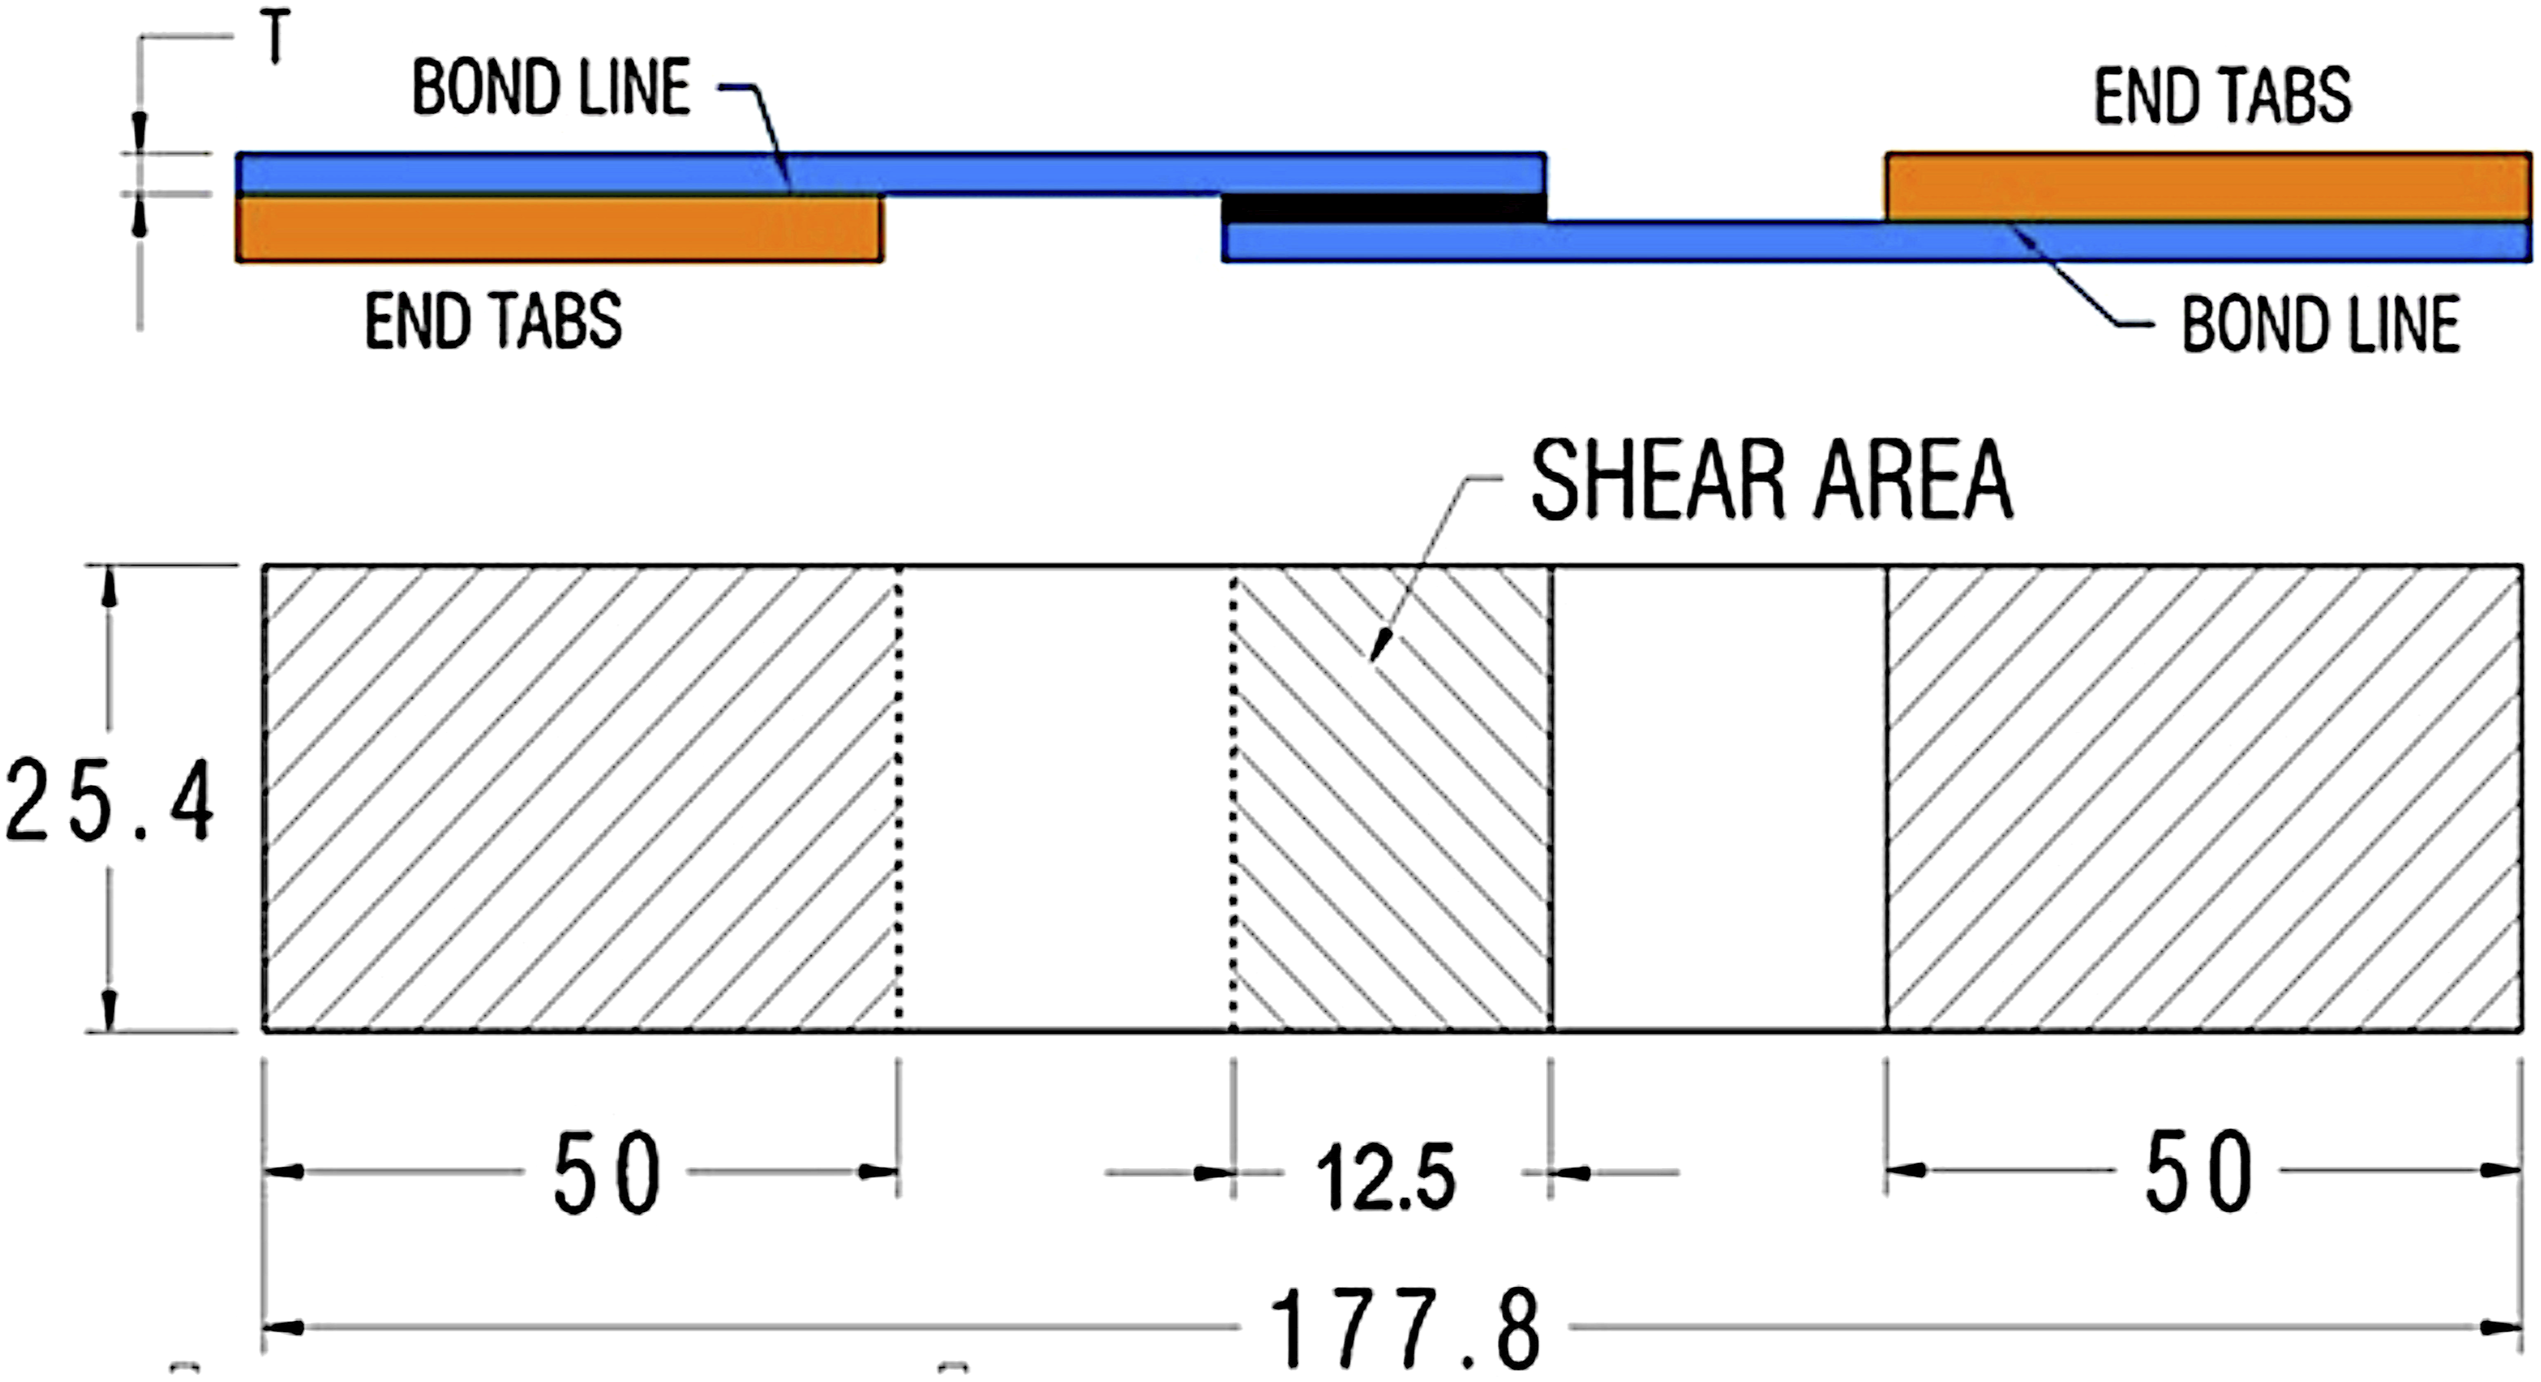
Manufacturing of adherends
The composite adherend used in this study has a quasi-isotropic layup sequence [0,45, 90,-45]sym. To enhance the joint’s load-carrying capacity, the outer layer of the adherend was oriented at 0°, aligning with the joint’s interface. TPC adherends were manufactured in an autoclave using an optimized consolidation cycle, and these adherends were qualified non-destructively using a ultrasonic C scan system. In this work, the through transmission ultrasonic testing was done using a 5.0 MHz frequency transducers. The inspection results showed an amplitude drop of 1 to 2 dB/mm, indicating that the adherends were free from defects like inclusion, delamination, resin-rich, or starvation. Subsequently, the qualified TPC adherends were then used for the fabrication of single lap joints.
Surface modification strategies
Many researchers had investigated the effects of various surface modification techniques on the joint strength of adhesive joints using appropriate surface treatment processes.1–4 In particular, these treatments enhanced the lap shear strength of composite-to-composite and metallic-to-composite adherends. Surface modification significantly affected the bonding mechanisms and adhesion properties, and therefore played a vital role in joint behaviour and failure strength. Such treatments improved mechanical interlocking, van der Waals interactions, and chemical bonding at the adherend interface. Jigao Liu et al. 22 discussed different surface treatment processes applied to carbon-fiber-reinforced plastics (CFRP) for bonding applications. They examined a wide range of surface modification methods, including grinding, sandblasting, solvent cleaning, coupling agents, acid and alkali etching, anodic oxidation, peeling layers, flame, corona discharge, plasma, laser, and intense pulsed light. 1 From the literature, it was found that grit and sandblasting produced higher surface roughness (Ra), contact angle (θ), and surface energy (γs); however, these methods could also physically damage fibers, leading to reduced lap shear strength.
In this work, adhesive bonding of thermoplastic adherends using a thermoset adhesive was adopted based on the studies by Jigao Liu et al. and others.22–28 The literature also indicated that different surface treatments altered surface energies, which directly influenced the degree of adhesive wetting during bonding. Modern high-energy radiation treatments, such as plasma treatment, were reported to be effective and were therefore employed in this study.
Surface modification by plasma treatment on the adherends
Carbon-PAEK adherends were subjected to plasma treatment using a plasma generator supplied by Plasmatreat, as shown in Figure 2. Plasma treatment was done using an atmospheric plasma system. The machine was equipped with automatic head movement enabling multiple passes with incremental steps or in a fixed location based on the programming. The speed of the head (V), and the stand-off distance (D) between the nozzle to adherend were the two major parameters that influence the plasma treatment. Here, plasma treatment was carried out over a bonding overlap zone (15 mm width × 300 mm length) on the adherend surface. The plasma process variables used for the surface treatment of the specimens and their nomenclature are mentioned in Table 1. Plasma treatment equipment. Plasma process variables.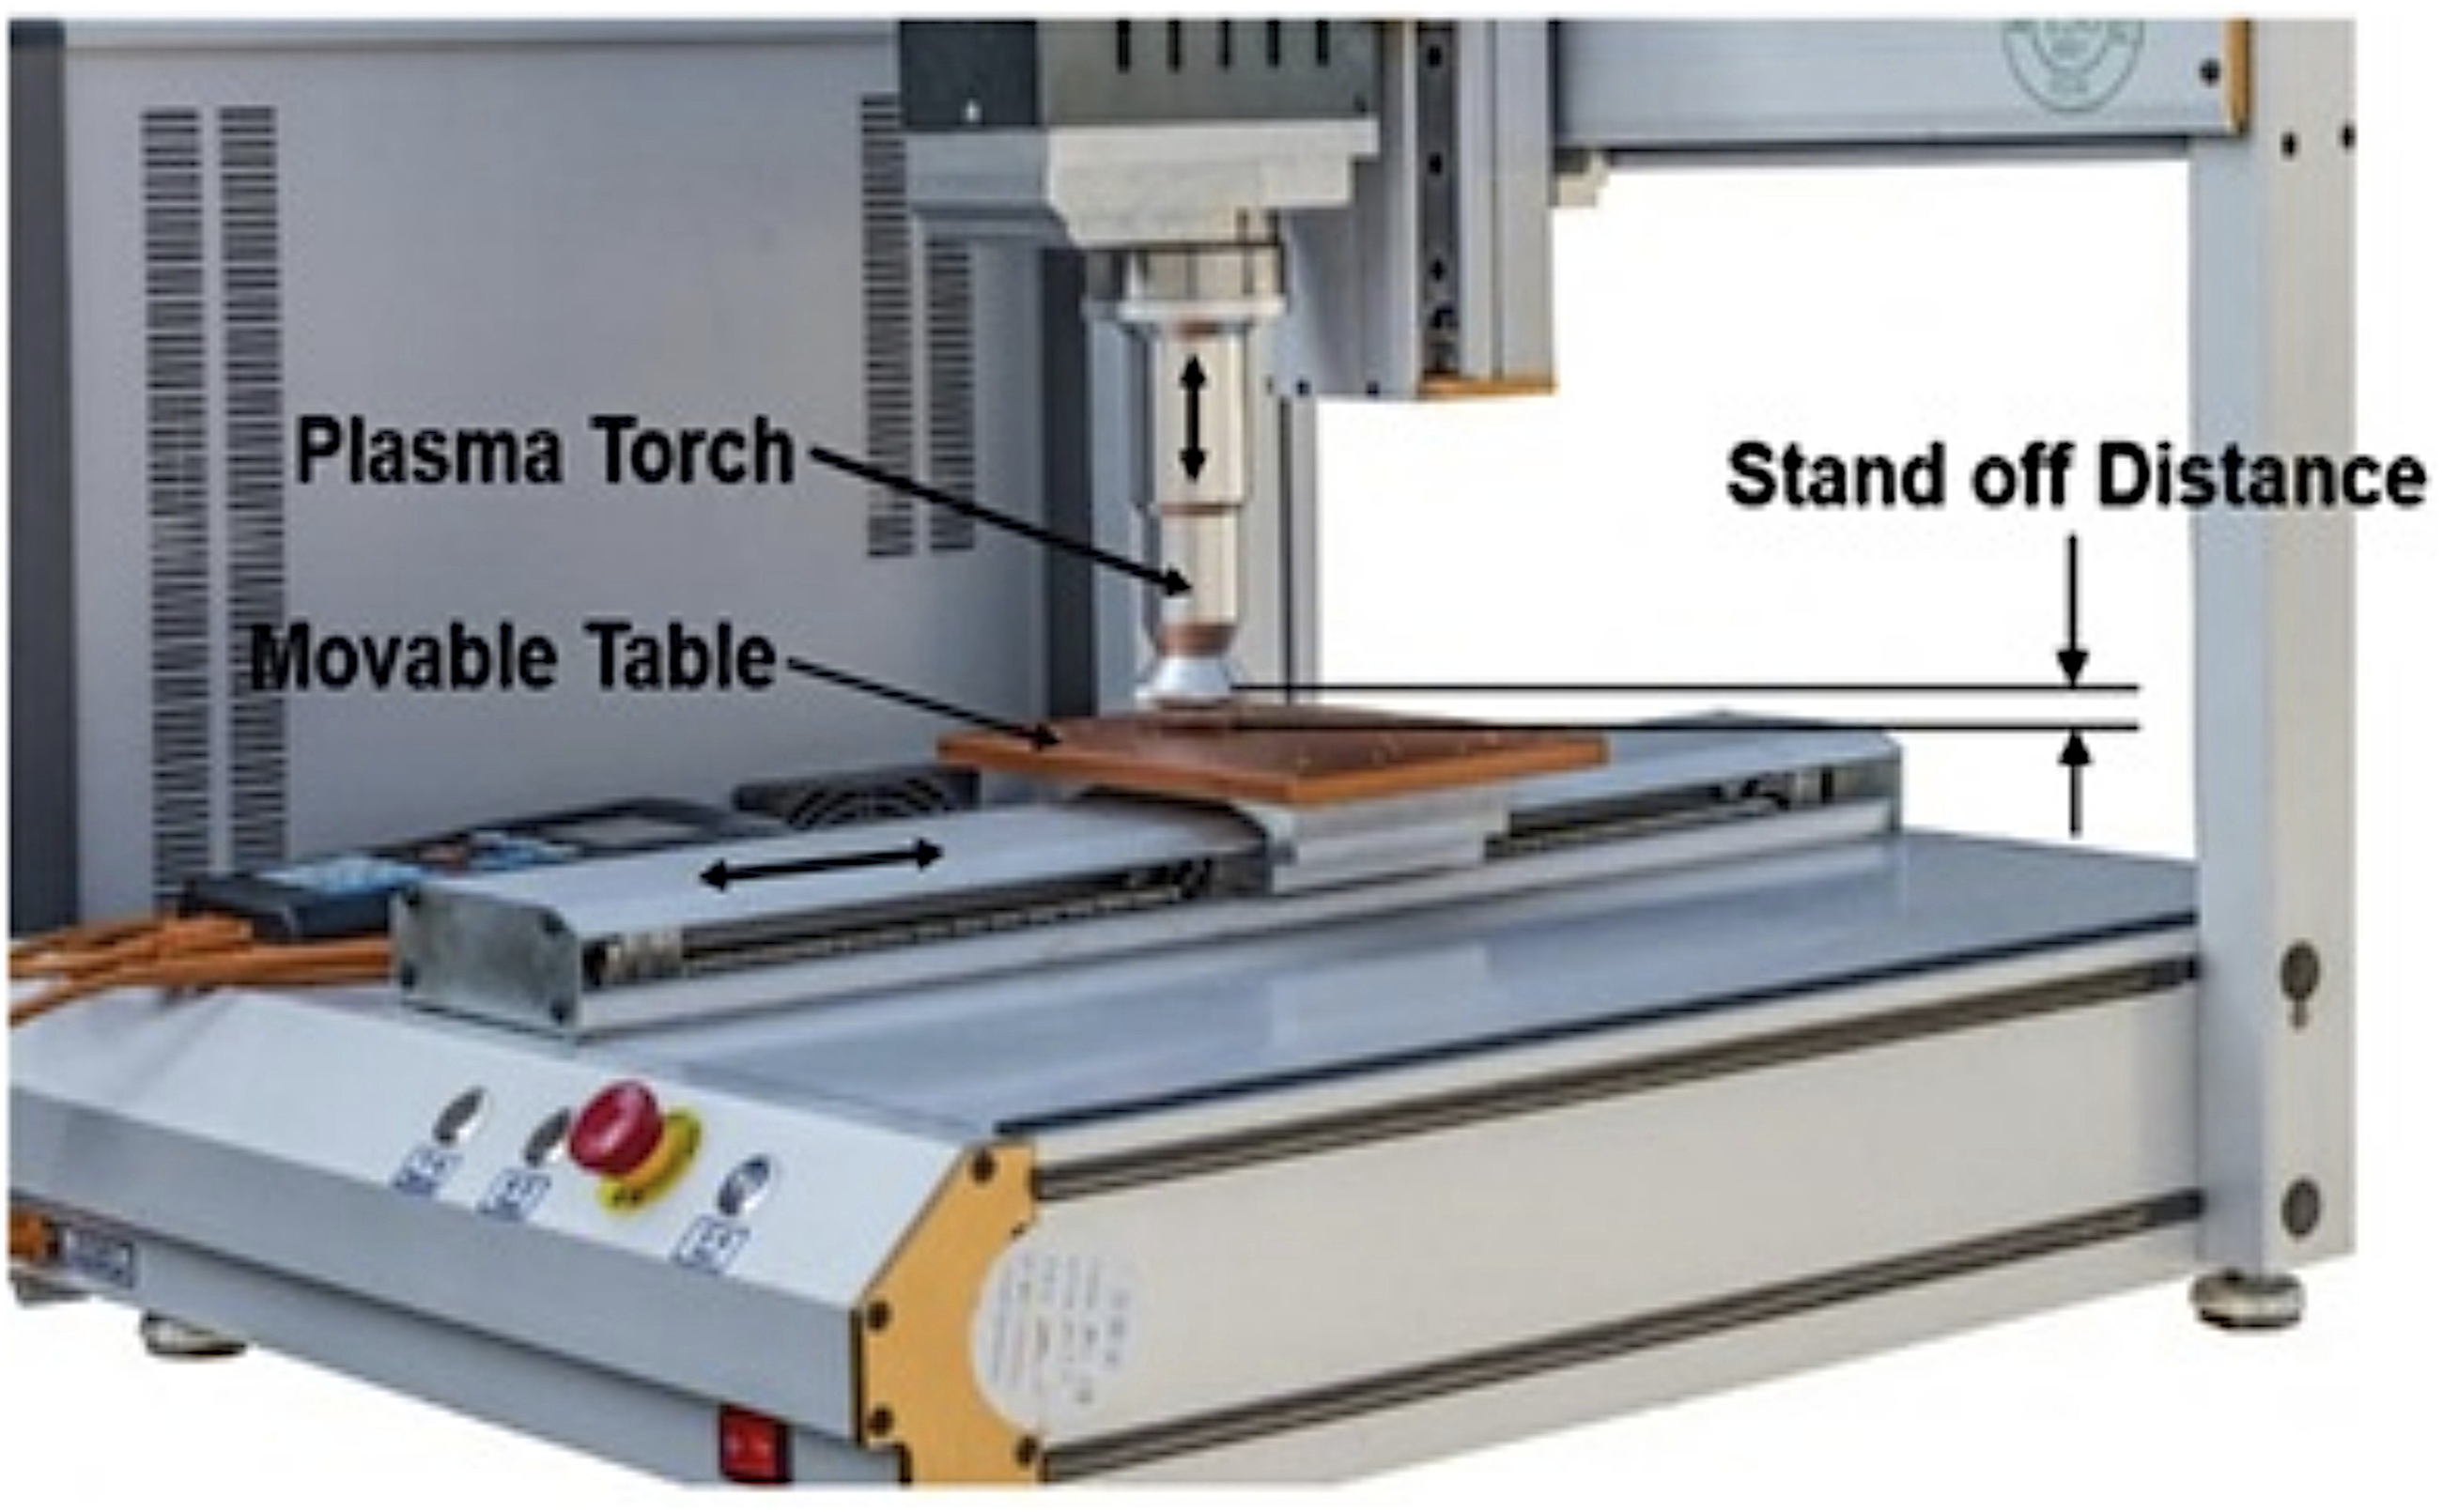
The standoff distance, speed of the plasma torch, and number of passes were then varied to introduce different contact angle, surface energy and surface roughness over the adherend. Stand-off distances were kept constant at 7 mm except for PT2 samples, and the speed of the plasma was also kept constant at 10 mm/s except for the PT3 sample. The effect of these process parameter variations was realized in terms of SLSS. An atomic force microscope (AFM) was then used to measure the surface roughness of the treated surface in order to evaluate the plasma treatment’s influence on the adherend surface modification.
AFM analysis of plasma-treated surfaces
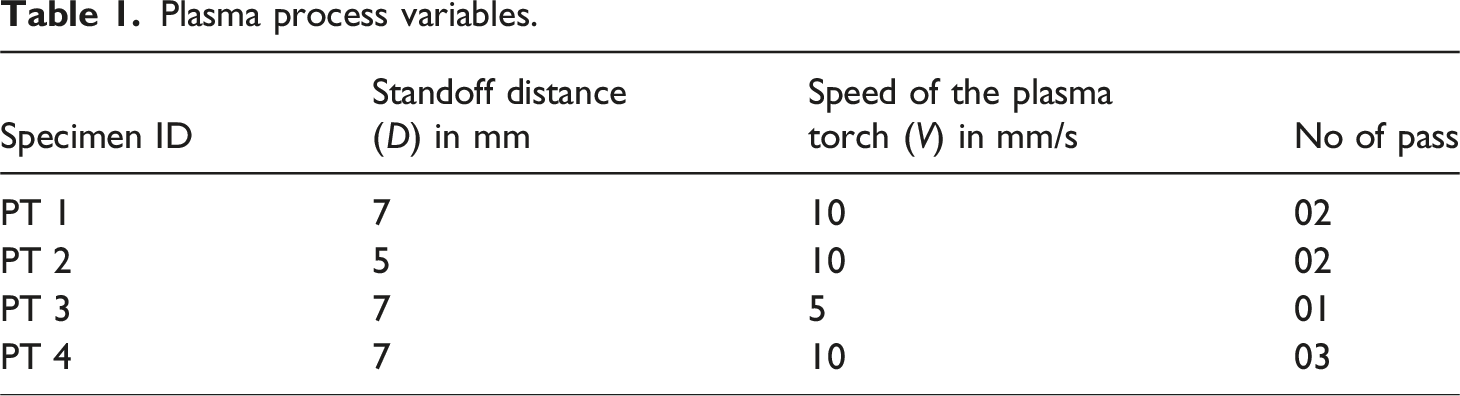
The plasma treatment alters the adherend surface chemically and induces roughness on them. The treated surface was characterized using an AFM sourced from CSM Instruments (ANTON PARR Tritec), with a probe radius of >10 nm. It can scan the area (XY) with a spatial resolution varying from 1 µm × 1 µm to 40 µm × 40 µm, and the maximum Z-axis limit is 22 µm. This equipment is capable of introducing nano-scale roughness, surface morphology, and grain size analysis. After plasma treatment, the surface energy of the composite adherends gets greatly enhanced and the contact angles were measured using goniometer. Surface energy or adhesion is usually related to the adhesives’ ability to wet the adherend’s bonding surface. High surface energy results in a greater spread of the adhesives, resulting in more uniform contact with the adherend. The surface topography of the pristine and plasma-treated samples are then examined using AFM. Plasma etching effects can be observed with AFM measurements. Figure 3 illustrates the surface topography of the carbon-PAEK thermoplastic samples. For the pristine samples, the surface roughness value of Ra 110 nm was observed which changes with various PT process parameters. Surface roughness of TPC samples with and without plasma treatment: a) Pristine Sample -Ra 110 nm, b) PT 1 with two passes -Ra 28 nm, c) PT 2 with three passes–Ra 34 nm, d) PT 3 with a single pass -Ra 50 nm, e) PT 4 with three passes – 180 nm.
All the adherends were manufactured using a metallic surface plate placed at the bottom along with a metallic sheet of 1 mm thickness as a caul plate at the top. The pristine adherend surface roughness measured as 110 nm was due to the metallic tools’ surface finish used in the fabrication. Surface treatment for samples PT1 to PT4 were done using the plasma to improve its bonding capability chemically and physically. Plasma treatment helps to improve the bonding mechanism in two ways: chemically activating its surface by removing oxide layers present on the outer surface of the adherends, thus activating the chemical bonding process. Physically altering the surface roughness, rough surface, and cavities can promote the reliable adhesion process by mechanical interlocking as seen in the fractography analysis.
Measurement of surface free energies and contact angle
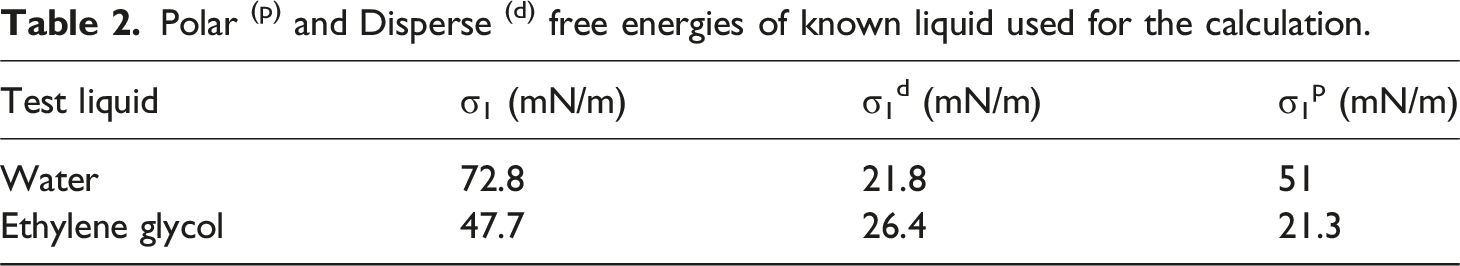
Polar (p) and Disperse (d) free energies of known liquid used for the calculation.
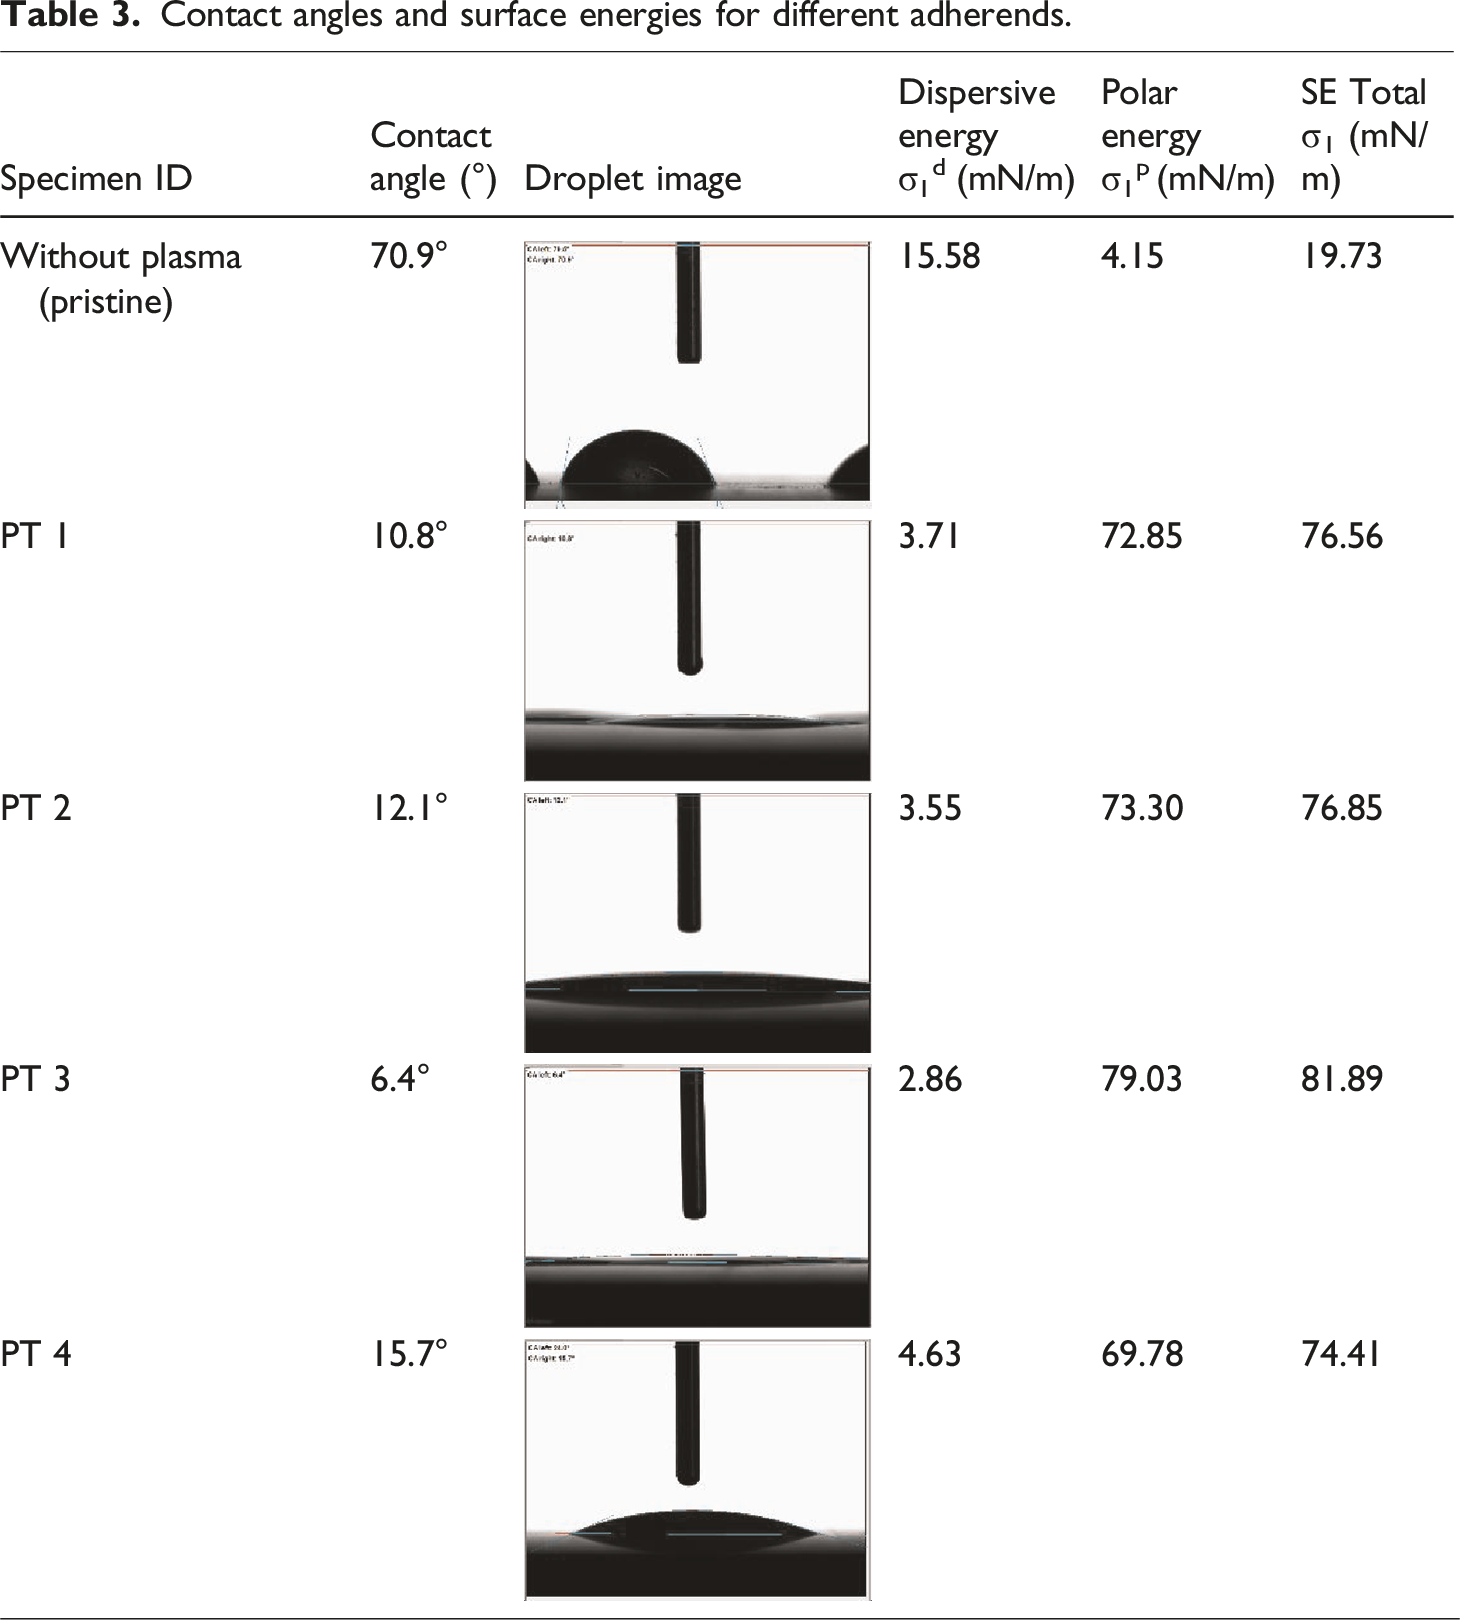
Contact angles and surface energies for different adherends.
Fabrication of single lap joint (SLJ) laminate & specimens
Single lap joint (SLJ) laminates were fabricated following the ASTM test standard ASTM 3165, and their geometry is shown in Figure 1. SLJ laminate was realized using a secondary bonding process utilizing aerospace-grade structural adhesive, Hexbond/Redux 319A, which has a 400 GSM areal weight and 0.2 mm thickness coming with a 40-micron scrim cloth (nylon carrier mesh) mainly to control the glue line thickness of the adhesive. The following steps were the major steps observed during the fabrication of the SLJ laminate, as shown in Figure 4. Step by step major process for the fabrication of SLJ samples made of a thermoplastic CFRP.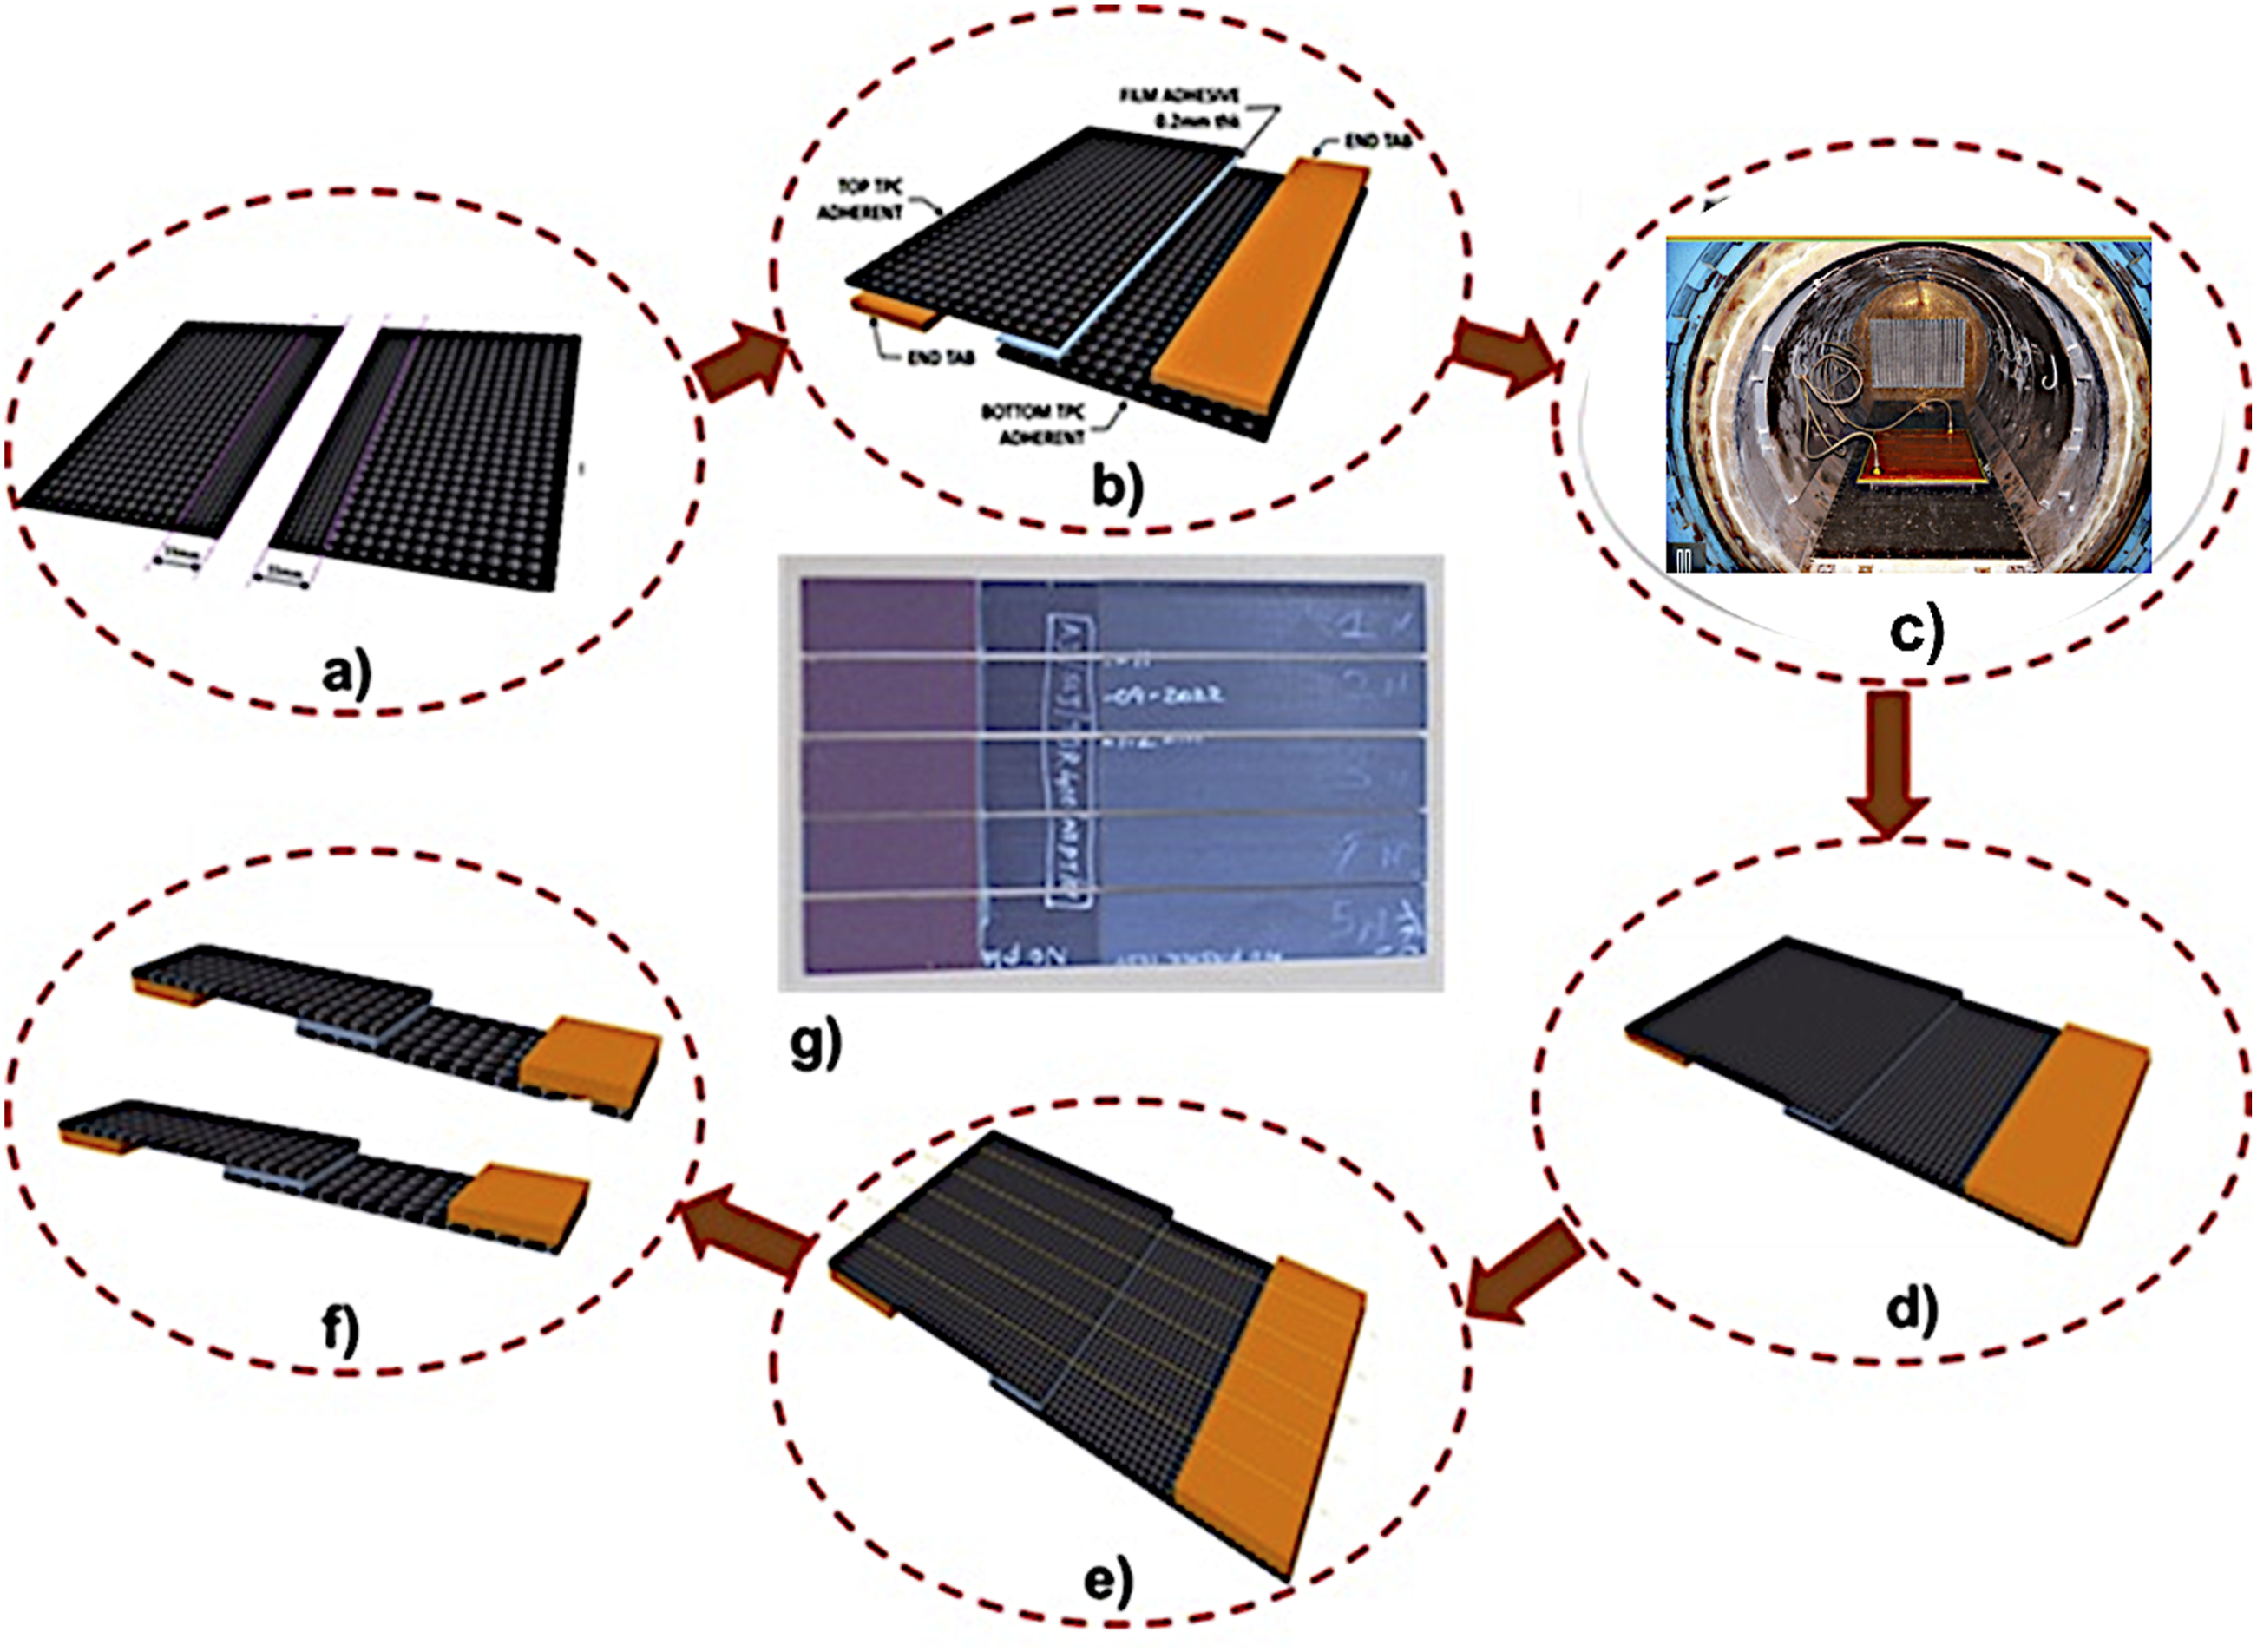
The NDT-qualified two adherends were used to fabricate SLJ panels (Figure 4(a)). A piece of the supporting laminate was kept below one of the adherend to control the thickness of the adhesive, as shown in Figure 4(b). The supporting laminate was also fabricated using the same process as that of the adherend material to avoid any mismatch in the thickness and coefficient of thermal expansion (CTE). Uniform pressure was applied over the lap joint. Supporting laminates were then wrapped with a release film to avoid bonding with the adherend or the mold/tools. The assembly was then placed over the metallic surface plate (Mold) and sealed using a vacuum bag, as shown in Figure 4(c). The SLJ laminates were then cured in an oven under vacuum condition without any external pressure on to the assembly. After curing, glass fiber reinforced plastics (GFRP) end tabs were bonded to the adhesively bonded TPC SLJ panels, as shown in Figure 4(d). The SLJ panels were then machined to retrieve individual SLJ specimens as per the ASTM standard (see Figure 1), as shown in Figure 4(e) and (f).
Nondestructive inspection of SLJ laminates
Single lap joint laminates were further subjected to ultrasonic inspection and then qualified for bond quality before machining the SLJ specimen for mechanical testing. The ultrasonic C scan inspection was done using the through-transmission mode involving contact probes using M/s Scan Masters Systems Ltd, Israel. The bonded joint specimens C scan results were generated in the contact through transmission mode with a 200 mm/s scanning speed by using a 5 MHz frequency transducer with a 10 mm probe diameter. The ultrasonic C-scan plots obtained for all the SLJ laminates are shown in Figure 5(a)–(e). The attenuation level of all the four SLJ laminates are shown in Table 4, along with the corresponding surface roughness value. The variations in attenuation levels were due to plasma treatment process variables, whose surfaces were cleaned by chemical etching, and further, the charged ions roughen the surfaces upon plasma treatment. Ultrasonic C scan plot of the SLJ laminates: a) Without Plasma Treatment, b) PT 1 Plasma Treated with 2 passes, c) PT 2 Plasma Treated with 2 passes, d) PT 3 Plasma Treated with single pass, e) PT 4 Plasma Treated with three passes. SLJ bonded zone attenuation levels of C scan versus surface roughness.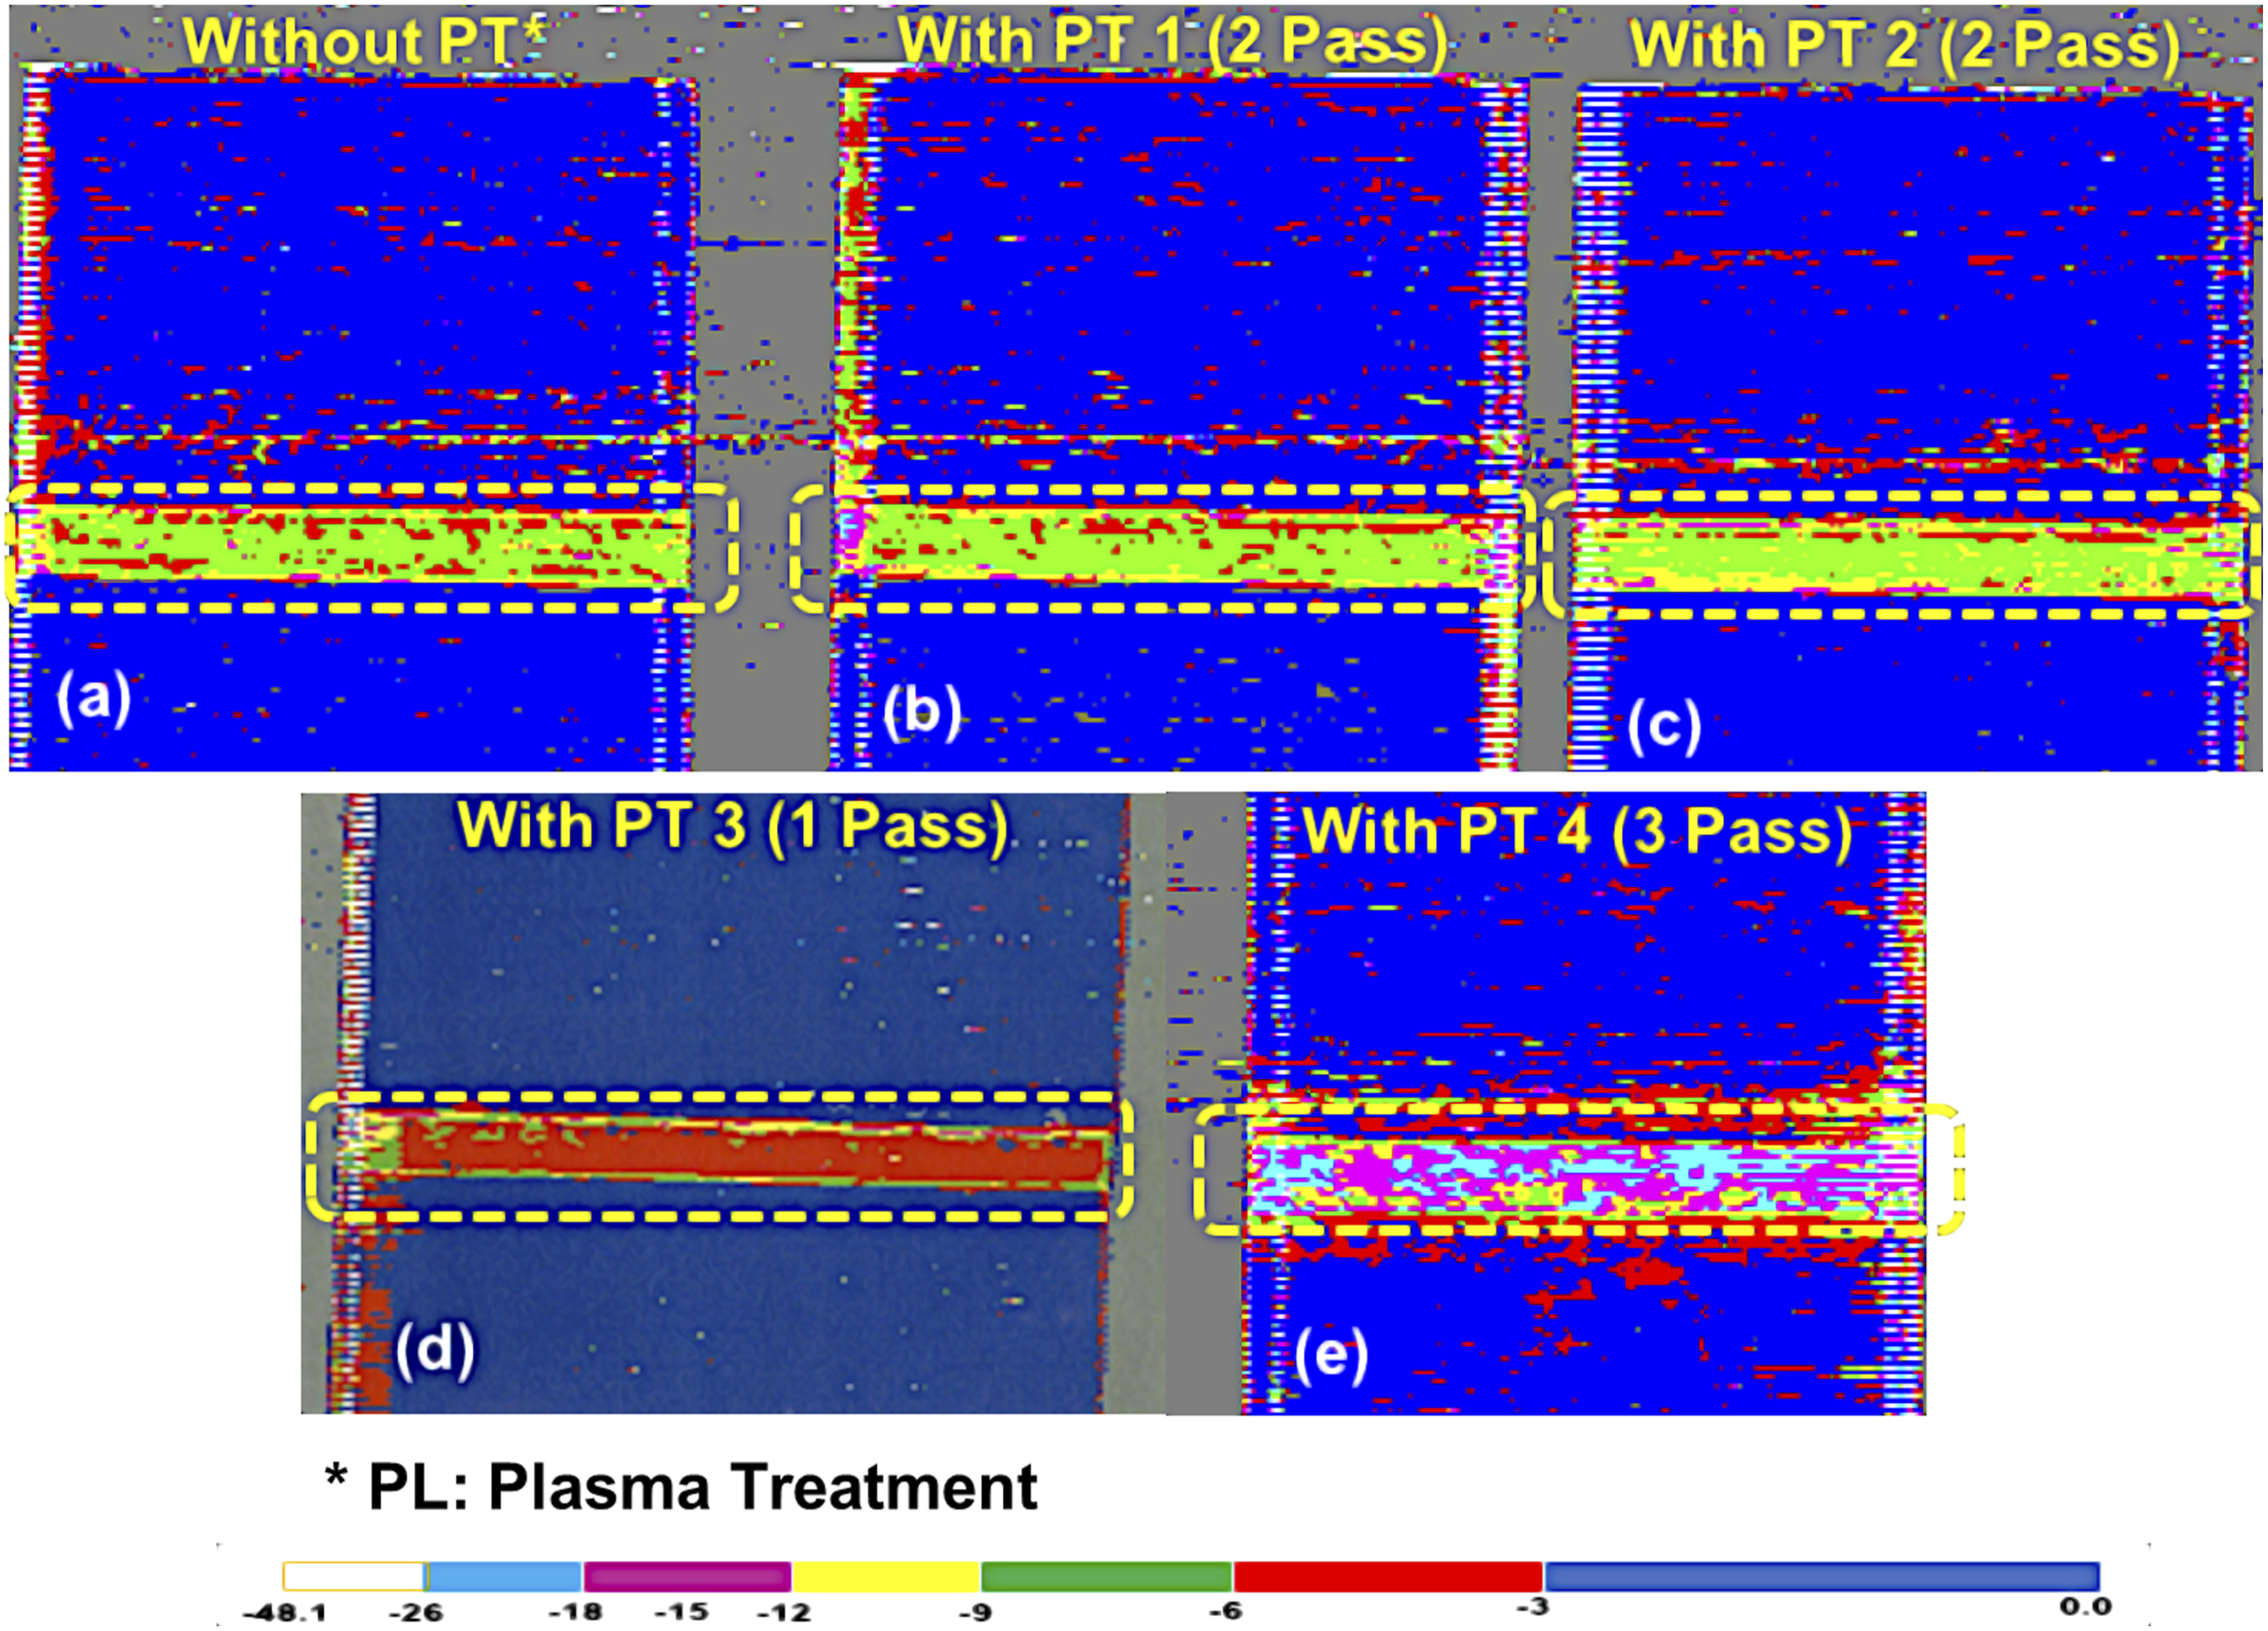
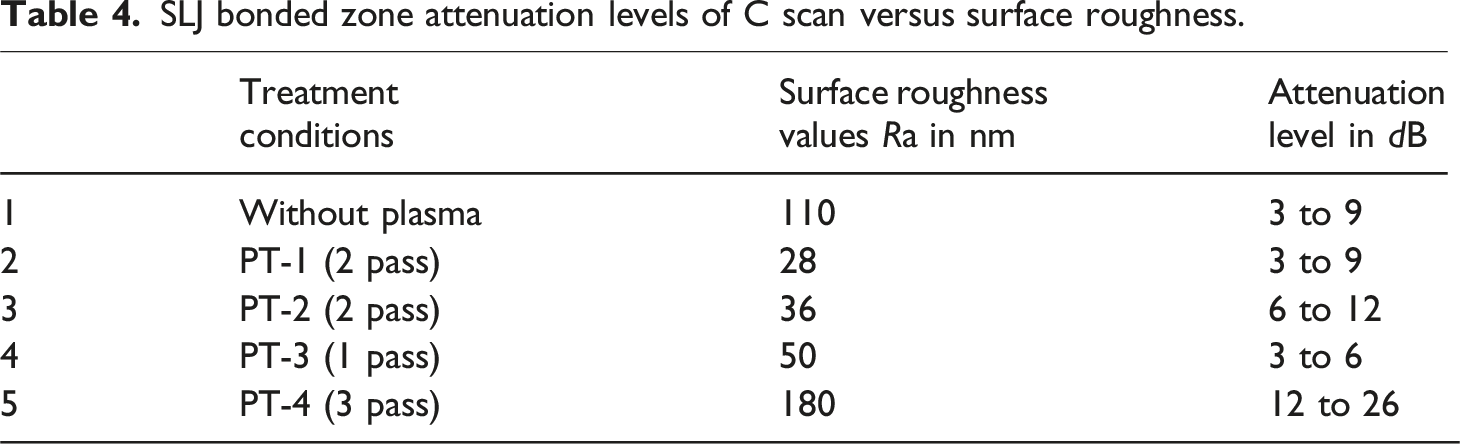
The NDE ultrasonic C-scan plots shown in Figure 5(a)–(d) depicted uniform consolidation. Figure 5(e) showed non-uniformity in the C-scan amplitude, with attenuation levels varying from 12 to 26 dB, and irregularities were also observed near the bonded zone. This occurred due to the increased surface roughness of the adherends in the bonding region, caused by multiple passes of the plasma head over the surface. The untreated samples (Figure 5(a)) displayed good NDE results despite having a higher surface roughness of 110 nm. For PT1 (Figure 5(b)) and PT2 (Figure 5(c)), the measured surface roughness values were 28 nm and 36 nm, respectively. The attenuation level of the PT3 sample was observed to be 3–6 dB, representing a uniform attenuation pattern across all four samples.
Mechanical testing of SLJ specimens
The bonded SLJ specimens were then mechanically tested at room temperature by applying quasi-static tensile loading using a universal testing machine (UTM). The lap shear strength tests were conducted in a 250 kN capacity UTM, and specimens were held with pneumatic grips. The load was applied exactly onto the mid-plane of the specimens by providing equivalent offset end tabs on them to avoid eccentric loading while testing. All the samples were tested at a displacement rate of 1.5 mm/min. Four samples were tested for each case, and the lap shear strength (LSS) was determined. The load versus displacement plot obtained for the tested samples are shown in Figure 6. The single-lap shear strength is calculated using the equation (1) Load vs displacement plot of the tested CFRP samples.
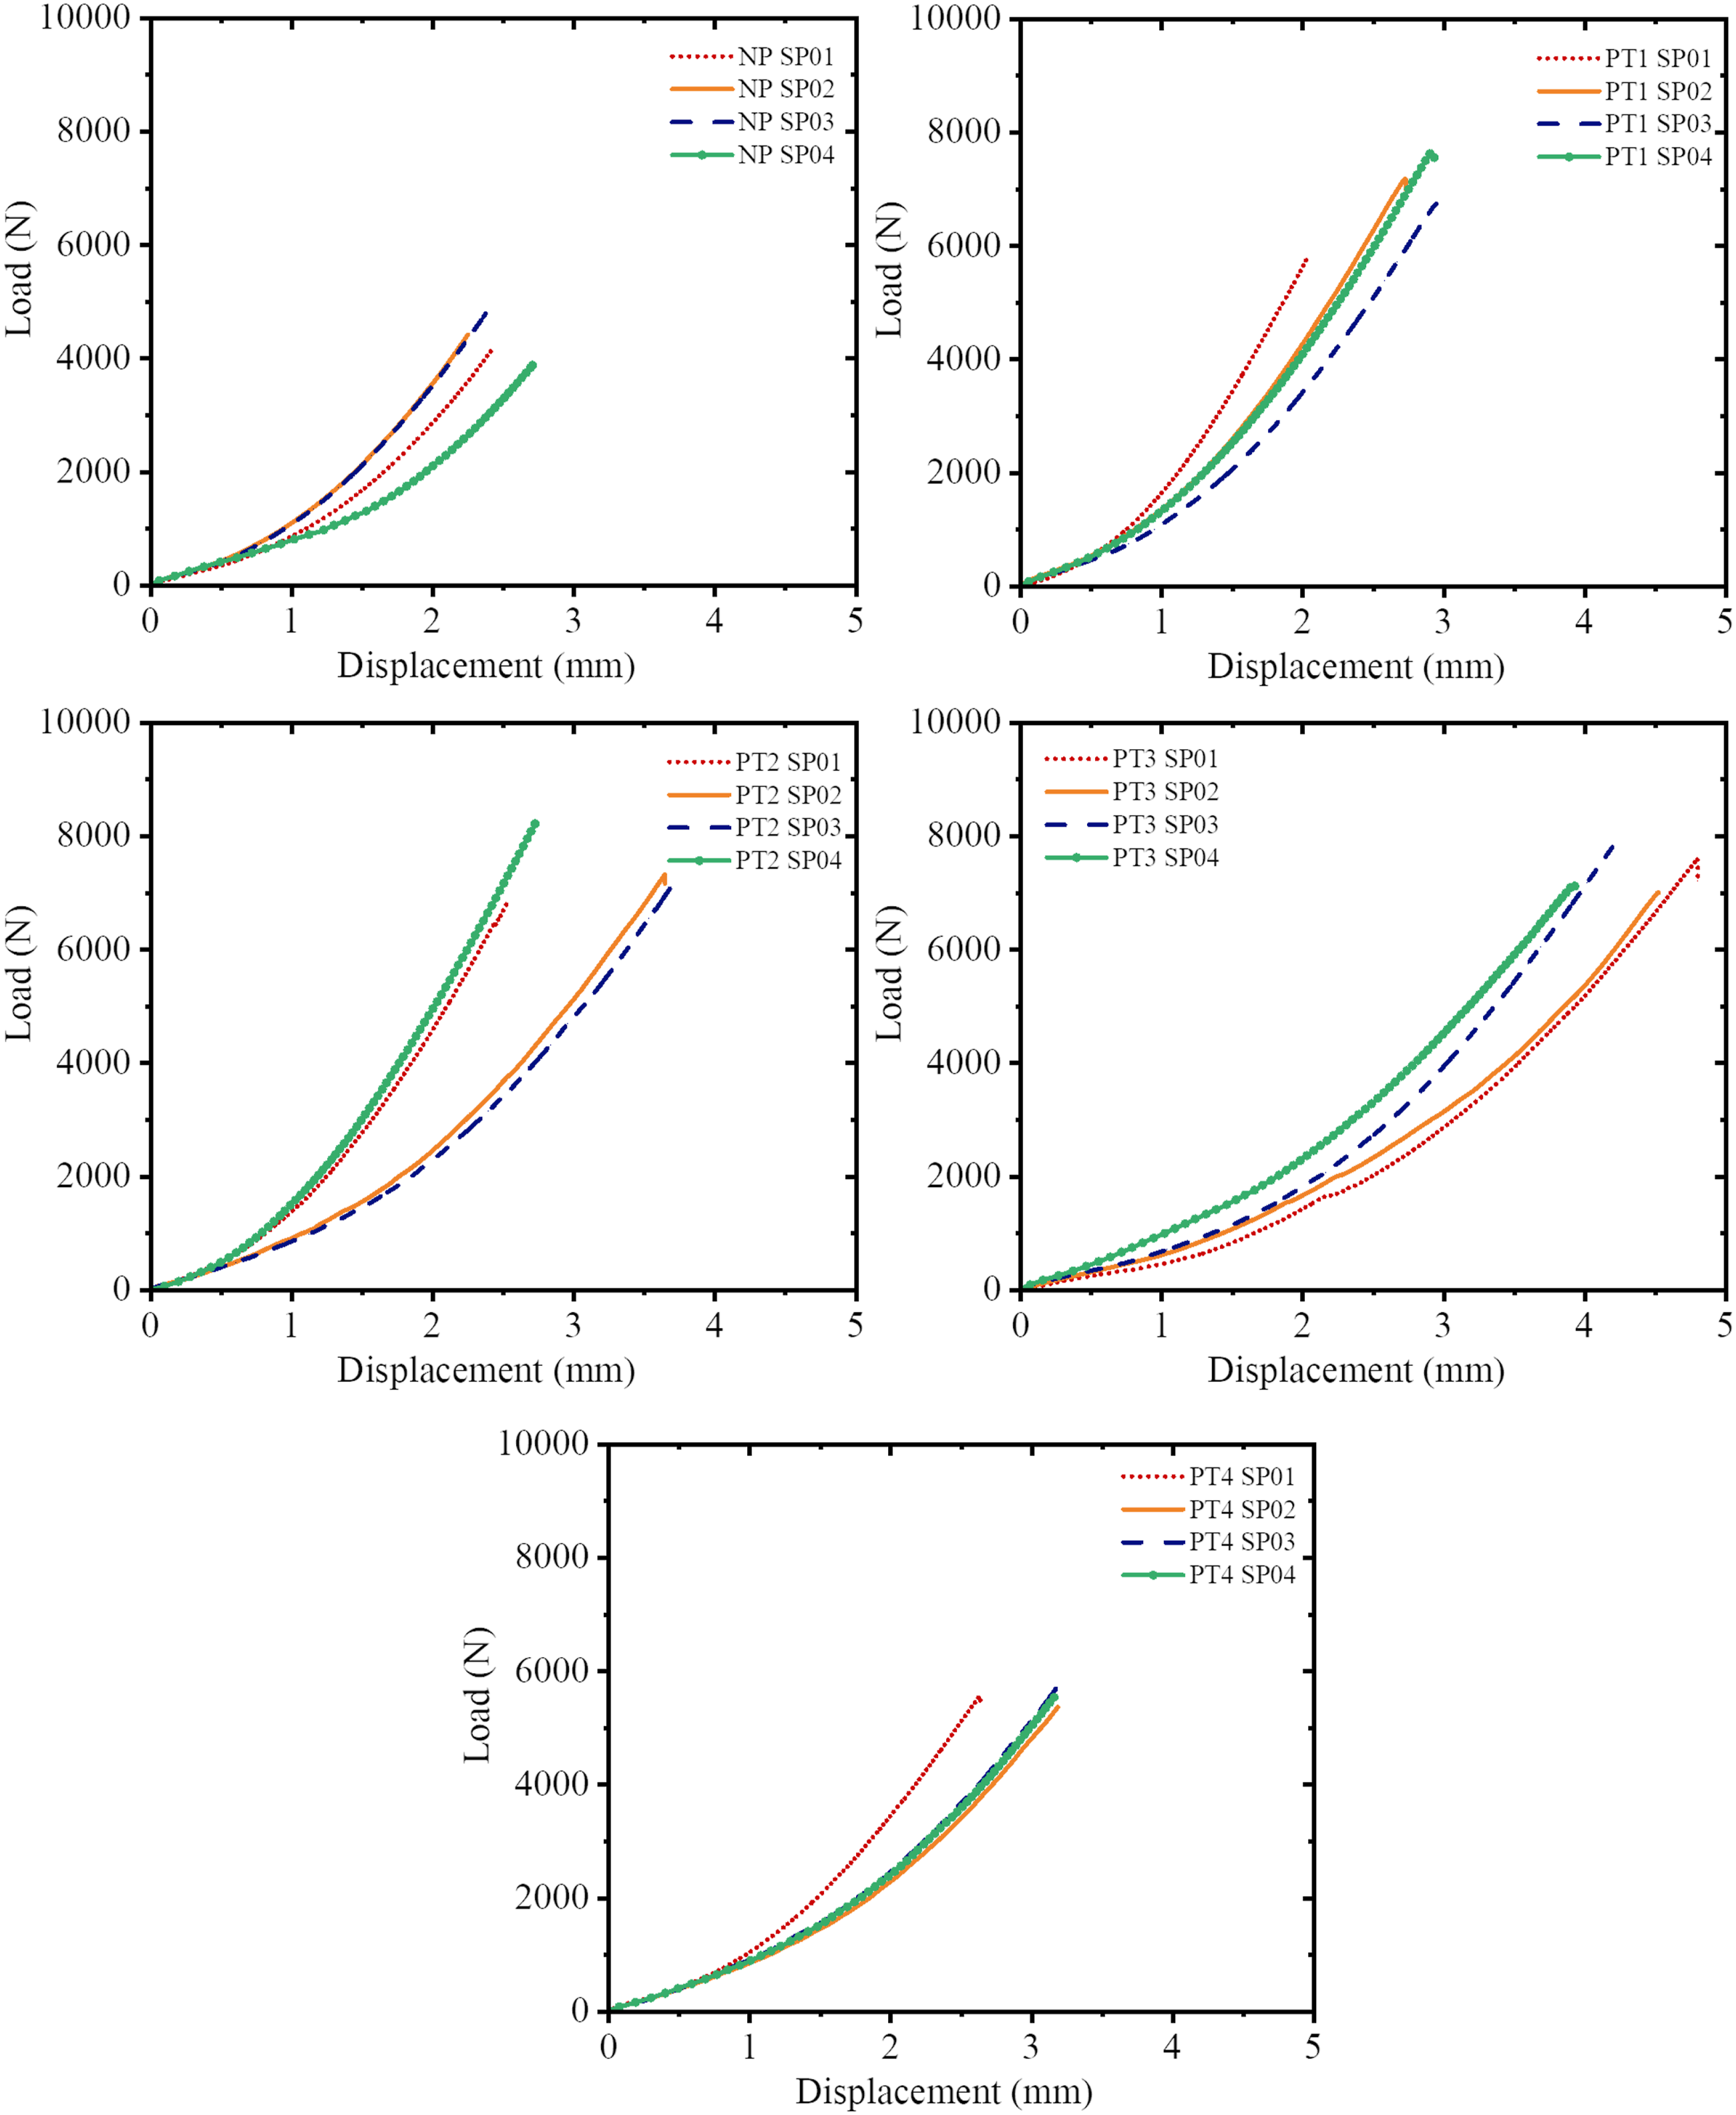
In SLJs, the lap shear involves peel forces acting perpendicular to the adhesive surfaces. The stiffness disparity between thermoplastic adherends and thermoset epoxy adhesives contributes to variation in their structural response upon tensile loading, despite efforts to mitigate eccentric loading using end tabs.29,30 The load-displacement plots reveal variations in joint stiffness, influenced by various manufacturing parameters such as curing processes, heating and cooling rates, adhesive tapering, and adherend surface roughness. Figure 6 indicates that specimens with surface roughness less than 50 nm (PT1, PT2 & PT3) exhibit lower non-linearity. In contrast, those with surface roughness exceeding 100 nm (PT1 & PT4) demonstrate higher nonlinearity and greater variability in the joint stiffness.
Results and discussions
Lap shear strength test under Quasi-static loading condition
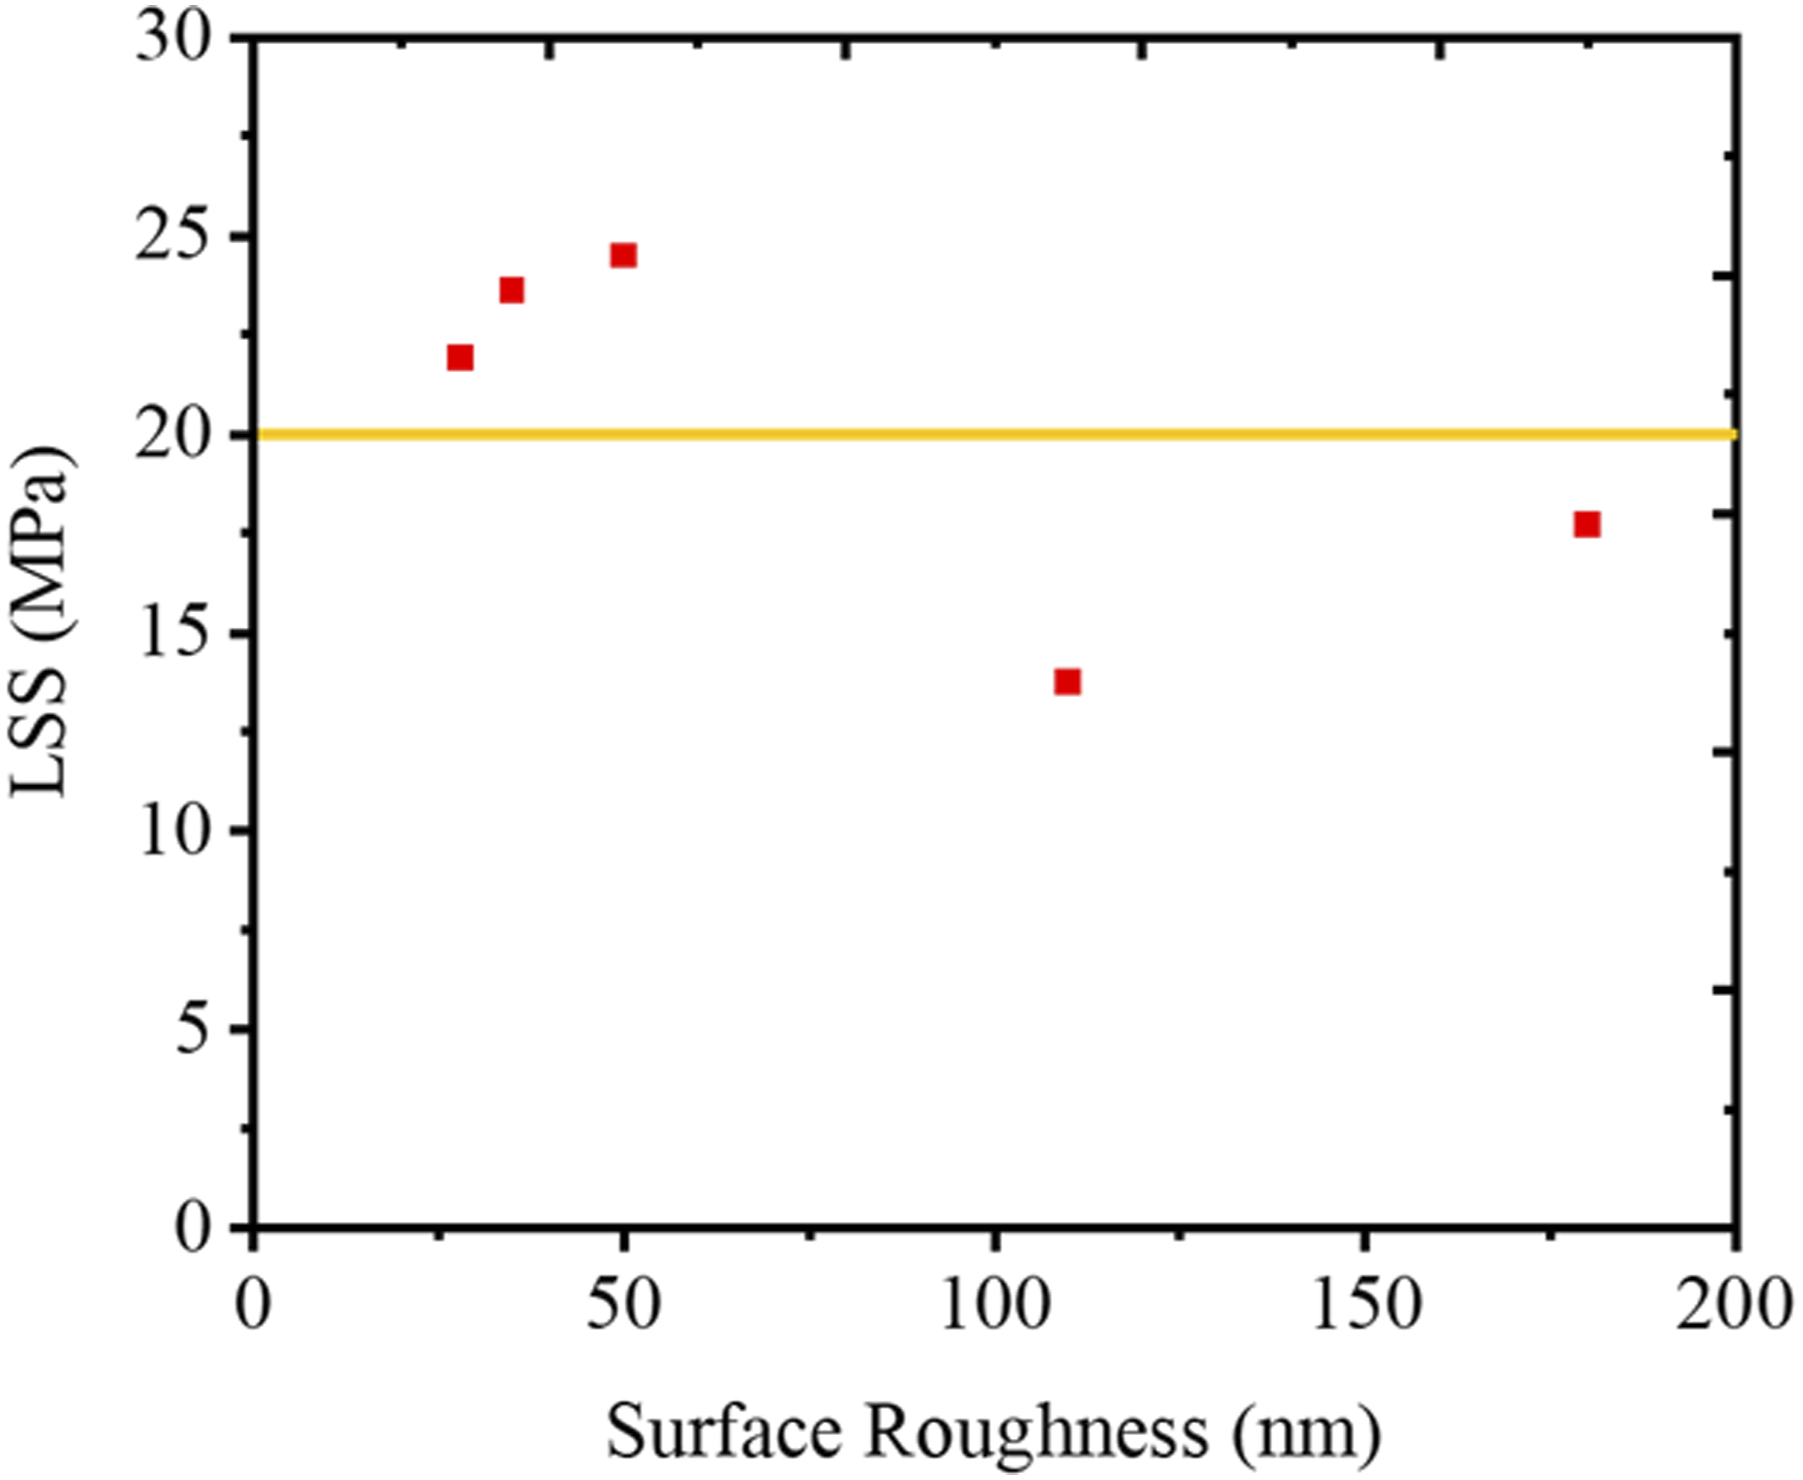
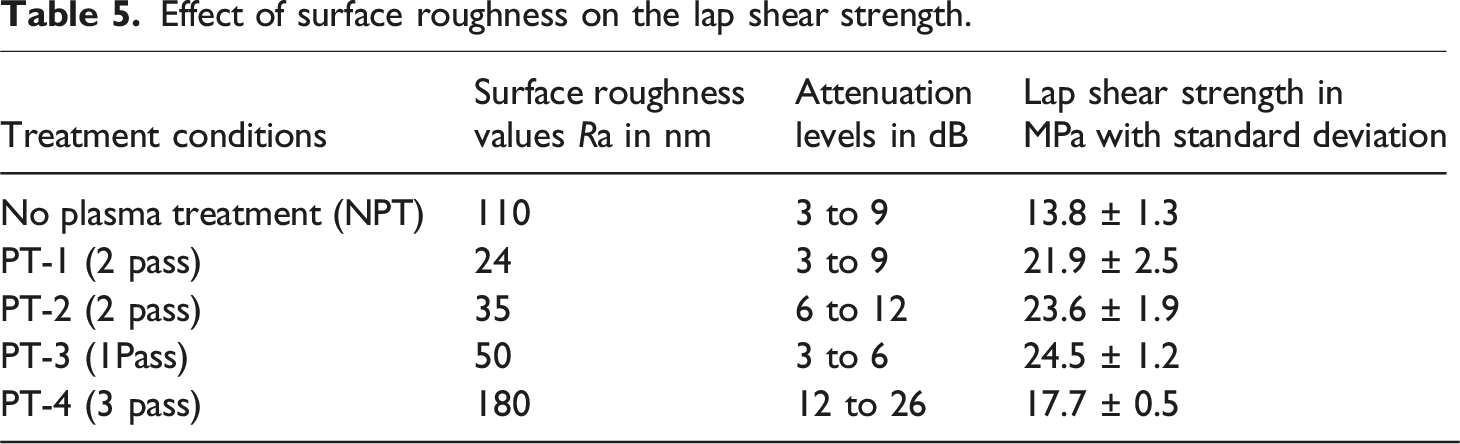
Figure 7 shows the LSS of all the secondary bonded TPC joints tested at room temperature. It is observed from Figure 7 that the LSS of the pristine joint without treatment is 13.8 MPa, which is the lowest among all the cases. The LSS of Plasma-treated samples PT1, PT2, PT3 were estimated to be 21.9, 23.6 and 24.5 MPa, respectively. It shows that plasma treatment has enhanced the LSS by 37.3%, 41.64% & 43.77% quantitatively compared to the pristine sample. However, the PT4 specimens exhibited the lowest LSS value of 17.7 MPa. This also correlates with the ultrasonic C-scan result shown in Figure 5(e), which demonstrated a highest attenuation level of 12-26 dB. The corresponding surface roughness value is of 180 nm which is also high compared to all the other specimens, inspite its contact angle of 15.7° and surface free energy magnitude of 74.41 mN/m The correlation between surface roughness and single-lap shear strength is shown in Figure 8. It can be concluded that the surface roughness above 100 nm mostly reduces the LSS magnitude along with an increase in ultrasonic attenuation. However, surface roughness value of 24, 35 and 50 nm exhibited a good lap shear strength above 20 MPa in the case of plasma-treated (single & double pass) samples. The comparison between surface roughness, the ultrasonic attenuation, and the respective lap shear strengths are summarised in Table 5. Clearly, one can observe a trend where the lap shear strength reduces with an increase in surface roughness value, and the same sample exhibits a higher attenuation value upon ultrasonic scanning. The standard deviation along with the LSS mean value is shown in the Table 5. LSS of different Plasma treated sample with pristine specimen. Surface roughness versus LSS. Effect of surface roughness on the lap shear strength.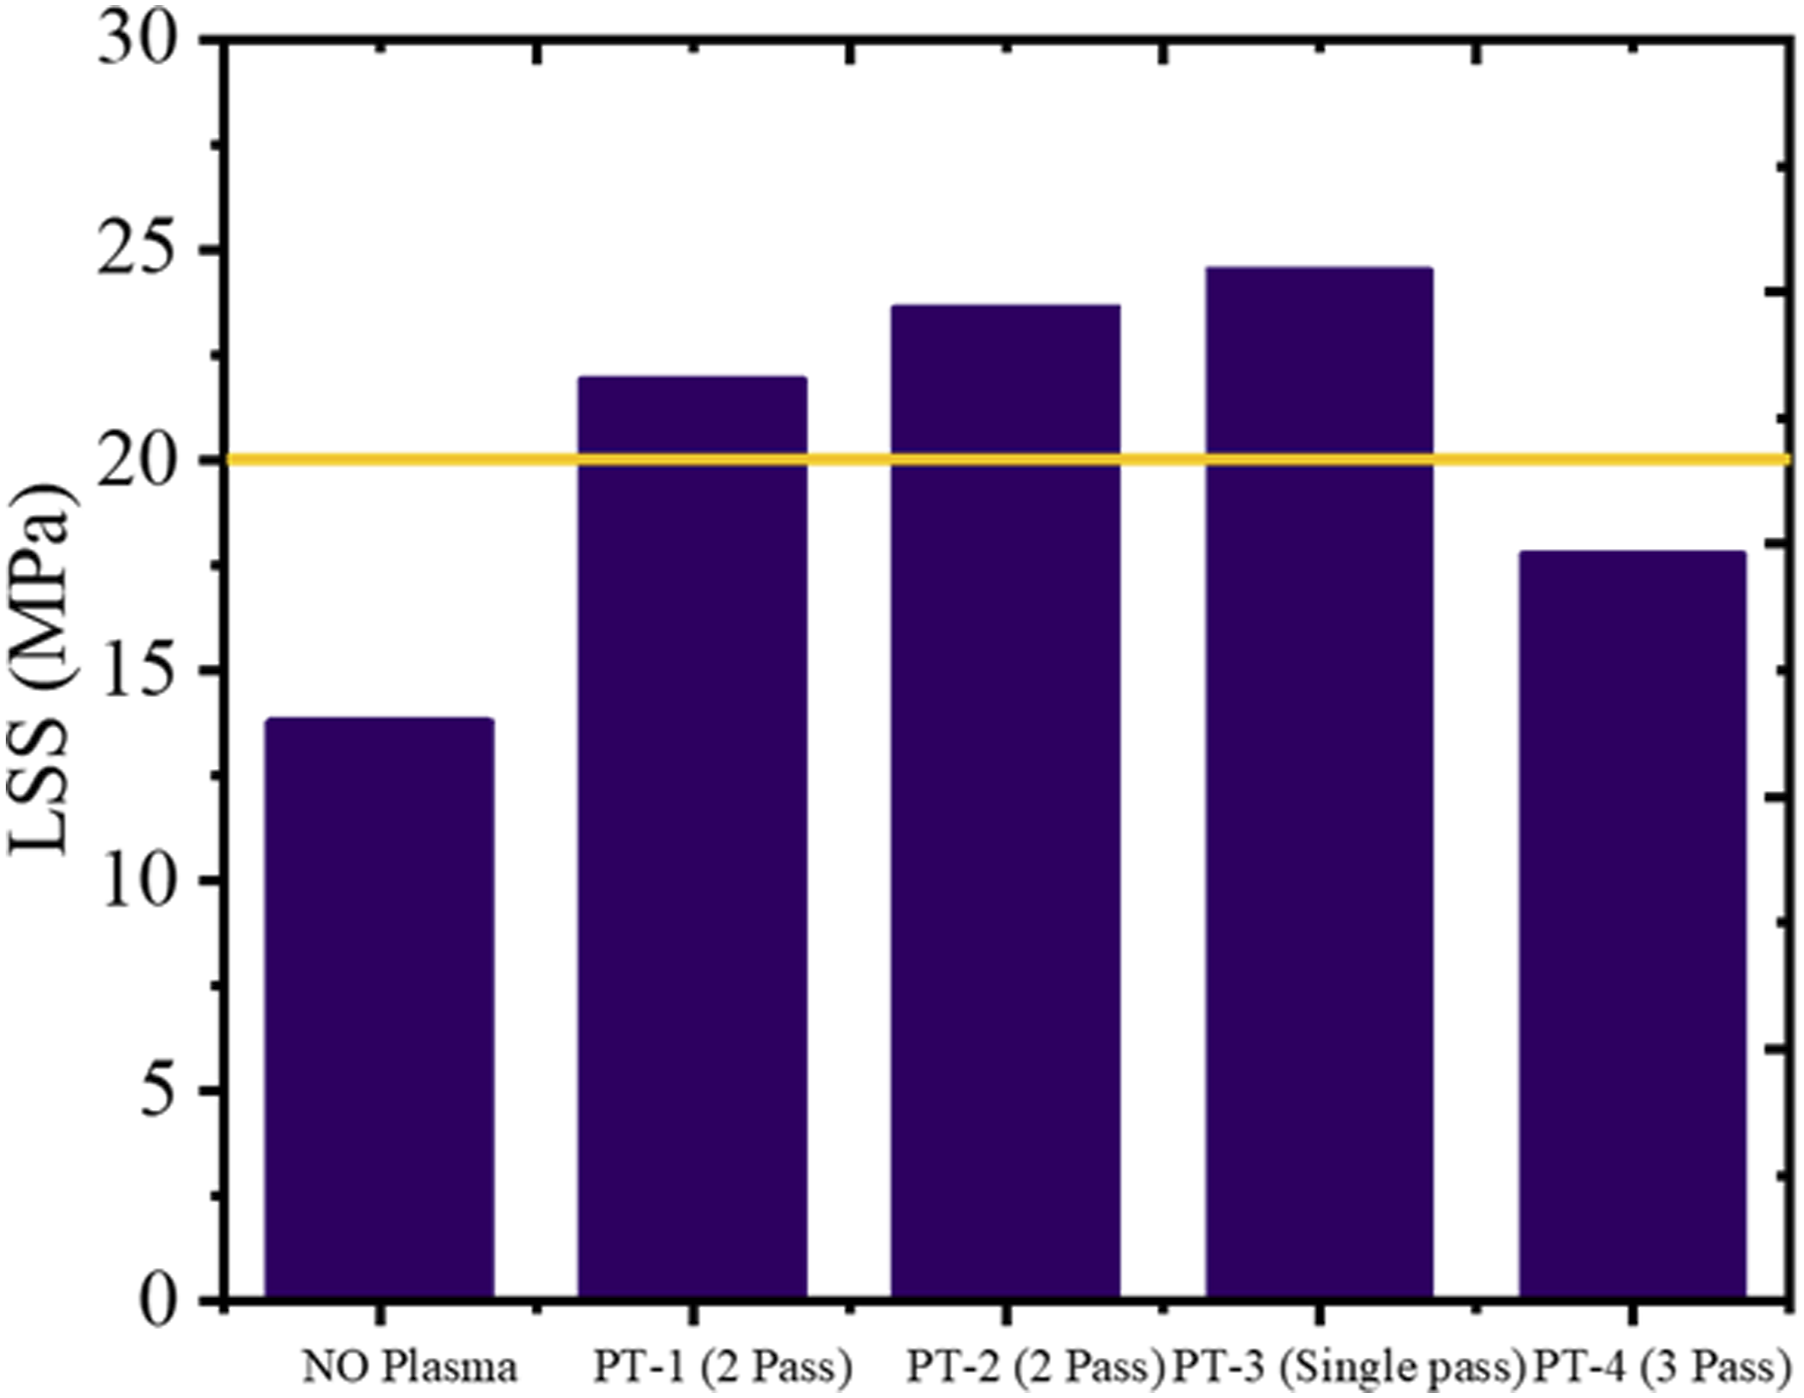
Effects of other adhesion parameters
Prime adhesion parameters verus SLSS.
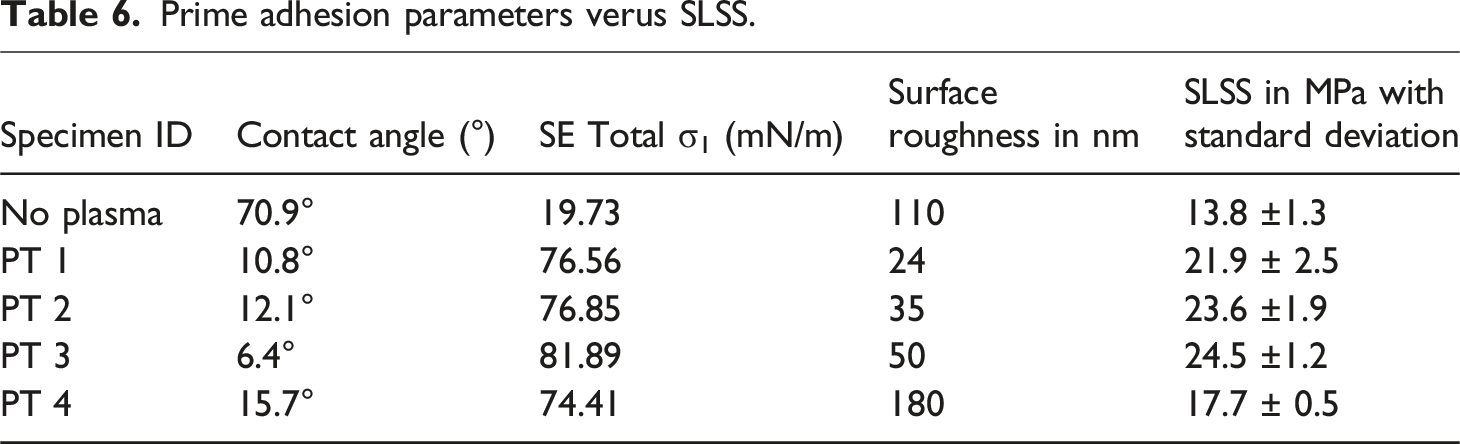
It is clear from Table 6 that the LSS of PT3 has a maximum magnitude of 24.5 MPa and one can see that a lower contact angle of 6.4° and higher surface free energy of 81.89 mN/m exhibited higher LSS compared to the other cases. Untreated specimens (No Plasma) exhibited as low as 13.8 MPa; the corresponding contact angle of 70.9° is the highest, and the lowest surface energy of 19.73 mN/m. PT 2 specimen’s contact angle is 12.1°, and its surface free energy is 76.85 mN/m, which gave us the second-highest LSS of 23.6 MPa. Interestingly, PT4 specimen’s contact angles measured 15.7° and the surface free energy 74.41 mN/m, but it is exhibited the second lowest LSS of 17.7 MPa due to fiber damage occurred during plasma treatment. It shows that any adhesive bonded joint, the contact angle should be as low as possible to ensure good wettability of adhesive. Surface free energies should be as high as possible, in particular, polar energy should be very high compared to the dispersion energy.
Effect of surface roughness, contact angle and surface energy
Figure 9 illustrates that surfaces exhibiting roughness values up to approximately 50 nm, with corresponding contact angles below 15°, achieved a lap shear strength (LSS) magnitude exceeding 20 MPa. The surface with a roughness of 50 nm demonstrated the maximum LSS of 24.5 MPa, which correlated with the lowest measured contact angle of 6.4°. As the surface roughness increased to 110 nm, the contact angle rose substantially to 70.9°, representing the highest value within this experimental set. This concurrent increase in surface roughness and contact angle resulted reduction in LSS to 13.8 MPa, indicating that excessive roughness and reduced wettability adversely affect the adhesive performance. Effect of surface roughness, contact angle on the lap shear strength.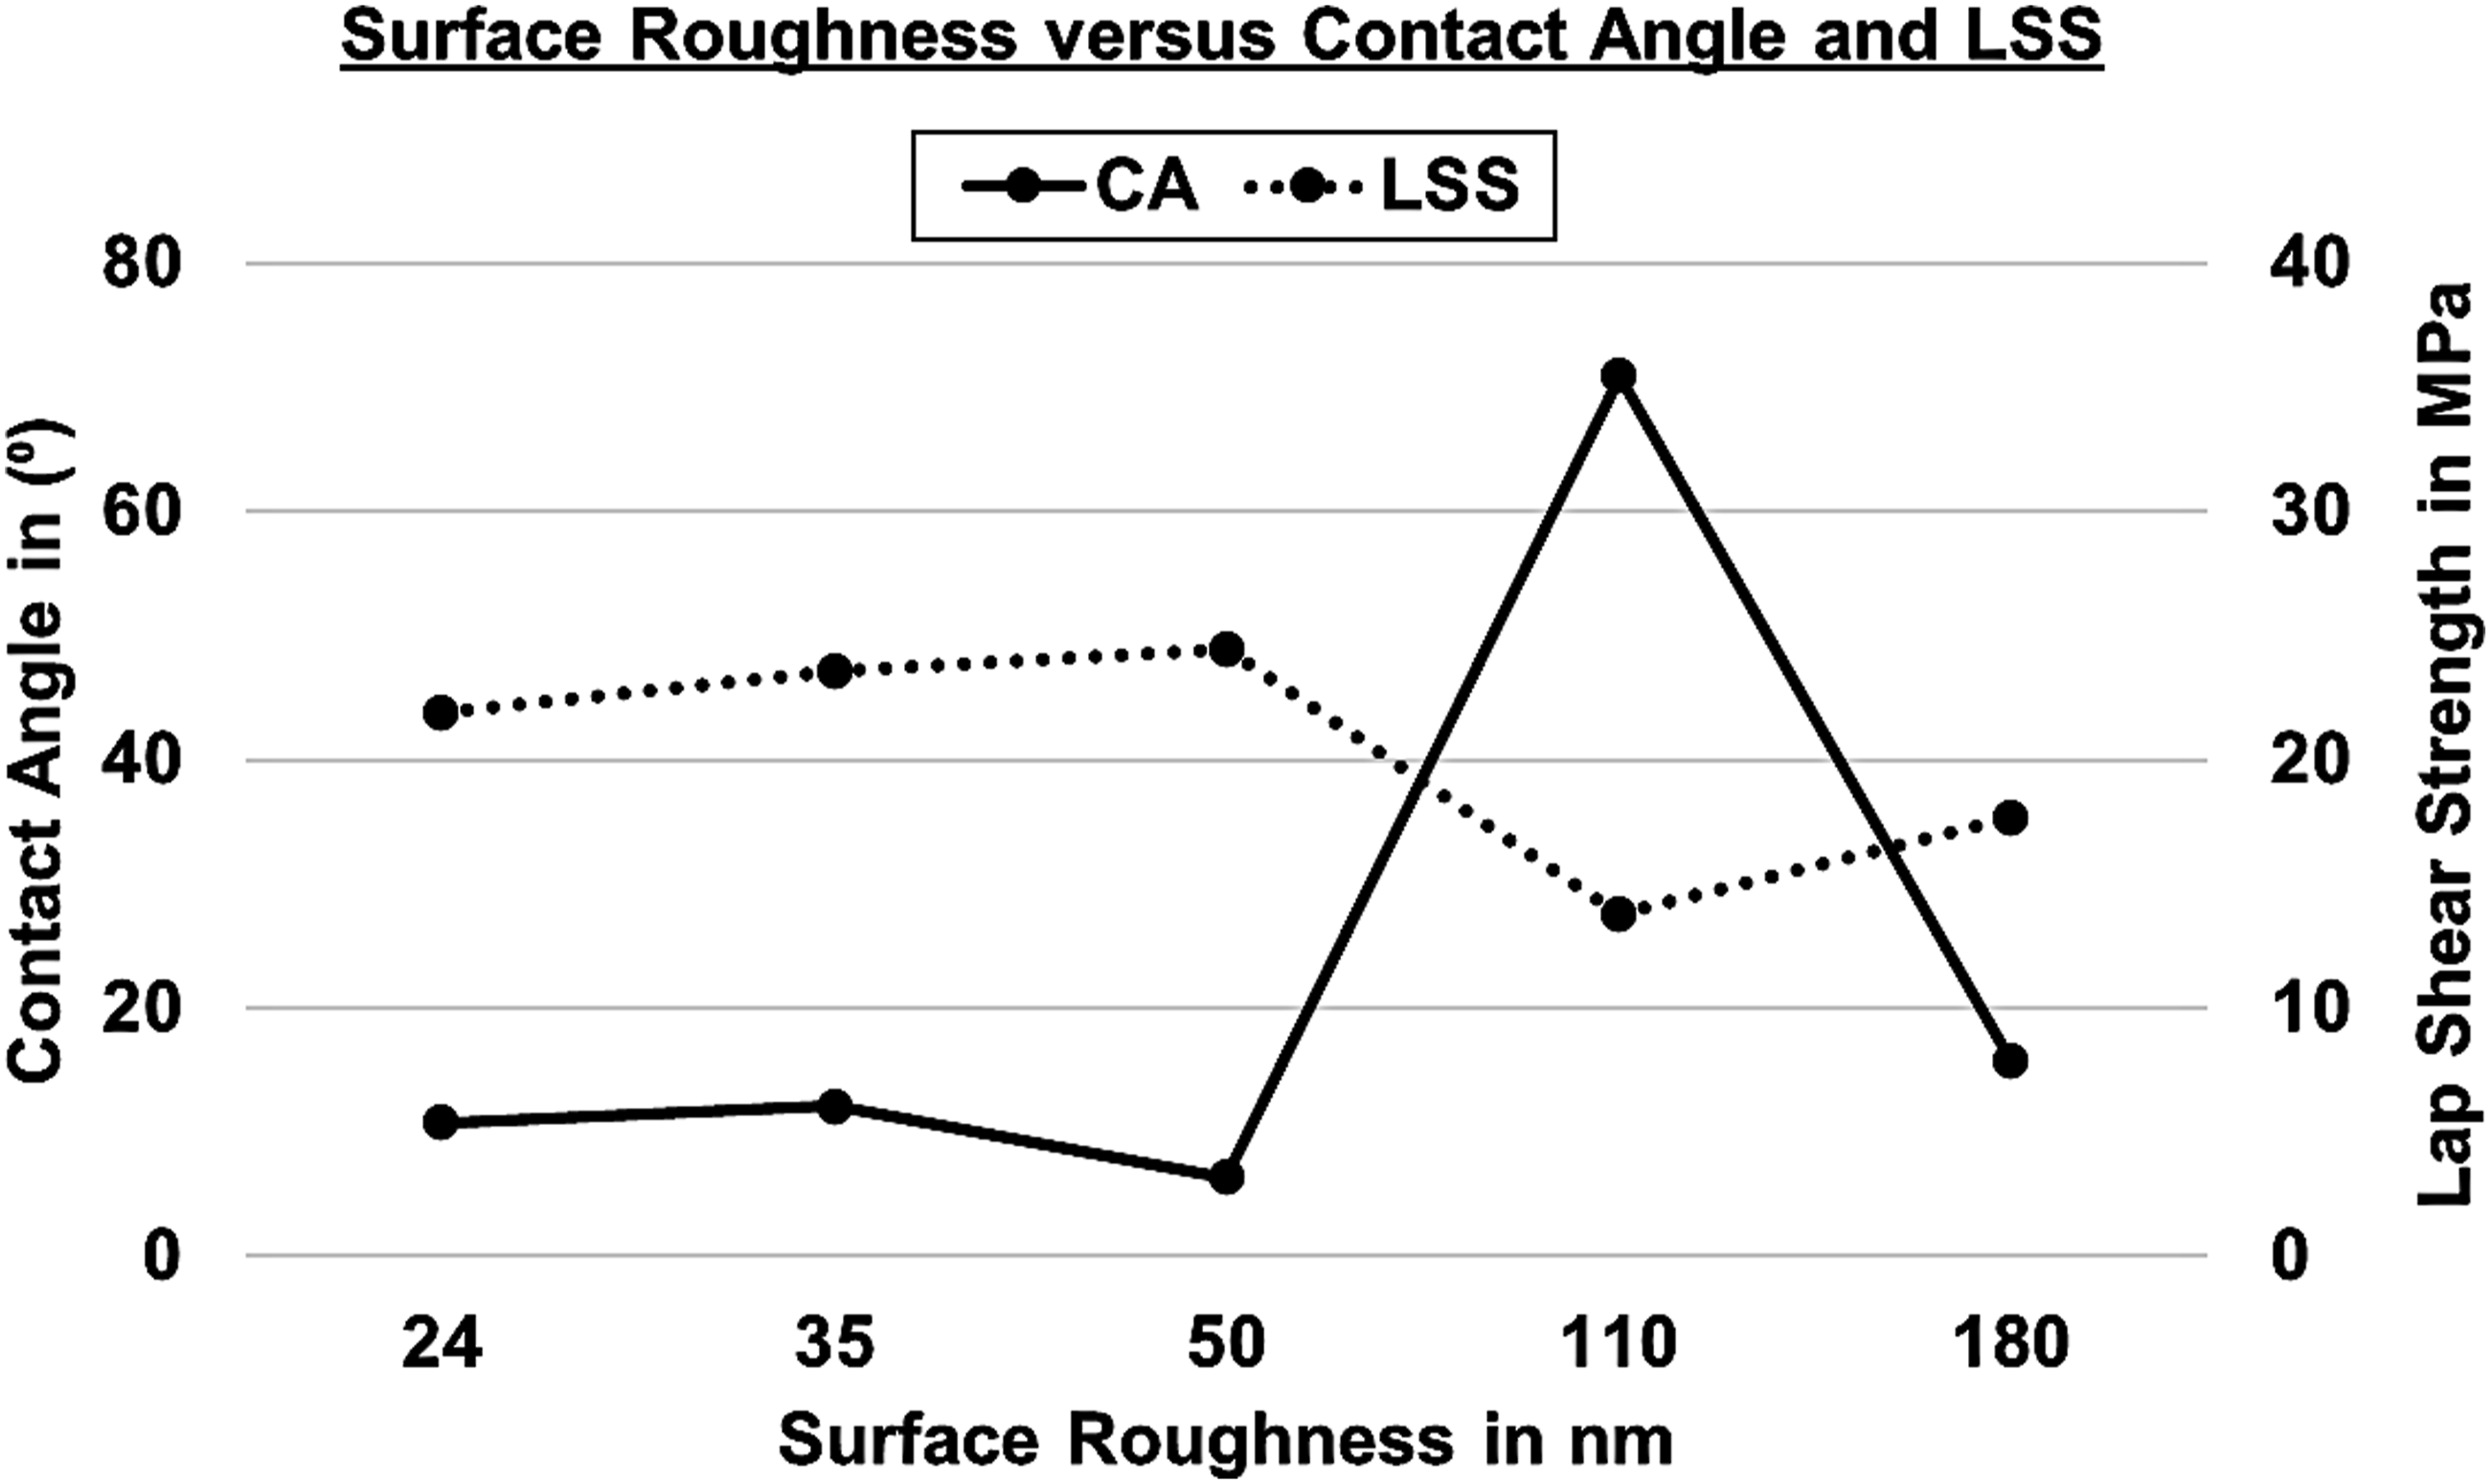
Similarly, surface energy exerts a significant influence on the adhesive bonding performance. As shown in Figure 10, an increase in surface energy directly correlates with an enhanced LSS magnitude. Surface energies above 75 mN/m and roughness below 50 nm achieved LSS values exceeding 20 MPa, indicating that improved wettability promotes stronger adhesive interactions at the interface. Conversely, when the surface energy decreased to approximately 20 mN/m, the LSS greatly reduced to 13.8 MPa, corresponding to a roughness of 110 nm. Notably, even though the surface with a roughness of 180 nm exhibited a higher LSS than the 110 nm surface roughness specimen, owing to its relatively high surface energy of 74.14 mN/m. This observation highlights that, while excessive roughness can hinder adhesion, maintaining sufficiently higher surface energy can partially offset the adverse effects of increased roughness, thereby sustaining better interfacial bonding. Effect of surface roughness, Surface energy on the lap shear strength.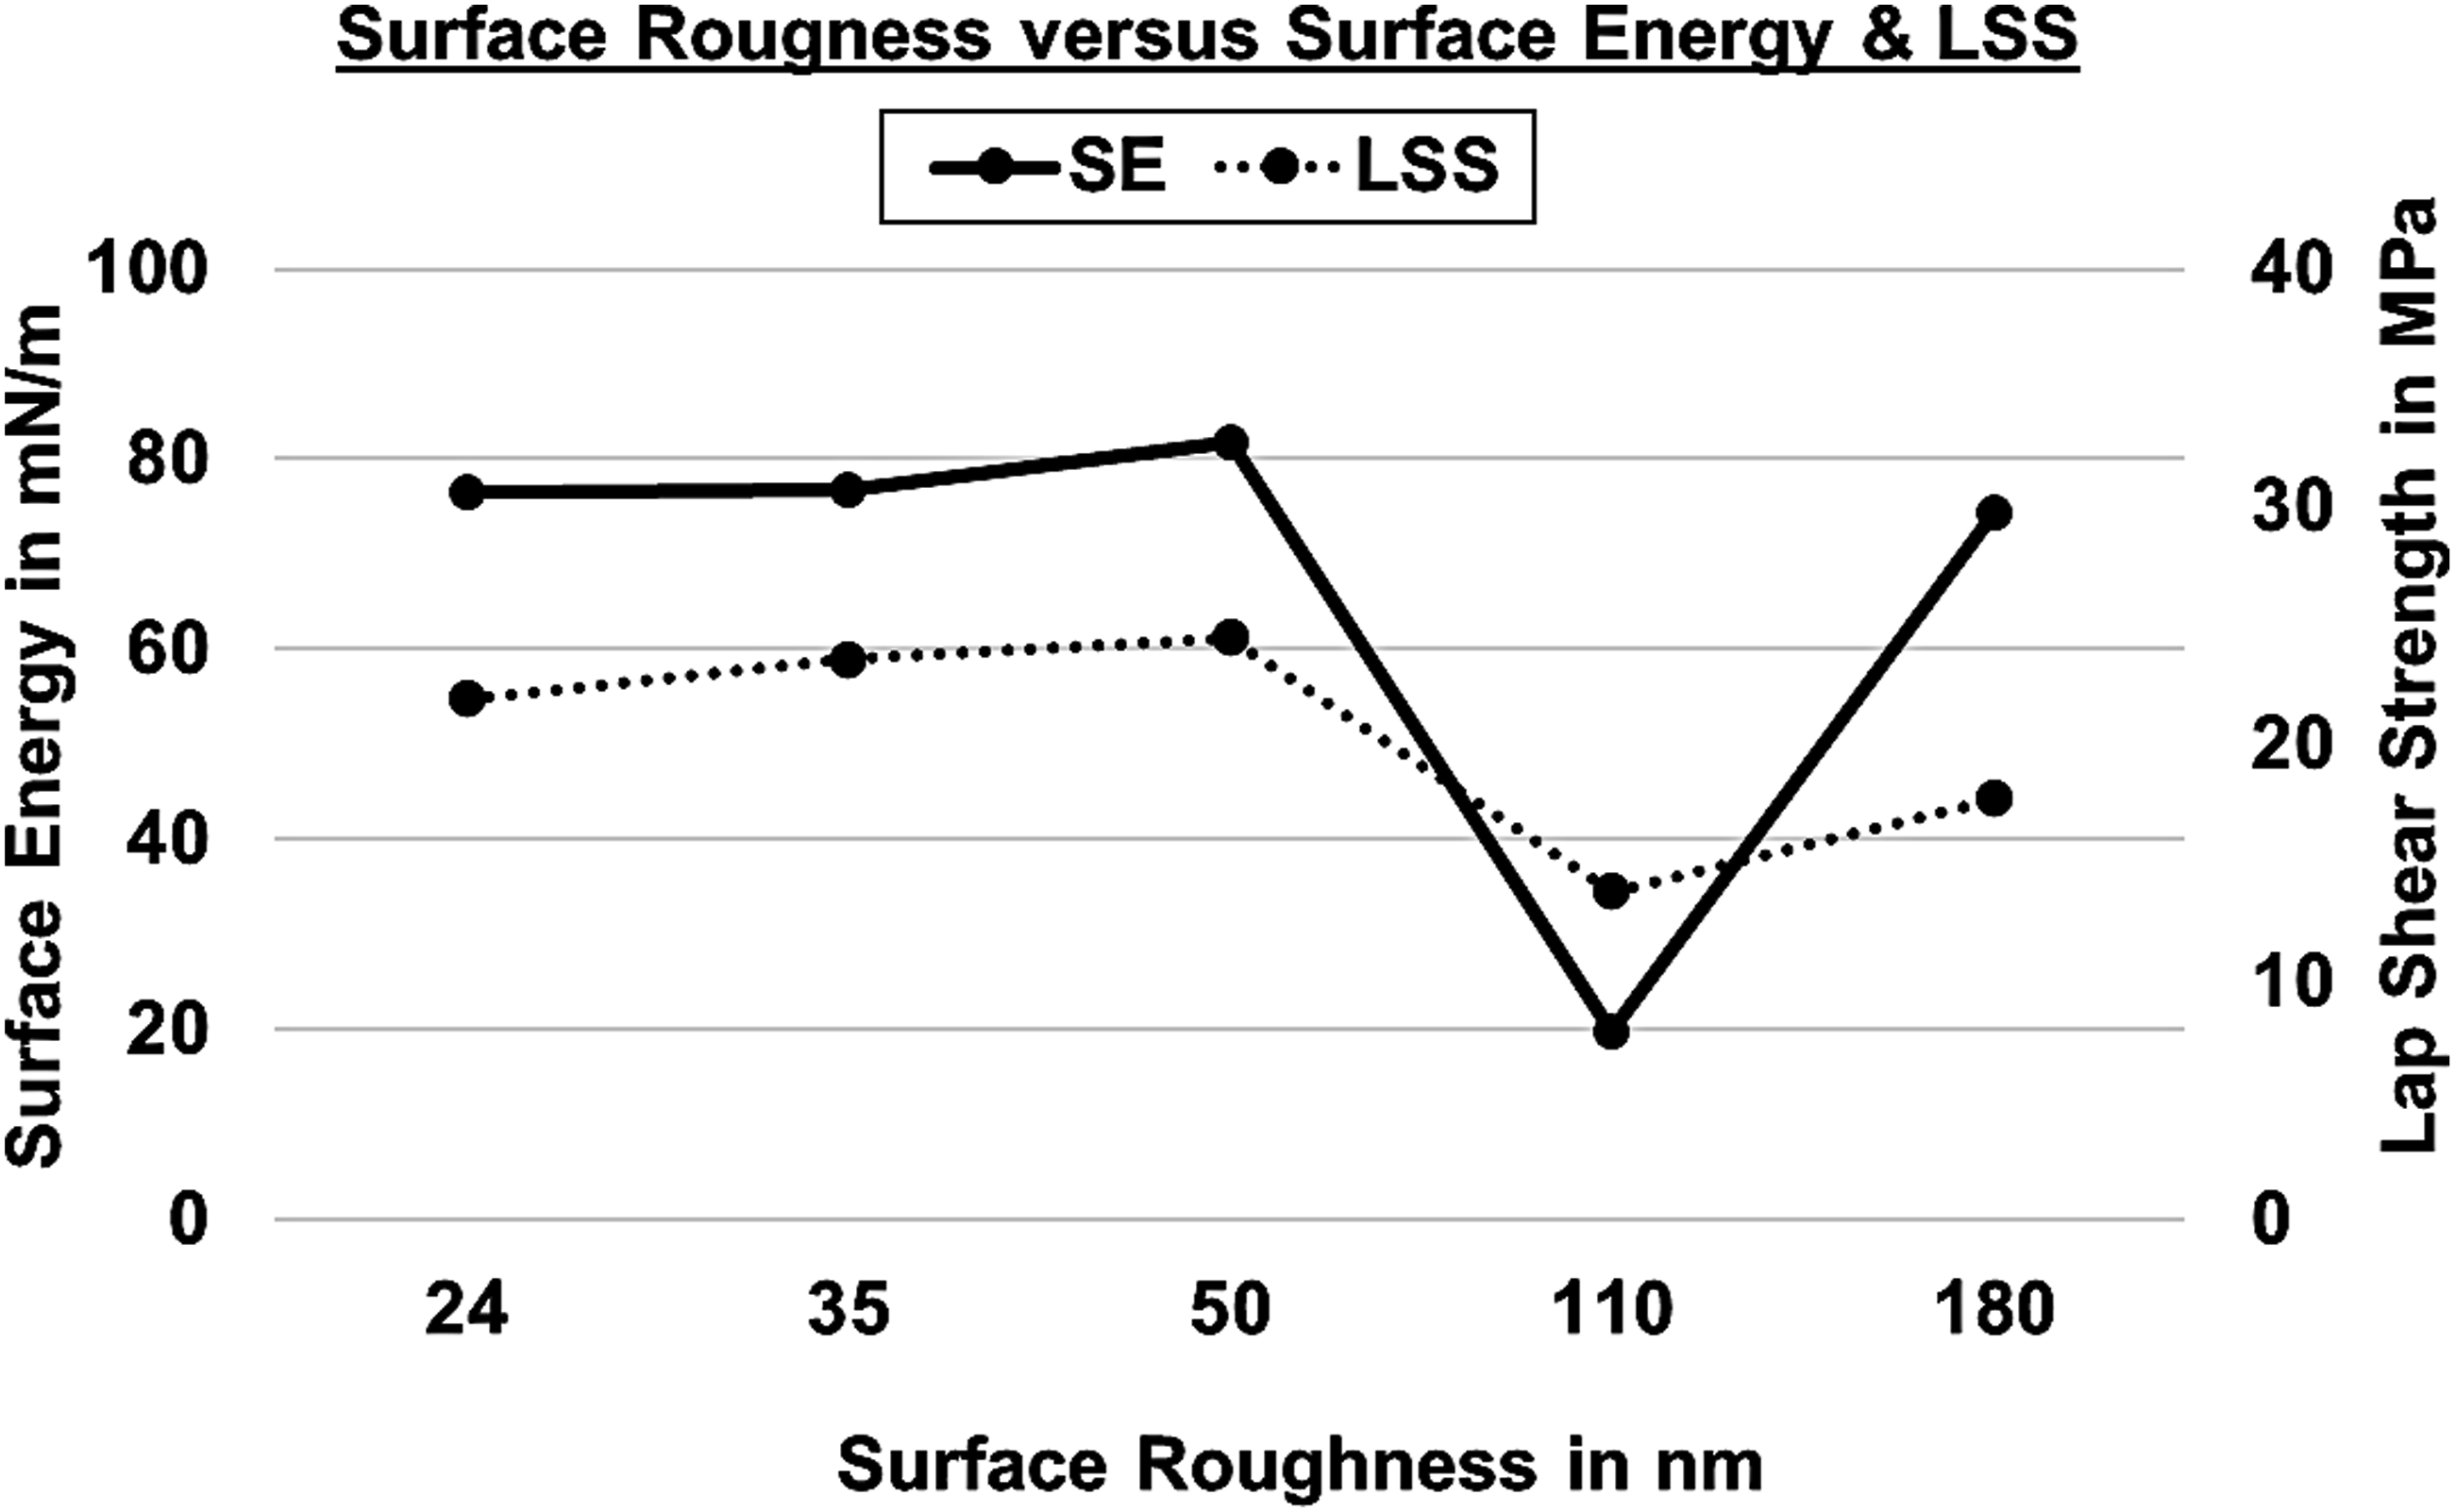
Multifactor interaction of bonding process variables
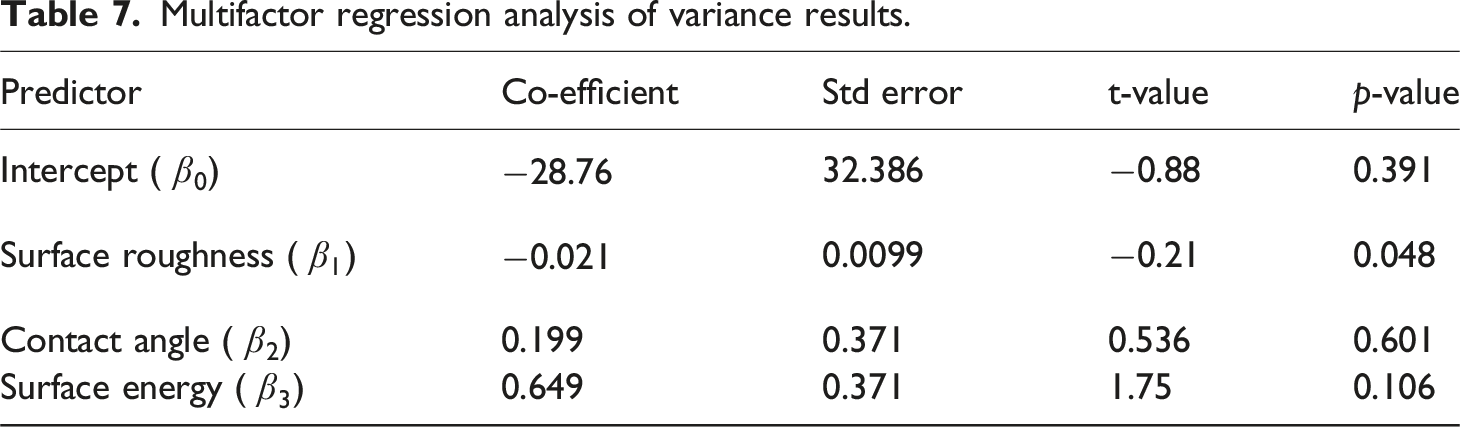
A multifactor linear regression analysis was carried out using three independent variables (Surface roughness, contact angle, and surface energy) and one dependent variable (Lap shear strength) in MATLAB. This model was used to predict lap shear strength from three surface-related process parameters. Three independent variables in the multiple linear regression model is written as equation (2) y: Dependent variable ε: Random error term
Multifactor regression analysis of variance results.
Overall model statistics.
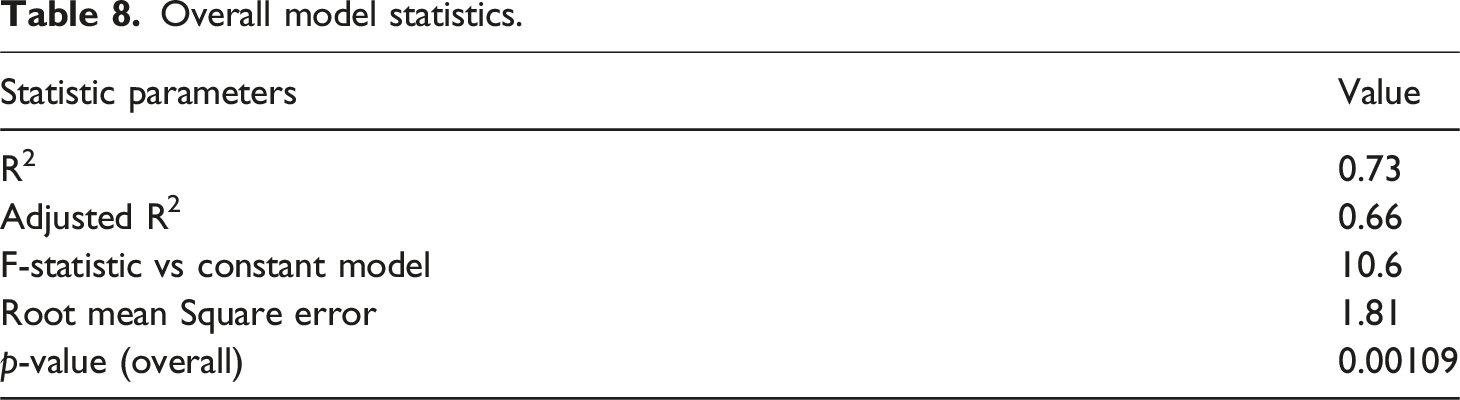
Since the overall model had p < .05, the model was considered significant despite a few individual coefficients being statistically weak due to the small sample size. Otherwise, the contact angle and surface energy alone were not strong individual predictors. Further Q–Q (Quantile–Quantile) analysis was carried out, and a residual plot was generated to assess the normality assumption, as shown in Figure 11. This analysis also helped identify skewness, heavy tails, or outliers in the residuals. Figure 11 shows that most data points lie close to the 45° line, indicating that the residuals were approximately normally distributed. Minor deviations at the extremes suggested potential outliers; however, the overall model assumptions were satisfied, and the regression results were deemed reliable. Q-Q plot of regression residuals.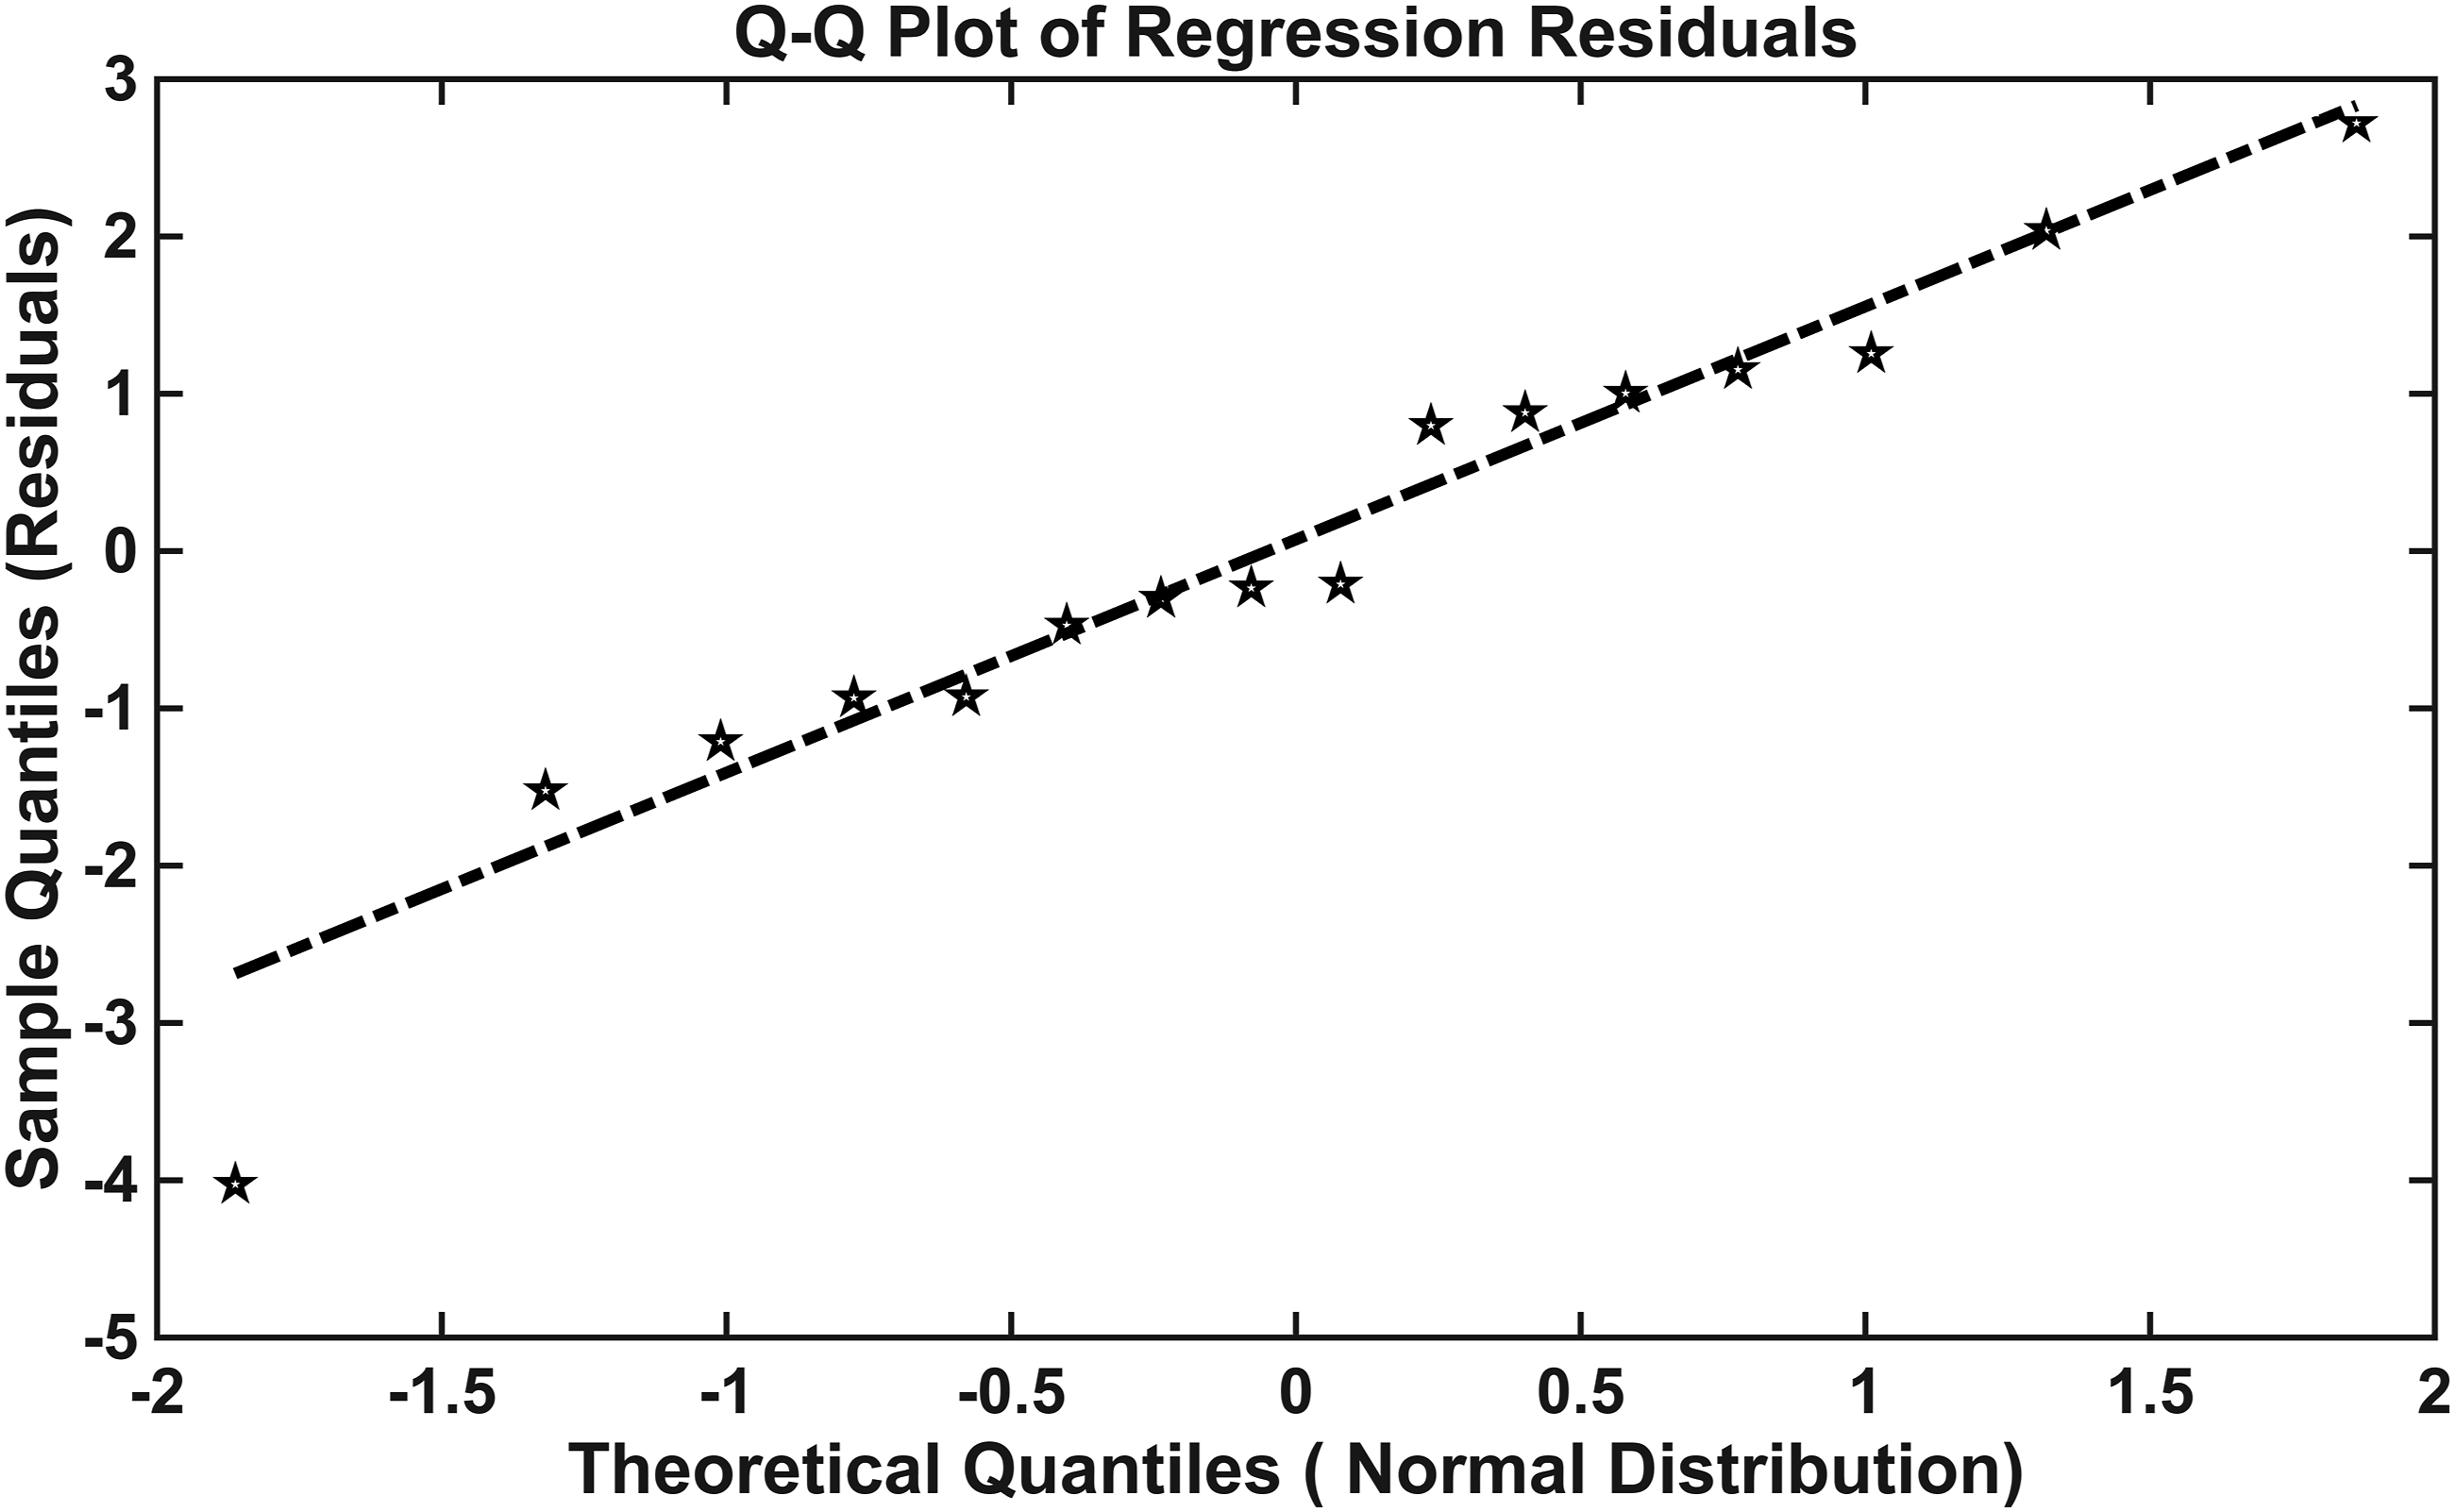
The regression model was further assessed by plotting the predicted lap shear strength values against the observed experimental data, as shown in Figure 12. Most experimental data points lie close to the 45° line, indicating a good correlation between the model predictions and the experimental results, except for a few outliers. This confirmed that the model effectively captured the combined effects of surface roughness, contact angle, and surface energy on the lap shear strength of the composite joints. These results substantiated the robustness of the model in explaining the variability inherent in adhesive bonding performance. Minor scatter around the fitted line could be attributed to experimental uncertainties, inherent material variability, and other process conditions such as autoclave temperature, vacuum level, heating/cooling rates, and specimen size variations. Scatter plot of Actual and predicted Lap Shear Strength.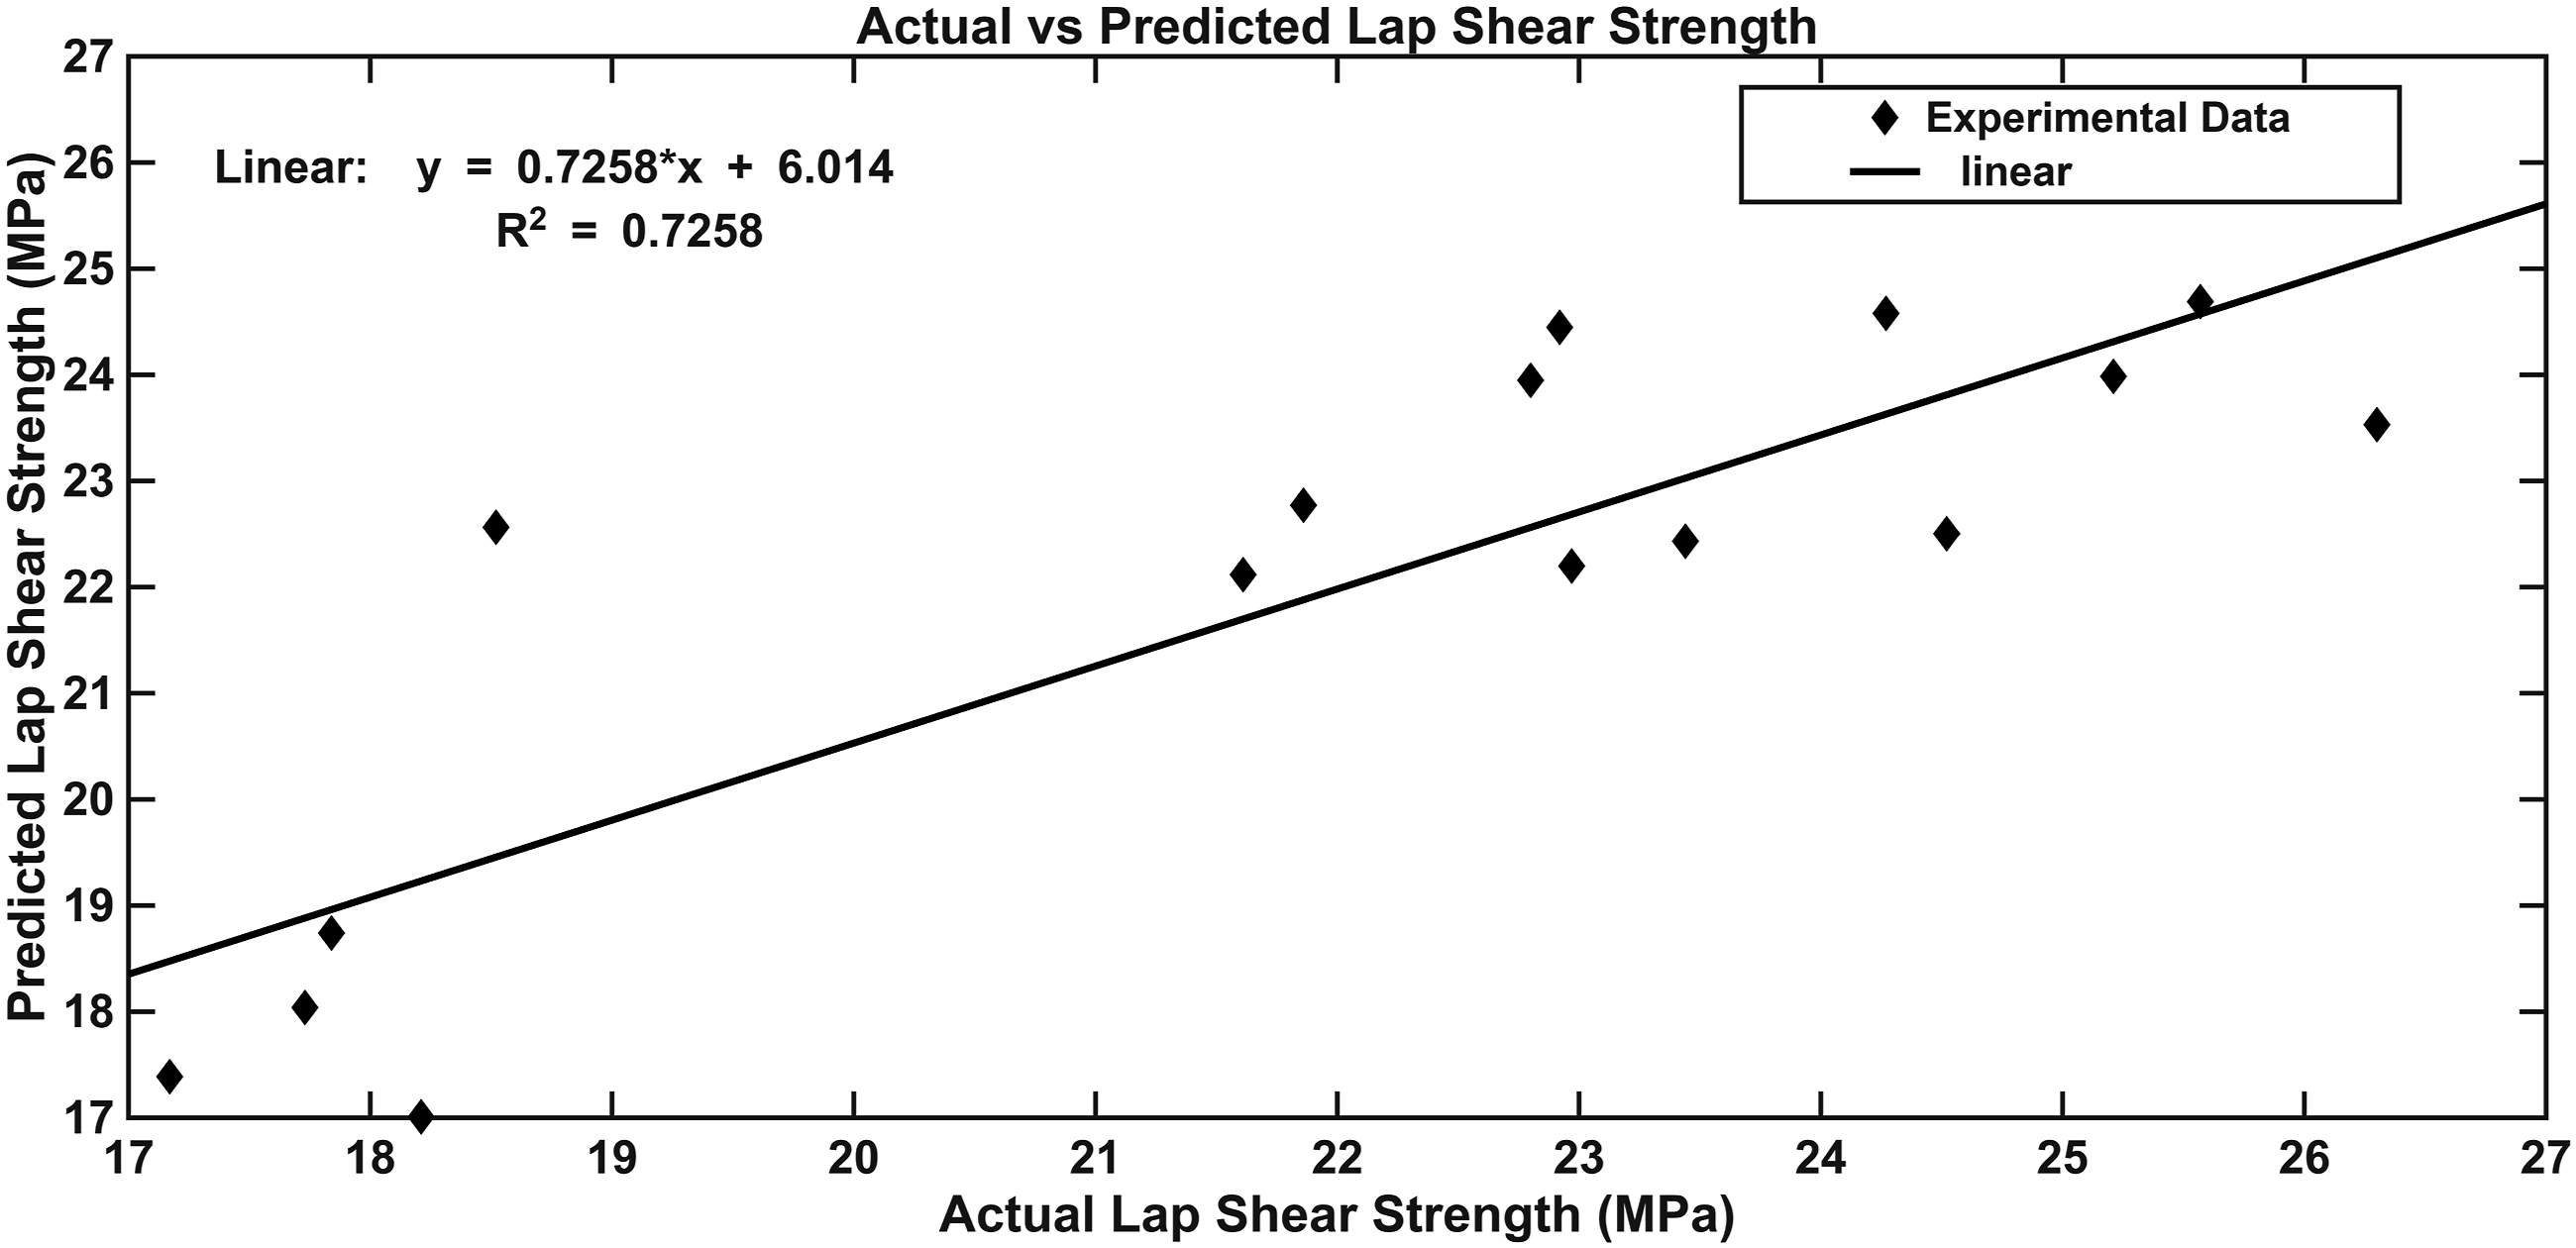
Failure mode and failure mechanism of joints
Adhesive-bonded joints typically fail in one of the three modes: adhesive failure, cohesive failure, or adherend failure, which are dictated by the forces involved in the bonding process. Adhesive failure occurs when the surface energy of the adherends bonding surface is lower than that of the adhesive itself, leading to a failure at the adhesive interface. Insufficient surface cleaning can also contribute to adhesive failure. Cohesive failure, on the other hand, occurs within the adhesive layer due to internal stresses surpassing the adhesive’s cohesive strength, resulting in separation within the adhesive itself. Adherend failure is attributed to inadequate preparation or properties of the adherend material, causing failure in the adherend sub-laminate over the overlap region. Figure 13 illustrates the different failure modes observed in the samples considered in this work. Figure 13(a) shows the untreated sample case as the baseline sample. Failure modes of plasma-treated (PT1) samples are shown in Figure 13(b). One of the samples failed 100% cohesively, while the other showed 90% cohesive, and 10% adherend failure. Plasma-treated samples PT2, PT 3, and PT4 failure modes are shown in Figure 13(c)–(e). The PT2 and PT4 samples failed 90% cohesively and 10% adhesively as shown in Figure 13(c) and (e). Adhesive failure is approximately 40% due to the localized disbonds/porosities present in the joint, as shown in Figure 13(a) and (d). However, both come under mixed mode of failures. PT 3 samples failed in a mixed mode manner like 60 % cohesively and 40% adhesively, which exhibited maximum lap shear strength. figure 13(d) shows that 40% of the adhesive did not properly bond over one of the adherend in the mid region but adequately bonded near the overlap edges, which is clearly seen in the ultrasonic C-scan result. These are kind of mixed mode failures are observed in the literature occurring for a single lap specimen. Based on the failure modes of the joints, it is evident that higher cohesiveness in the joint results in a higher load-carrying capacity comparatively. Cohesive failures show that the interface adhesion force is stronger than inherent adhesive force. Some cohesively failed specimens are also witnessed with the resin carrier cloth, which indicates qualitatively good adhesive bonding being achieved. Failure modes of plasma-treated and untreated adhesively bonded thermoplastic CFRP specimens: a) Untreated samples failure modes of SP 3&4, b) Failure modes of PT 1 of *SP 1&4, c) Failure modes of PT 2 of SP 4, d) Failure modes of PT 3 of SP 4, e) Failure modes of Plasma Treated (PT 4) of SP 3. (*SP = Specimen).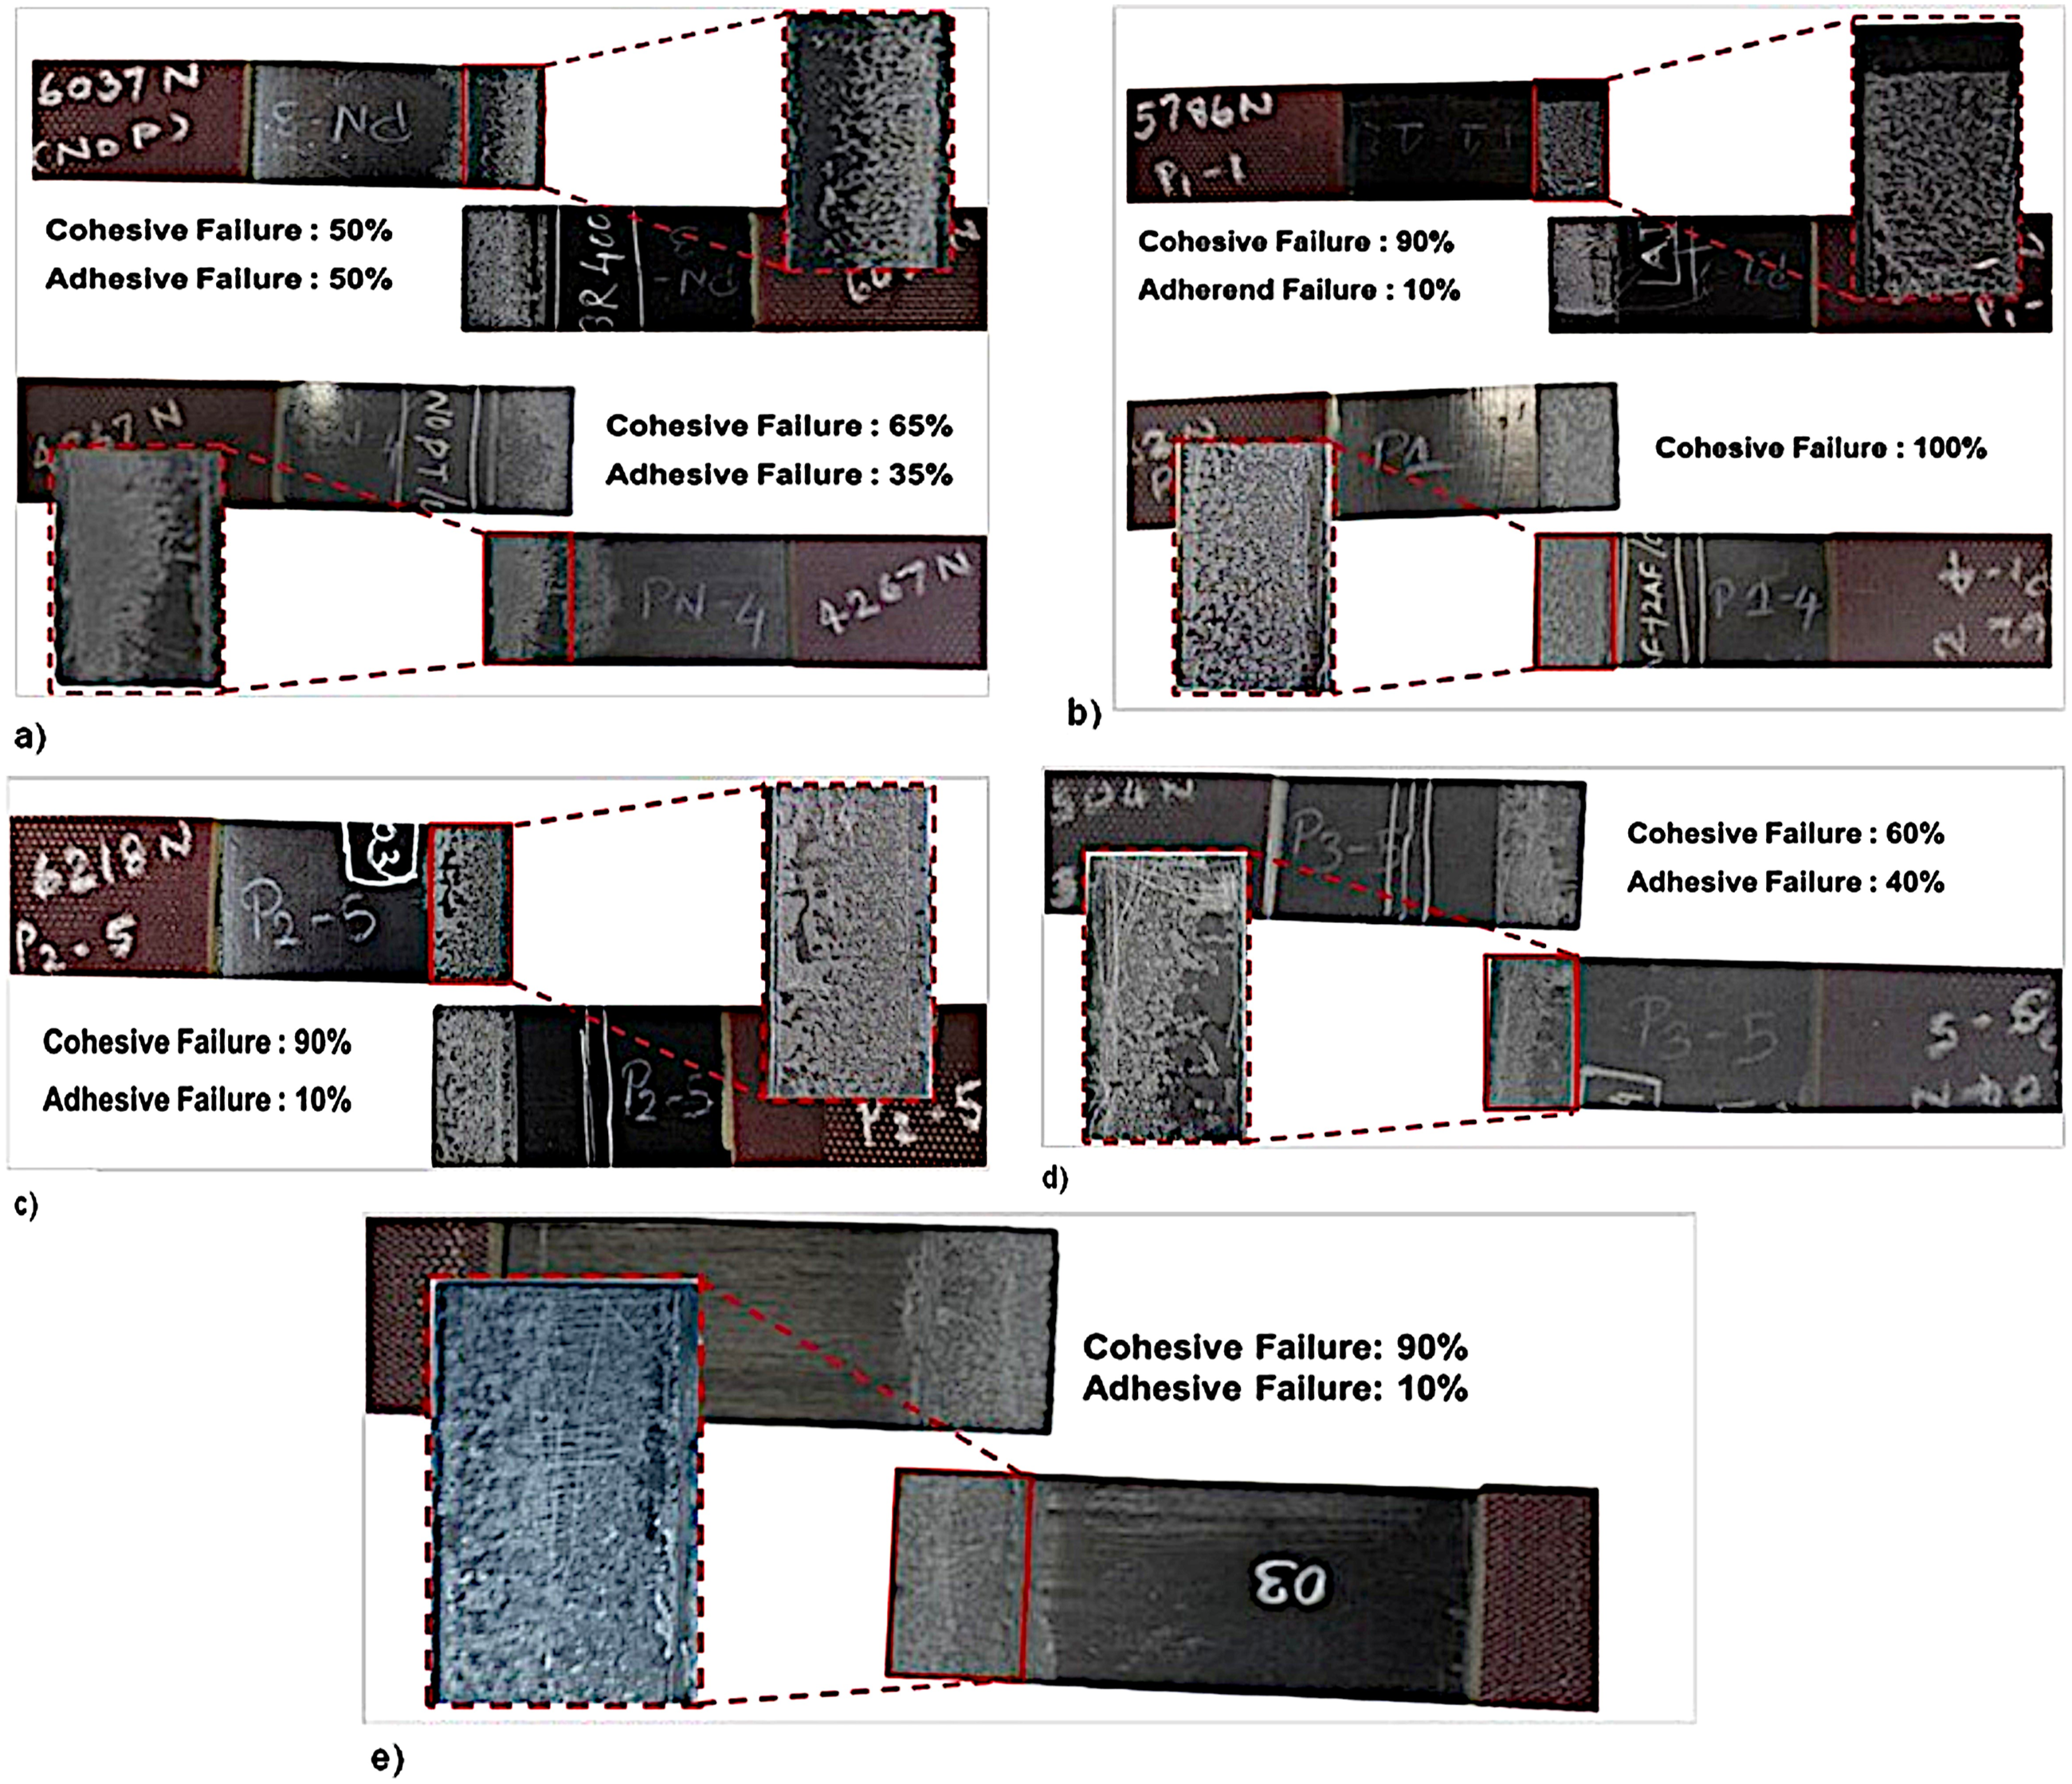
Fractographic analysis
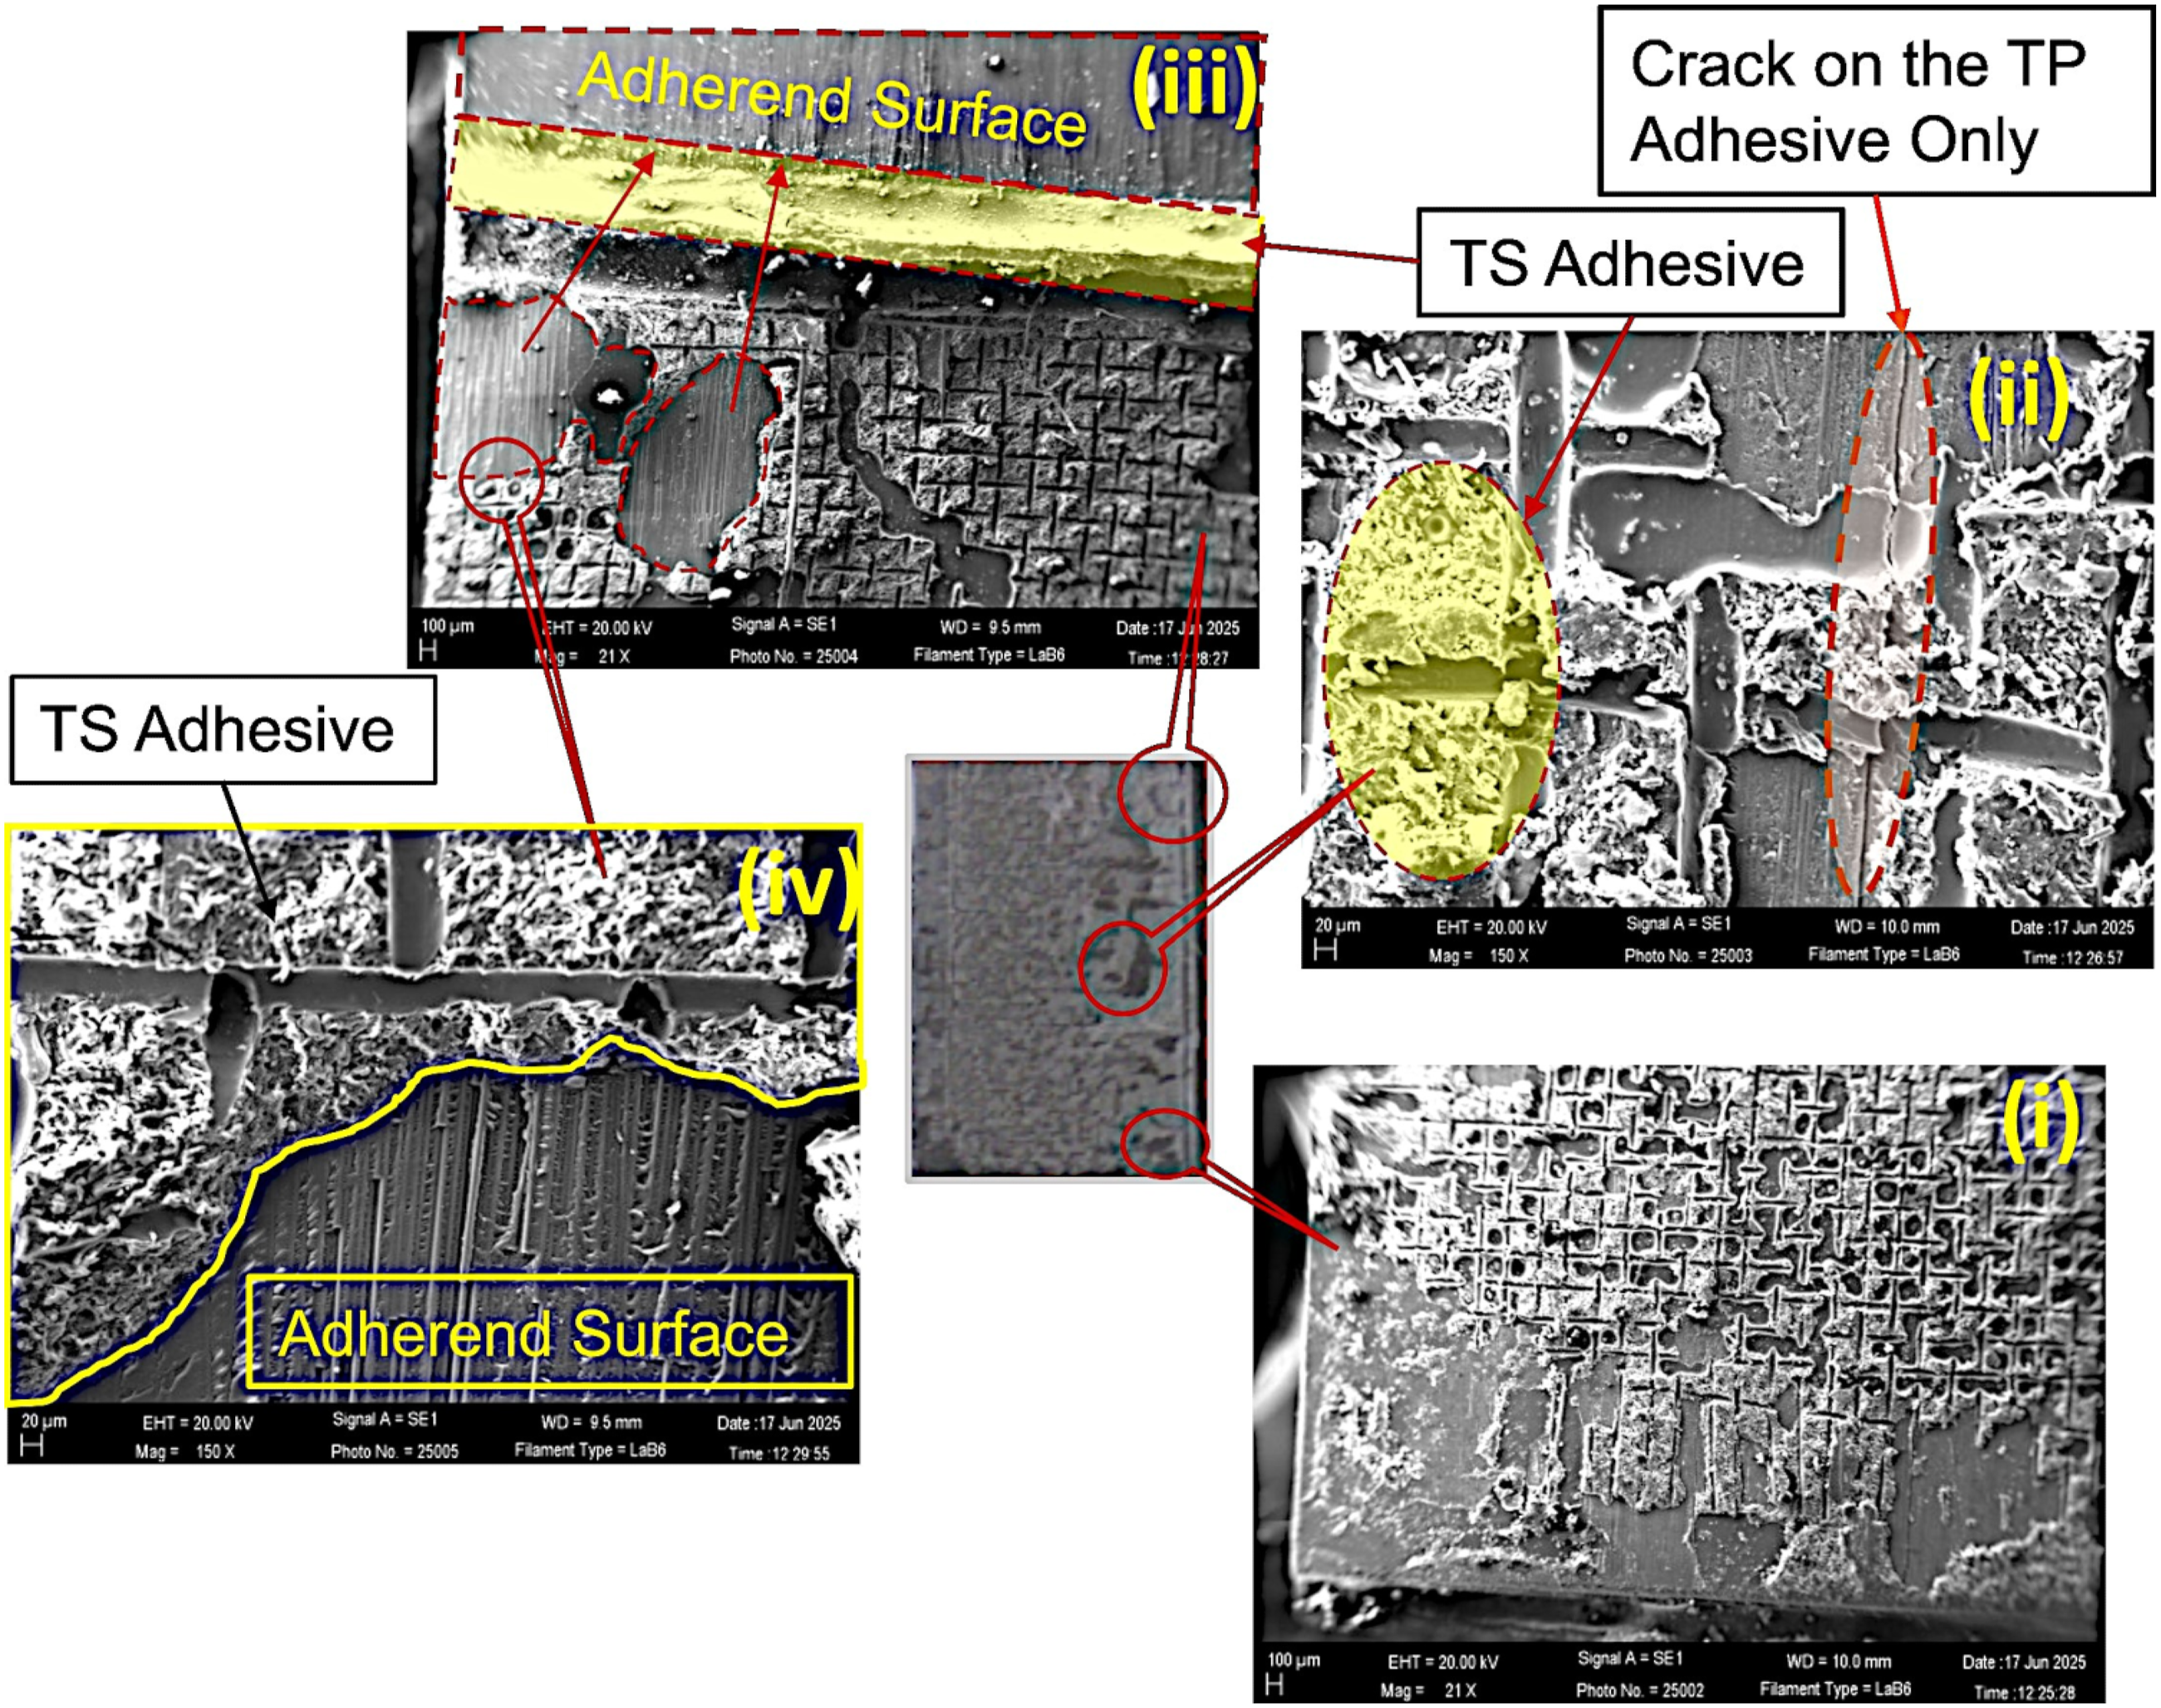
The SLJ failure surfaces were gold-sputtered under vacuum using a Jeol Fine Coat Ion Sputter JFC 1100, with the gold coating thickness maintained between 500 and 600 Å. The fracture surfaces of the SLJ specimens were then examined using a scanning electron microscope (SEM: ZEISS EVO 18, Carl Zeiss NTS Ltd) to classify the fracture morphology of the reinforcement fibers. The SEM system accommodated specimens up to 250 mm in diameter and 145 mm in height, with a motorized stage travel of 125 × 125 × 50 mm (XYZ). Figure 14 shows the micrograph of the fractured surface of the untreated sample, which exhibited the lowest load-carrying capacity. This reduced strength was attributed to poor adhesive bonding over the overlap region. As seen in Figure 14(ii) and (iii), the thermoset (TS) adhesive did not diffuse into the scrim mesh, leaving the surface largely pristine, consistent with the high contact angle of 70.9° measured for the untreated adherend. The high contact angle resulted in inadequate adhesive wetting. The scrim cloth of the thermoset adhesive remained visible on the fracture surface, confirming insufficient bonding between the TS adhesive and the thermoplastic adherend. The absence of adhesive diffusion into the adherend surface, as shown in Figure 14(i)–(iii), contributed to the 35% adhesive failure observed in this sample, with the remaining portion attributed to cohesive failure. SEM Micrograph of the untreated sample failure surface:: (i) Partially adhesive failure, (ii) & (iii) Dry patches, (iv) Scrim Cloth with TS adhesive.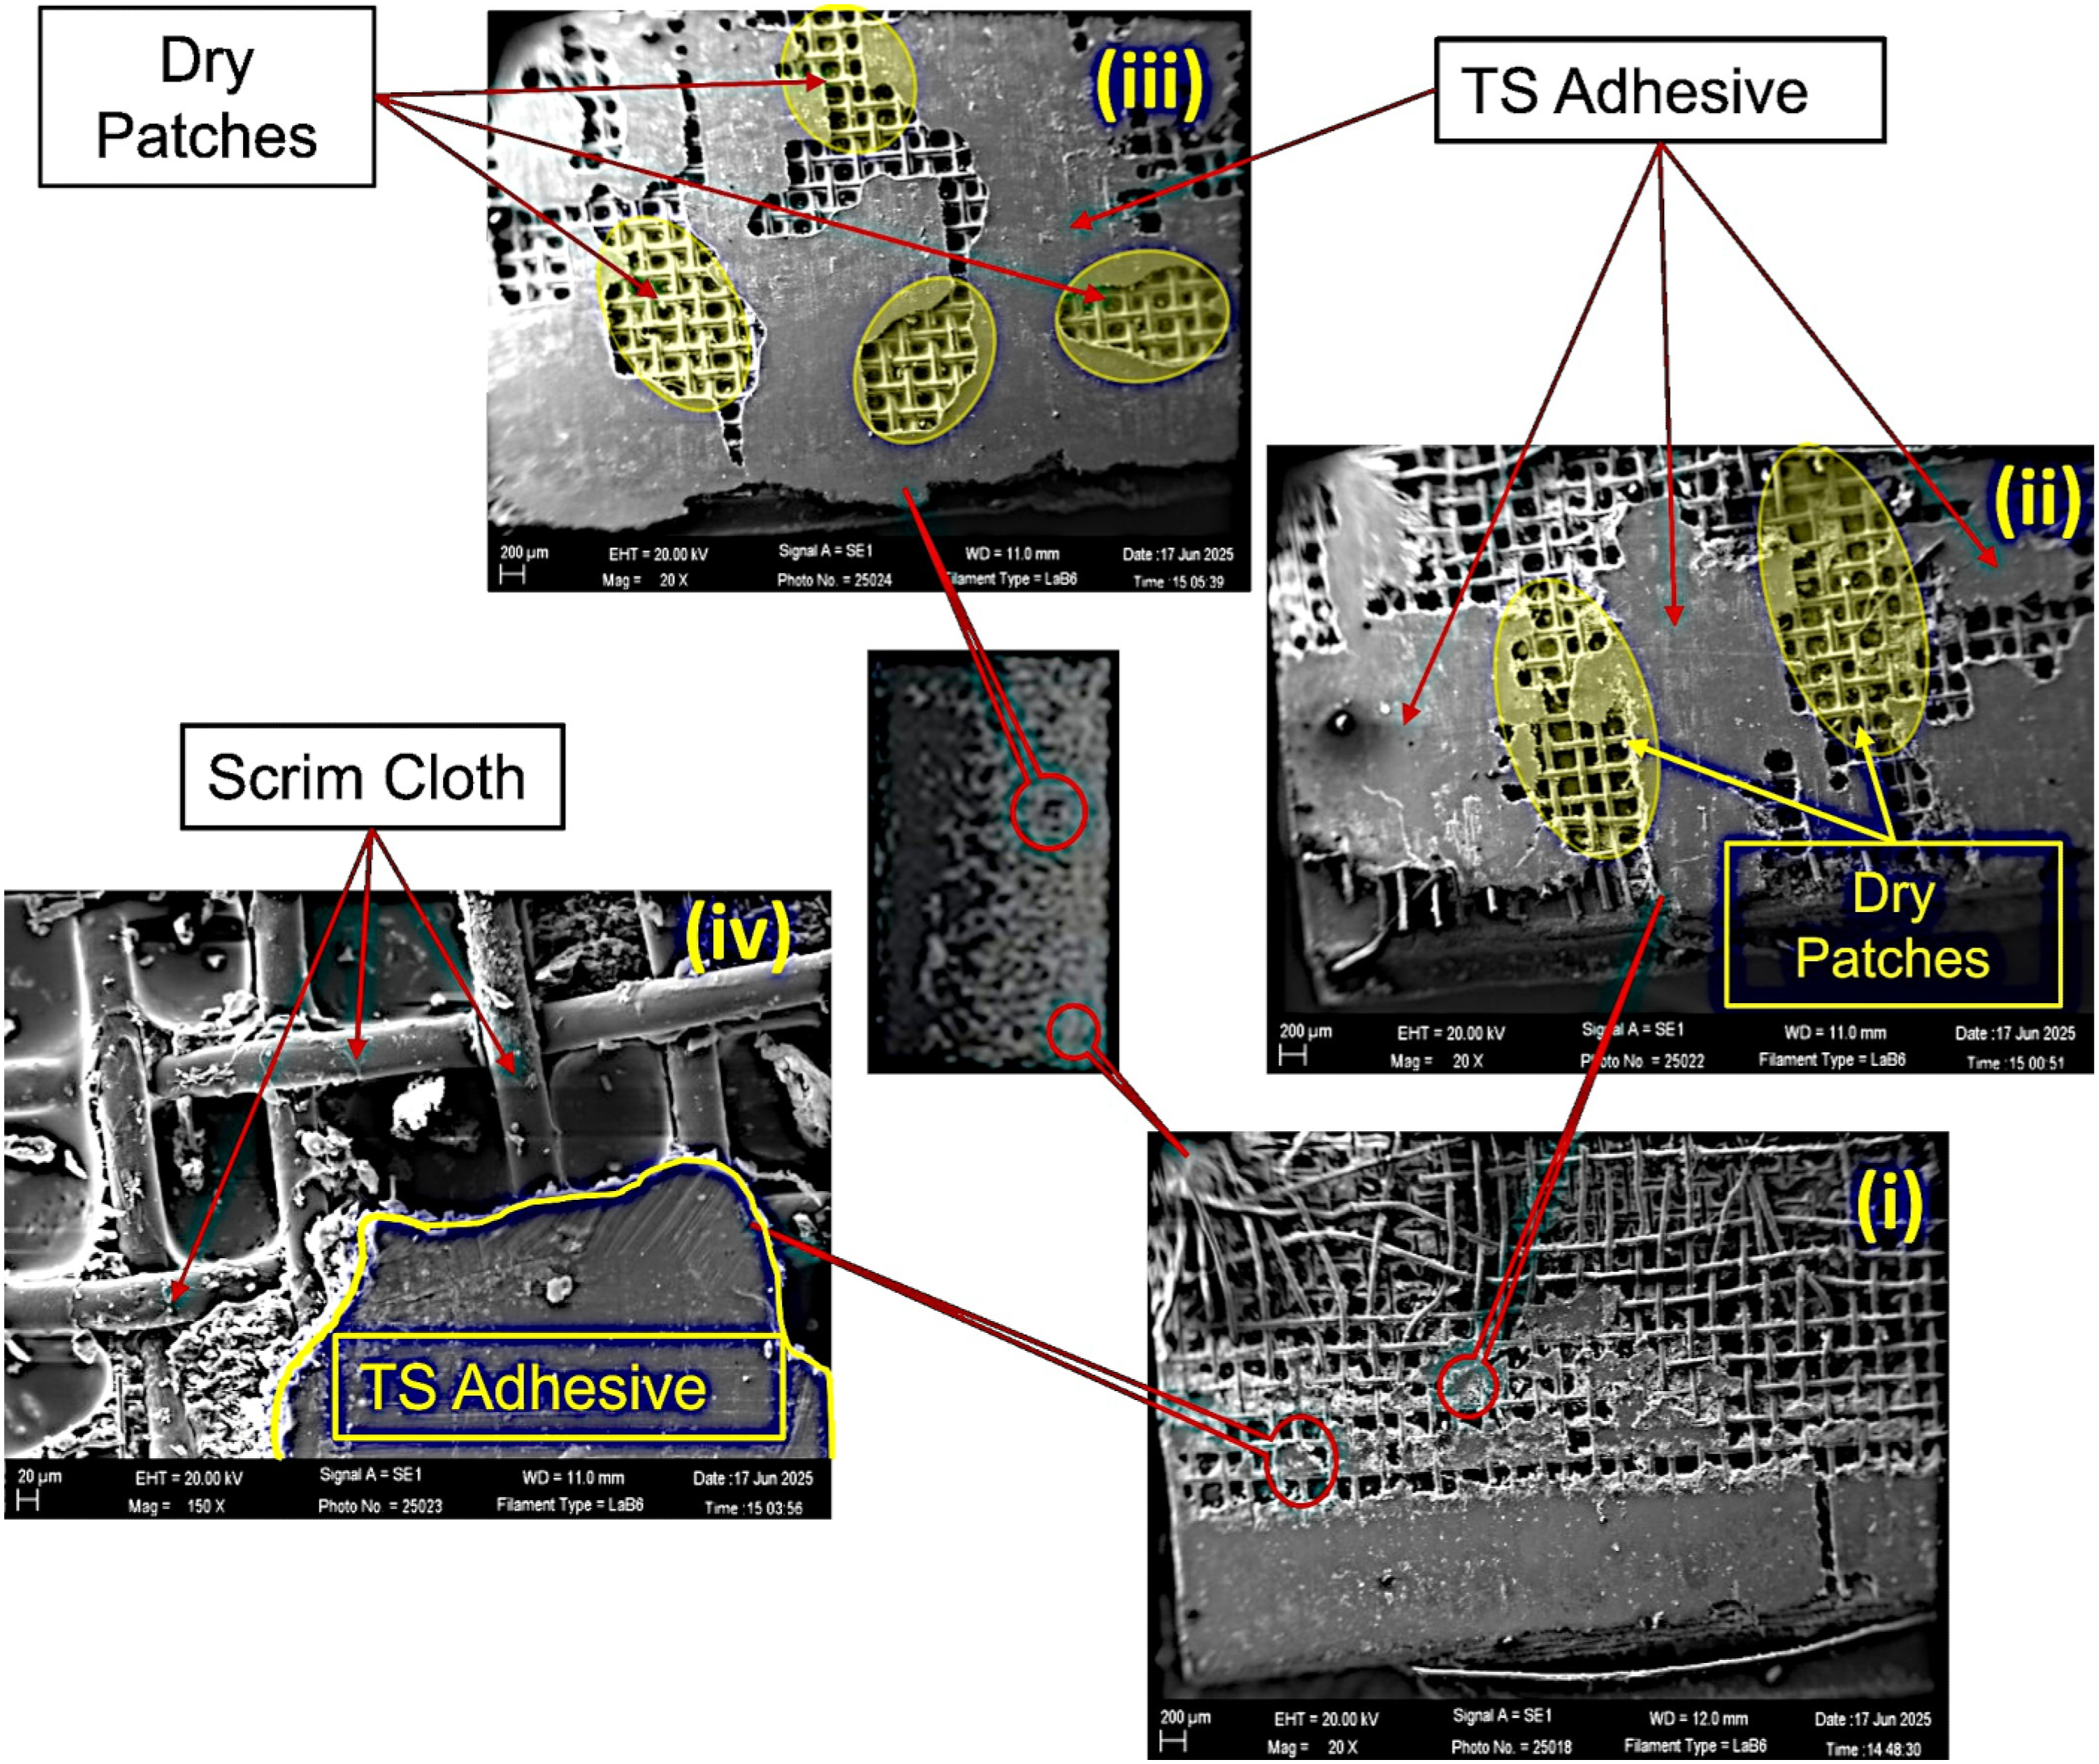
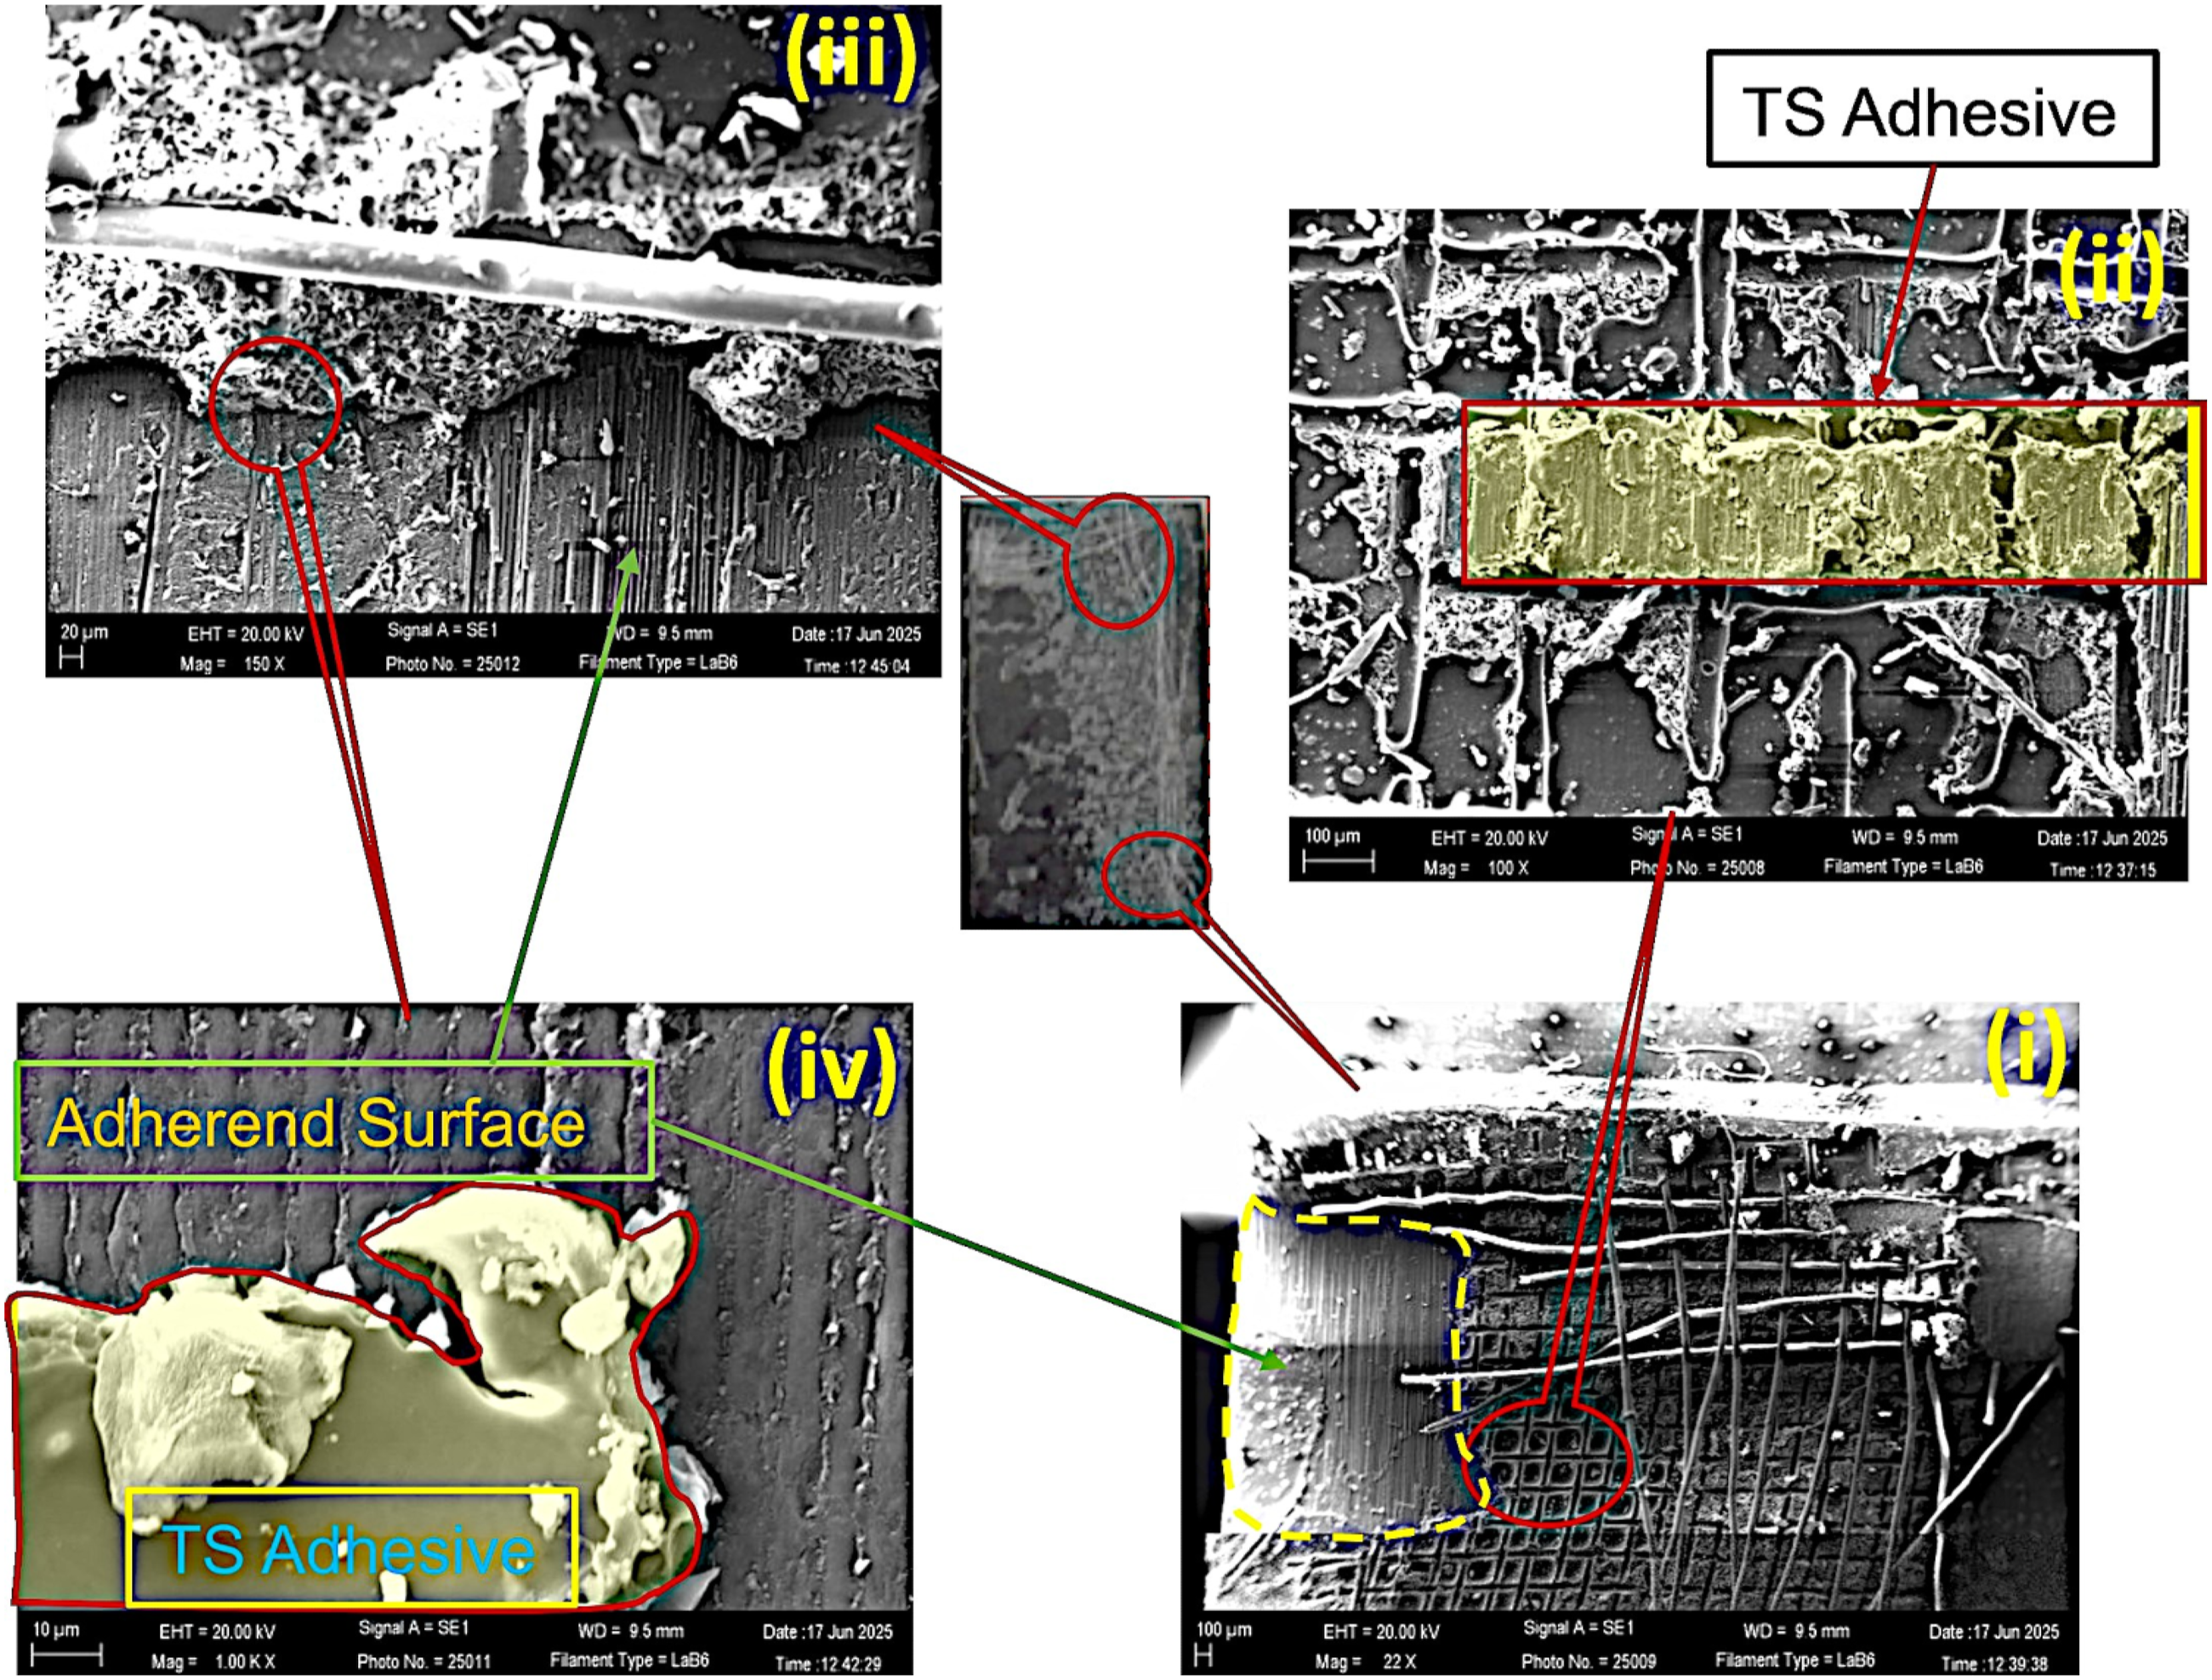
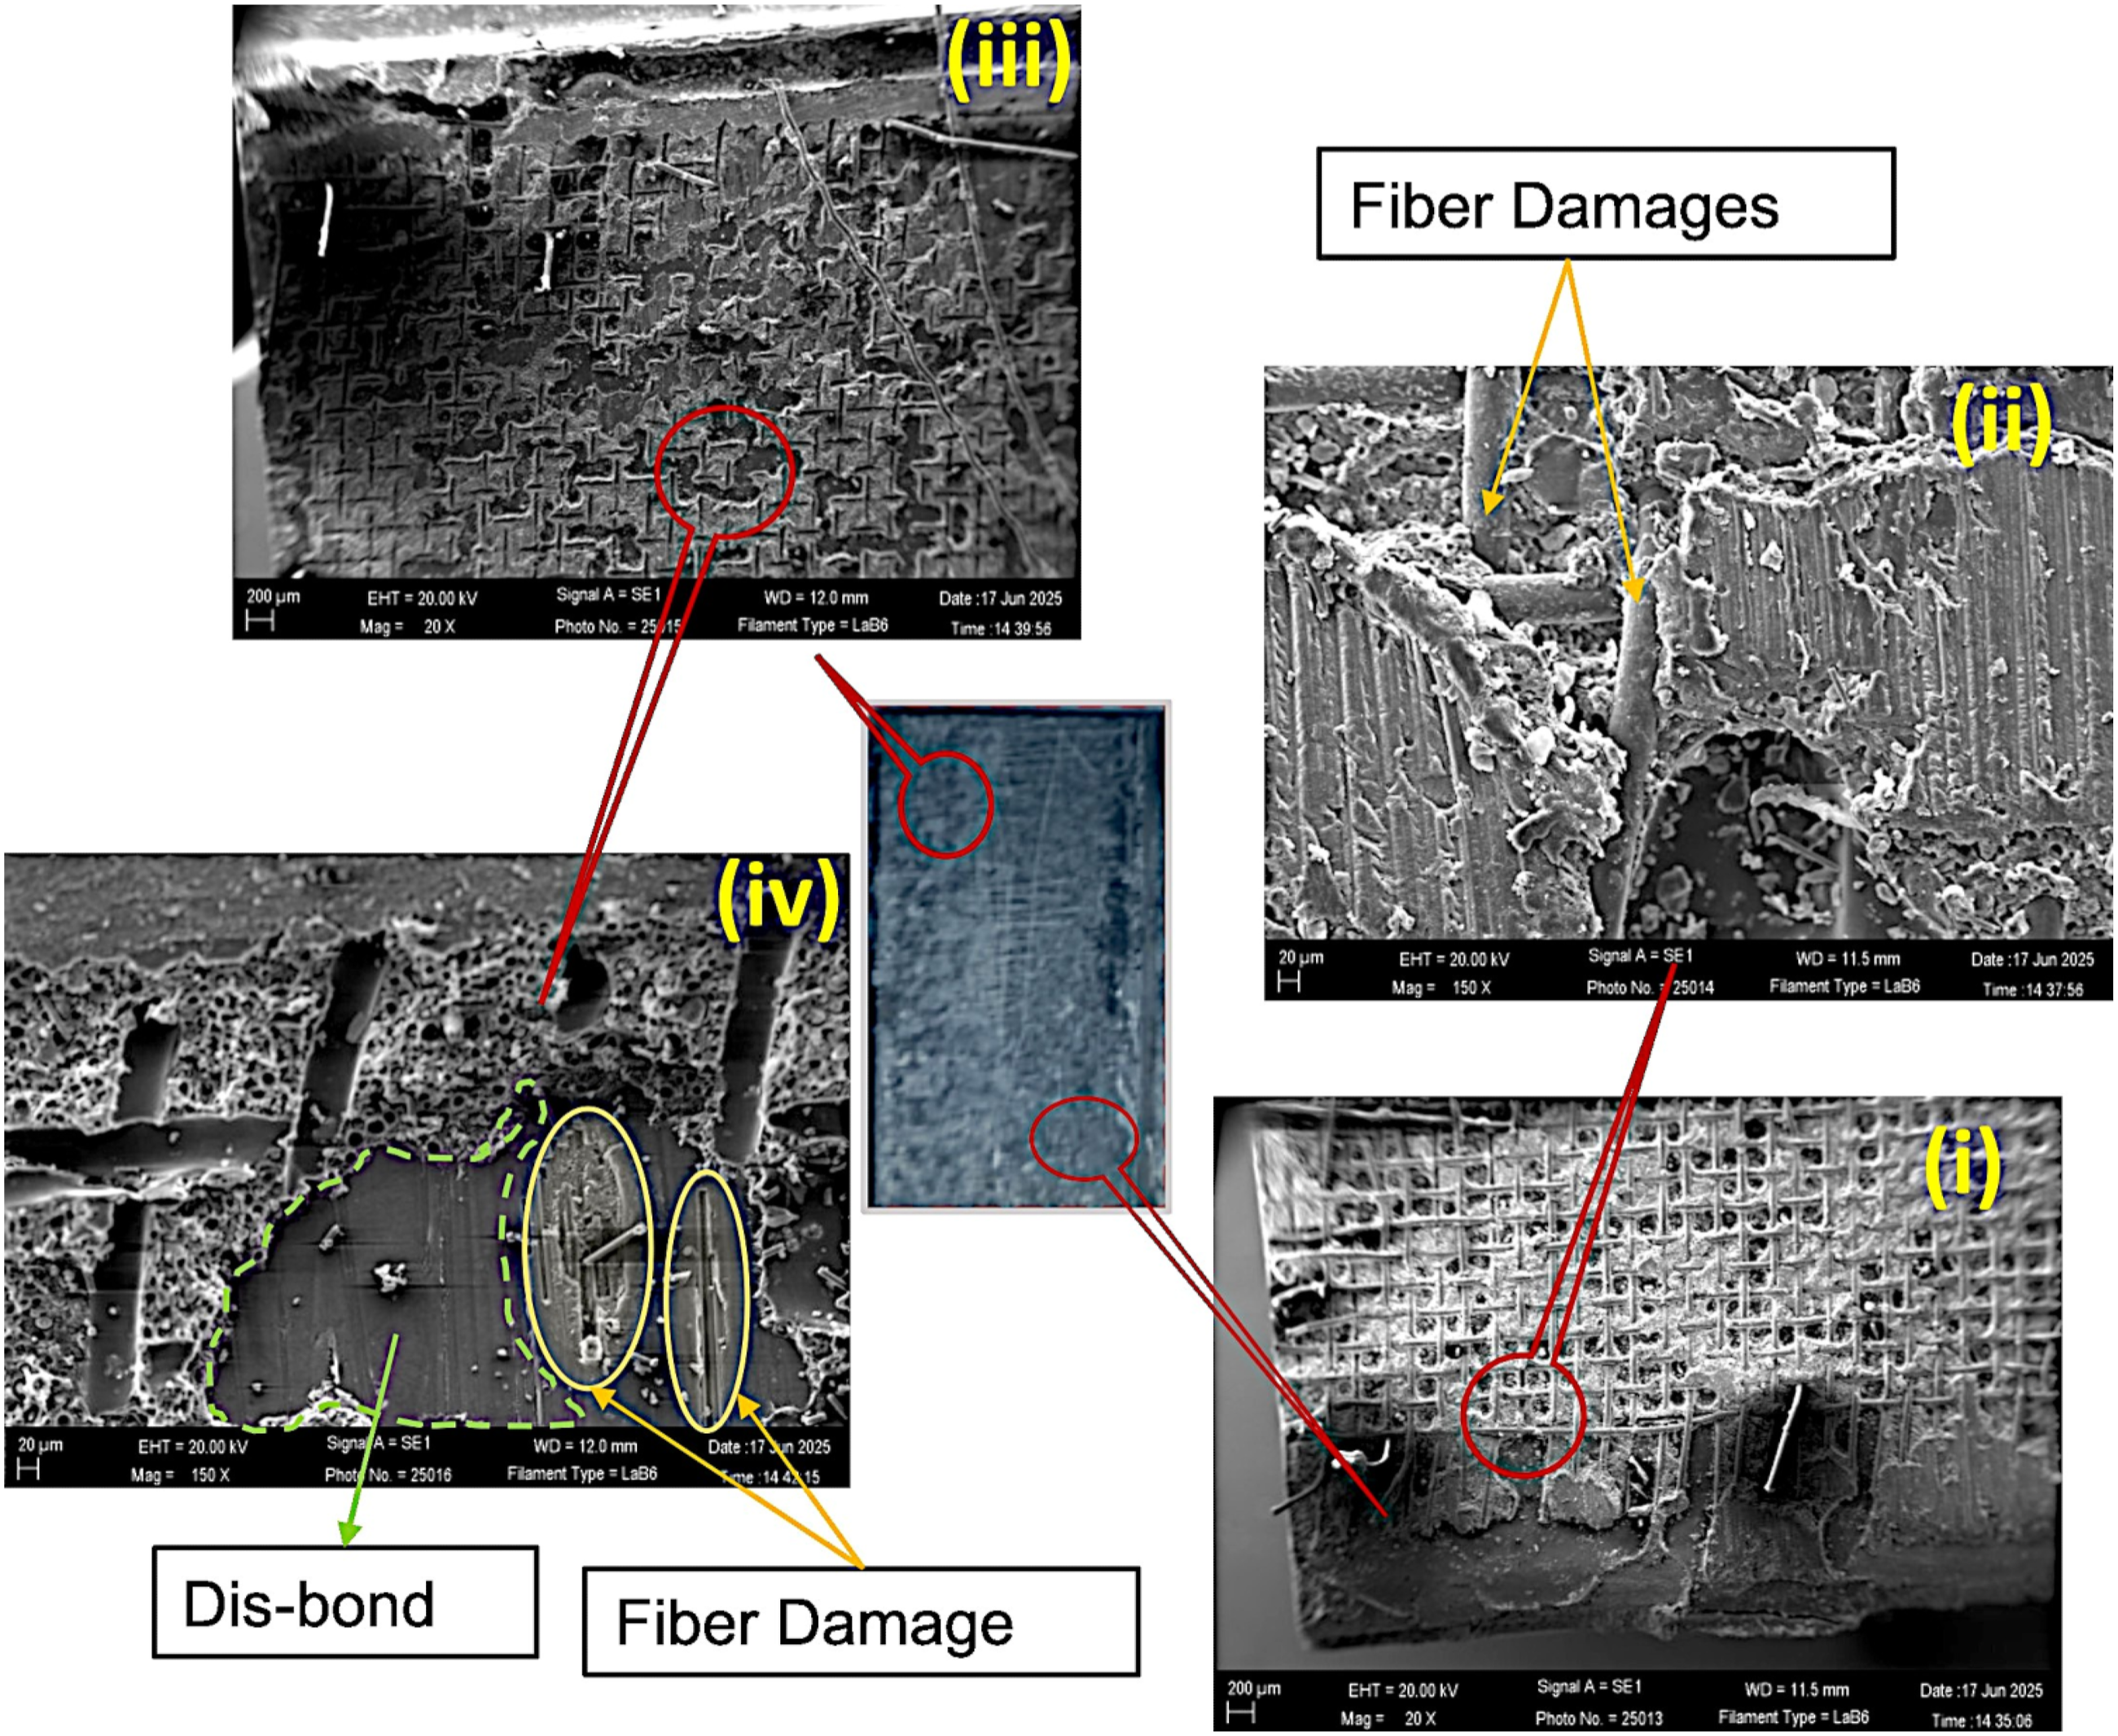
Figure 15 illustrated the treated (PT1) sample, which exhibited a significantly higher failure load than the other samples. The micrographs demonstrated adequate bonding between the thermoplastic adherends and the thermoset adhesive. The thermoset adhesive had diffused into the thermoplastic adherend, as shown in Figure 15(ii), where the scrim cloth was also well wetted by the adhesive. The scrim cloth of the epoxy adhesive was well integrated with the adherend surface, and its fragmentation during tensile testing was visible across the fracture surface, as depicted in Figure 15(iv). Owing to the robust bonding achieved in the plasma-treated samples, cohesive failure predominated over adhesive failure, as seen in Figure 13(b) and Figure 15(iii). Plasma treatment in the PT1 sample resulted in a 77.83% increase in load-carrying capacity compared to the untreated sample. Higher load-carrying capacities were also observed for the PT2 and PT3 samples, as shown in the SEM micrographs in Figures 16 and 17. Minor disbonding near the overlap edges was evident; however, most of the bonded area reflected well-wetted interfaces between the adherend and epoxy adhesive. Carbon-fiber imprints were visible across the bond region, as noted in Figure 16(i) and (iii), indicating small imperfections such as slight disbond or porosity. Despite these minor defects, the samples exhibited higher failure loads due to superior adhesive wetting at the adherend–adhesive interface, as shown in Figure 16(iv). This explains why approximately 90% of failures were cohesive in the PT2 samples, as seen in Figure 16(i) and (iii). The results also made it evident that the contact angle strongly influenced adhesive wetting on the adherend surface. Similarly, the PT3 samples exhibited 60% cohesive failures, as shown in Figure 13(d), with a contact angle of 6.4°. In Figure 16(ii), a crack was observed in the SEM micrograph within the thermoset adhesive layer, rather than the laminate. The adherend surface and bonded thermoset adhesive region were shown in Figure 17(i), while adhesive wetting on the adherend was evident in Figure 17(ii). The interface between the adherend and adhesive was depicted in Figure 17(iii) and (iv). These micrographs clearly showed that cracks initiated within the thermoset adhesive and propagated until final failure. Because adhesive wetting was effective, these specimens sustained higher loads than the other sample types. Figure 18 showed the micrograph of the PT4 sample, which exhibited the lowest load-carrying capacity. Failure of the scrim cloth was evident, and broken carbon fibers were visible in Figure 18(ii)–(iv). These damages may have occurred during the plasma treatment process, which involved three passes. AFM surface-roughness measurements confirmed higher roughness values, and non-destructive evaluation also revealed elevated attenuation levels. Together, these observations underscored the importance of appropriate surface-treatment selection for enhancing adhesive-bond strength and, consequently, the structural integrity of thermoplastic composite joints. SEM Micrograph of the PT1 sample failure surface: (i) Partial diffusion of TS adhesive in to the scrim cloth, (ii) Good wetting of adhesive, (iii) Cohesive and adhesive failure, (iv) Imprint of scrim cloth with TS adhesives and dry surfaces. SEM Micrograph of the PT2 sample failure surface:: (i) Imprint of scrim cloth over adhesive, (ii) Crack with in the TS adhesive, (iii) Dry patch within bonding area, (iv) close view of dry patch and TS adhesive with imprint. SEM Micrograph of the PT3 sample failure surface: (i) Fragmentation of scrim cloth, (ii) Close view of imprint surface, (iii) Dry surface with TS adhesive, (iv) Crack initiation from TS adhesive. SEM Micrograph of the PT4 sample failure surface: (i) Scrim cloth with partially diffused TS adhesive, (ii) Fiber Damages, (iii) Imprint of scrim cloth, (iv) Dis-bond and Fiber damages.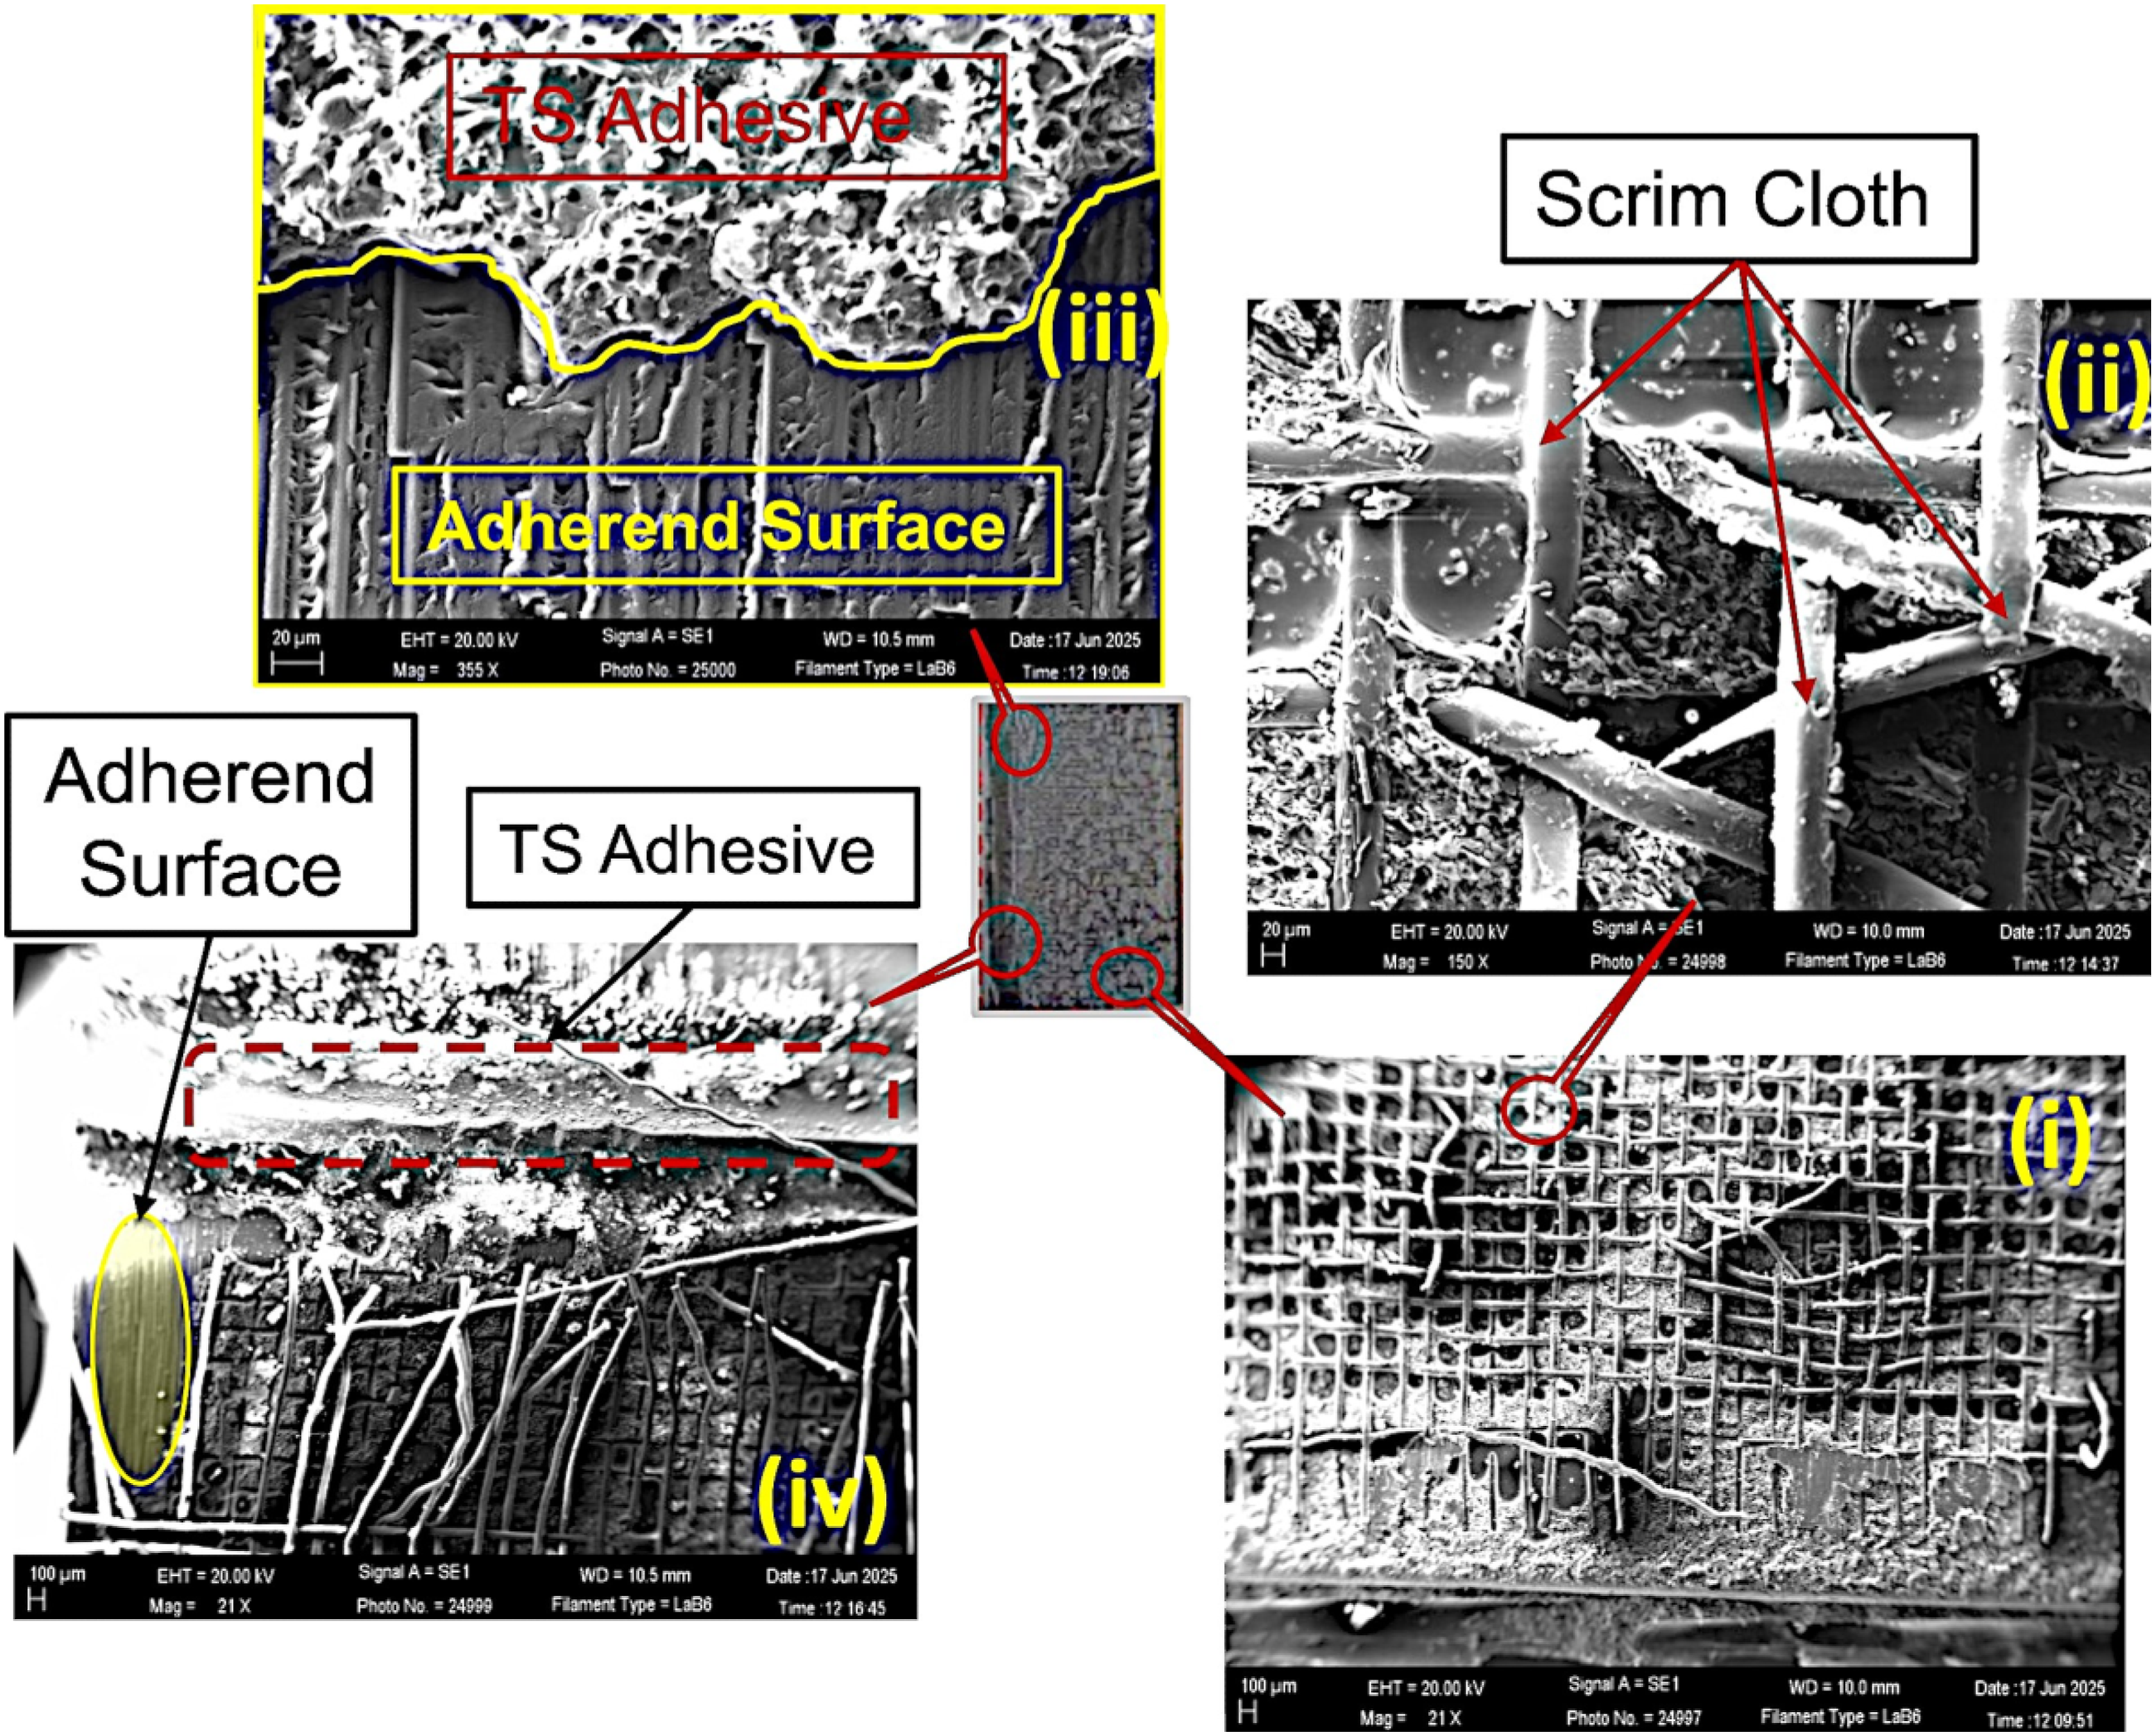
Conclusions
This study aims to enhance the bondline integrity of airworthy secondary bonded joints between carbon-PAEK thermoplastic adherends using an epoxy-based film adhesive. Four series of Single-Lap Joints (SLJs) are fabricated, each with varying degrees of surface modification. One set of SLJ samples were fabricated without any surface treatment, while the remaining four batches (PT1, PT2, PT3, & PT4) underwent plasma treatment over the bonding surface on varying scales. The outer surface of the carbon-PAEK adherends lacked surface plies, resulting in a glossy appearance. Plasma treatment was employed to activate the adhesive bonding surface within the overlap zone.
Experimental results from the SLJs reinforce the necessity of surface modifications for TPC adherends. Plasma-treated samples (PT1, PT2, and PT3) exhibited significantly higher shear strength values: 21.9 MPa, 23.6 MPa, and 24.5 MPa, respectively, marking an increase of 59.04 %, 71.35 %, and 77.83 % respectively compared to the untreated specimens. Surface roughness varied from Ra 24 to 50 nm, influencing a 20 MPa threshold for SLJs, thus potentially indicating its suitablility for lightly loaded (Class II) aircraft structures. Ultrasonic C-scan evaluation of PT1, PT2, and PT3 confirmed uniform bond quality and acceptable attenuation levels, in contrast to the untreated samples, which exhibited inadequate attenuation while demonstrating a lower shear strength of 13.8 MPa.
The reduced shear strength in untreated samples compared to PT1, PT2, and PT3 could be primarily attributed to a higher surface roughness value of Ra 110 nm, which is two to four times greater than the treated samples. Fracture analysis indicated a mixed failure mode (50% adhesive, 50% cohesive) across all specimens due to the glossy surface finish over the untreated adherends. PT4 samples demonstrated a 23.49% reduction in shear strength compared to PT3, with a measured value of 17.7 MPa, closely resembling untreated samples. Fractographic analysis revealed the quantum of epoxy adhesive diffusion into PAEK adherends, thus aiding in greater SLJ strength in the case of PT1 samples as shown in Figure 15 (ii). Conversely, PT4 exhibited the highest surface roughness due to fiber damage, thus demonstrating least SLJ strength. From these findings, it can be concluded that: (i) Surface modifications significantly enhance the shear strength of bonded TPC adherend samples. (ii) Plasma treatment effectively activates bonding surfaces, enhancing polar surface free energy resulting in lower contact angle thus ensuring good wettablility of the bonding adhesive. (iii) Increased surface roughness damages fibers, resulting in lower joint strength. (iv) The optimised contanct angle 6.4° and corresponding surface energy 81.89 mN/m of PT3 samples exhibited the maximum lap shear strength of 24.5 MPa, thereby confirming the importance of surface pre-treatment incase of adhesively bonded joints. (v) A regression analysis is carried out using the experimental data and it is found that the predictive fit is robust and closely correlates with it.
Finally, this study highlights the process development needed for realising thermoplastic composite joints demonstrating good structural integrity involving a low-temperature cured thermoset-based epoxy adhesive.
Footnotes
Acknowledgements
The authors acknowledge the support received from the Surface Engineering Division and Material Science Division of CSIR- NAL. The authors also thank the following people for technical assistance: Mr Praveen Kumar SED, CSIR-NAL (Plasma treatment & AFM measurements), Miss Kalavathi (SEM measurements), Mr Srinivasa V (Non-destructive Testing), and Mr Siva M (Mechanical Testing), ACD-CSIR NAL.
Declaration of conflicting interests
The authors declared no potential conflicts of interest with respect to the research, authorship, and/or publication of this article.
Funding
The authors received no financial support for the research, authorship, and/or publication of this article.