
Abstract
Mechanical properties of long fiber-reinforced thermoplastic (LFT) materials are defined by the fiber microstructure, including fiber orientation (FO). Compression molding of directly compounded LFT-D semi-finished materials results in pronounced anisotropy caused by fiber orientation mechanisms during material flow, with fibers aligning in flow direction. However, various authors noticed a deviation of the FO from the anticipated flow direction, which affected the mechanical properties and possibly blurred experimental conclusions. This study investigates possible reasons for this phenomenon, considering the process chain from plastificate and molding to final FO. For this purpose, we conduct a comprehensive mold-filling study comprising short shots and plates for mechanical characterization. A method is presented to characterize the skewness of the flow front of short shots. In addition, a method for deriving FO from tensile discs is applied. Both results are compared to a state-of-the-art simulation in which results from the characterization of the semi-finished LFT material, the plastificate, are considered. The results indicate that the density distribution of the LFT-D plastificate is not homogeneous; the influence of extrusion time causes a density gradient of around 10 %. This can be traced across the mold filling, where the flow fronts as well as the FOs are skewed towards the most recently extruded portion of the LFT, as well as to the FO. An FO deviation from the flow direction between 10° and 15° is found.
Introduction
Processing long fiber-reinforced thermoplastic (LFT) polymers is a tried and proven way of mass-producing lightweight fiber-reinforced automotive parts.1,2 A high design freedom and the potential for co-molding with continuous fiber- reinforced materials, e.g., tapes or organo sheets make LFTs versatile engineering materials. 3 Direct inline compounding of LFT(-D) and subsequent compression molding have been well-established processes in the market for more than two decades. With industry shifting towards battery electric vehicles (BEV), a new segment of use cases and parts is in demand. Here, LFT-D compression molding is ideal for producing large structures with short cycle times.4,5
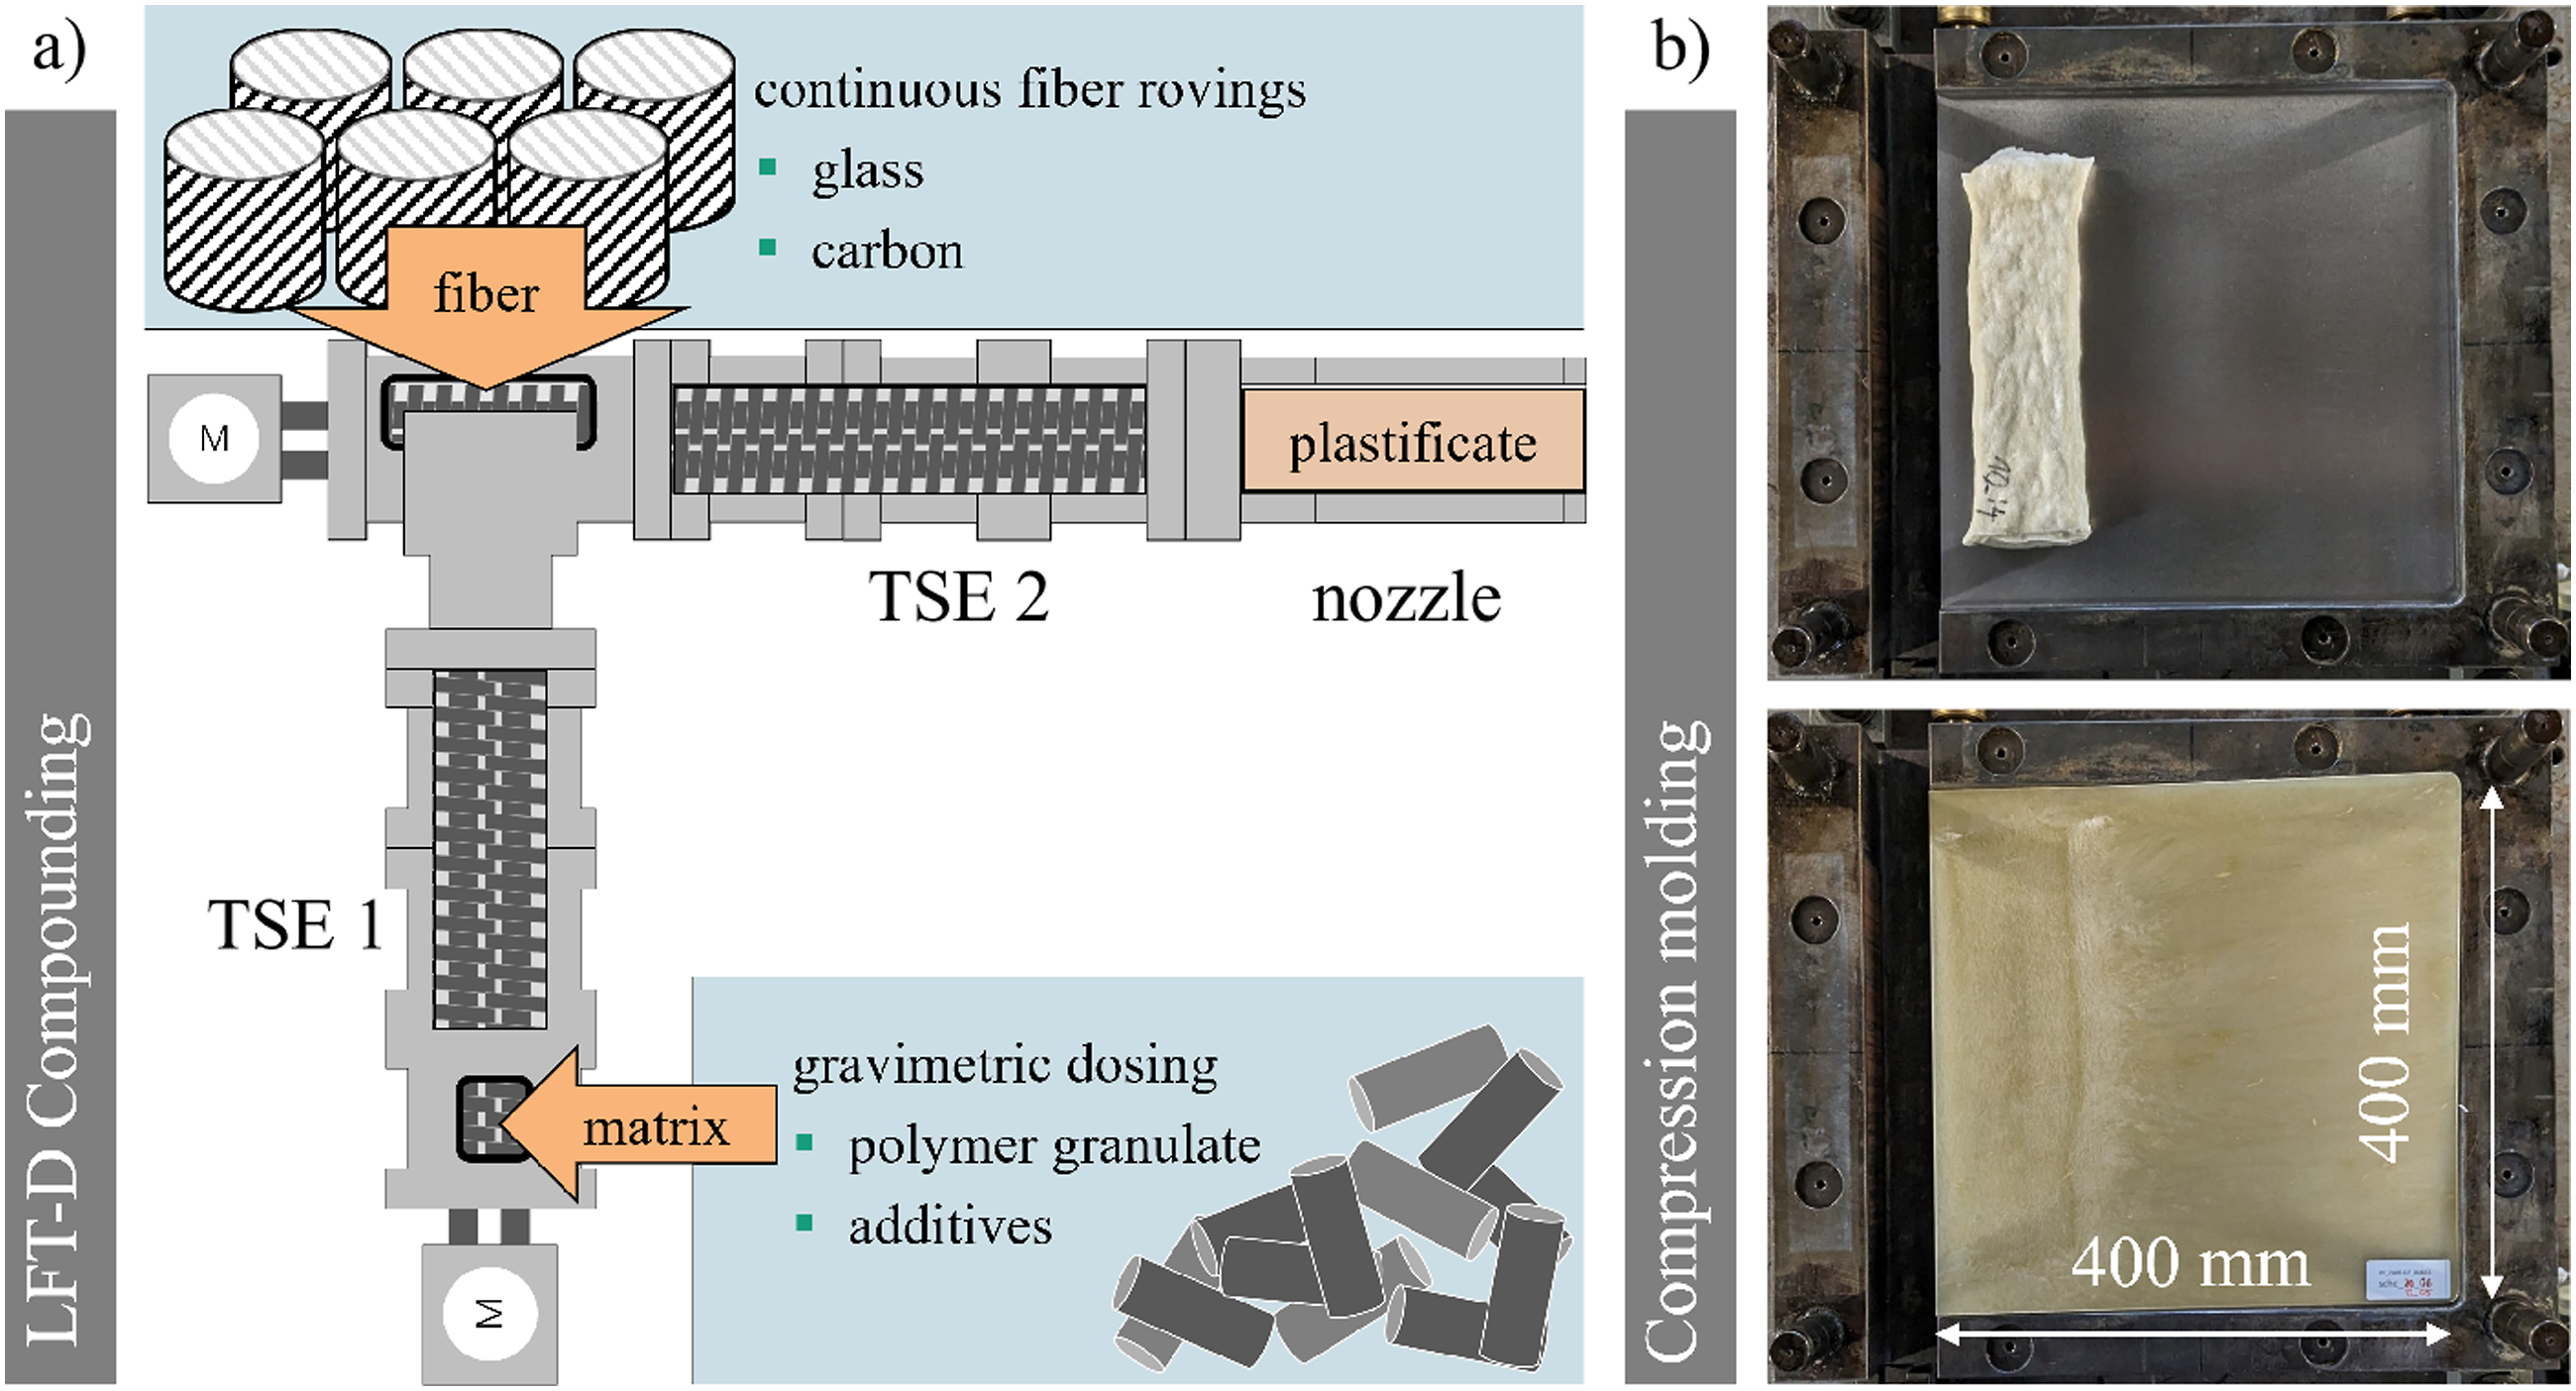
This work considers products of the LFT-D compression molding process where the LFT material is compounded and subsequently placed and molded in an open mold through press force as illustrated in Figure 1. The LFT-D compounding comprises two subsequent co-rotating twin-screw extruders (TSE) where TSE 1 compounds the polymer granulate and additives. Reinforcing fibers, either glass fibers (GF) or carbon fibers (CF) are incorporated in TSE 2 where continuous fiber rovings are drawn into the TSE 2, wound around the screws, impregnated with polymer melt and sheared to facilitate homogeneous dispersion of fiber filaments. Exiting TSE 2, the LFT semi-finished material is shaped by a nozzle that usually has a defined width and adjustable height. This shaped LFT is called plastificate, or charge,
7
or log
8
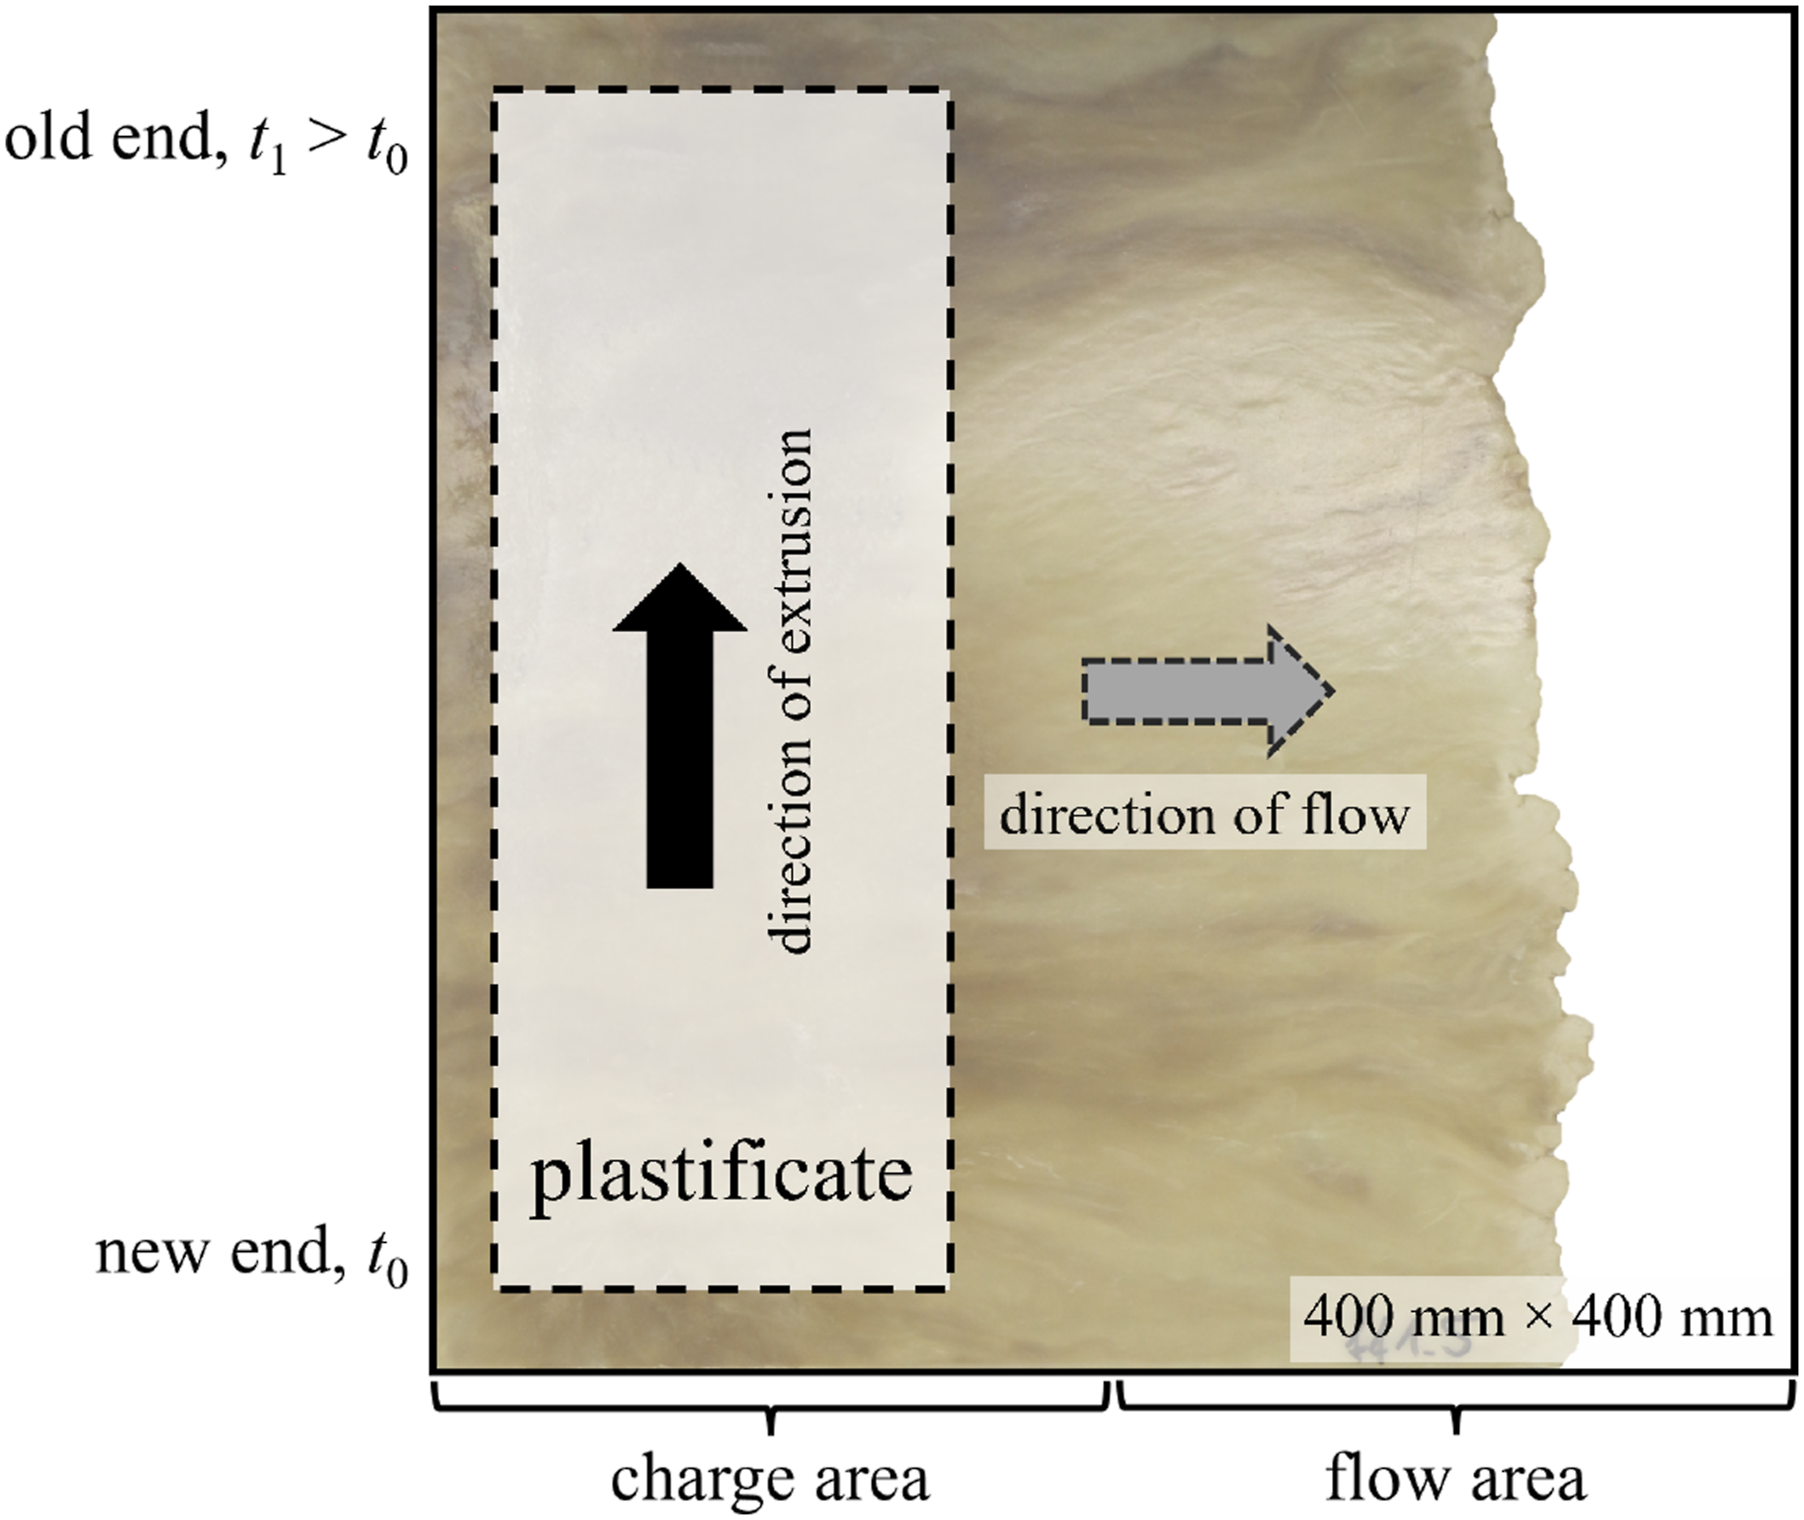
in literature. The plastificate is discharged onto a heated chain link belt running through a heated tunnel (not shown in Figure 1) until picked up to be molded once enough material has been compounded. At this stage of processing, the continuous LFT-D extrusion turns into discontinuous compression molding, indicated on the right of Figure 1. The situation in the mold with relevant terminology is shown in Figure 2. Owing to the switch from continuous to discontinuous processing, there is a time gradient over the plastificate where the material on one end just exited TSE 2 (t0) and has been lying on the belt for a certain amount of time on the other end t1 > t0. This time gradient follows the extrusion direction and is possibly connected to FO phenomena.9,10 These ends are referred to as old and new end (cf. Figure 2).
11
In the mold, two microstructurally very distinct areas, charge, where the charge is initially placed and flow, where the LFT flows to, are formed (Figure 2).
12
Processing scheme of LFT-D compounding (a) and compression molding (b). A plastificate is shown in the mold before molding (b, top). Modified from.
6
Schematic representation of different areas with a partially filled plate in the background. Detailed are terminologies describing the areas, charge and flow in relation to the direction of flow and old and new end in relation to the extrusion direction. The middle line of the mold is indicated by a dashed line. Modified from.
11
Besides the fiber weight fraction wf and fiber length lf, the fiber orientation (FO) has a decisive influence on the mechanical properties of composite materials. 3 During compression molding, the FO is highly influenced by the material flow.13–15 Throughout the last decades, various authors noted that the resulting FO in LFT-D components does not align with the nominal flow direction in 0° and also varies across the flow front.9,10,16 Recently, a series of further papers were published in which FO in LFT-D compression molding was investigated from characterization and modeling perspectives.11,17,18 Deviating main FOs lead to potentially misleading results of mechanical characterizations, usually conducted in flow (0°) and cross-flow (90°) direction. 19 Regardless of the matrix material or the type of reinforcing fibers, reproducible deviation in fiber orientation - and consequently a drop in mechanical properties - can be observed. However, a deeper understanding of the underlying mechanisms is lacking and will be explored in this work. An investigation into the root causes is encouraged by various authors.3,7,14,19,20
In this paper, we aim to describe the origin and influence of deviating fiber orientations. We consider the entire processing chain from compounding in TSE 2, over plastificate properties and molding progression to characterization. Over the course of this paper, we will (1) present the current description of the phenomenon and supposed causes by reviewing the state of the art, (2) set up an experimental test program including characterization of the plastificate, a short shot molding study as well as the manufacturing of sample plates, (3) introduce a methodology to quantify the skewed mold filling behavior from the short shot molding study, (4) (re-)introduce a simple testing method, tensile disc characterization, to ascertain FO from sample plates and (5) conduct a state of the art compression molding simulation modeling the mold filling behavior.
Literature review
The fiber microstructure in compression molding is formed as fibers reorient with material flow forming an orientation distribution around the main orientation. 13 Truckenmüller and Fritz compared the flow fronts of short glass fibers, long glass fibers, and directly incorporated continuous fibers (DIF) in injection molding compounds and stated that the flow behavior was dependent on fiber length distribution and also on the fiber aspect ratio. The effective aspect ratio is smaller for fiber bundles, prevalent in DIF compounds which are, in terms of fiber incorporation and resulting morphology, similar to LFT-D compounds. 21 Due to their high retention rate of long fibers,18,22 LFT-D compounds fall into the concentrated regime, where the spacing between fibers is on the scale of their diameter and fiber mobility is severely restricted. 13
Fiber orientation in plate outer layers does develop very quickly once the LFT-D material starts to flow from the charge into the flow area 14 (cf. Figure 2). While the charge area has a shell-core-style, layered fiber orientation in 0° and 90°directions, the flow area does not have different orientations through the plate thickness.6,23 The main orientation distribution in a polyamide 6 (PA6) CF LFT-D plate is reported to be centered at 15° with a peak of fibers oriented between 0° and 30°. 19 Similar deviations of the main FO are also reported for polypropylene (PP), 16 polycarbonate (PC), 12 and polyamide 66 (PA66) 7 and thus can be assumed independent of matrix material. The big influence of sampling position versus production parameters was shown in a study with PC GF LFT-D. 11 These findings were confirmed in a similar study for PA6 GF LFT-D, PA6 CF LFT-D, and PA6 CF + GF LFT-D. Here, the combination of FO analyses using µCT 17 and established homogenization methods 24 made it possible to trace deviations in mechanical properties accurately predicting anisotropy and deviation of peak mechanical properties from the expected direction in 0°. The cause of this fiber orientation, which deviates from the expected direction, is here attributed to anisotropy within the plastificate, which in turn leads to the formation of an oblique flow front. 18
Tröster
9
suggested using round test specimen, tensile discs, where tensile testing is only conducted to a relative change in diameter when pulled in one direction of εo = 0.3 %, not damaging the sample. Tensile discs can be rotated and tested 360°, resulting in an elliptical polar plot of pseudo-Young’s moduli E∗. The main fiber orientation can be deducted from the vertex of the ellipsis; this was validated through the microwave raster image method and radiography. The maxima of these plots are at a 10° to 30° angle to the 0° flow direction, depending on the sample’s fiber content. In order to check the suitability of the tensile discs, validation tests were carried out with CFLFT plates used to determine the FO in the work of Scheuring et al.
18
A clear agreement of the FO shown in Figure 3(a) with the direction-dependent mechanical properties in Figure 3(b) could be demonstrated. To check to what extent the tensile disc results correspond to µCT FO analysis,Figure 3(c) shows the cutting plan, which shows both the position of square µCT FO samples and the tensile discs at position P1 and P2. In addition, validation test results are shown as polar plots within the tensile disc sample locations (red arrows). Ellipse rotation from 0° orientation is similar to the determined FO and effective mechanical properties. Due to the round specimen shape, the ellipse cannot be equated with the modulus of elasticity. Hence, the obtained stiffness is better described as a structural stiffness and will be referred to as a pseudo Young’s modulus E∗. Due to the circular geometry, the geometric factor remains consistent across all orientations, allowing E∗ to be employed for assessing anisotropy and identifying the direction of maximum stiffness or the angular deviation from the fixed plate coordinate system Ψ ( Results of the CFLFT tensile disc validation test with (a) histogram of determined FO from
18
and (b) corresponding course of Young’s modulus over sample orientation angle from the flow area from
18
and (c) cutting plan of the plate with results of the P1 and P2 tensile discs for 0°- 180°in 5°steps.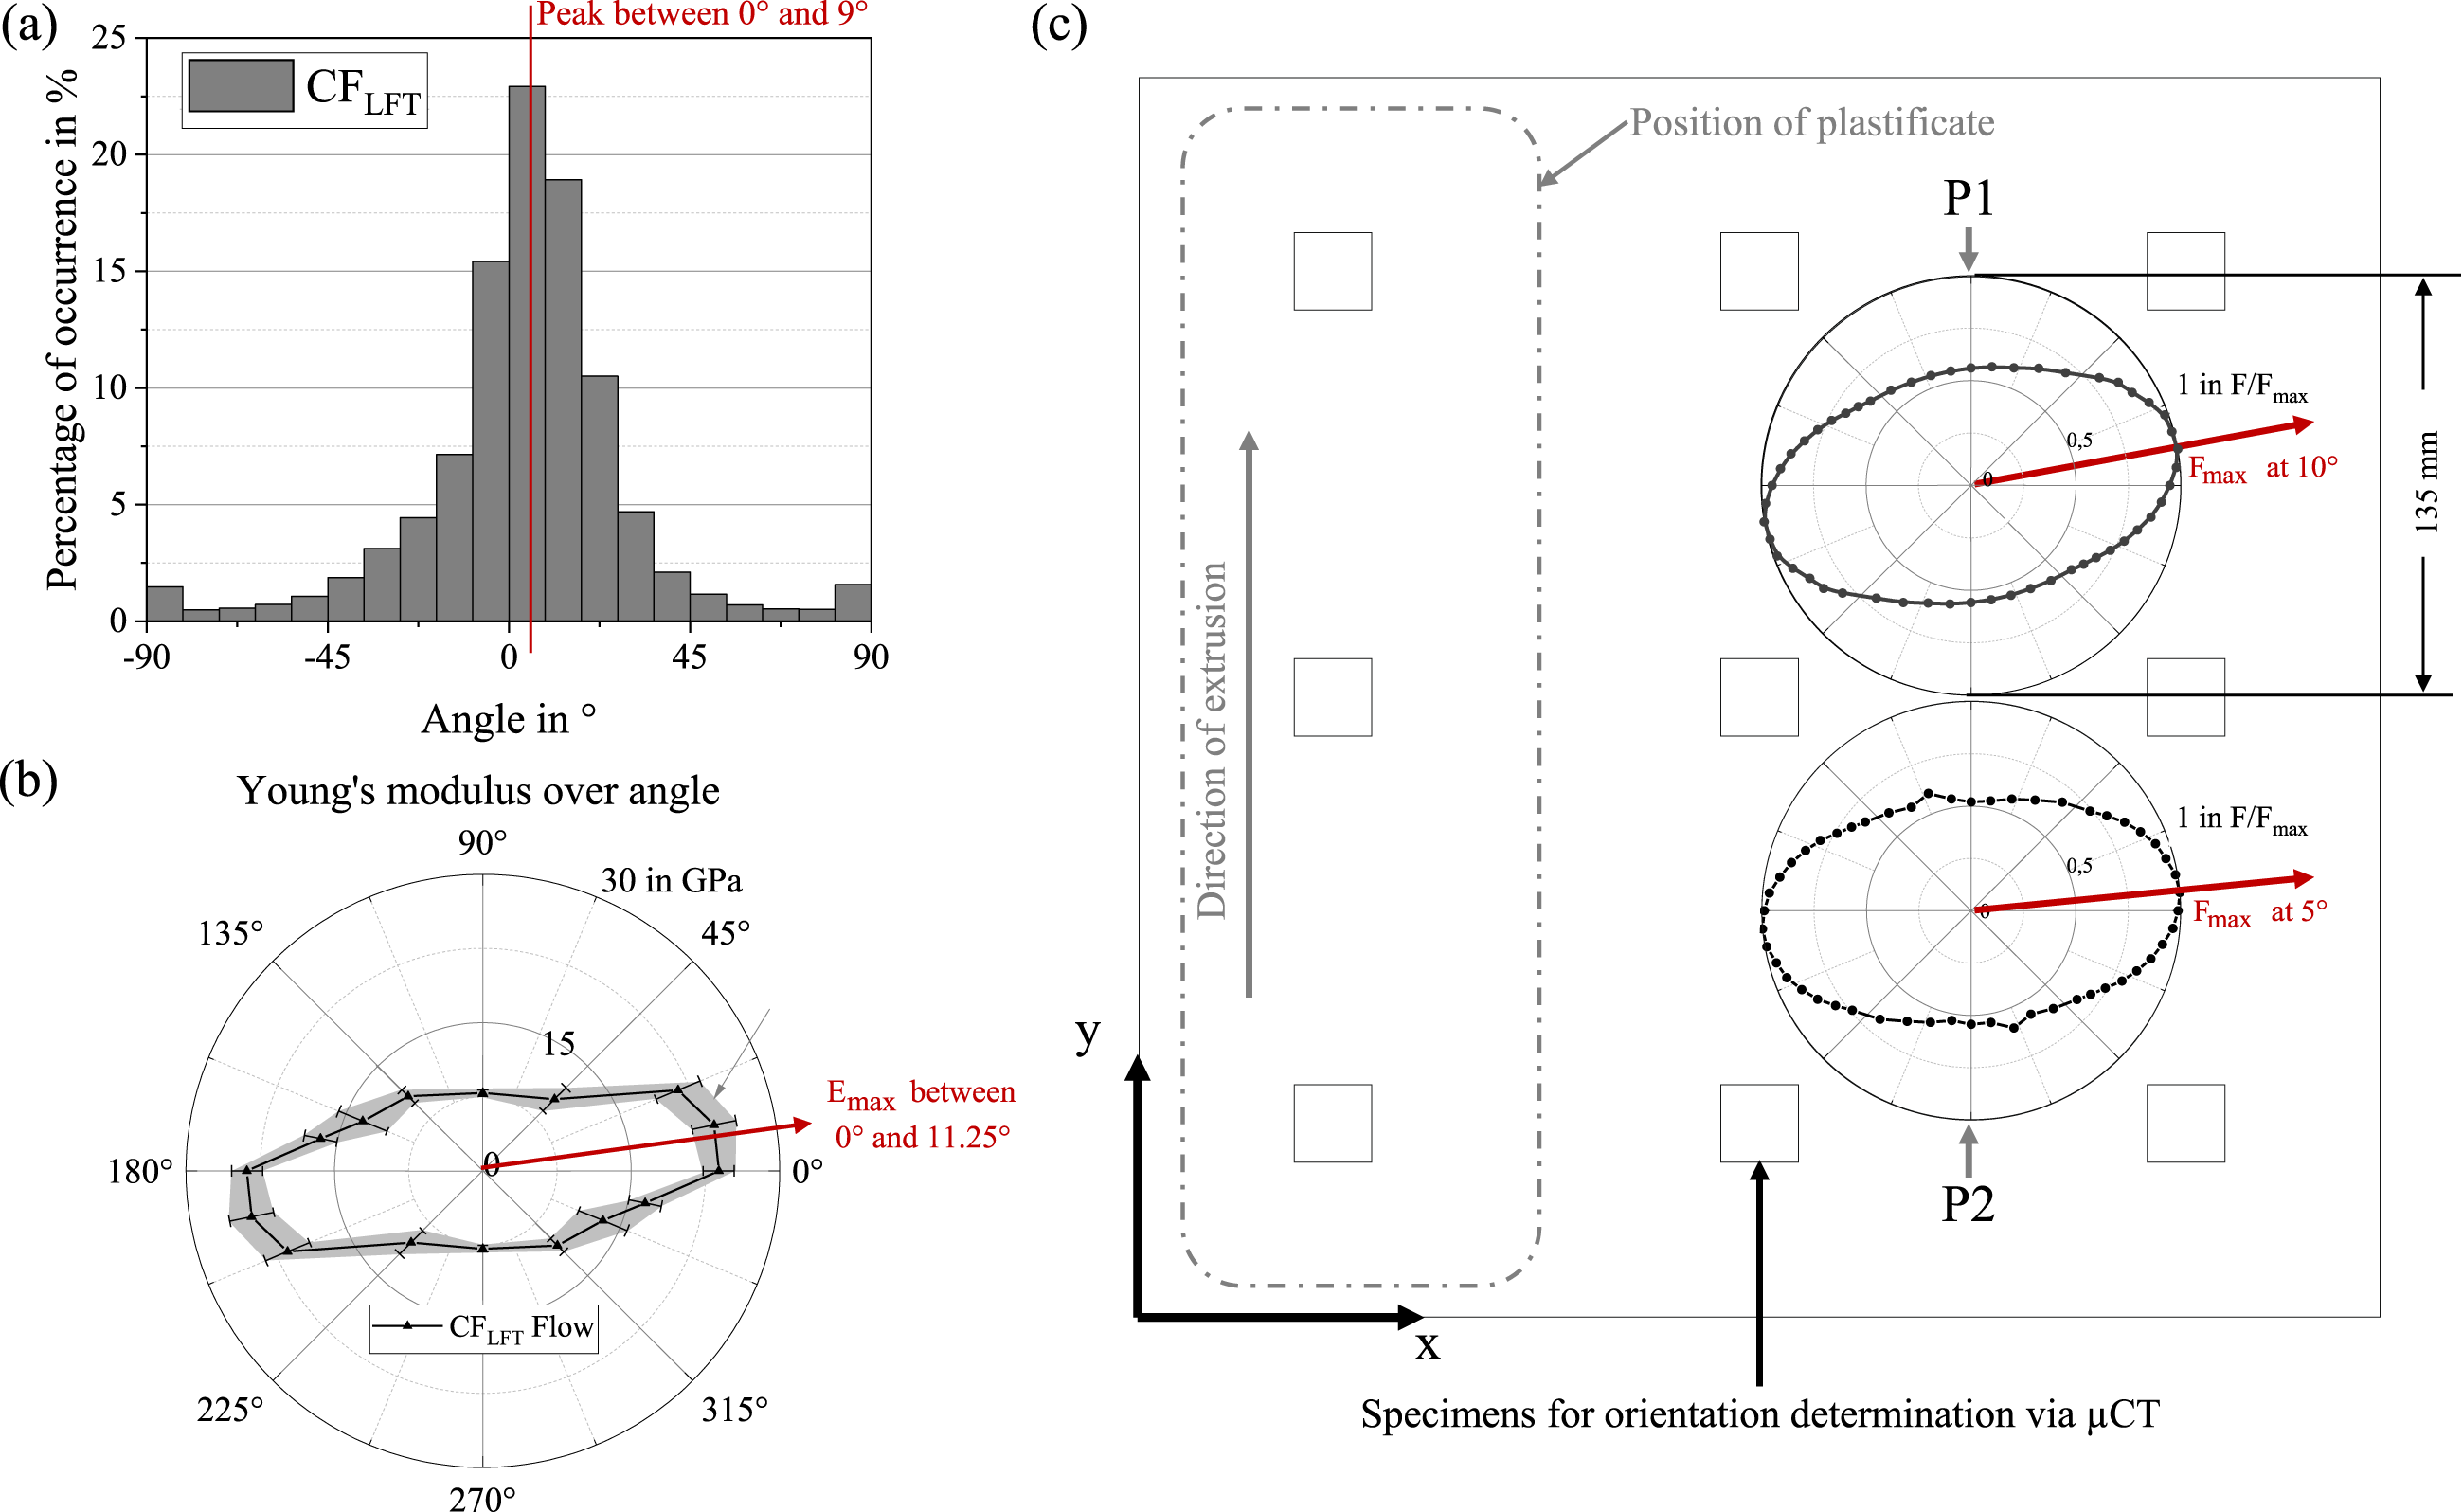
The plastificate is suspected to be the origin of the FO development in LFT-D compression molding for various reasons. Various explanations are given in literature how and why the plastificate influences the fiber orientation in the plate. The initial fiber orientation in the plastificate is mentioned as well as the plastificate temperature.
The fiber pre-orientation in the plastificate was described as “fishbone-shaped” after evaluation of X-ray scans. 9 After scanning in multiple layers, Radtke 10 described the internal fiber orientation as a symmetrical double helix pattern formed by the twin screws of the extruder. This pattern is confirmed in similar studies25,17 This FO in the plastificate was found to have an influence on the FO after molding and is considered in simulation approaches.14,15,26
Tröster concluded that a temperature difference from the old to the new end of the plastificate exists. 9 Radtke measured an outer temperature gradient between 10 K and 30 K from old to new end of the plastificates surface via IR camera. 10 In recent studies no temperature difference along the extrusion direction of the plastificate was found and a cone shaped temperature distribution was suggested. 18 Both noticed noticed that material flow first occurs at the new end of the plastificate, assuming that deviations in fiber orientation originate in different viscosities caused by different temperatures. The placement of the plastificate also has an influence on FO. 22
Another property, the density, of the plastificate is described in literature, as it is not an ideal mixture of its constituents. Lofting or swelling refers to the process of volume increase once the material exits the TSE.21,27 Bondy found the plastificate to contain “considerable amounts of air”. 19 Lofting is more pronounced with increased fiber fractions. 28 Löwe, advised by Schelleis, presented a characterization method for plastificate density as well as a study of processing influences. 29
Materials, processes and method development
PA6 matrix material TechnylStar was generously provided by DOMO Chemicals GmbH, Leuna, Germany and has a density of ρp = 1.14 g/cm3 according to its datasheet. Glass fibers, StarRov 895 were generously provided by Johns Manville Germany GmbH, Bobingen, Germany. The density of GF is ρf = 2.54 g/cm3. The fiber diameter is Df = 16 µm.
LFT-D production
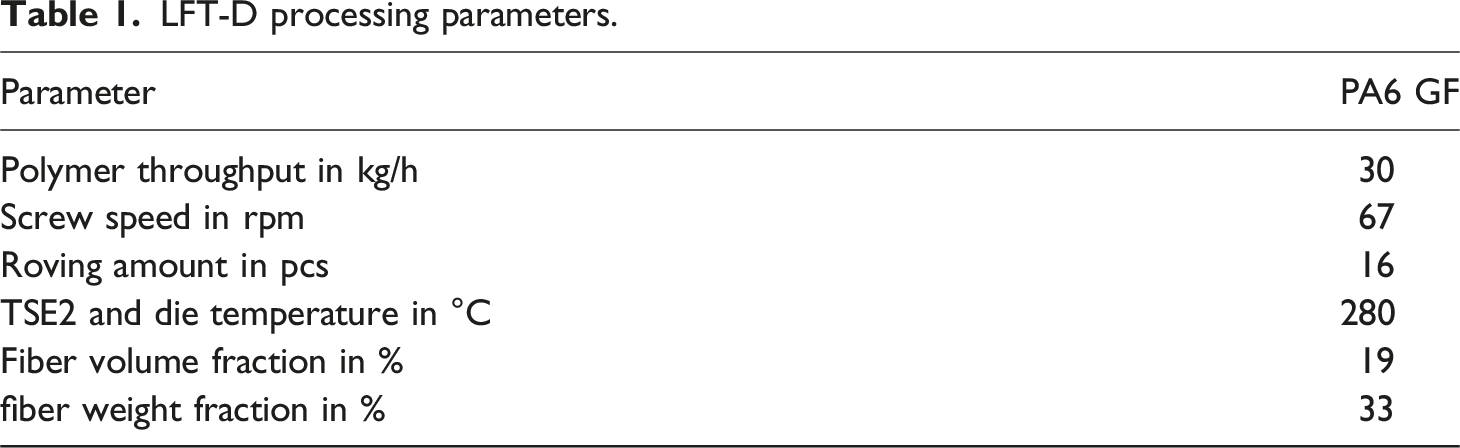
LFT-D processing parameters.
Plastificate characterization
Plastificates are quenched in water immediately after production to preserve possible time-dependent characteristics. The ends were sawn off, and the center section of the plastificate was cut in half for volume measurements to ascertain plastificate density. Bisected plastificates are weighed after drying to equilibrium in an oven at 80°C. Dimensions are measured via the stereo camera system GOM by Carl Zeiss GOM Metrology GmbH, Braunschweig, Germany. The respective densities of old and new plastificate halves are calculated from weight and volume. 29 The core temperature of both plastificate ends are measured simultaneously with a type K temperature element.
Short shot flow study
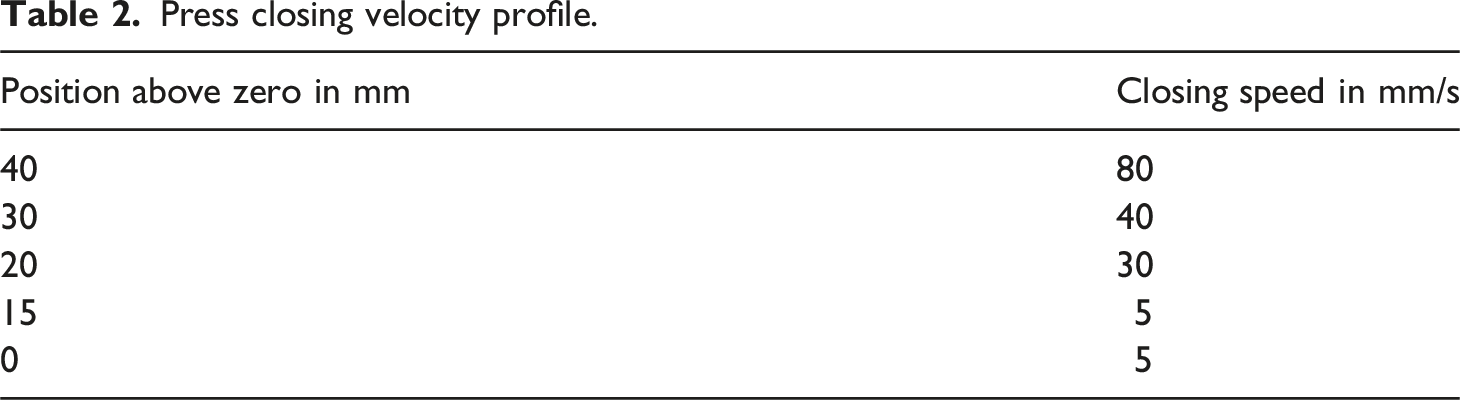
Press closing velocity profile.
The plastificate is placed in the mold in different configurations, refer to Figure 4 for general scheme and placement combinations to test hypotheses regarding influences of the plastificate, operator, mold, and molding process on flow front development. Configurations comprise a position (a through d) and an orientation relative to the mold (clockwise, cw and counterclockwise, ccw) depending on the extrusion direction of the plastificate (cf. Figure 1). The plastificate was turned upside down (rotated 180° along the axis of extrusion direction) to check whether the time spent on the belt and gravity have settling effects on the material. For every placement scenario five short shots are molded for characterization. Trials are conducted in randomized order to avoid environmental effects. Independent of placement position, the volume center of the plastificate aligns with the mold center line at 200 mm during placement (cf. Figure 2). The long edge of the plastificate is placed parallel to the mold wall maintaining 10 mm distance for processing safety. Placement scheme of plastificates in a square mold. This view of the mold is congruent to all depictions in this paper. Plastificate placement combinations of position (a-d), extrusion direction (cw or ccw) and rotation are given in the legend on the right.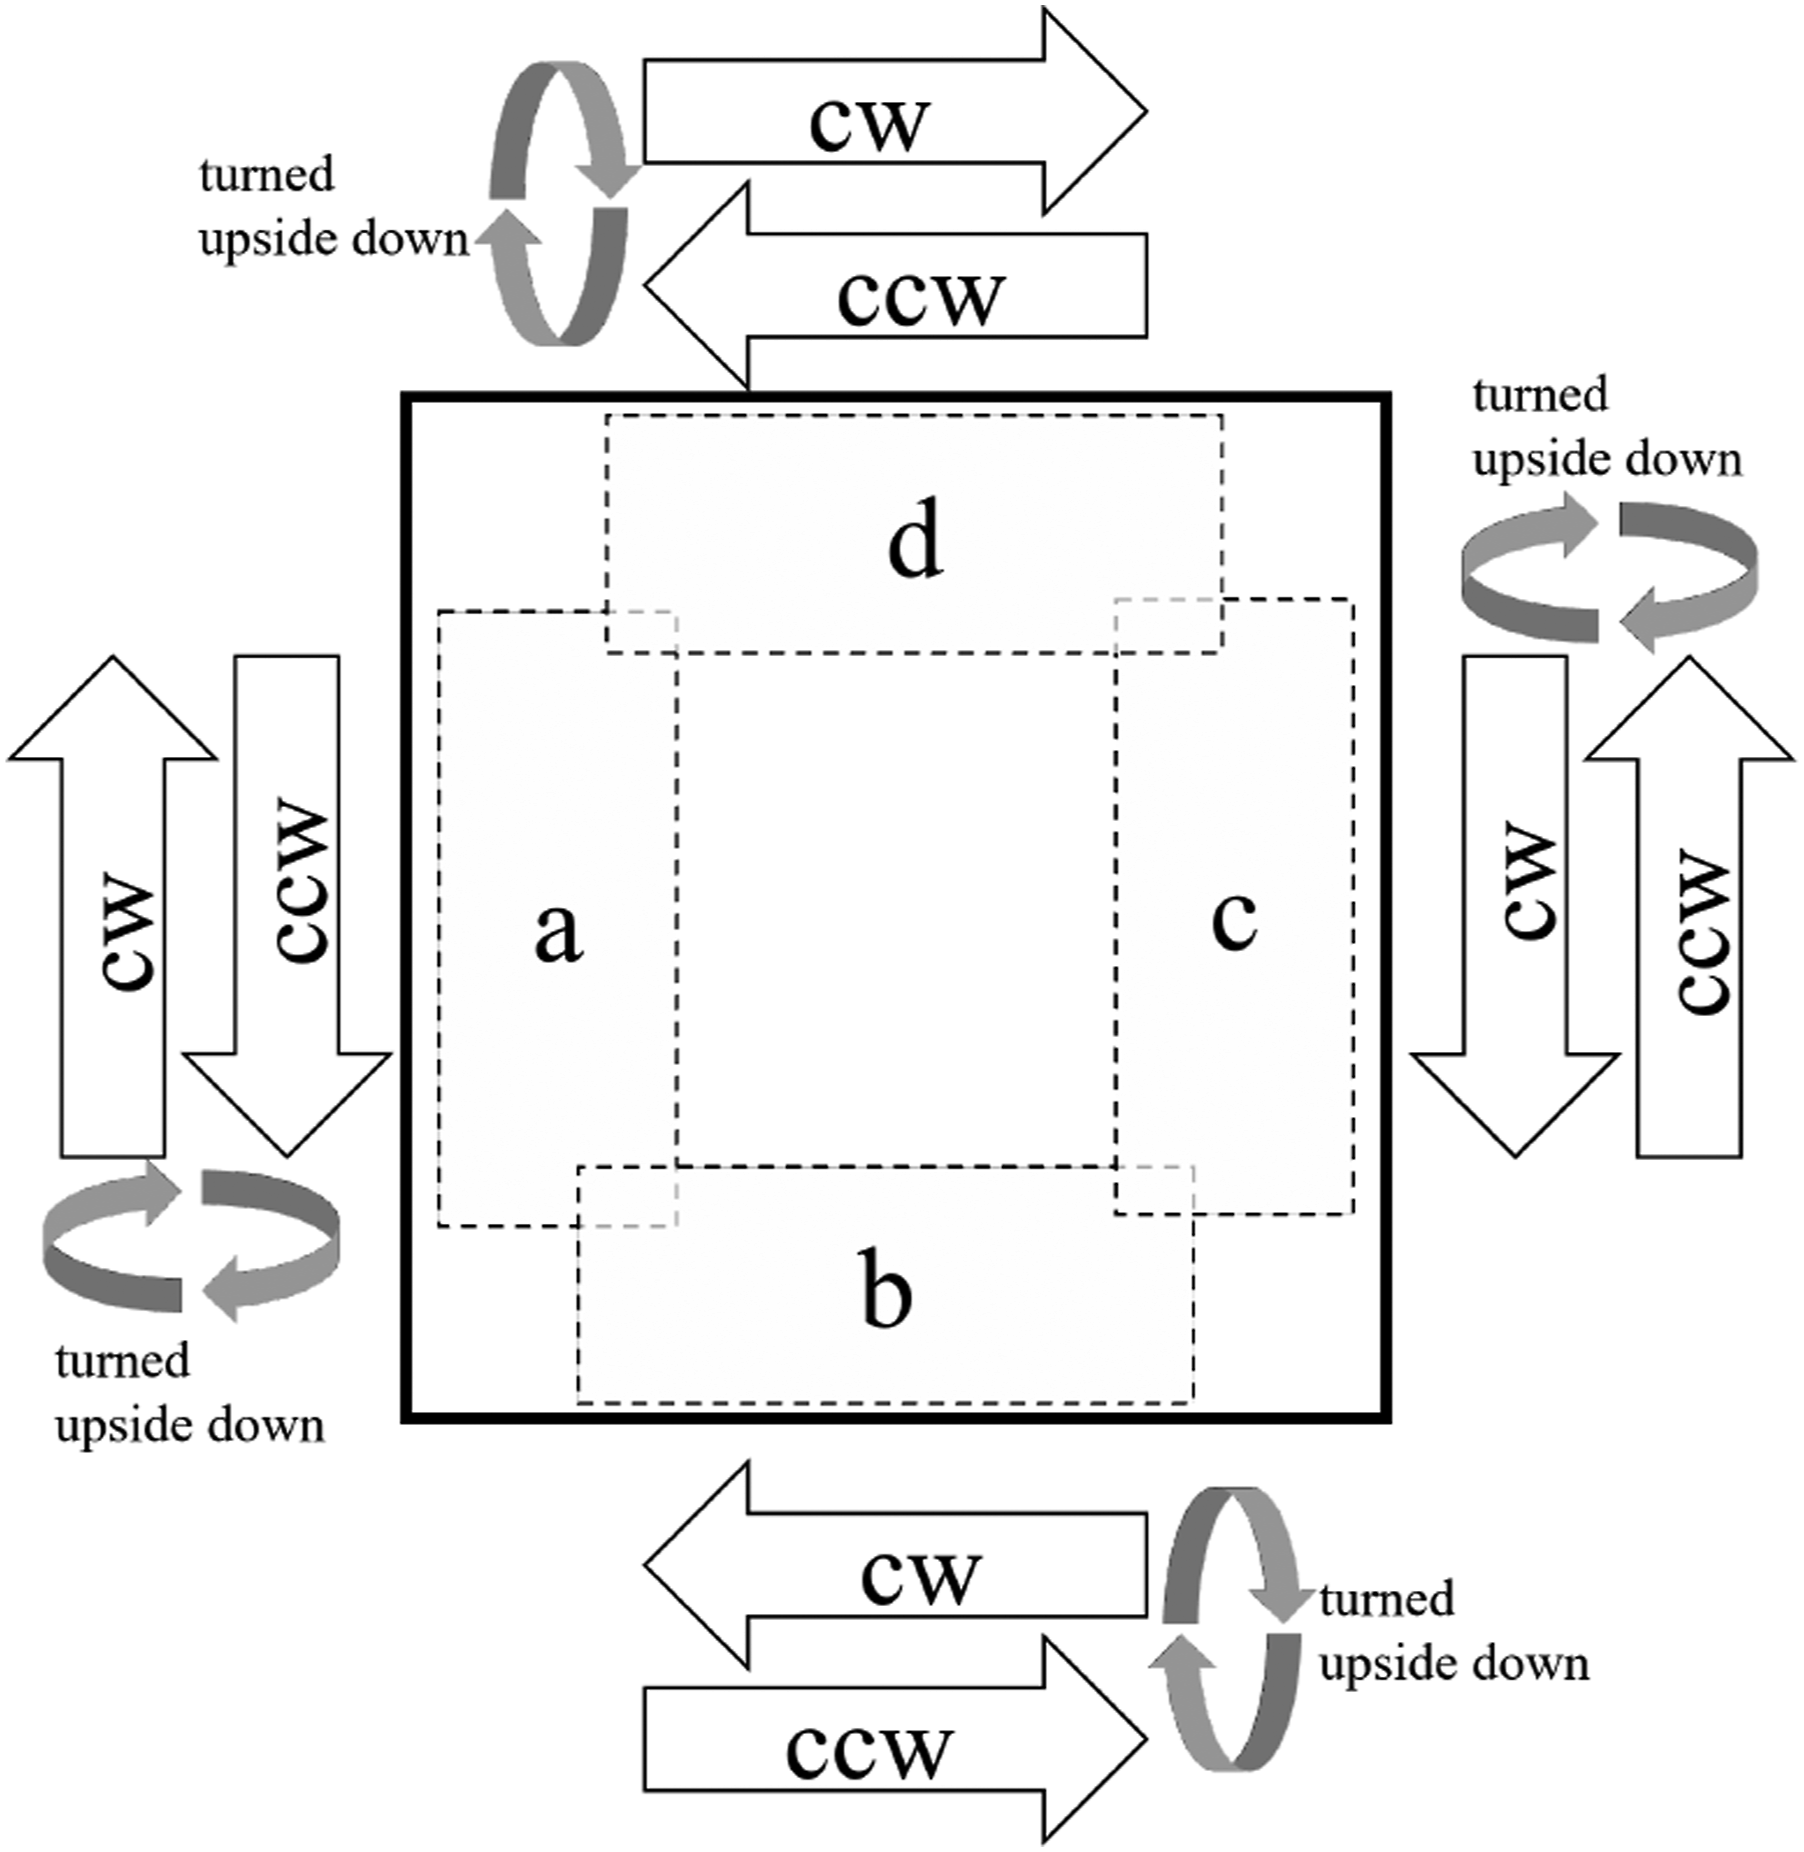
Flow front characterization
While the flow front incline can be perceived visually, a method to quantify that impression is presented here. The core elements can be seen in Figure 5. Designations of LFT-D compression molding are shown in a condensed way on the left part of Figure 5. Of importance are the direction of extrusion (solid black arrow) and old and new end referring to plastificate ends (cf. Figure 2). The direction of extrusion x is defined here and is kept in positive axial direction also for the following mechanical characterization and simulation. The flow path y represents the progress of the flow front in flow direction from one mold wall at 0 mm to the other mold wall at 400 mm. This coordinate system refers to each plate, independent of the placement in the mold. The flow front is manually traced and translated into a set of x- and y-coordinates. These coordinate data sets are exported into Origin by OriginLab Corporation where curves are plotted and coordinates of the centroid (marked X in Figure 5) of the flow front are calculated following these steps: (1) draw constant function through curve minimum (red line) (2) integrate area between curve and constant function (shaded grey) (3) calculate y-coordinate of the centroid (black X) of the grey area (4) calculate the distance to the middle of the mold (dashed line) and divide by half the mold width. Short shot compression molding to skewness quantification. a) The designated plate areas are shown in a simplified manner. The area across the minimum flow front progression, red line, is greyed out. b) Enlarged portion with centroid (X) and relative flow front skewness sff = −22 %.
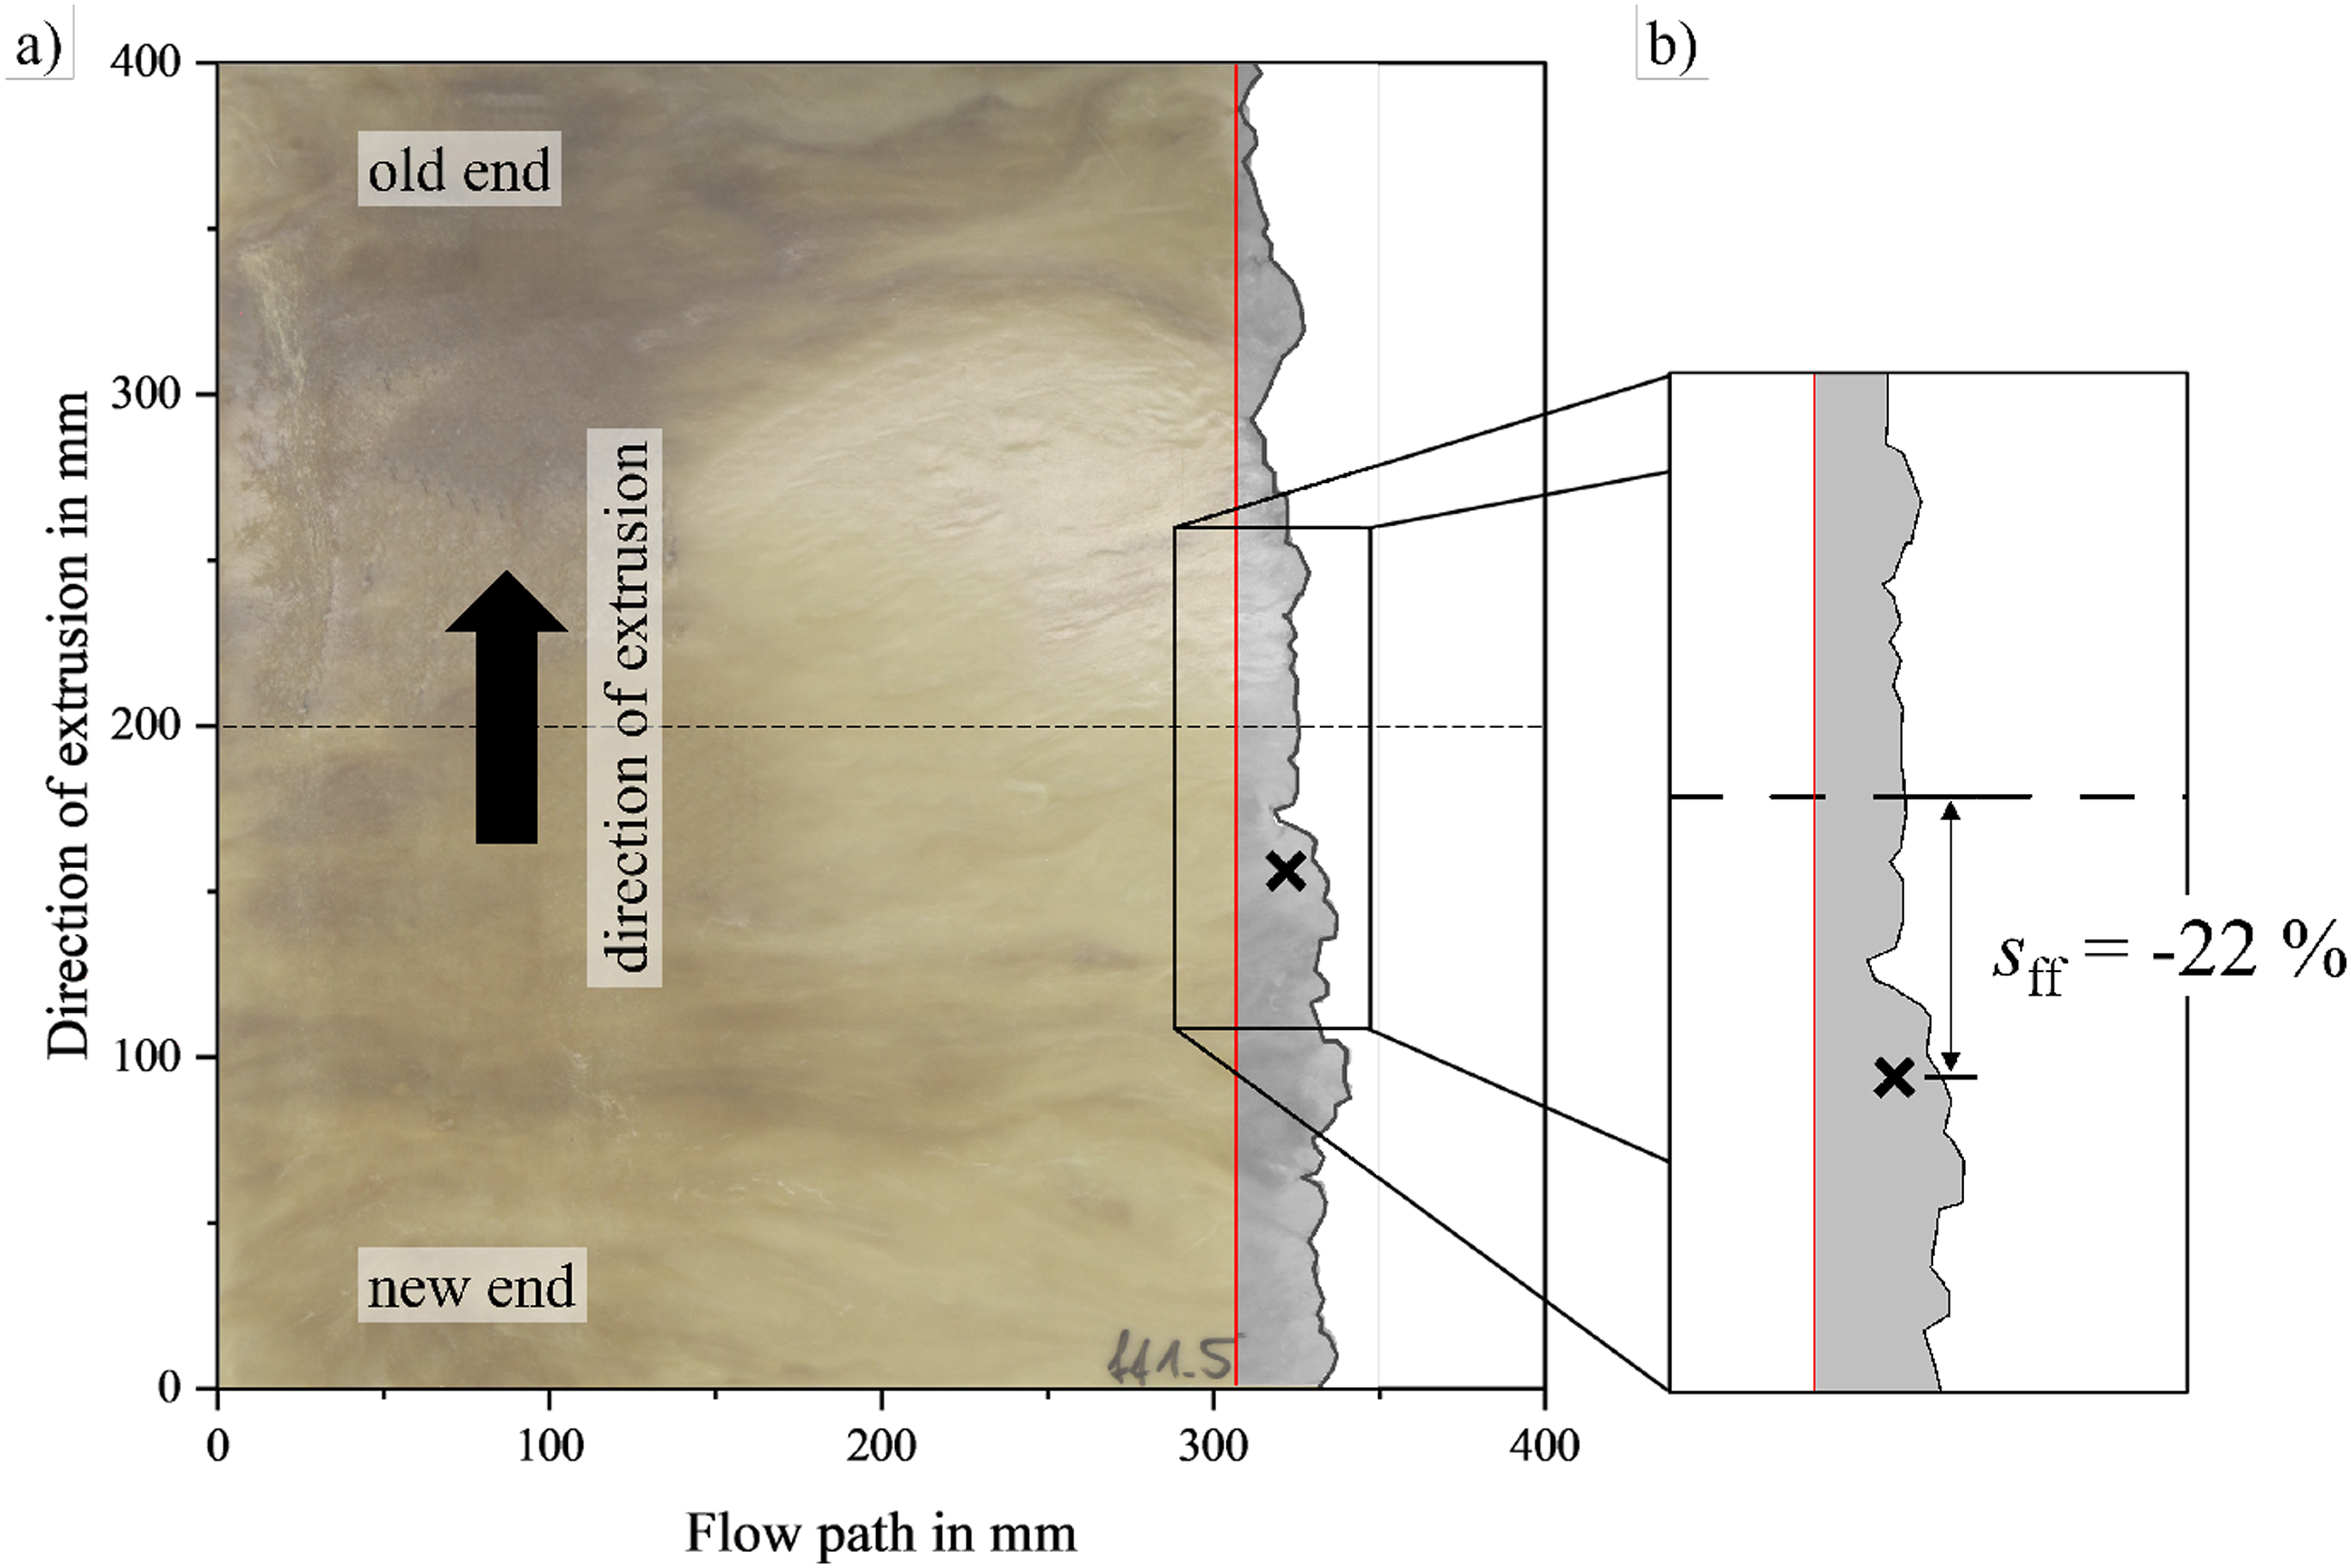
Resulting sff values can be obtained independently of flow length (referenced to curve minimum) and mold geometry (referenced to mold center line). The resulting value is subsequently referred to as flow front skewness sff and not to be confused with the statistical term. Camera lens distortion was considered but comparing corrected images to originals found close to no effect (less than 0.2 % difference in coordinates) on relevant results. Plastificates are placed in clock and counter- clockwise direction (cw and ccw, cf. Figure 4(a)). Ensuring, that the extrusion direction is always positive, the direction is mirrored for all samples in cw direction.
Mechanical characterization
To investigate the stiffness anisotropy of LFT plates at different locations, tensile tests were performed on tensile discs according to Tröster’s 9 established methodology. Tensile discs, 135 mm in diameter and 3 mm thick, were cut from the LFT plates by using a water jet system (iCUTwater smart of the company imes-icore GmbH, Eiterfeld, Germany). The discs positions P1 and P2 are given in Figure 3(c). The samples are taken relative to the extrusion direction according to the plate coordinate system. The discs were dried and then clamped in a ZwickRoell Zmart.Pro 200 kN universal testing machine with a 20 kN load cell, hydraulic clamping jaws, and a free length of 90 mm. To mitigate potential clamping- induced artifacts in the results, tensile discs underwent a pre-straining phase to relative change in diameter when pulled in one direction of εø = 0.15% at a rate of 1 mm/min prior to the start of the measurement cycle. The measurement cycle consisted of testing up to εø = 0.15% strain at a rate of 1 mm/min. Force values were determined at εø values from 0.05 % to 0.1 % and 0.15 %. To determine anisotropy, the preload and measurement cycles were repeated, rotating the discs in 5° increments. The values obtained were normalized to the highest value obtained to determine a relative reduction in deviation as a function of orientation.
Tröster’s research emphasizes that material properties remain unaffected by multiple load cycles within the purely elastic range. This assertion was validated by repeated testing of specimens.
9
To obtain complete information, discs can be tested from 0° to 180°. Since the purpose of this work is to determine the deviation of the maximum stiffness from the 0° flow direction, the parameter study is restricted to measurements from −25° to 25°. The position of the maximum was defined as the local maximum of a B-spline fitted through all measuring points. The angle between the flow direction in 0° and maximum stiffness, the FO deviation, is called Ψ. To determine the global anisotropy, the stiffness in Ψ + 90° maximum was also tested. At least two tensile discs per plastificate placement variant were tested from left, P1, and right, P2, position in the flow area of the plate. Figure 6 shows a picture of the test setup with the individual components (a) and an exemplary tensile disc with the orientations to be tested marked (b). Annotated tensile disc characterization setup (a). Detail of a tensile disc specimen (b).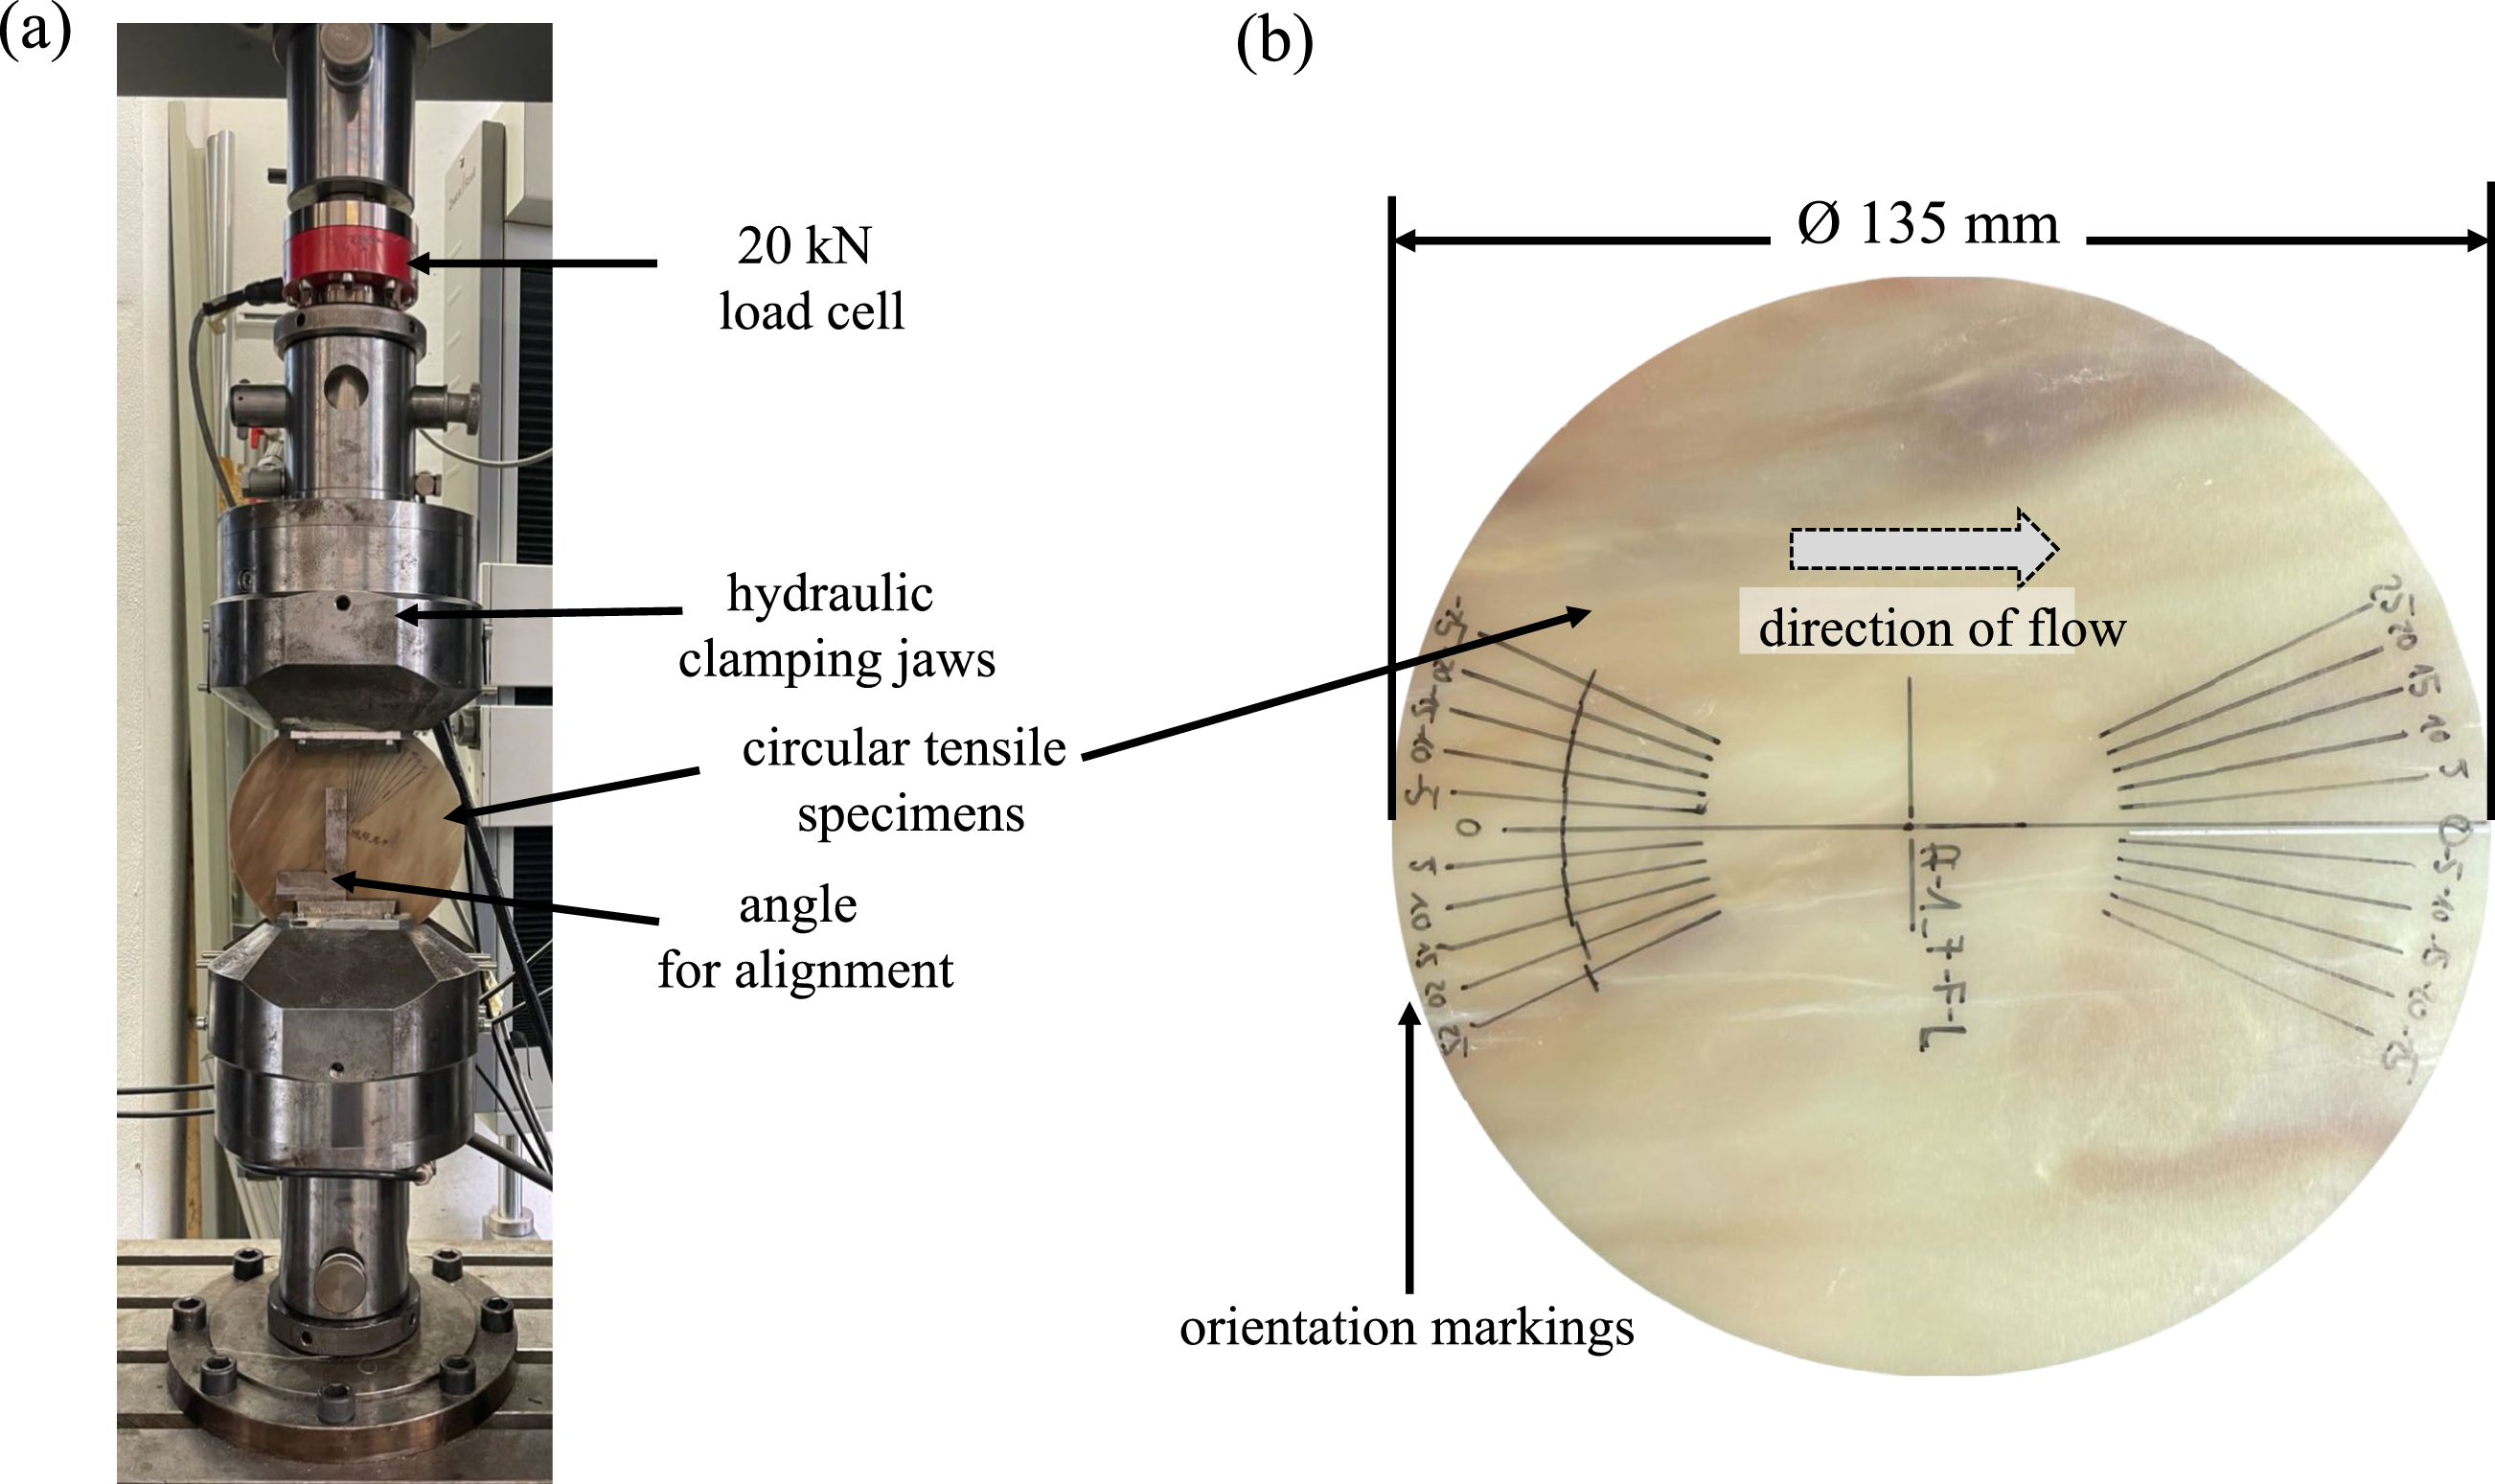
Simulation
In a simulative study, we investigate the influence of the plastificate’s effective density distribution on the flow front’s skewness during mold filling. The simulations were carried out by using Moldflow 2023. The LFT molding compound is modeled as purely viscous, utilizing an isotropic constitutive law similar to 14, 15, 26 of the mold
The investigated height differences ∆h between the ends and midpoint of the plastificate are ∆h ∈ [0, 3, 5, 8] mm (cf. Figure 7). For ∆h = 0 mm, the plastificate has a height of about 18.9 mm. The final mold gap corresponds to the thickness of the physical LFT-D parts. (a) Simulation model of a plastificate with a height difference ∆h between the end and midpoint, and (b) initial second-order fiber orientation tensor field 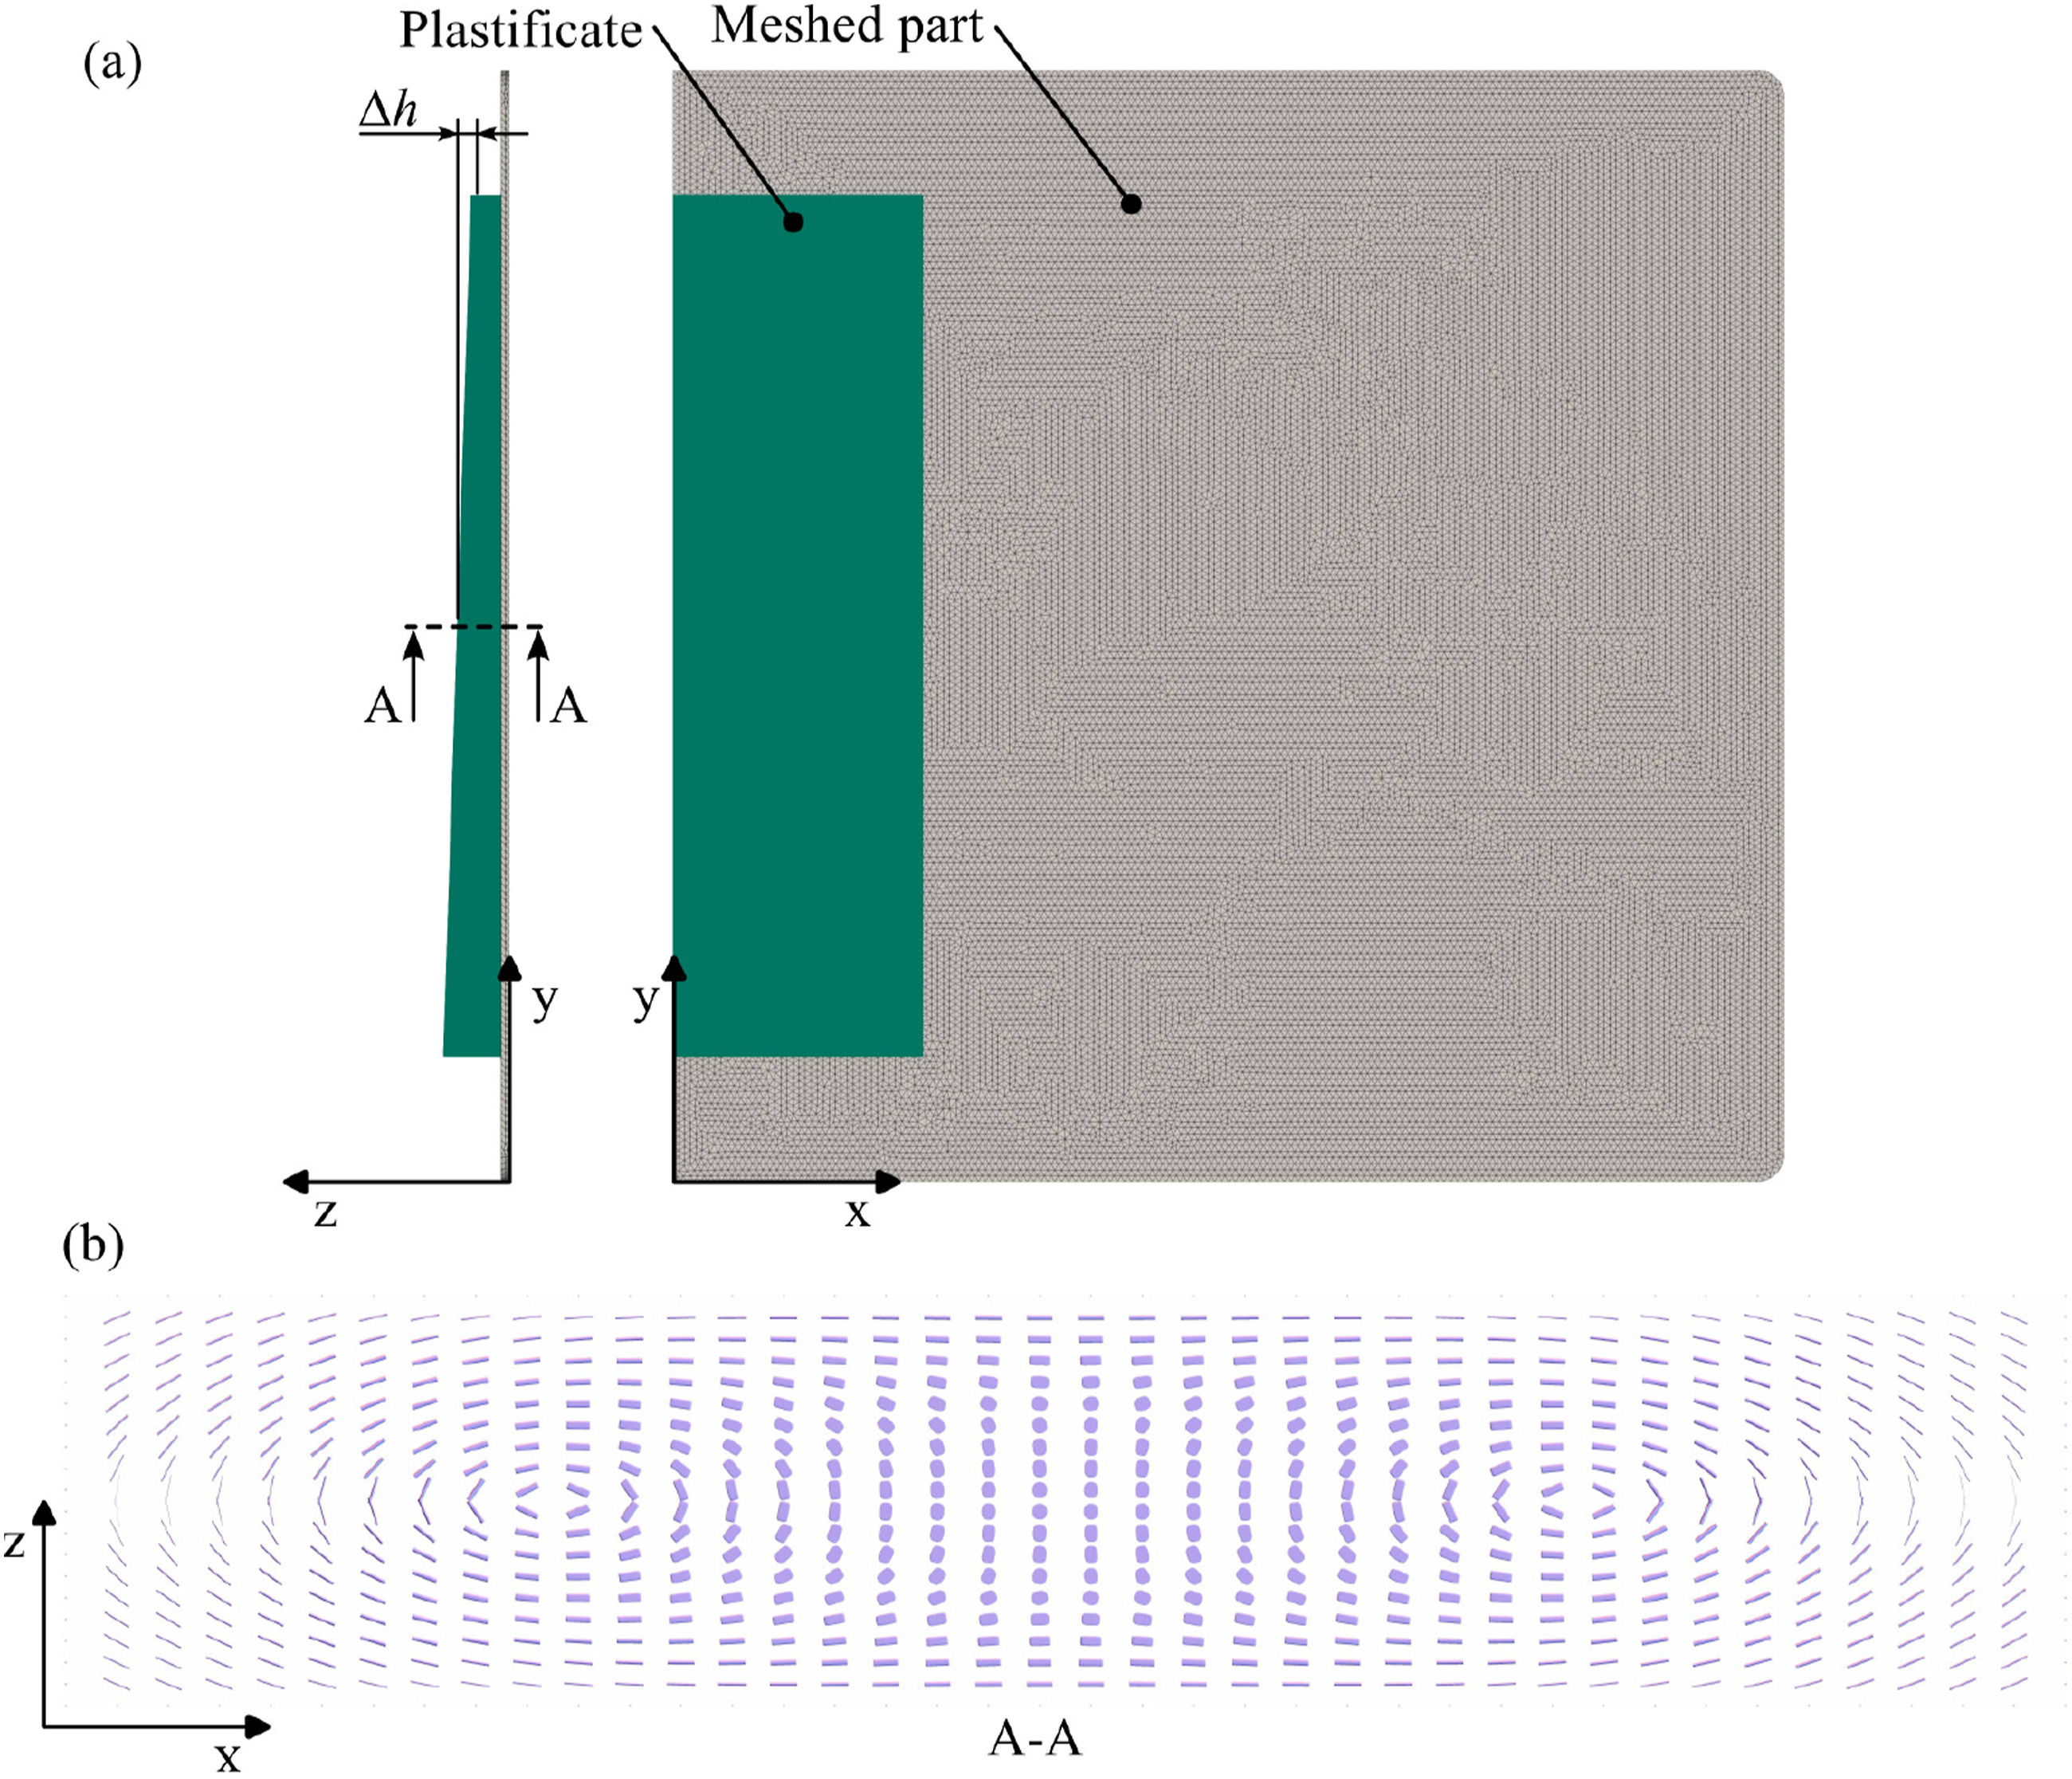
The initial fiber orientation distribution of the plastificate is modeled as described in 15. In this approach, the element- wise second-order fiber orientation tensors 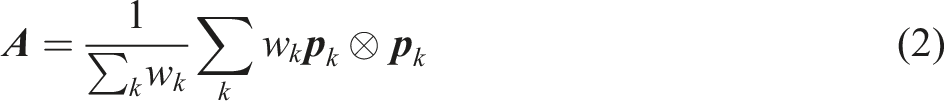
Results and discussion
Origins and effects of FO deviations Ψ are presented in the following subsection from semi-finished LFT-D material and mold filling progression to mechanical properties. The experimental results are rounded off with a simulation.
Plastificate properties
Volume, weight and calculated density of cut plastificate halves sorted by old and new end of the plastificate.
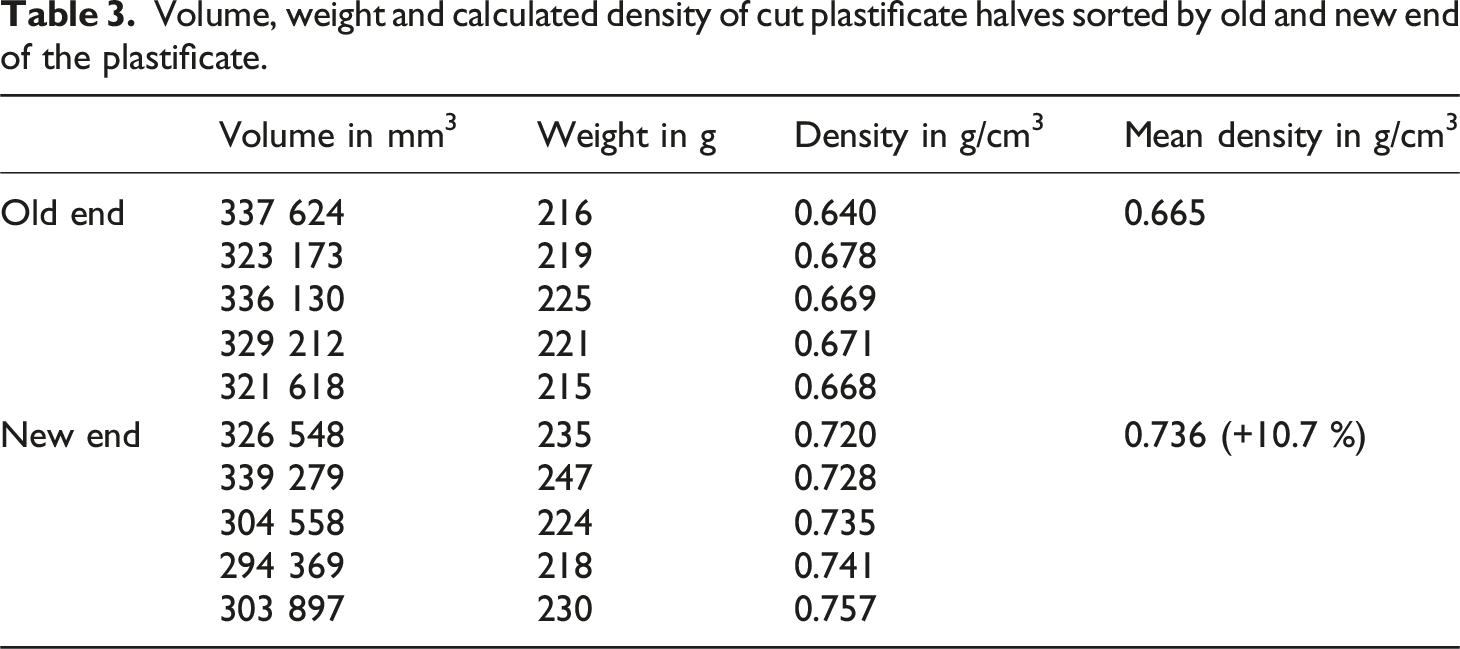
Resulting flowfront skewness
In Figure 8 all calculated sff values are shown. Enveloping groups of five samples each, the box plots are sorted by placement variants (cf. Figure 4) starting with placement position (a through d) followed by direction (cw and ccw). Common to all but two measurements is a negative sff < 0%, implying an area center skewed towards the new end of the plastificate regardless of all other possible factors. Box plot (a) of calculated sff for all parameter sets sorted according to the placement scheme (b). Five samples were measured for every parameter set. Boxes represent centroid positions. For sff = 0, the center of mass of the flow front is evenly distributed with respect to the x, z-plane at y = 200 mm.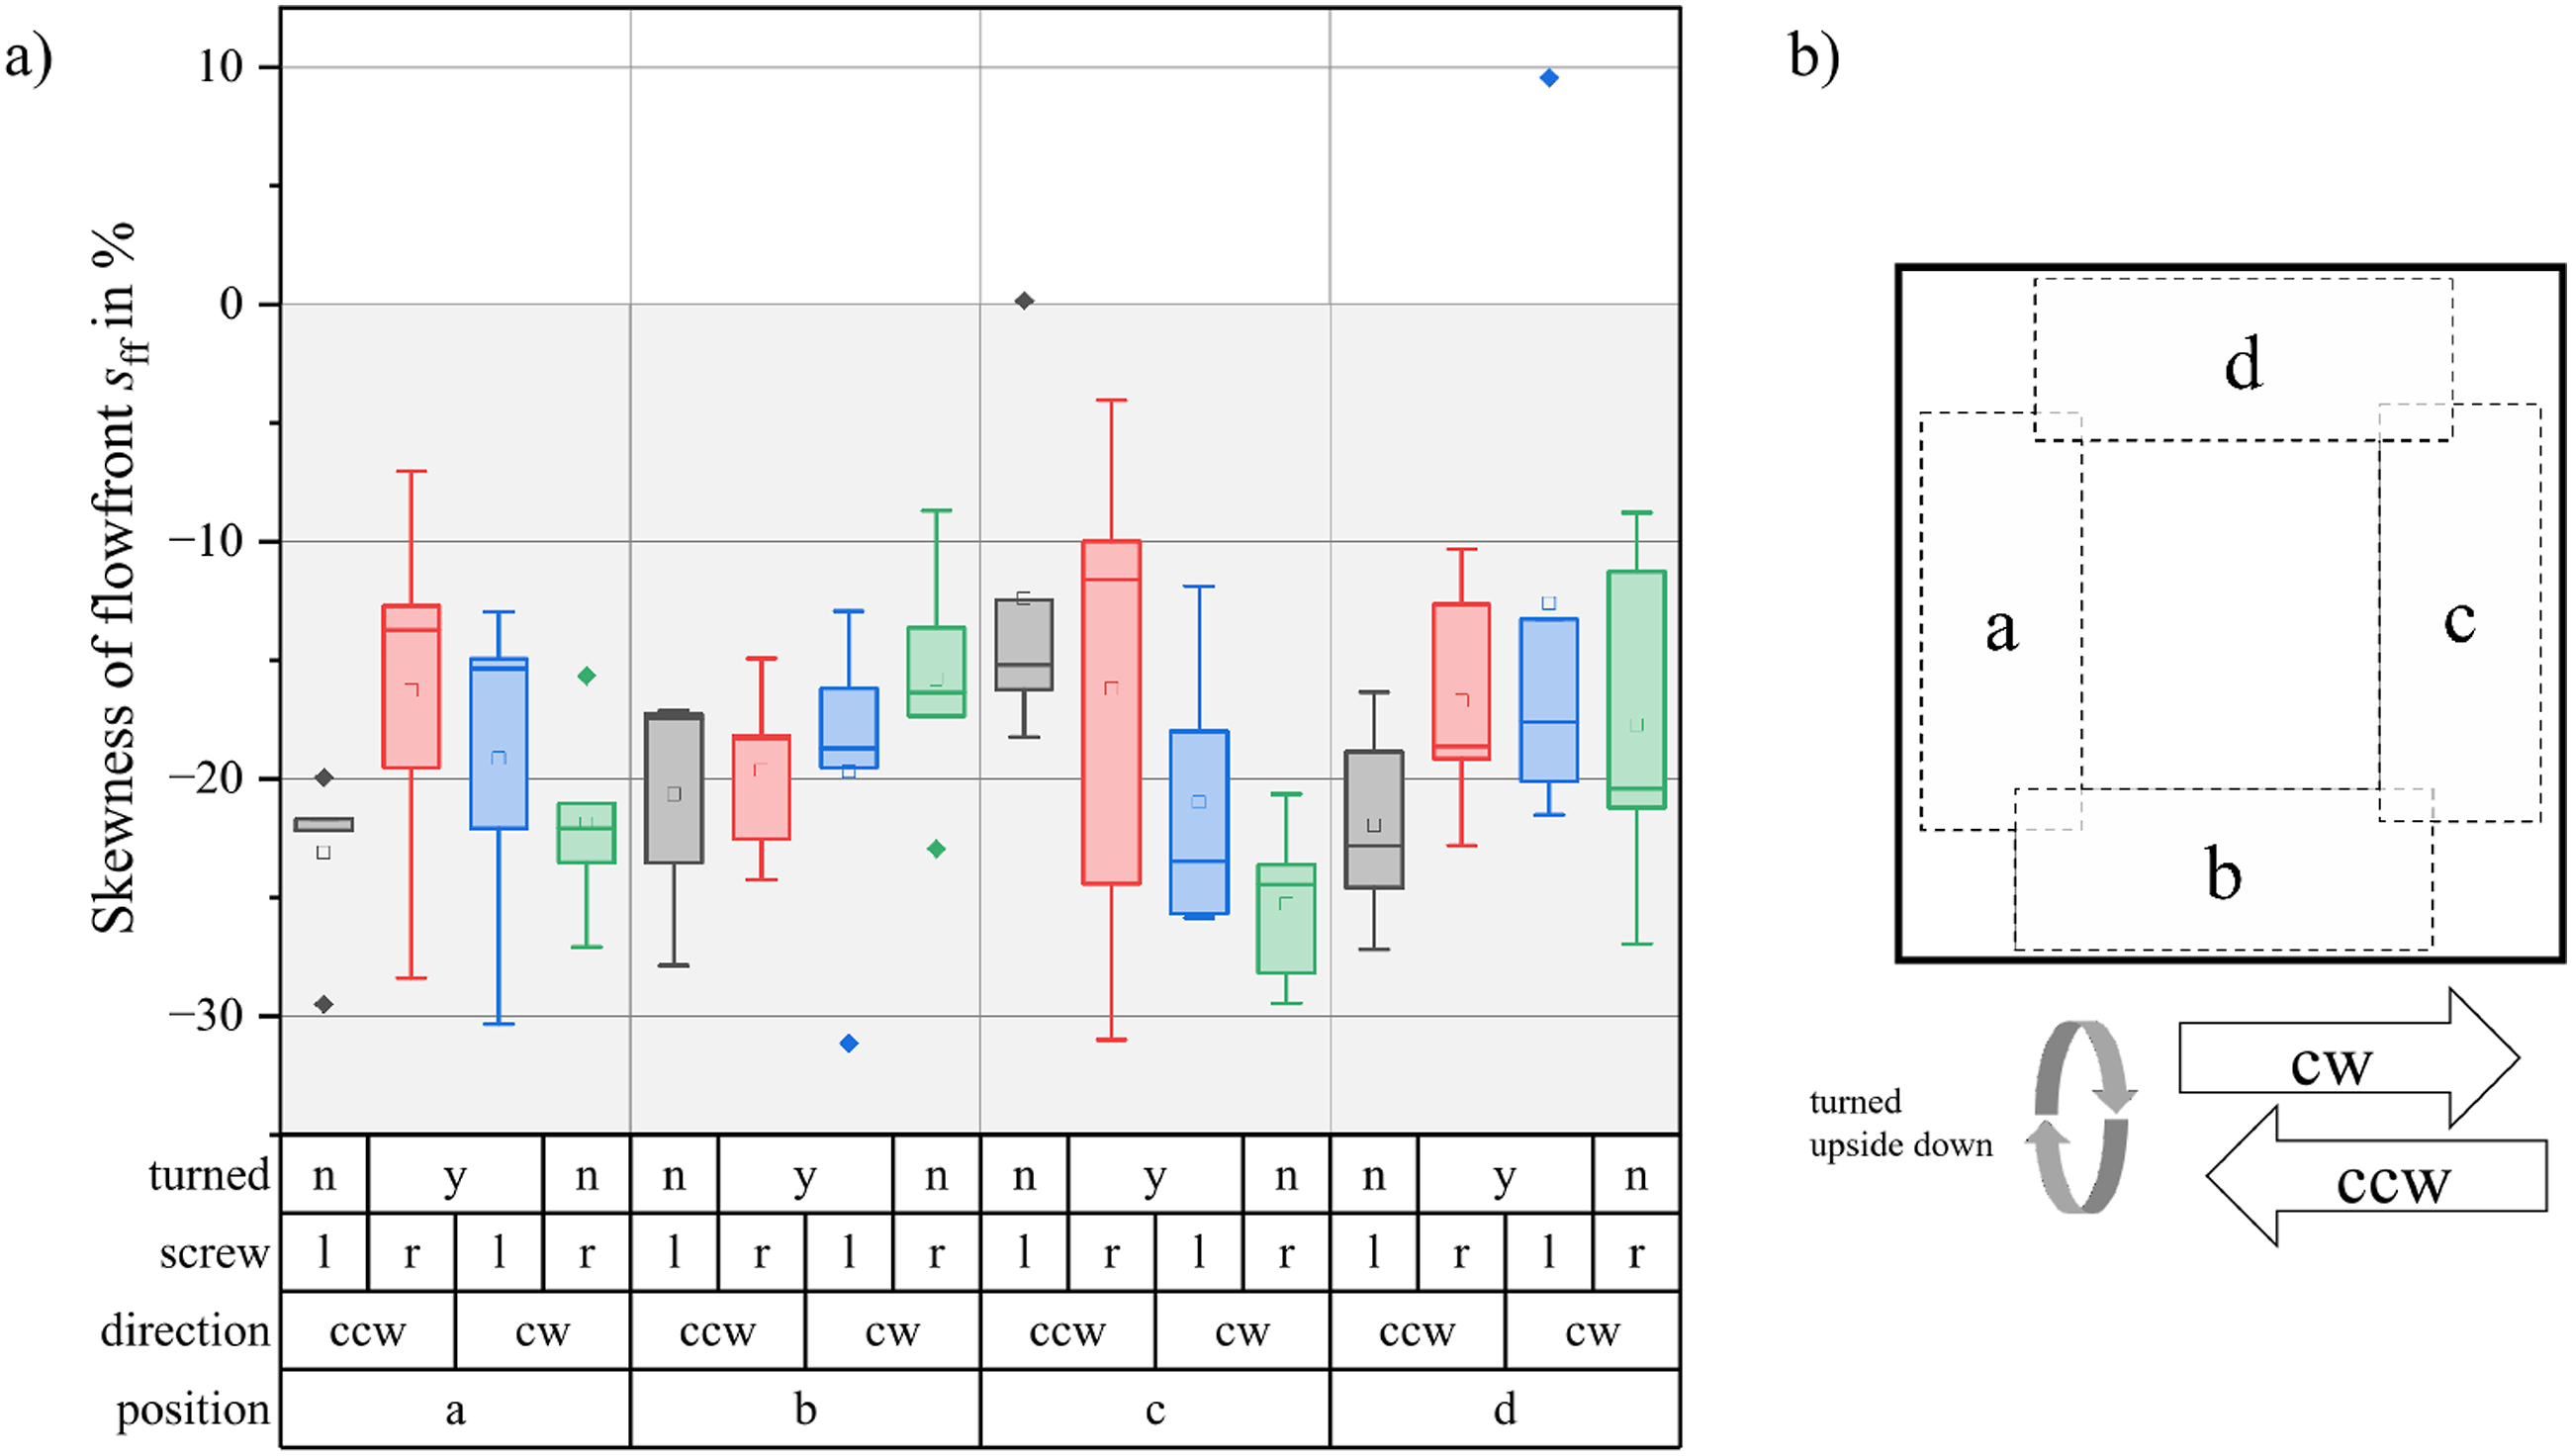
This rules out the processing equipment and procedure as a mayor influence and establishes the flow front skewness as an intrinsic phenomenon of the LFT-D process.
Possible minor influences are discussed here. Material placed in a and c position flows over one axis of the mold and material placed in b and d over the other. Spreading width of sff it is distributed evenly between both flow axes a-c and b-d. The highest deviations however occur when molding from the the c and d placement areas, hinting at possible mold influences where the shared edge of c and d is different.
While the mean for all results (squares within the boxes in Figure 8) can be located in the same band −25% < sff < −10% a step pattern can be perceived when data is sorted as shown here. The pattern is mirrored between position b and c, even with the sff results on the very edges of the plot a, ccw, n (black) and d, cw, n, (green) deviating from the step pattern. This pattern depends on the flow axes mentioned before as it declines for a-c axis and inclines for the b-d axis. Searching for sample pairs showing significant differences in mean sff two stand out especially. On the a-c axis, ff1 with sff,1 = −21.9% (position a, green) and ff6 with sff,6 = −12.4% (position c, dark grey). On the b-d axis, ff2 with sff,2 = −15.8% (position b, green) and ff8 with sff,8 = −22.0% (position d, dark grey). Both pairs share the same flow path and plastificate areas (old and new) are located in the same mold areas.
While literature assumes plastificate microstructure to be symmetrical along the longitudinal axis 9 this is not conclusively researched. Raw material intake into TSE 2 is not symmetrical, both polymer and fiber are introduced onto the left hand screw (indicated in Figure 1). This leads to the fiber rovings pulling on one of the TSE screws also visible in wear patterns on screw elements. To compare this, the first and last sff of every group, black and green, only differ in the placement direction of the plastificate (cf. Figure 8(b)). This also means that the flow of the material starts over the left or the right screw respectively.
For processing reasons, the plastificate must not touch the mold edges, it has to be shorter than the mold. This is reflected in a molding study conducted with plasticine for visualization purposes shown in Figure 9. A part molded from homogeneous plasticine material will exhibit a rounded flow front (bottom row, (a)). Visualized here by the colors is the reason for that: every volume of plasticine has to fill adjacent empty spaces. This will impact especially the outer (yellow) portions of the plasticine and will therefore only flow in flow direction once it has touched the mold edge. Gradually, towards the mold middle line the plasticine volume elements are constrained by their neighbors and will flow in flow direction. This flow patterns skewness is sff = 0, further visualization is provided by the dashed line drawn tangentially to the flow front. This general mold filling behavior, akin to a stretch flow pattern, is present for all samples but is overlaid by other effects for the LFT-D short shots. In the second, (b), part of Figure 9, the plasticine weight distribution is modified to reflect the measurements shown in Table 3. The lower end, equivalent to the new end, has additional plasticine stacked on top. After molding the short shot, the middle segment of the plasticine (purple) is facing slightly upwards. The dashed tangent indicates the shift of the flow fronts crest towards the new end and the general skewness of this short shot. Flow front development for exemplary short shots with homogeneously distributed (a) and eccentrically distributed (b) plasticine material. A colored plasticine “plastificate” is placed in the mold at mold position a (top). After molding a round shape on the flow front can be observed (bottom).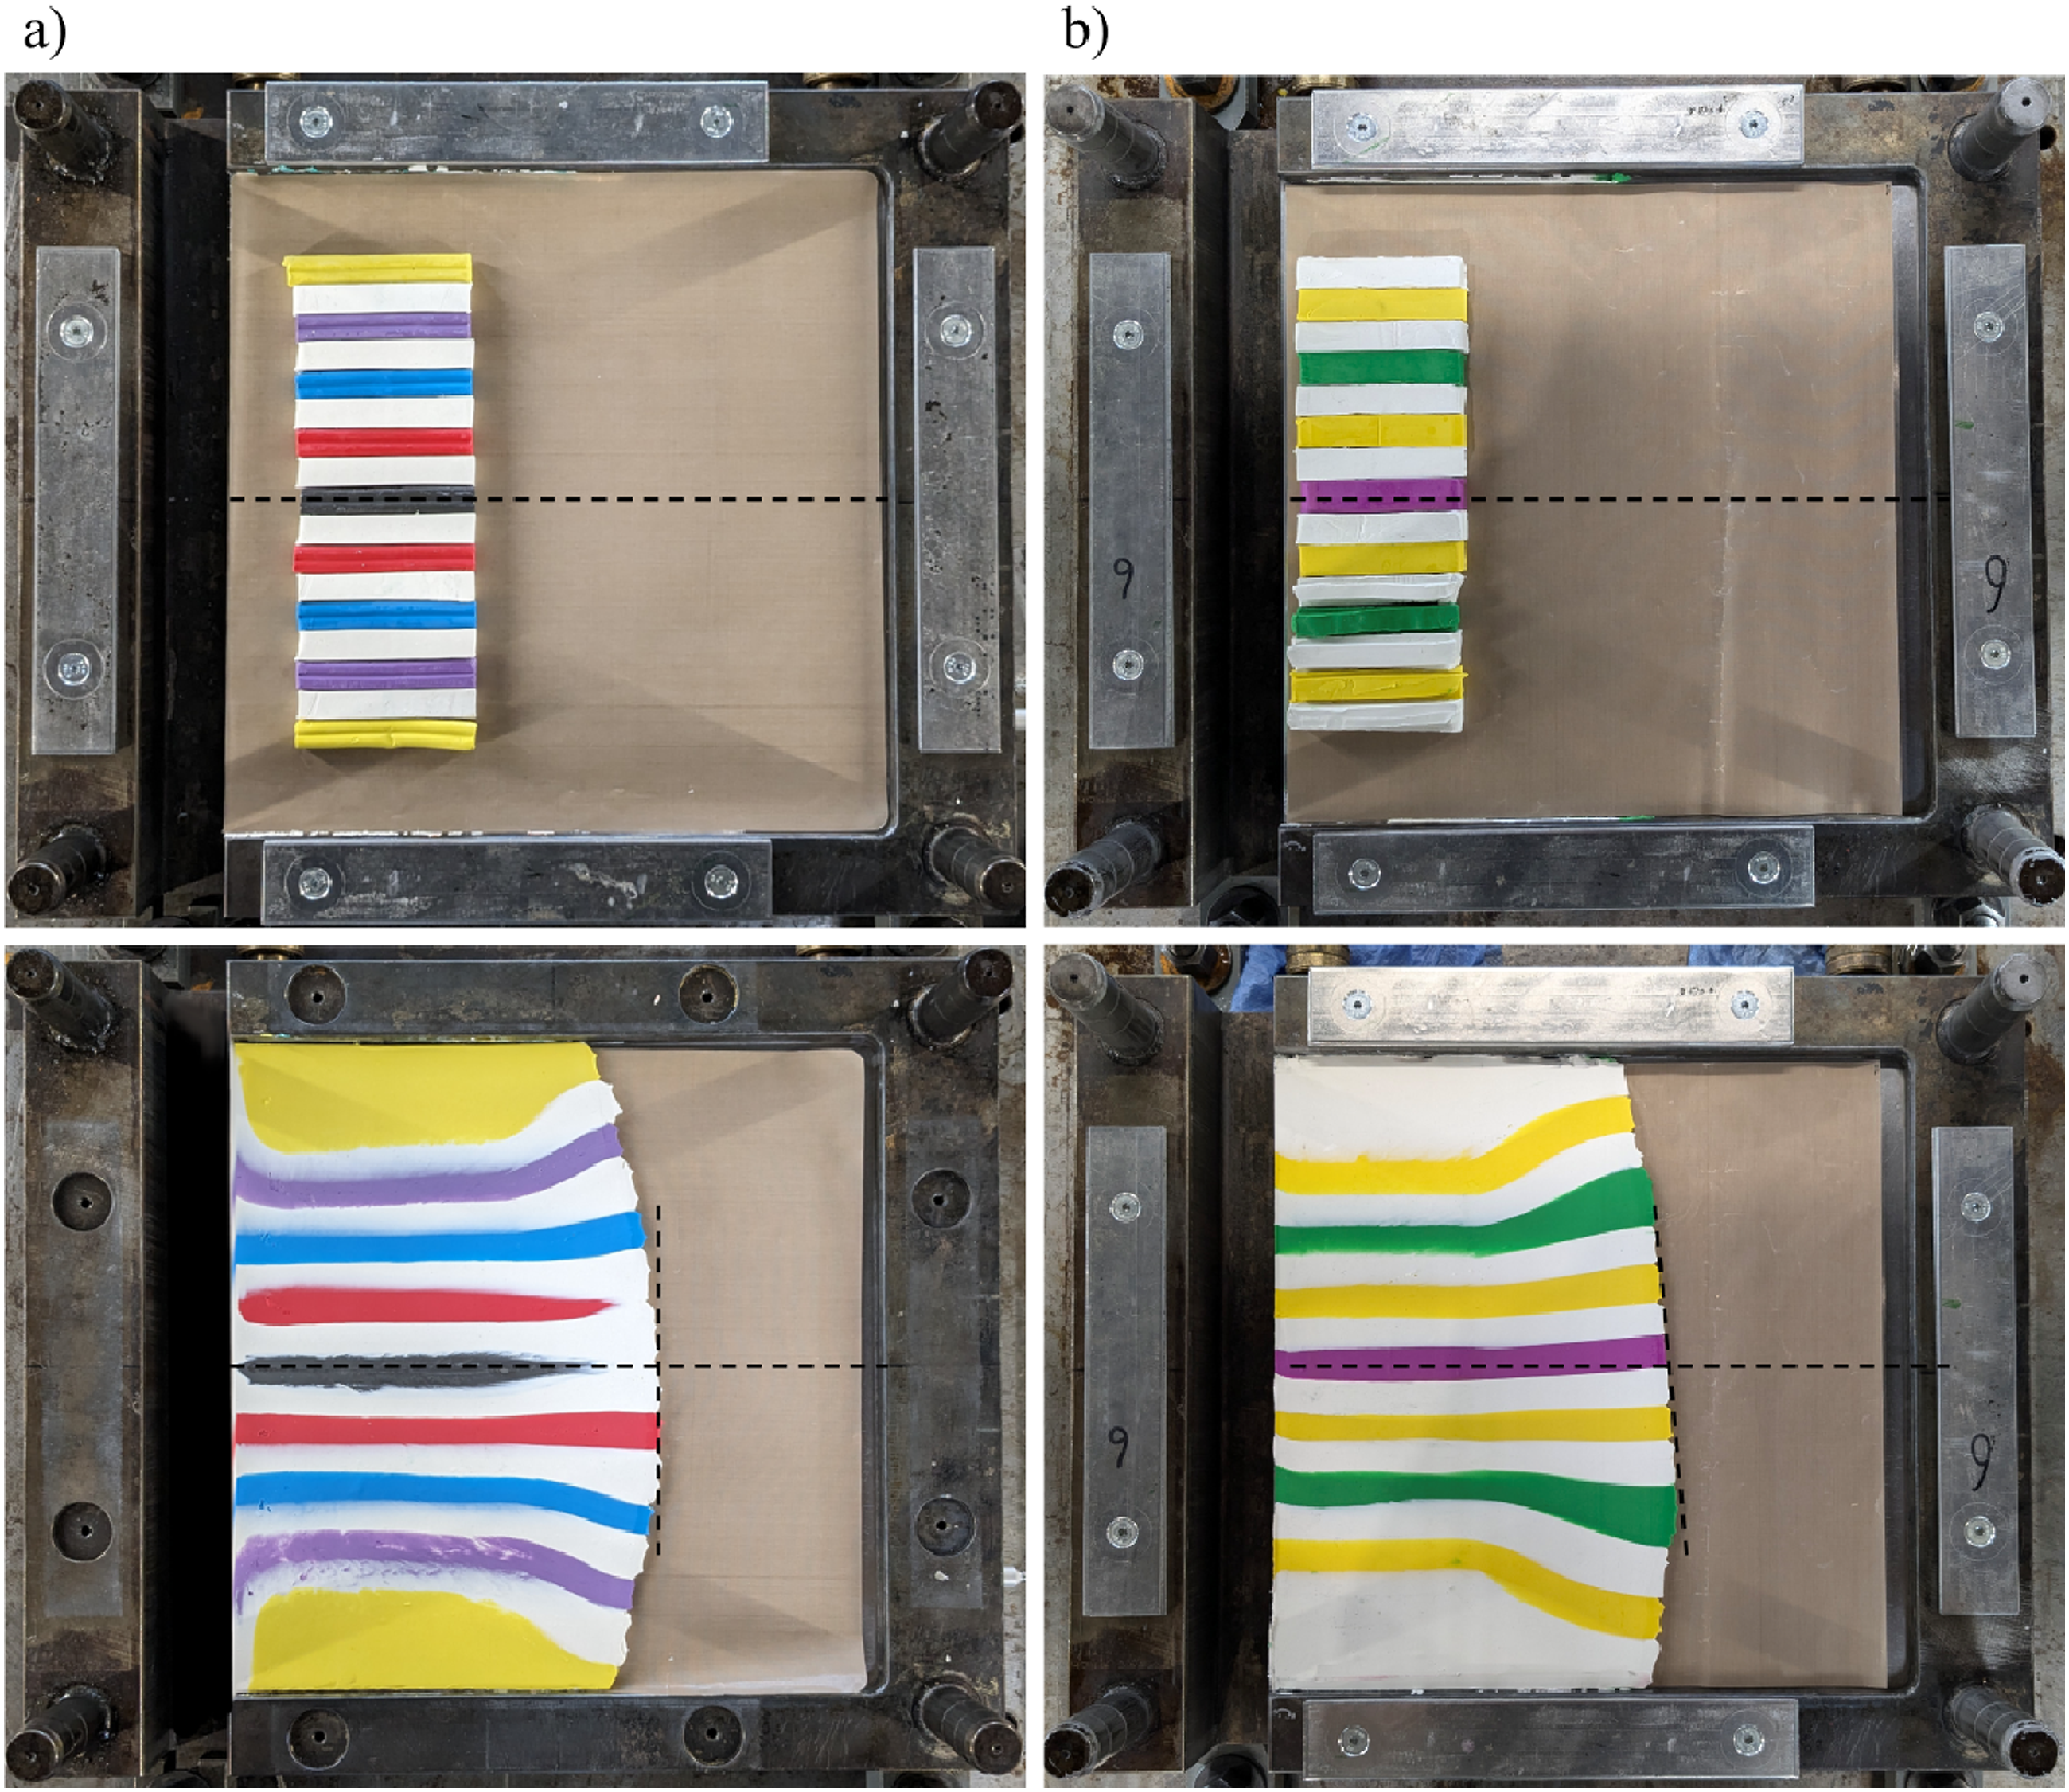
Fiber orientation deviation
The directions Ψ of the maximum pseudo Young’s modulus E∗ from tensile disc characterization for all trial points at position P1 and P2 are presented in Figure 10. Designations of individual plastificate insert positions in the mold are labeled in accordance with the naming conventions provided in Figure 4. Since the drift is suspected to originate in the plastificate, a coordinate system aligned with the plastificate, rather than one fixed to the mold, was selected for the evaluation of results. In this coordinate system, the x-axis always aligns with the flow direction of the plastificate during mold filling, while the y-axis corresponds to the direction of extrusion. Upon initial examination of the results from the left-hand tensile disc, P1, across all 16 configurations, it is notable that the maximum stiffness is consistently shifted towards positive angles (shaded gray). For the right-hand tensile disc, P2, the overwhelming majority of results also indicate a positive orientation of the peak of the tensile properties. When comparing the two positions, it becomes evident that the out-of-phase angle at position P1 is more pronounced at positive angles. This observation is supported by the mean values obtained across all attempts for each position, with P1 exhibiting a mean value of 8.35° and P2 a mean value of 4.02°. Clearly, neither mold filling patterns nor resulting fiber orientations are symmetrical to the mold center line (cf. Figure 2, dashed line). Owing to the significant range of variation in the data and low sample numbers, it is difficult to discern any clear effects related to the insertion position within the mold or the side on which the initial batch was placed. The core observation, that the FO is indeed not symmetrical to the mold middle, does hold nonetheless. Mean values of directions Ψ of pseudo Young’s modulus (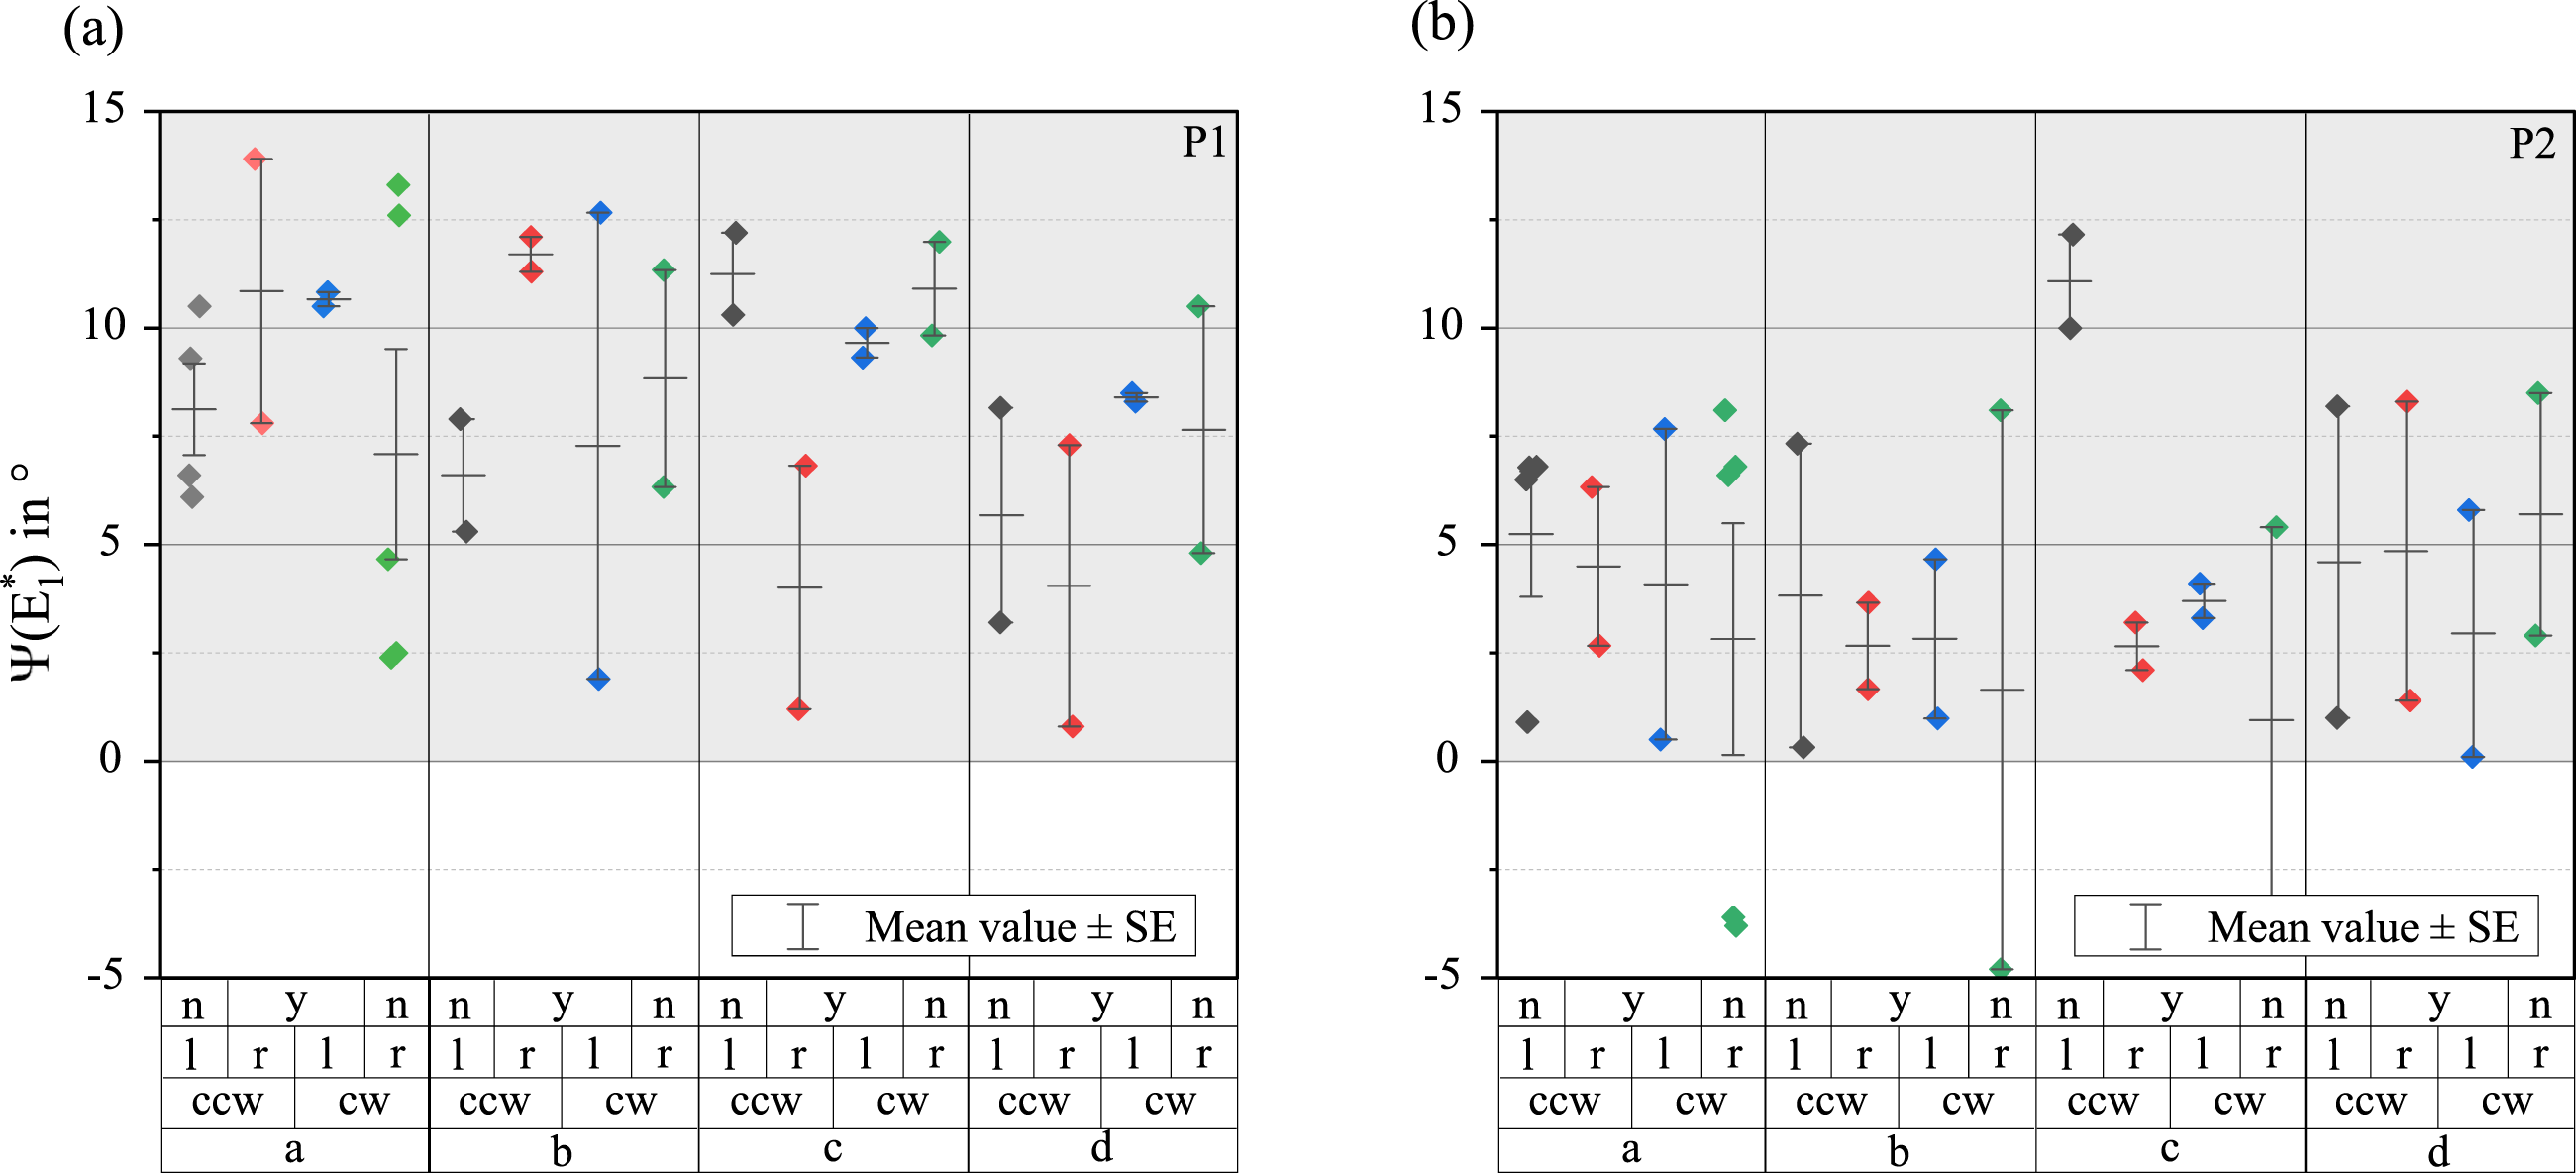
Simulation
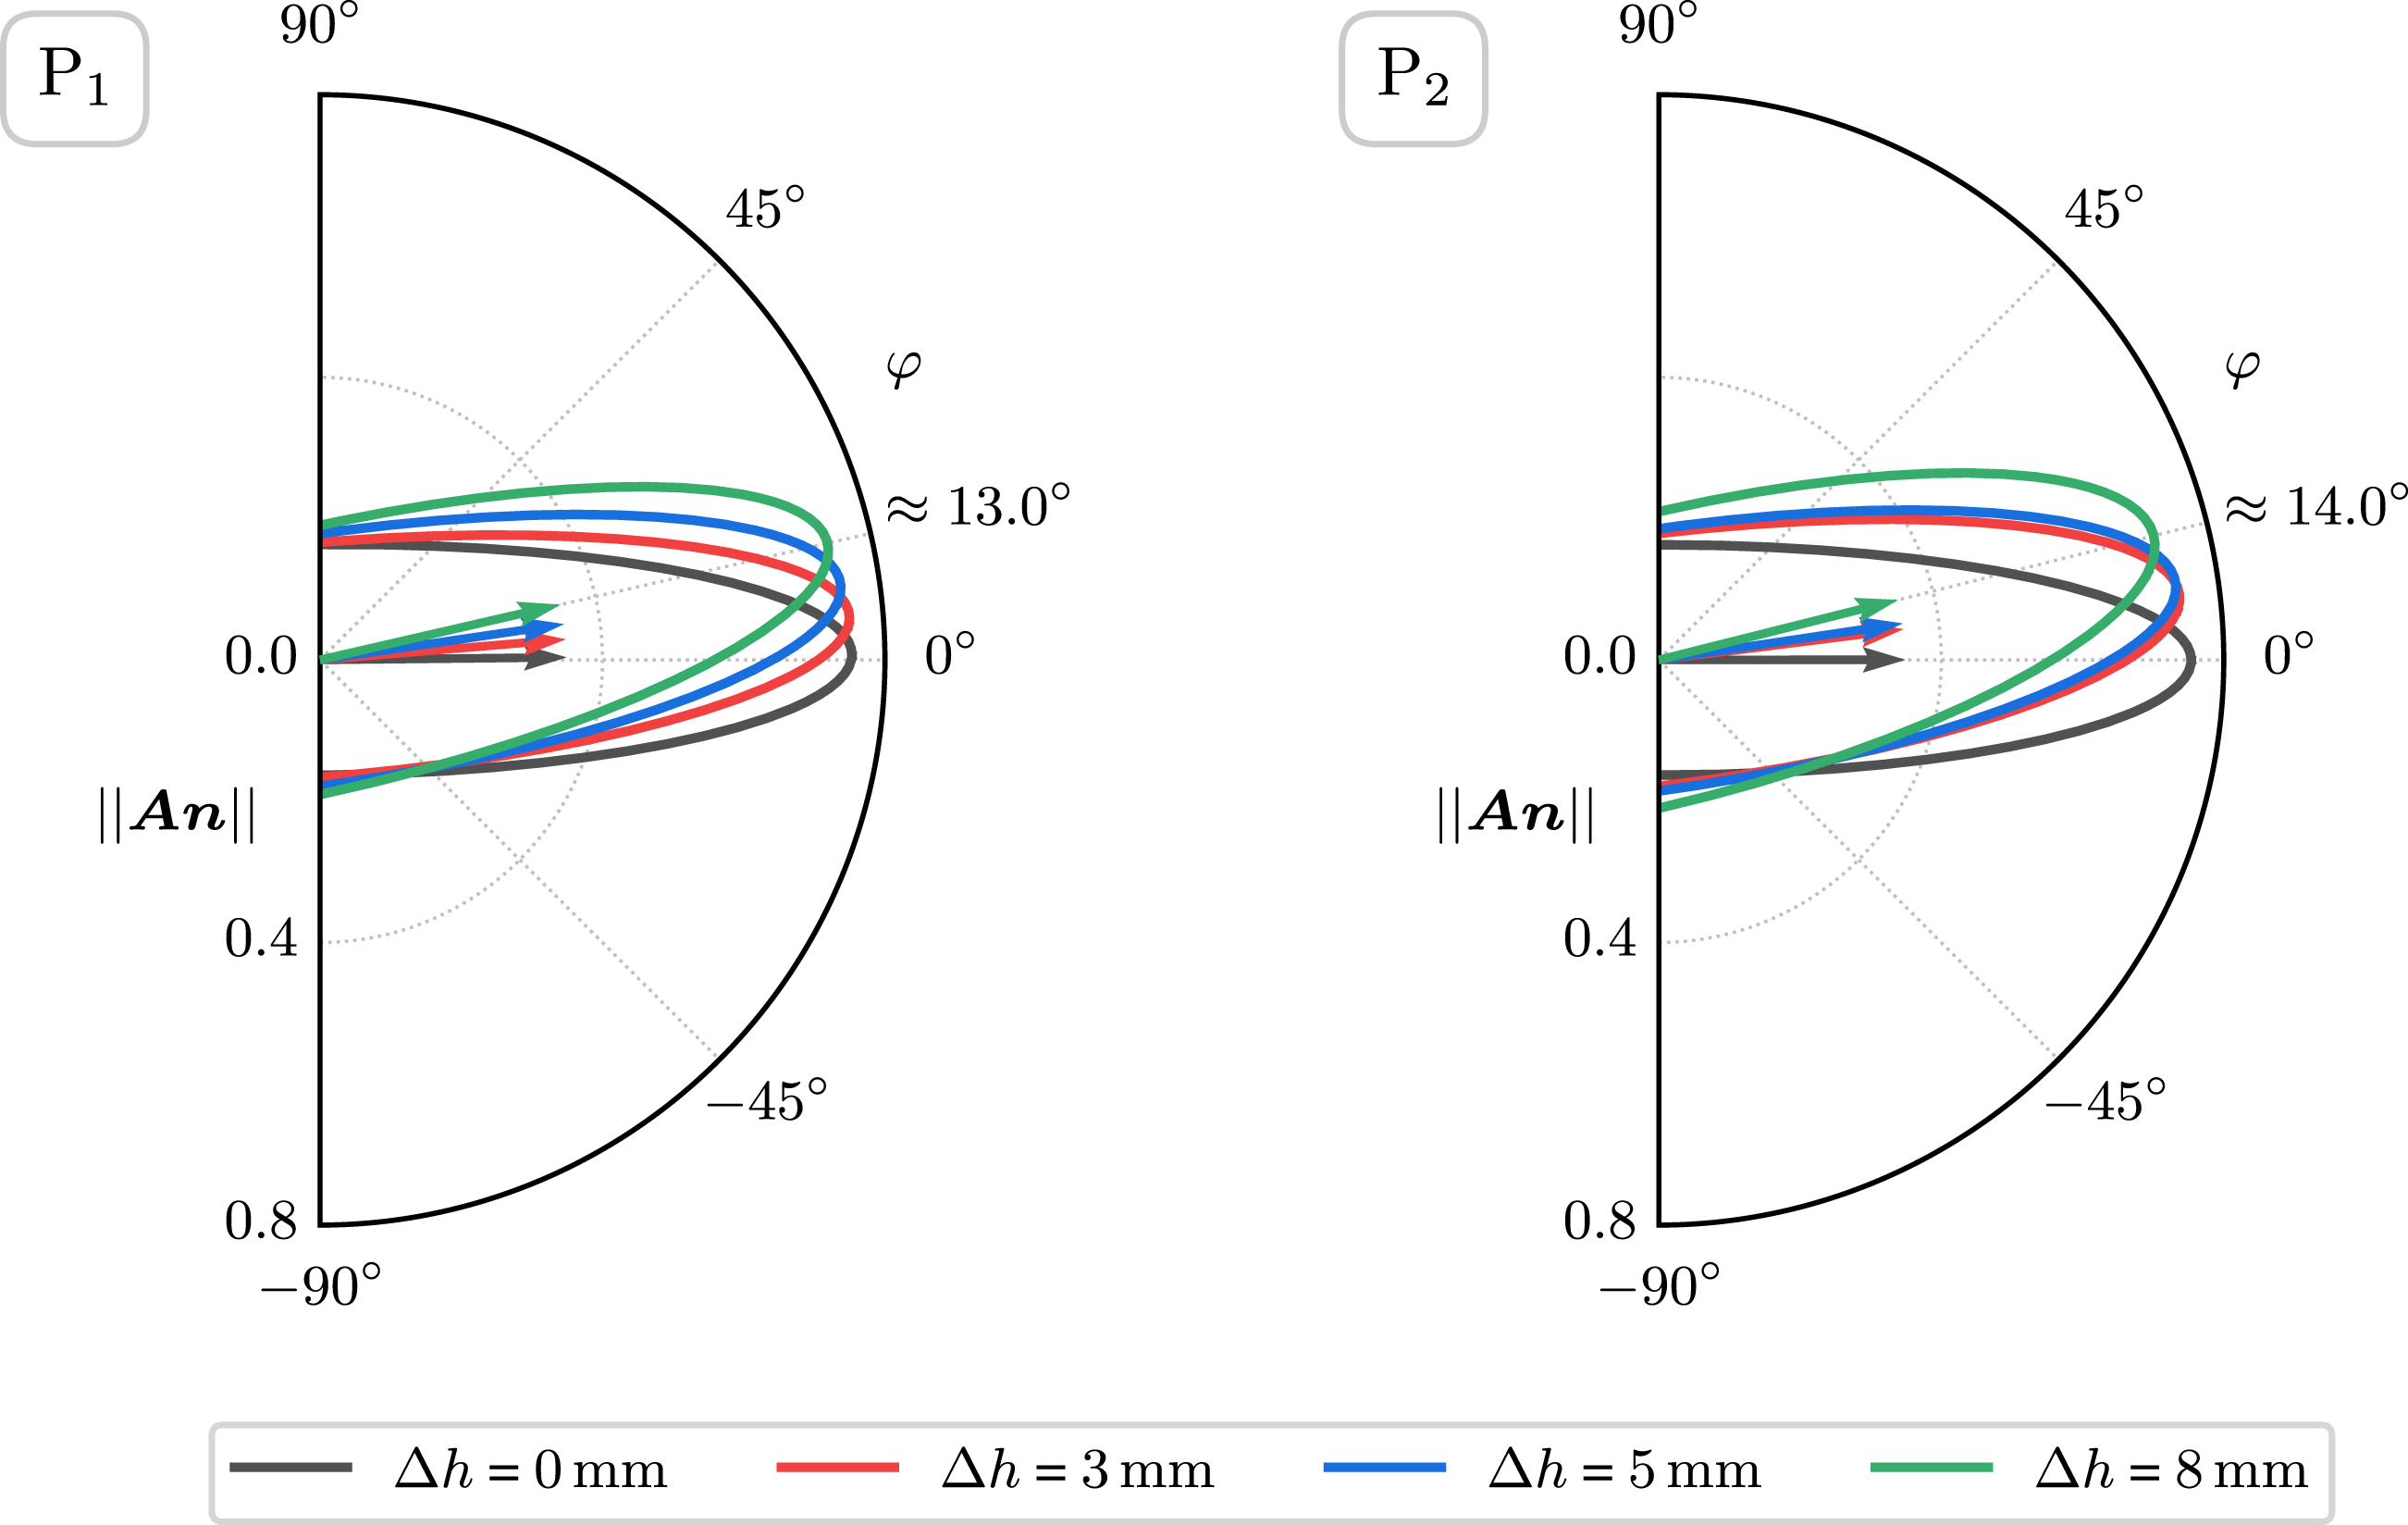
Figure 11 shows the contour plots of the relative fill time through the midplane for different plastificate configurations. To account for the strongly nonlinear volume flow during mold filling, the discrete time points are not equally distributed. As expected, the configuration ∆h = 0 mm has a symmetric flow pattern with respect to the x,z-plane, similar to the experiments with evenly thick plasticine (cf. Figure 9(a)). In contrast, the configurations with variable plastificate height, modeling the density difference from old to new end, exhibit an asymmetrical, skewed flow front pattern. As observed in the experiments, the flow front advances rapidly ahead at the end of the plastificate that exited the extruder most recently (equivalent to the plastificate end with the maximal height in the simulation). As the height gradient in the plastificate increases, the skewness of the flow pattern increases as well. This is also evident in the mean fiber orientation tensor Simulative mold coverage at various relative fill times through the midplane for plastificates with height differences ∆h between the ends and midpoint of plastificates (cf. Figure 7). Projection onto the r,φ-plane of the virtual mean fiber orientation tensors 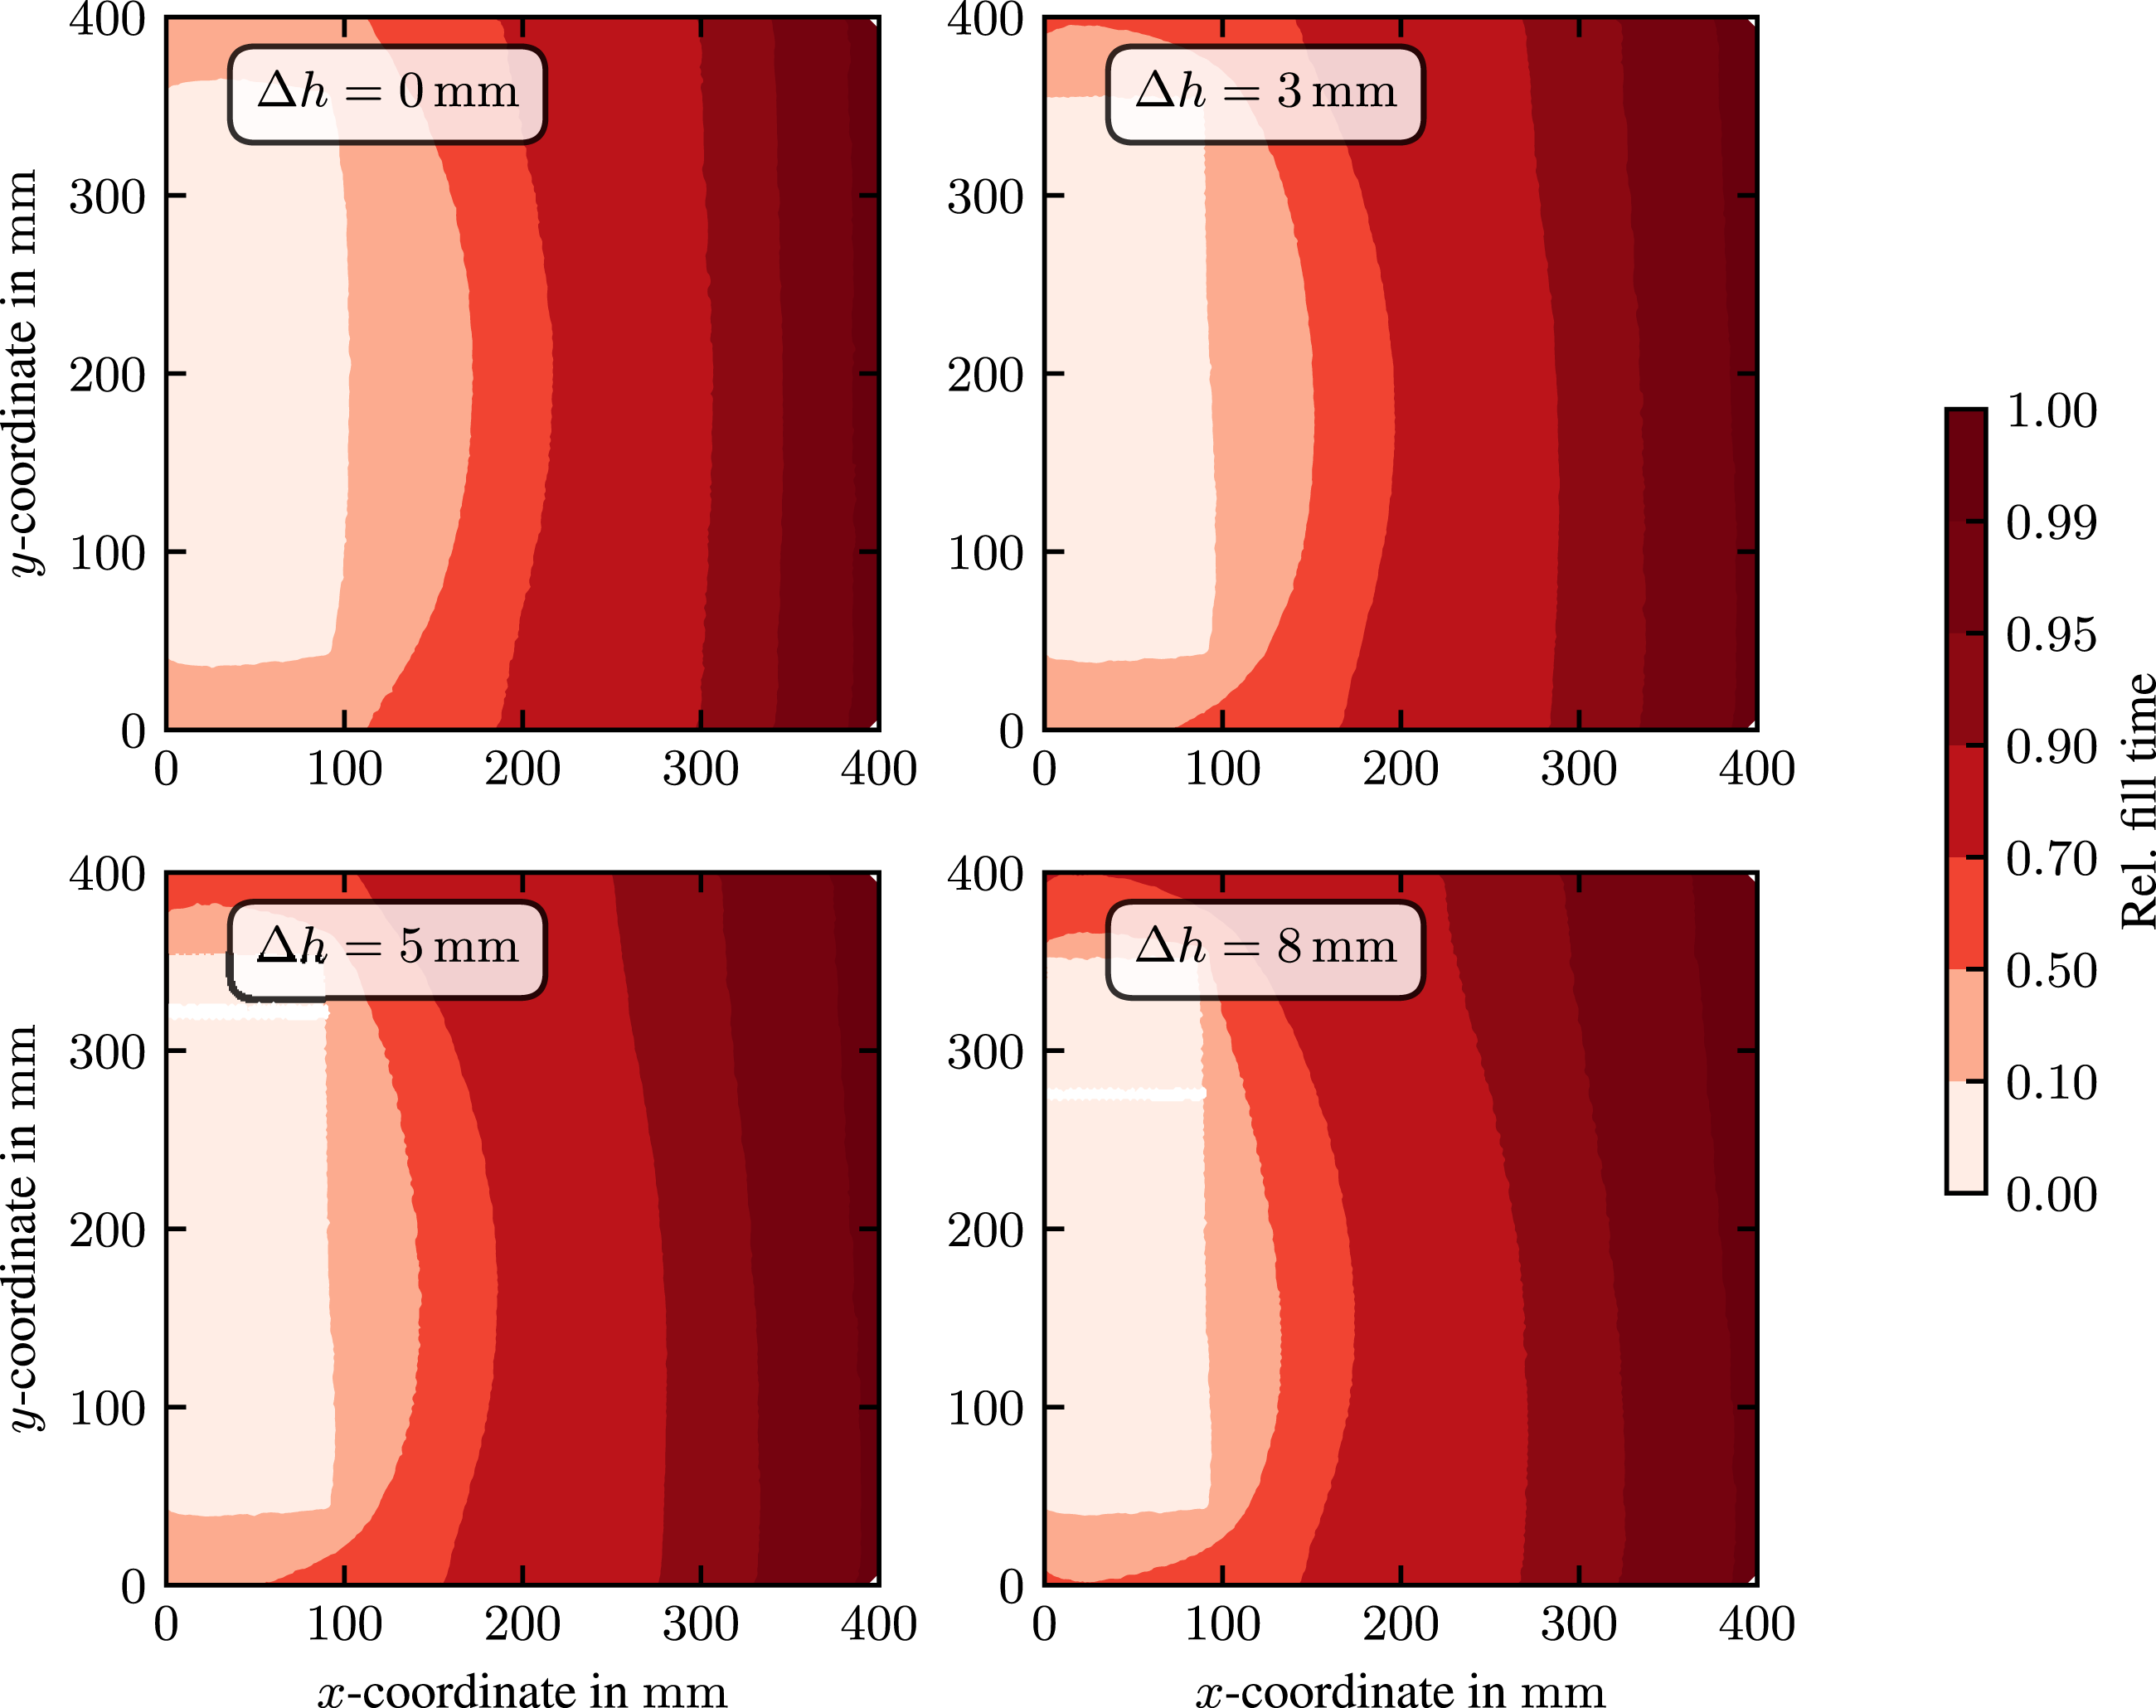
For comparison, analysis of the void content of a PA6 GF LFT-D plastificate using computer tomography (CT) indicates a height difference ∆h of approximately 3 mm – 4 mm between the ends and the midpoint of the plastificate. The simulation results can be explained by the fact that the flow front encounters the mold wall first, resulting in a stronger flow in the y- direction. The flow front is jagged in the experiment and exhibits local directional changes. Owing to the underlying model assumptions, discontinuities at the flow front, as observed in the experiment (cf. Figure 5), cannot be reproduced by the simulation. Therefore, the authors encourage more accurate modeling of the density distribution in the plastificate.
Summary and outlook
A consistently observed phenomenon of LFT-D compression molding, the fiber orientation (FO) deviation Ψ of the first principal FO axis from the expected flow direction, was shown. We suggested a simple method to quantify the flow front skewness sff. In a comprehensive flow study we showed that, independent of various placement strategies, mold filling starts from the new end of the plastificate, as reported in literature. 10 This is observed in short shots as well as in tensile properties, implicitly hinting at deviating FO. Through characterization of the semi-finished material, the plastificate, a new explanation for deviating FO was presented here. A density gradient from the plastificate’s old to the new end, consistently present and a function of time, can be linked to the phenomenon of deviating FO. There is more material on one side of the mold to fill a given volume quicker, leading to skewned mold filling. A simulative study revealed the significance of the effective density distribution on the flow pattern and the resulting fiber orientation distribution. Future work could consider the different densities in simulation.
The density gradient of the LFT-D plastificate has various origins, some beyond, some within user control. In practice, both the type of polymer matrix and the fiber will be specified. Both influence lofting and therefore density development through their viscosity among other.21,27 While time dependency is a process intrinsic factor, it can be mitigated by adjusting the machines output to desired part weight, reducing the cycle time to a minimum. The user can influence the density via processing parameters, especially screw speed 29 and TSE temperatures. 33
LFT-Ds process-microstructure-property relation needs more attention apart from the current focus on fiber lengths. When judging processing parameters like screw speed, supposedly secondary influences like plastificate properties, need to be accounted for as they have an influence on the quality features.
Footnotes
Acknowledgements
The support by the German Research Foundation (DFG) is gratefully acknowledged. Support from DOMO Chemicals GmbH as well as Johns Manville Germany GmbH is gratefully acknowledged.
Authors contribution
Conceptualization, C.S., B.M.S. and L.S.; methodology, C.S., B.M.S. and L.S.; investigation, C.S., B.M.S and L.S; resources, F.H.; writing—original draft preparation, C.S., B.M.S. and L.S.; writing—review and editing, W.V.L., A.H., L.K., K.A.W. and F.H.; supervision, W.V.L., A.H., L.K., K.A.W. and F.H.; funding acquisition, W.V.L., L.K., K.A.W. and F.H.. All authors have read and agreed to the published version of the manuscript.
Declaration of conflicting interests
The author(s) declared no potential conflicts of interest with respect to the research, authorship, and/or publication of this article.
Funding
The author(s) disclosed receipt of the following financial support for the research, authorship, and/or publication of this article: The research documented in this manuscript has been funded by the Deutsche Forschungsgemeinschaft (DFG, German Research Foundation), project number 255730231, within the International Research Training Group “Integrated engineering of continuous- discontinuous long fiber-reinforced polymer structures” (GRK 2078).