
Abstract
The aim of this study is to explore the possibility of using polyamide (PA) as a reinforcement with glass (G) fiber to form new hybrid composites with improved physical and mechanical properties. PA-G–reinforced epoxy hybrid composites were designed, fabricated using the hand layup technique in inter-ply configuration and their mechanical properties were investigated. Results are presented regarding the tensile, flexural, and in-plane shear behaviors of the fabricated composites with a particular consideration of the effects of the stacking sequence and PA-fiber relative volume fraction, (vPA/vtot). The experimental results reveal that the existence of G-fiber at the composite external layers and PA-fiber in the core improves the tensile and flexural properties but worsens the shear properties. Also, increasing (vPA/vtot) upgrades the tensile properties but deteriorates the flexural and shear properties. The merits of the hybridization in the current study are lesser cost compared to pure PA-composite and lightweight and better ductility compared to pure G-composite with improved mechanical properties. As a result, these hybrid composites are suitable for medium load applications.
Introduction
A hybrid composite is a material made by combining two or more different reinforcements embedded in one or more types of matrices. It allows designers to tailor the composite properties to satisfy specific requirements compared with conventional composites. 1 The purpose of the hybridization is to achieve a new material retaining the advantages of its constituents, and/or to lower the cost, some reinforcements being more expensive than others. 2 –4 Hybrid composites offer a range of properties intermediate between the two originating materials and cannot be achieved with a single reinforcement. The obtained hybrid systems combine the privileges of each used reinforcement type into a single hybrid composite. They have proven to create a balance effect within the fibers incorporated in the composite materials. 5
The development of hybrid composites has been motivated from industry because of the improved performance as well as reduced weight and cost that hybrids could provide. 6 These mechanical properties of hybrid composites can be tailored by changing the fibers relative volume fractions, fibers orientation, plies stacking sequence, and hybrid configuration. 7,8 Consequently, the complete and accurate knowledge of the mechanical properties of hybrid composites becomes important in approximating the design requirements or in developing new hybrid materials. 9,10
According to Mészáros, 11 hybrid systems can be classified into three basic types. The first type is when at least two matrices are hybridized as performed by Mészáros and Turcsán. 12 The second way of hybridization is when there are at least two types of reinforcing materials as reported by Sathishkumar et al. 13 The reinforcing materials used in hybrids may be fibers, whiskers, or nanoparticles. The third way when at least two matrices and two reinforcing materials are hybridized as mentioned by Szebényi et al. 14
The mechanical properties of hybrid composites, for example, strength and modulus of elasticity, differ from those predicted by the standard rule of mixtures (RoM) 15 with the concept of “hybrid effect” being introduced to take into account the difference between the properties of hybrid composites when compared to the RoM. This hybrid effect was first noted by Hayashi 16 and is known to influence several composite properties related to strength such as the specific flexural strength and robustness.
The use of different types of reinforcement within an individual “hybrid” composite has been the subject of work since the early 1970s. For example, combinations of reinforcement investigated in hybrid composites have included glass and carbon fibers, 17 –20 glass and graphite fibers, 21,22 glass and steel fibers, 23 glass and bamboo fibers, 24 and glass and aramid fibers. 25 As seen, numerous studies have been conducted to evaluate the mechanical properties of glass fiber composite and its hybrids.
The lack of data on polyamide (PA)-glass (G) fibers hybrid composites is the rationale behind this experimental work, whereas the common usage of PA is in a matrix form. The main objective of the work is to explore the possibility of using PA-fiber with G-fiber to create a new hybrid system. The effects of fundamental parameters, namely, the stacking sequence and PA-fiber relative volume fraction,
Experimental
Materials
The materials used in this study are as follows:
Glass fiber
G-fiber is the most commonly used reinforcement in polymeric composites. Its advantages are the availability, high temperature resistance, non-flammability, corrosion-resistance, heat and sound insulation, and high strength and stiffness. Moreover, it is cheaper and less brittle than other fiber types such as carbon and Kevlar 26 . G-fiber has its limitations which are the high density and low ductility compared to PA-fiber. The weakness points in G-fiber will be enhanced and recovered by hybridizing it with PA-fiber. The used chopped E-glass mat has an areal density of 200 ± 10 g m−2.
Polyamide fiber
PA-fiber is a strong thermoplastic fiber. Its advantages are the availability, good impact and fatigue strength, lightweight, very good corrosion resistance, high thermal stability, and high wear resistance. 27 These properties make the PA-fiber an ideal material for metal replacement in different applications, such as automotive parts, industrial valves, railway tie insulators, and other industry uses, whose design requirements include high strength, toughness, and weight reduction. The used unidirectional PA-fiber has a linear density of 0.3 ± 0.01 g m−1.
Epoxy
A bicomponent epoxy resin, Kemapoxy 150 RGL, was selected as a polymer matrix. The chosen epoxy resin has performance advantages over polyester and vinyl ester in five major areas: better adhesive properties (the ability to bond the reinforcement); superior mechanical properties (particularly strength and stiffness); improved resistance to fatigue and micro cracking; reduced degradation from water ingress (diminution of properties due to water penetration); and increased resistance to osmosis (surface degradation due to water permeability).
The physical and mechanical characteristics of the used materials are listed in Table 1.
The physical and mechanical properties for the used fibers and matrix, given by the suppliers.
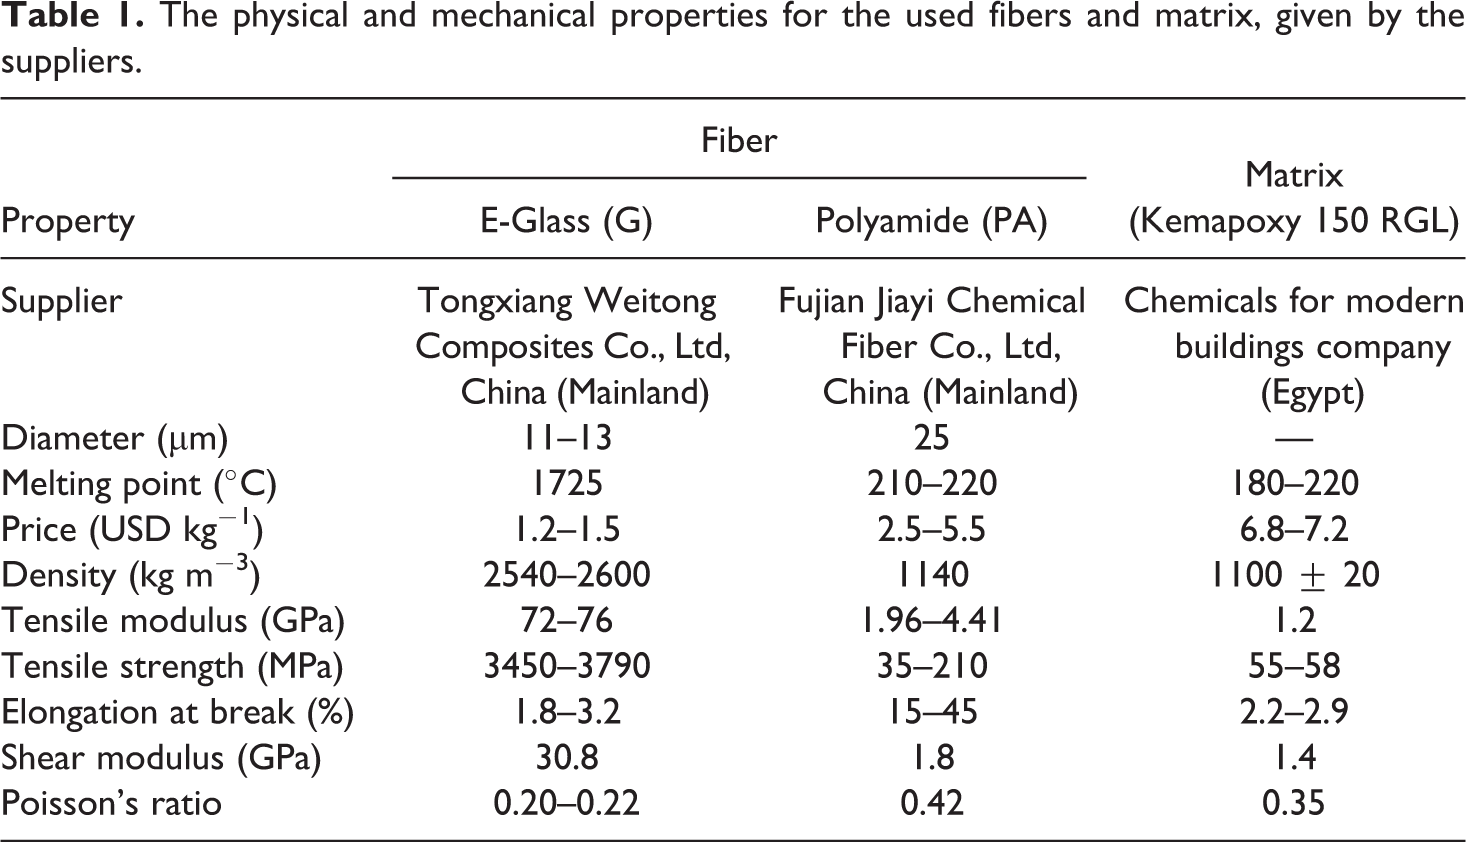
As shown in Table 1, each fiber type has its own properties which distinguish it from the other type. G-fiber has higher melting point, lower cost, and better strength and stiffness compared to PA-fiber, while PA-fiber is lighter and more ductile than G-fiber.
Fabrication of hybrid composite laminates
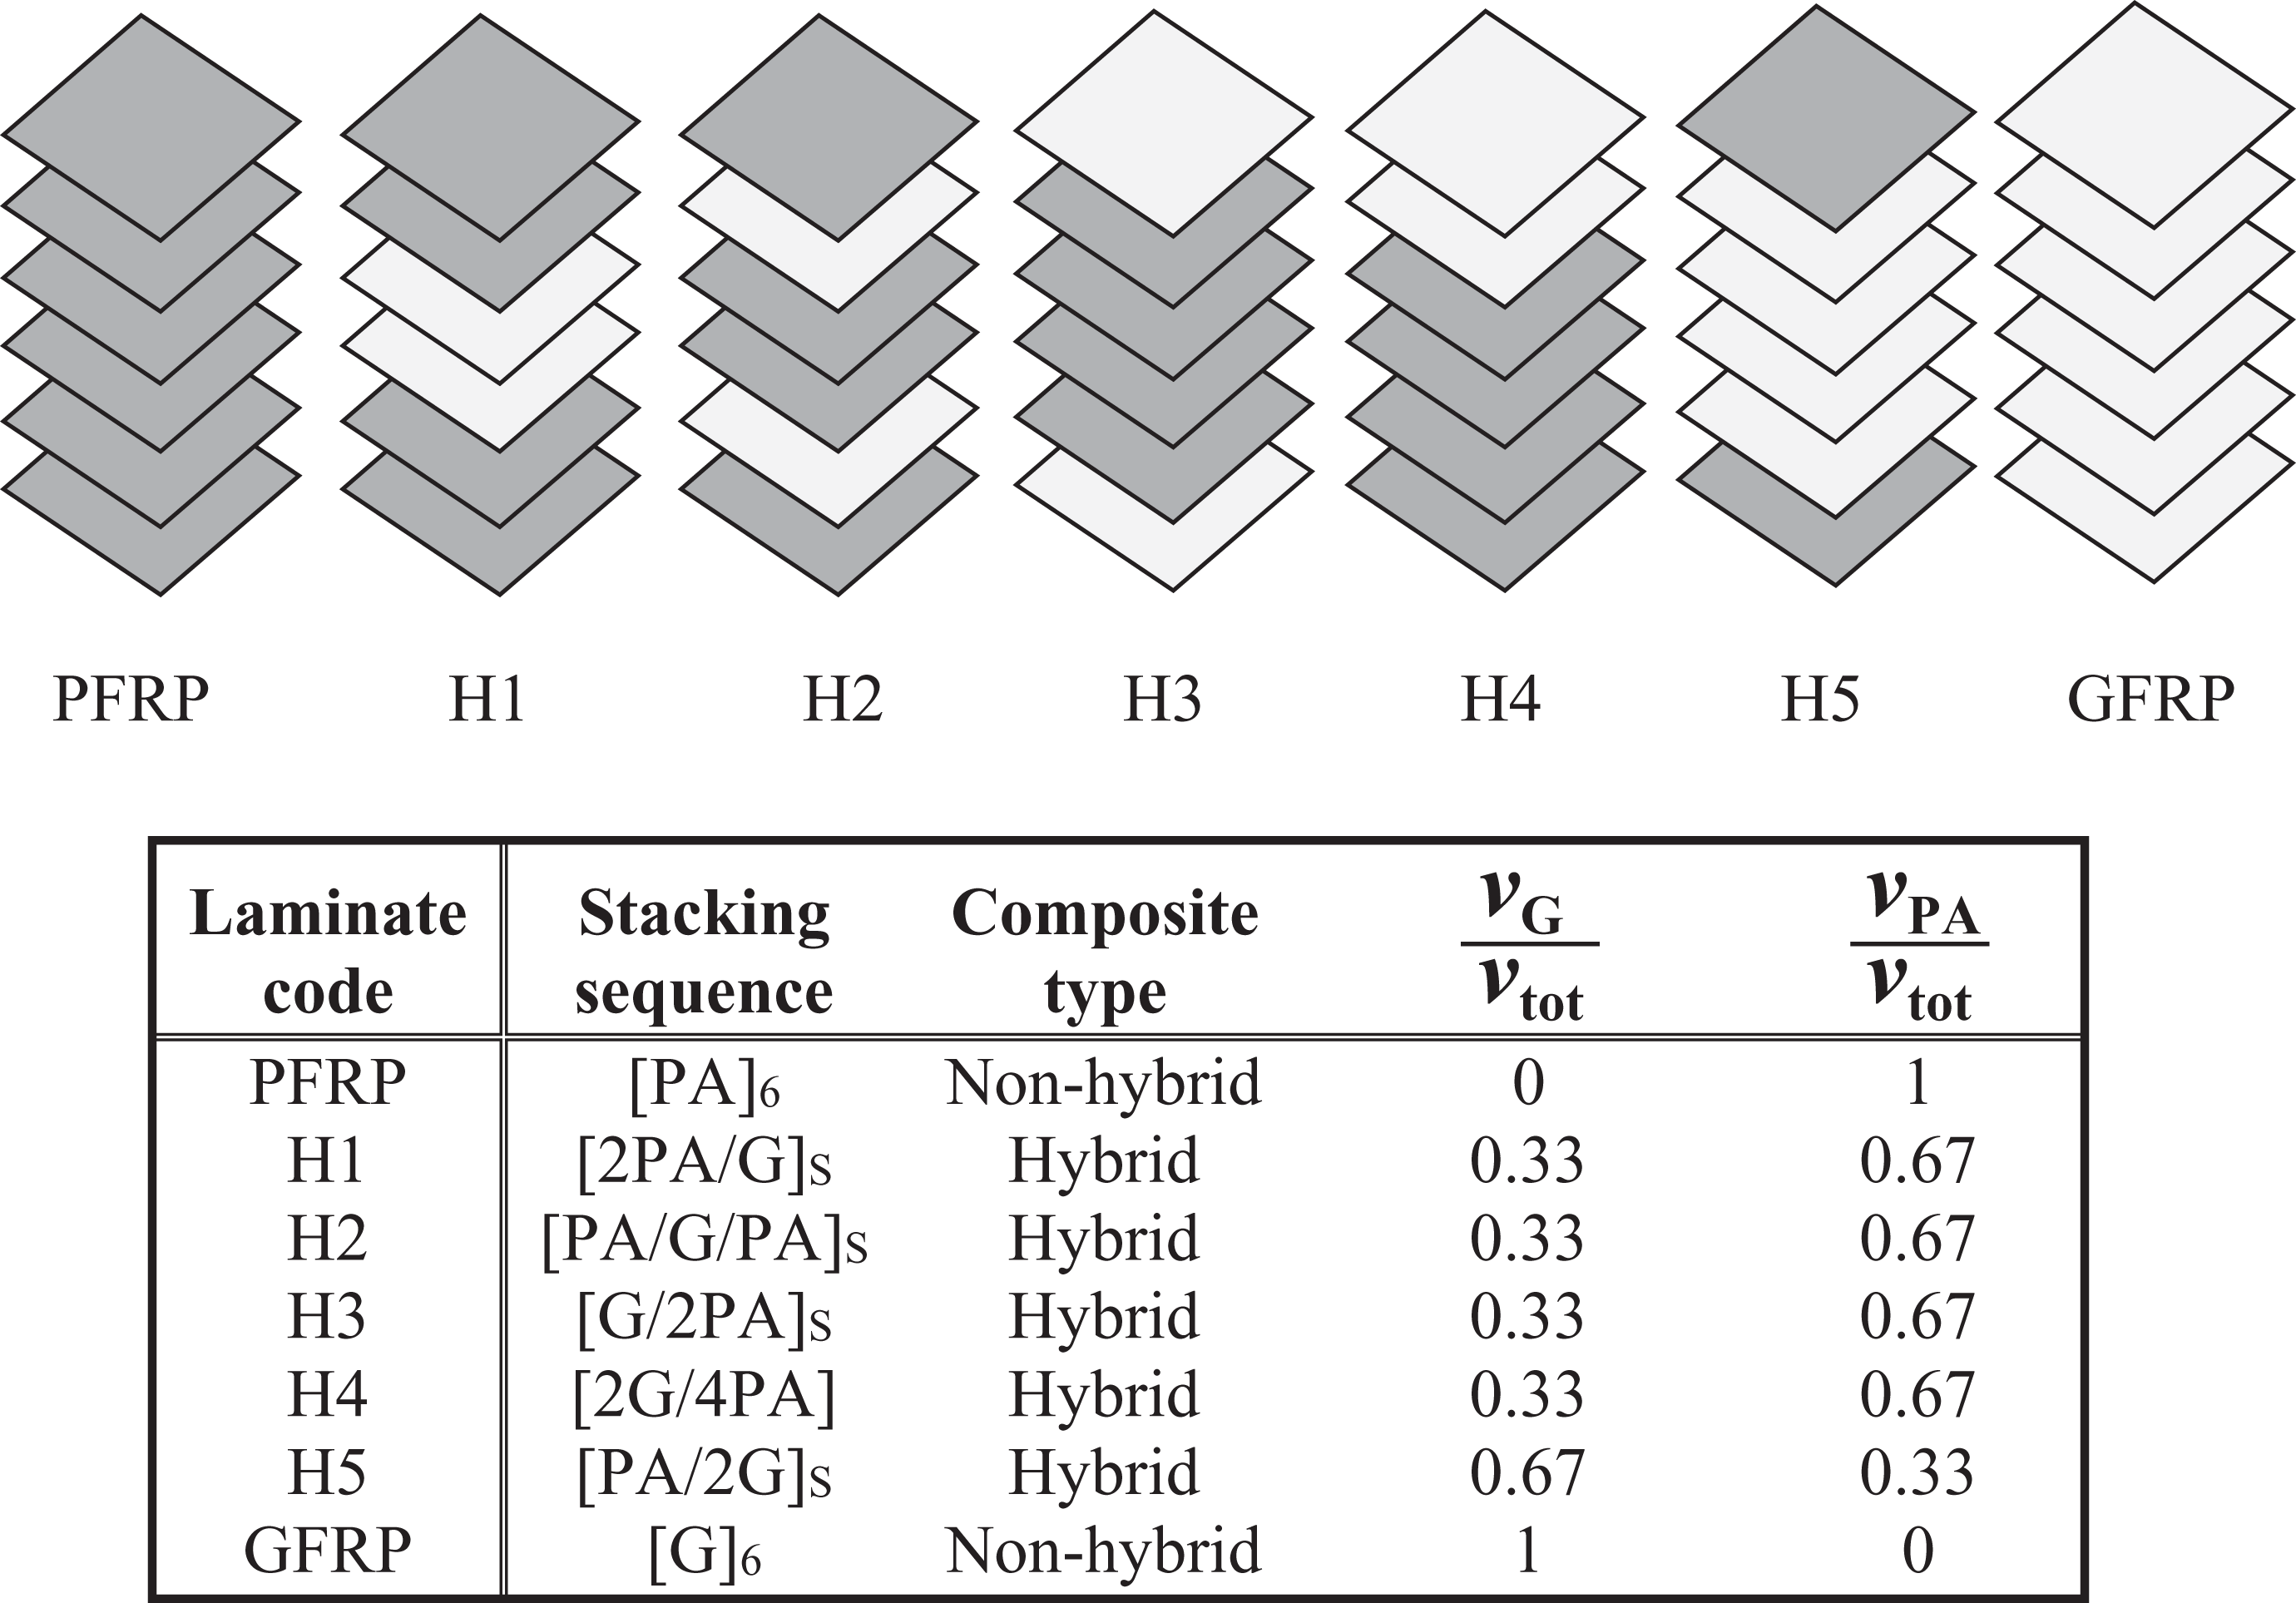
Seven PA-G/epoxy composite laminates with different stacking sequences and different fiber ratios, Figure 1, were fabricated using the hand layup technique owing to its simplicity and minimal infrastructural requirement (refer to the works of Attia et al.
28,29
) All fabricated composite laminates have almost constant total fiber volume fraction of
First, PA-fiber bundles were fixed on the frames of the wooden templates using small pins while chopped G-mat was cut to 300 × 300 mm2 as shown in Figure 2(a) and (b), respectively. The layup mold was treated by a release agent and was left to dry (Figure 2(c)). A layer of epoxy resin was spread on the mold followed by G-fibers or PA-fibers according to the required stacking sequence. Then, the fibers were rolled to distribute the matrix and displace the air outwards (Figure 2(d)). When the fibers were fully impregnated with epoxy, another amount of epoxy was added and distributed.
The above procedure was repeated with alternate layers of matrix and fibers until the whole laminate was primarily constructed. When the last fiber layer was impregnated, it was covered by a cellophane paper. Then, a plate with 25 kg mass was placed on the top of the laminate to obtain a uniform pressure, and consequently, a constant thickness for the fabricated composite (Figure 2(e)).
The constructed laminate was left at room temperature for 7 days to be completely cured. Then, its surrounding portion was removed. The rest portion of the laminate was used to prepare the test specimens according to the concerning standards. Figure 2(f) shows the final product.
The fabricated PA-G-reinforced epoxy composite laminates.
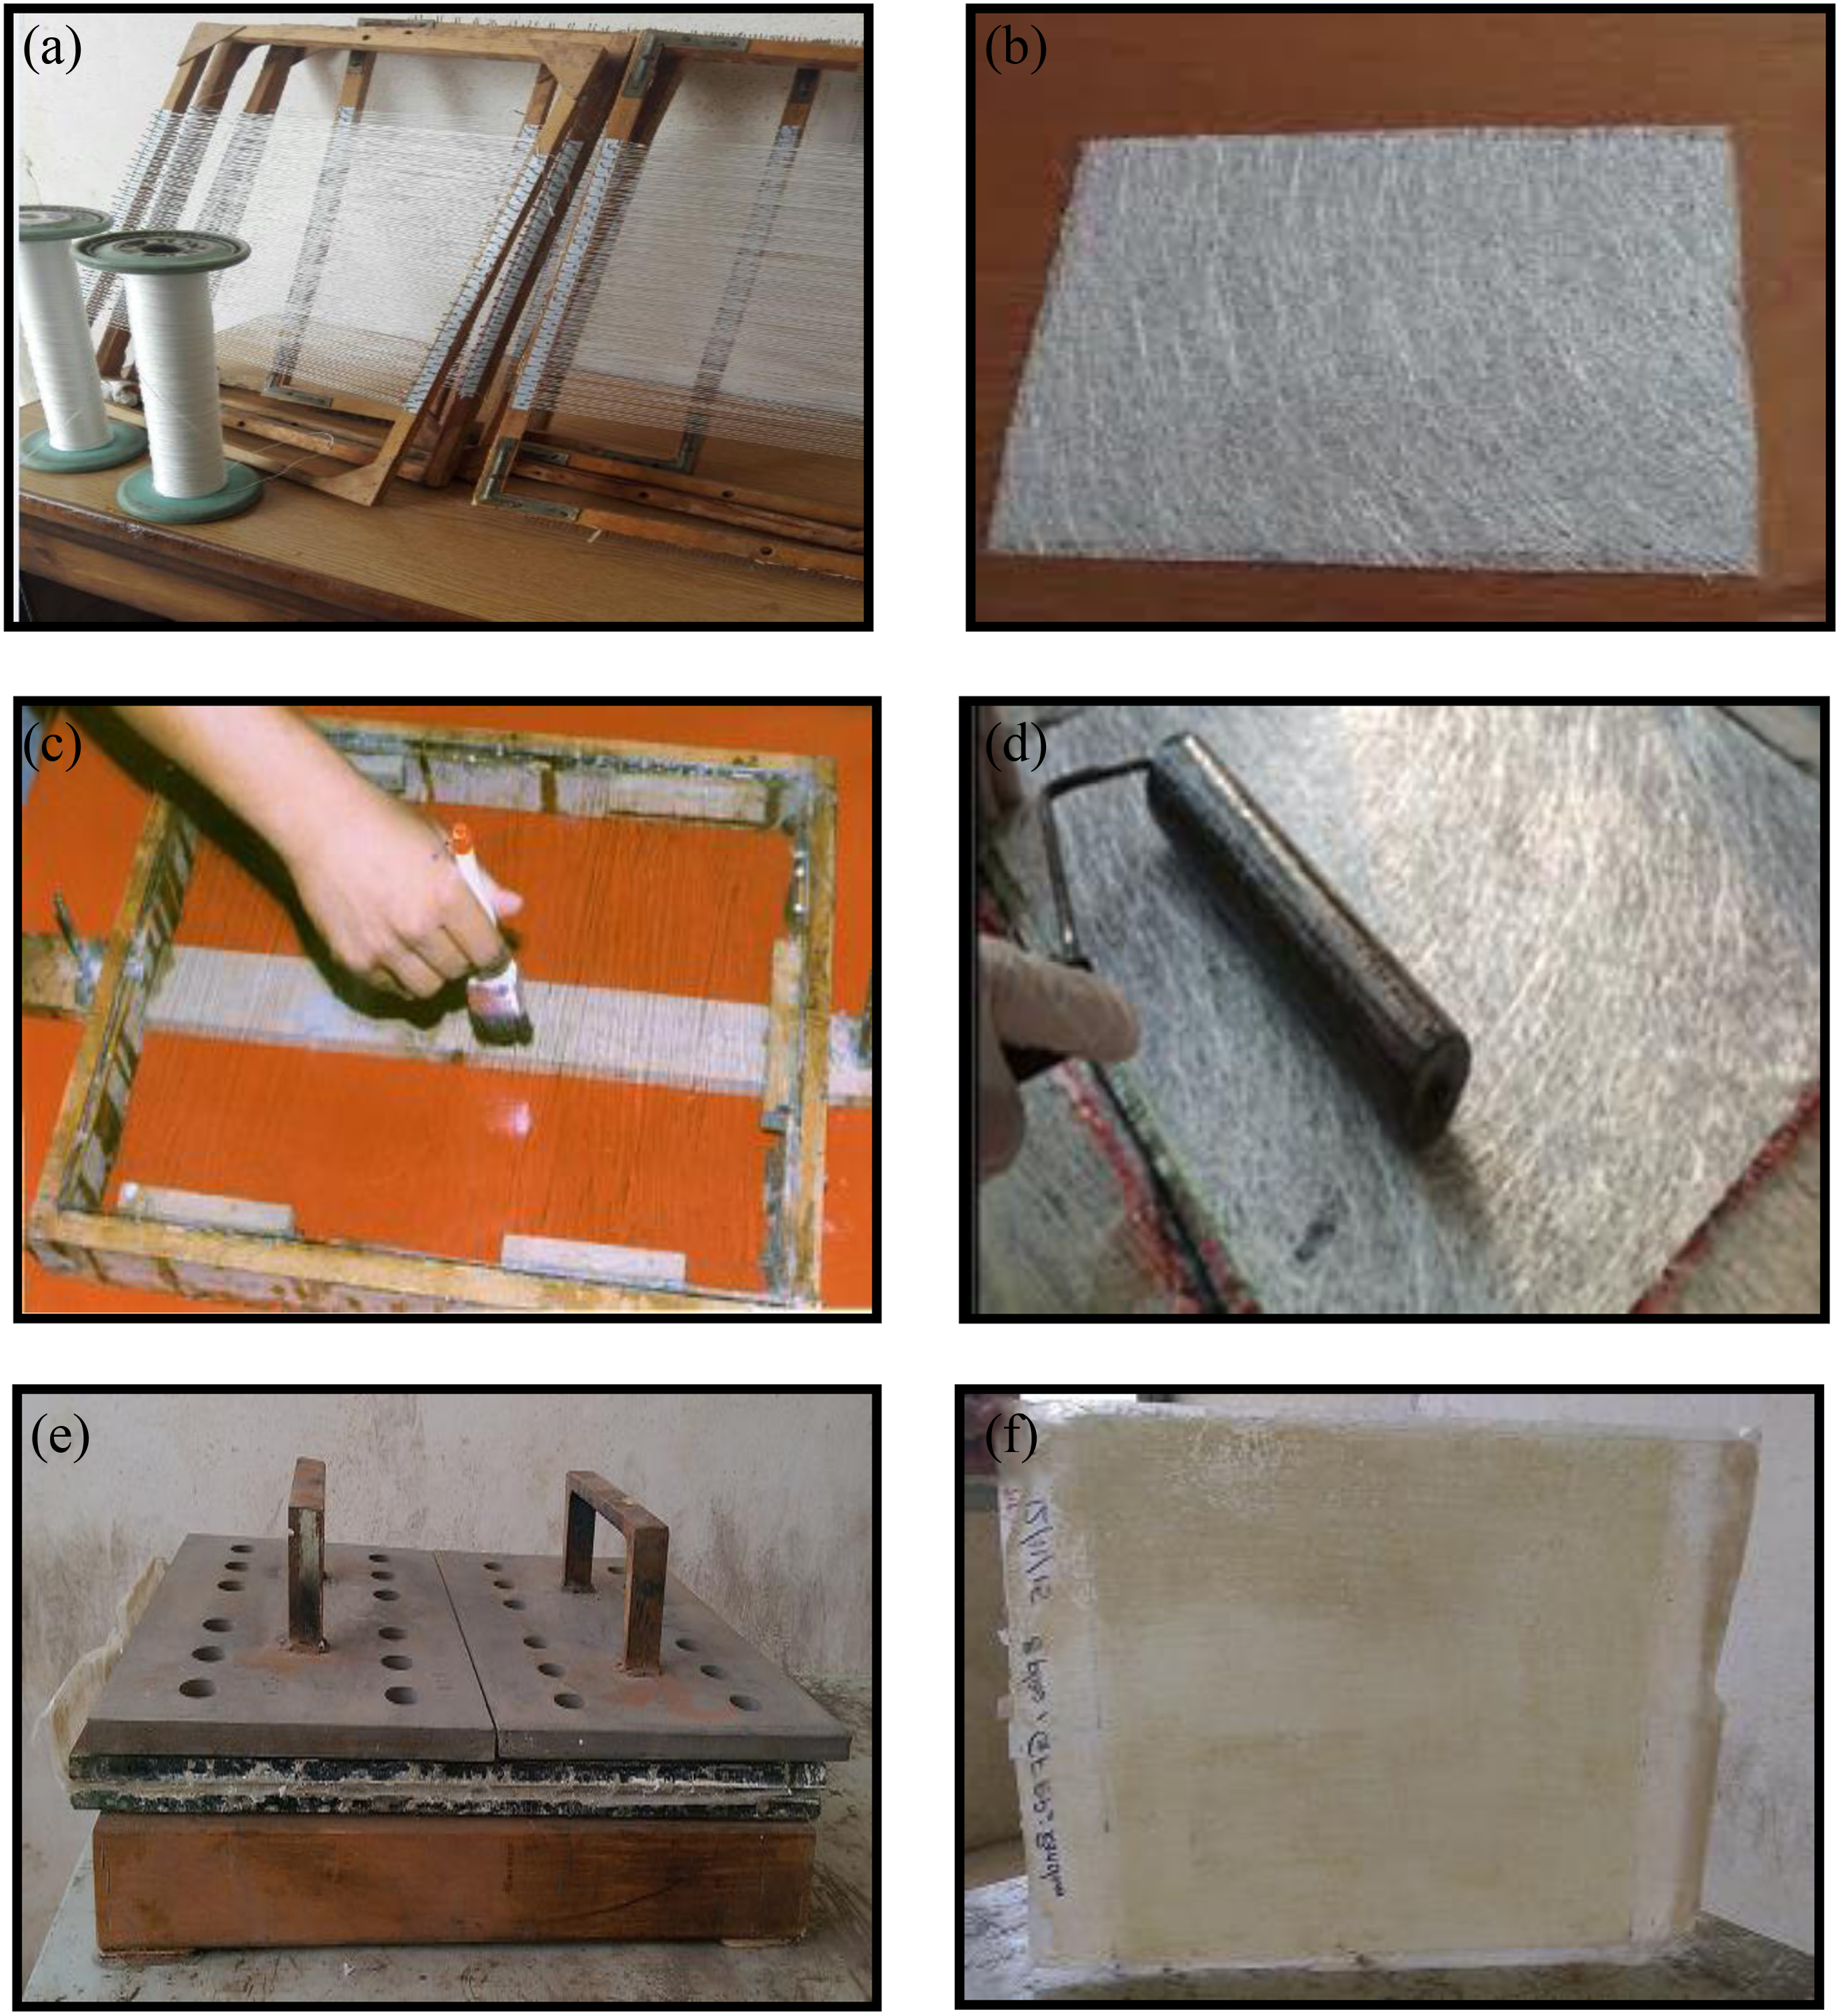
Hand layup fabrication process steps. (a) PA-fiber bundles wound on the template, (b) chopped glass-mat, (c) treating the mold with a release agent, (d) rolling the fibers, (e) placing 25 kg on the constructed laminate and (f) the final produced laminate.
Measurement and characterization
Fiber volume fraction
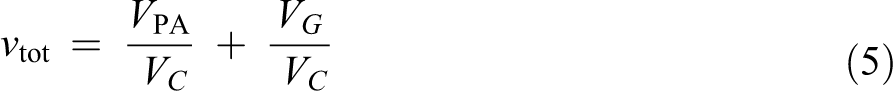
The total fiber volume fraction
A piece from the fabricated composite laminate was considered and its volume was calculated (VC). For PA-layers, the fiber length (l) in the composite piece was determined. Then, its weight (MPA) was calculated as follows

PA-fiber volume was calculated as
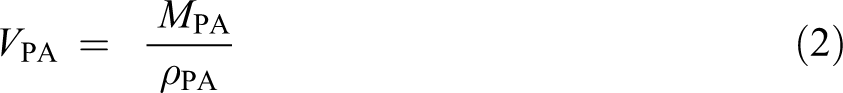
where ρl and ρPA are, respectively, the linear and volumetric density of PA-fiber.
For G-layers, the fabric area (A) in the composite piece was determined. Then, its weight (MG) was calculated as follows

G-fiber volume was calculated as
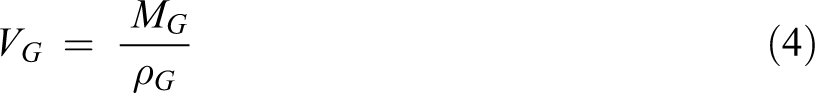
where ρA and ρG are, respectively, the areal and volumetric density of (G) fiber.
Finally, the estimated fiber volume fraction was obtained using the following
Density
The densities (ρexp) of the fabricated composites were measured experimentally at room temperature according to ASTM D792. 31 A digital vernier calipers with 0.01 mm precision and a digital balance with 0.0001 g precision were used to measure the specimens’ dimensions and masses, respectively, and then, the densities were calculated as follows

Void content
The void contents of the fabricated composites were calculated using the following relation 32

where ρth is the theoretical density calculated using RoM.
Mechanical tests
Different types of mechanical tests were conducted; namely, tensile, three-point bending, and Iosipescu shear tests. All tests were performed at room temperature on a universal testing machine (testometric 300 kN). The average loading rate for the current analyses was in the order of 2 mm min−1. The load–deflection curves were obtained from the computer unit of the testing machine. Each test was performed for three specimens for each composite and the average value was taken. Microscopic analyses were performed aiming to identify the failure occurred in the tested specimens.
Tensile test
The test specimens were cut into strips according to ASTM D3039 33 with 250 mm length and 25 mm width. One longitudinal strain gauge was bonded on center region of each specimen to measure its actual Young’s modulus, Eact at 0.3% strain. The strain was measured using Digital Strain Meter Tc-2lk model 232 (Tokyo Sokki Kenkyujo Co. Ltd., Japan). The ultimate tensile strength and the apparent tensile modulus were simply estimated using the stress–strain curve obtained from the universal testing machine as follows
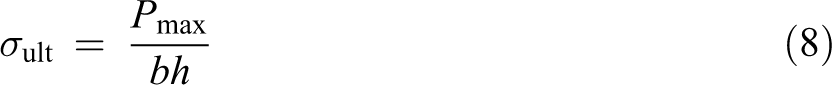
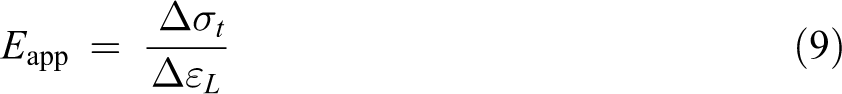
where Pmax is the maximum tensile load, b and h refer, respectively, to the width and thickness of the test specimen, and
Flexural test
Flexural tests were carried out according to JIS K7055 34 using a three-point bending test jig. The dimensions of the test specimens are 70 mm total length and 15 mm width. The flexural strength, modulus, and strain were calculated using the following equations
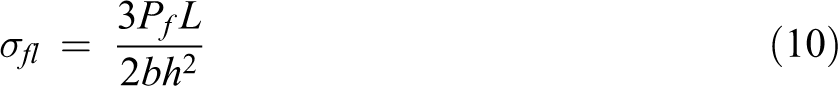
where L represents the support span length, which is 40 mm and Pf and
Shear test
In-plane shear tests were carried out according to ASTM D5379 35 using the modified Wyoming Iosipescu test fixture shown in Figure 3(a). The left half of the fixture is fixed rigidly to the base plate along with spacer block having a guide way to prevent the twisting of the movable half of the fixture. The entire front face of the specimen remains visible during the test and the progress of failure can be visually monitored. The principle of the test is to apply a set of prescribed displacements on the V-notch specimen, so that the central region of the sample is under a state of pure shear. These displacements are achieved through relative movement of the movable grip with respect to the fixed grip.
Specimens were cut into strips with 76 mm length and 19 mm width. A 90° double V-notches were machined at the specimen mid-length through its thickness for a depth of 3.8 mm. The radius of the notch root is 0.157 mm. To measure the shear strain (γxy) and shear modulus (Gxy), two strain gauges were bonded at +45°and −45° at the center of the test specimen as shown in Figure 3(b).
The shear strength (τxy), strain (γxy), and modulus (Gxy) were determined as follows

where Pmax is the maximum applied load, w is the distance between the roots of the V-notches = 11.4 mm, h is the specimen thickness, and
Specific properties
Specific properties can be calculated as the experimental value of the property divided by the composite density. The use of specific properties concept is essential when comparing the capabilities of composites fabricated from different materials. This approach is reasonable in all engineering applications, aiming for weight reduction. 37
Hybrid effect
The hybrid effect is defined as the fractional deviation of the hybrid experimental property compared to that estimated from the RoM and can be thus given by
Results and discussions
Density and void content
The experimental and theoretical densities of the fabricated composites are shown in Table 2. It is clearly viewed from the table that the density of polyamide fiber reinforced polymer (PFRP) composite is lower than that of glass fiber reinforced polymer (GFRP) one. There is a slight difference in the densities of H1–H4. This difference is due to the void generated during the hand layup technique. H1–H4 hybrids give lower density values as compared to H5 hybrid. That is because H5 contains higher amount of G-fiber whose density is twice that of PA-fiber. Hybrids have intermediate densities between PFRP and GFRP composites.
Densities and void content of the fabricated PA-G/epoxy composites.
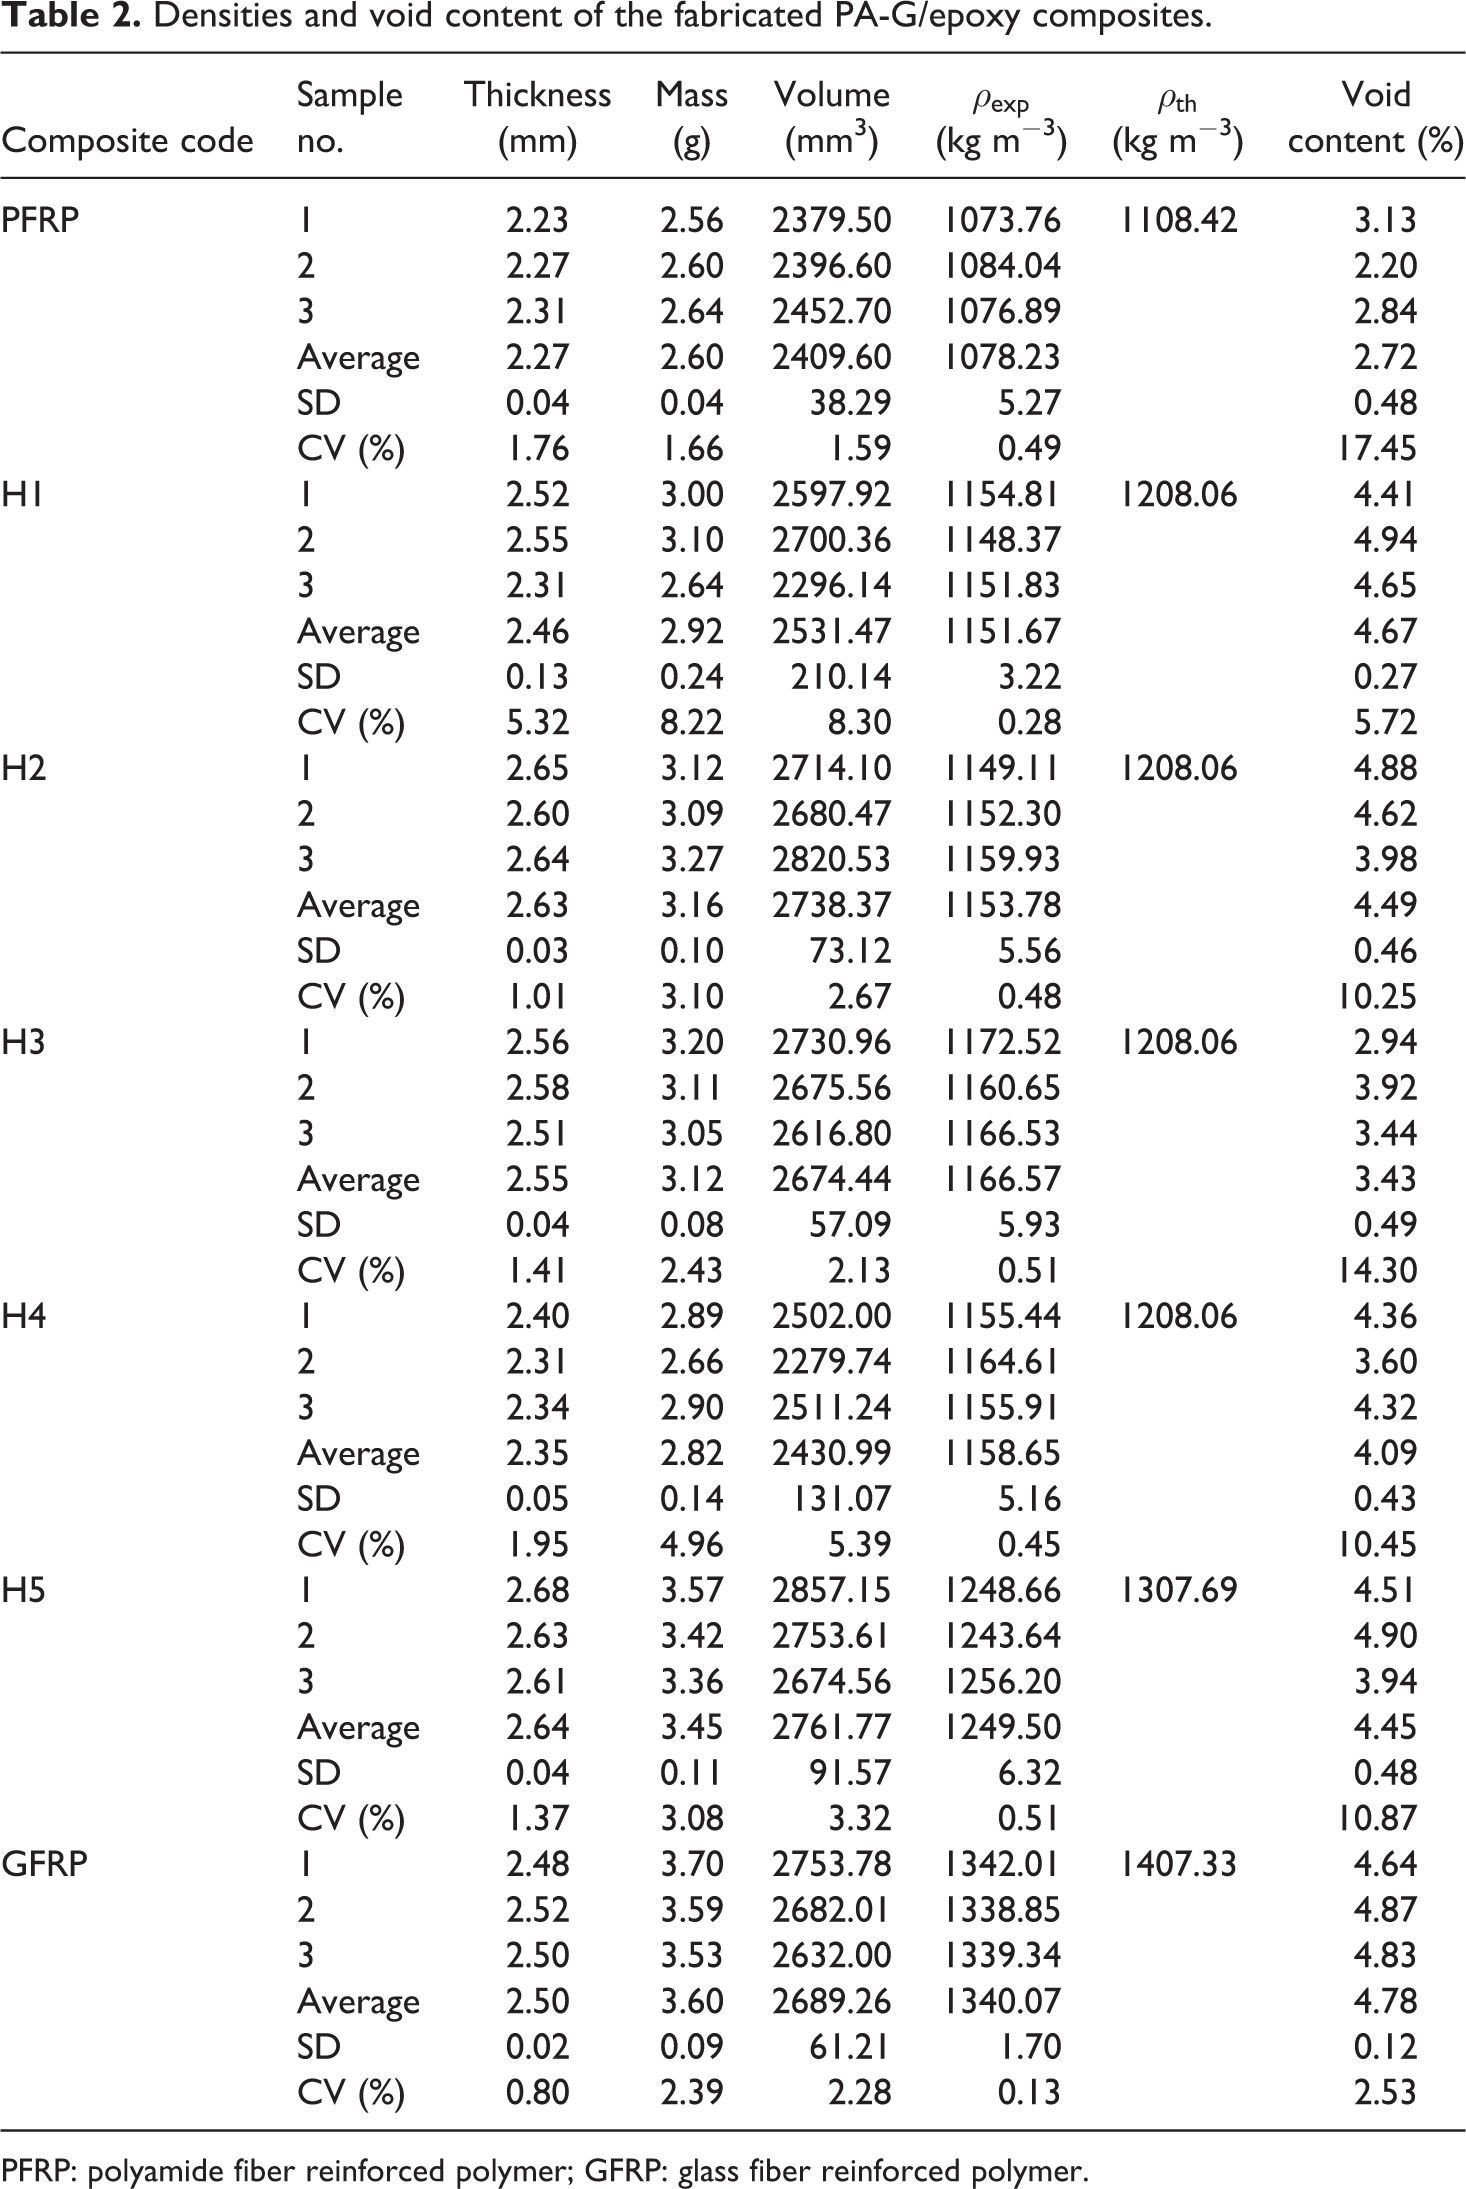
PFRP: polyamide fiber reinforced polymer; GFRP: glass fiber reinforced polymer.
The experimental densities (ρexp) were compared to the theoretical ones (ρth) and the void contents for all composites were determined using equation (7) and provided in Table 2. Void content is one of the most important problems that may be encountered in composite materials. The most common cause of voids is the incapability of the matrix to displace all the air which is entrained within the woven or chopped fibers as it passes through the matrix impregnation. 38,39 The existence of voids in the composites significantly reduces the mechanical and physical properties of the composites. 40 It is clear that the hand layup technique leads to a satisfactory fiber impregnation level and results in composites with low void contents (void content < 5%).
Tensile properties
A comparative plot of tensile load−displacement curves for tested composite laminates is shown in Figure 4 as obtained from the universal testing machine. It reveals that, for PFRP composite, the load−displacement curve exhibits almost an essentially linear behavior followed by nonlinear behavior with a slow load rise up to a certain maximum point. Then, a catastrophic failure was observed. PFRP composite shows the highest tensile strength and strain to failure, whereas it gives the worst apparent tensile modulus, Eapp. The high strength of PFRP composite is attributed to the fact that unidirectional PA-fiber is stronger than chopped G-mat. The high strain to failure of PFRP composite is mainly attributed to the higher elongation at break value of PA-fiber compared to that of G-fiber, as shown in Table 1. Hence, a good ductility for PFRP composite is obtained. On contrary, the load−displacement curve of GFRP composite is linear with a rapid load rise up to the maximum load followed by a sudden load drop with a catastrophic failure. Such load−displacement behavior means that GFRP composite possesses the highest apparent tensile modulus compared to all tested composites. GFRP composite shows low tensile strain to failure which indicates a brittle property compared to PFRP one. The tensile strength, apparent modulus, and strain to failure of PFRP composite are, respectively, about 2.2, 0.2, and 7.1 times those of GFRP composite. Consequently, the hybridization of G-fiber composite with PA-one improves its tensile strength and ductility but decreases tensile modulus as shown in Table 3.

Tensile load–displacement curves for PA-G-reinforced epoxy composites.
Tensile and shear properties of the fabricated PA-G/epoxy composites.
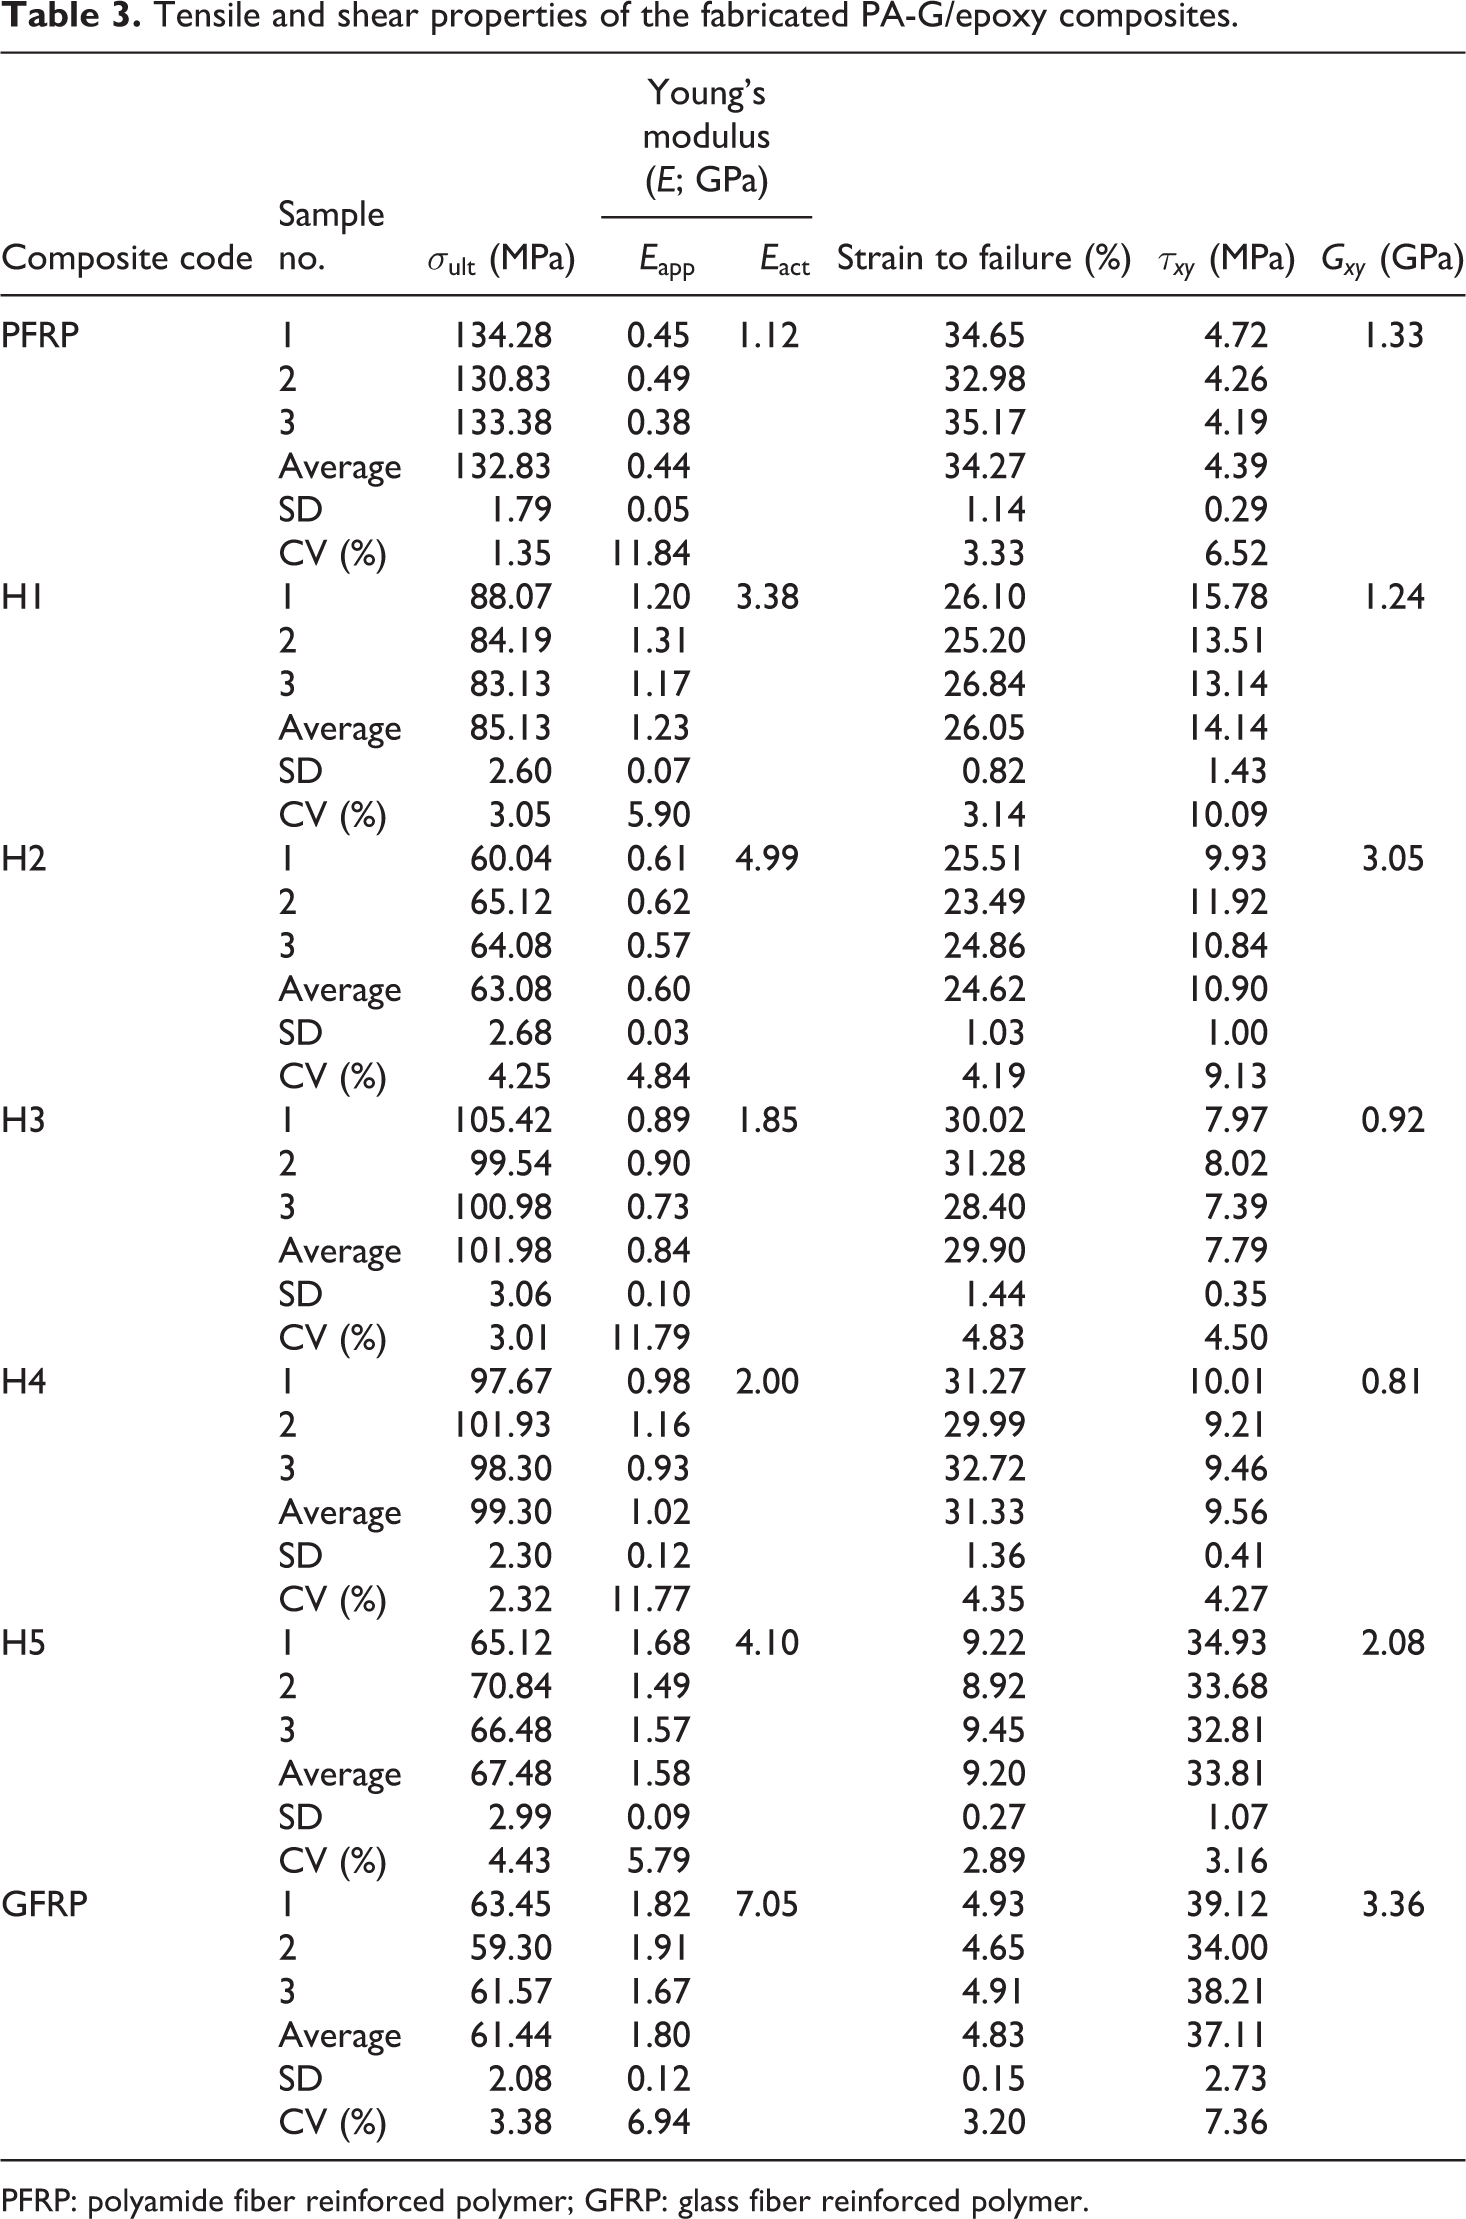
PFRP: polyamide fiber reinforced polymer; GFRP: glass fiber reinforced polymer.
It is also seen from Figure 4 that the load−displacement curves of H1–H4 hybrids are divided into two stages. The first stage is linear similar to GFRP composite followed by nonlinear behavior like PFRP composite ending with catastrophic failure. The hybrid composite H5 exhibits a linear behavior which is similar to that of the GFRP composite. That is due to the high G-fiber content. The hybrid specimen tensile behavior depends mainly on the relative amounts of the used reinforcements.
Figure 5 illustrates the stress–strain diagrams for tested composites based on the strain gauge readings. Utilizing this data, the actual Young’s modulus, Eact, for all tested composites was calculated at 0.3% strain. Both Eact and Eapp were compared and provided in Table 3. Results indicate that Eact values are much higher than those of Eapp, that is, Eact values are from 2.0 to 8.3 times those of Eapp. This is due to the displacement resulting from the clearance in the testing machine joints, which was added to the specimen displacement resulting in low Eapp. 6
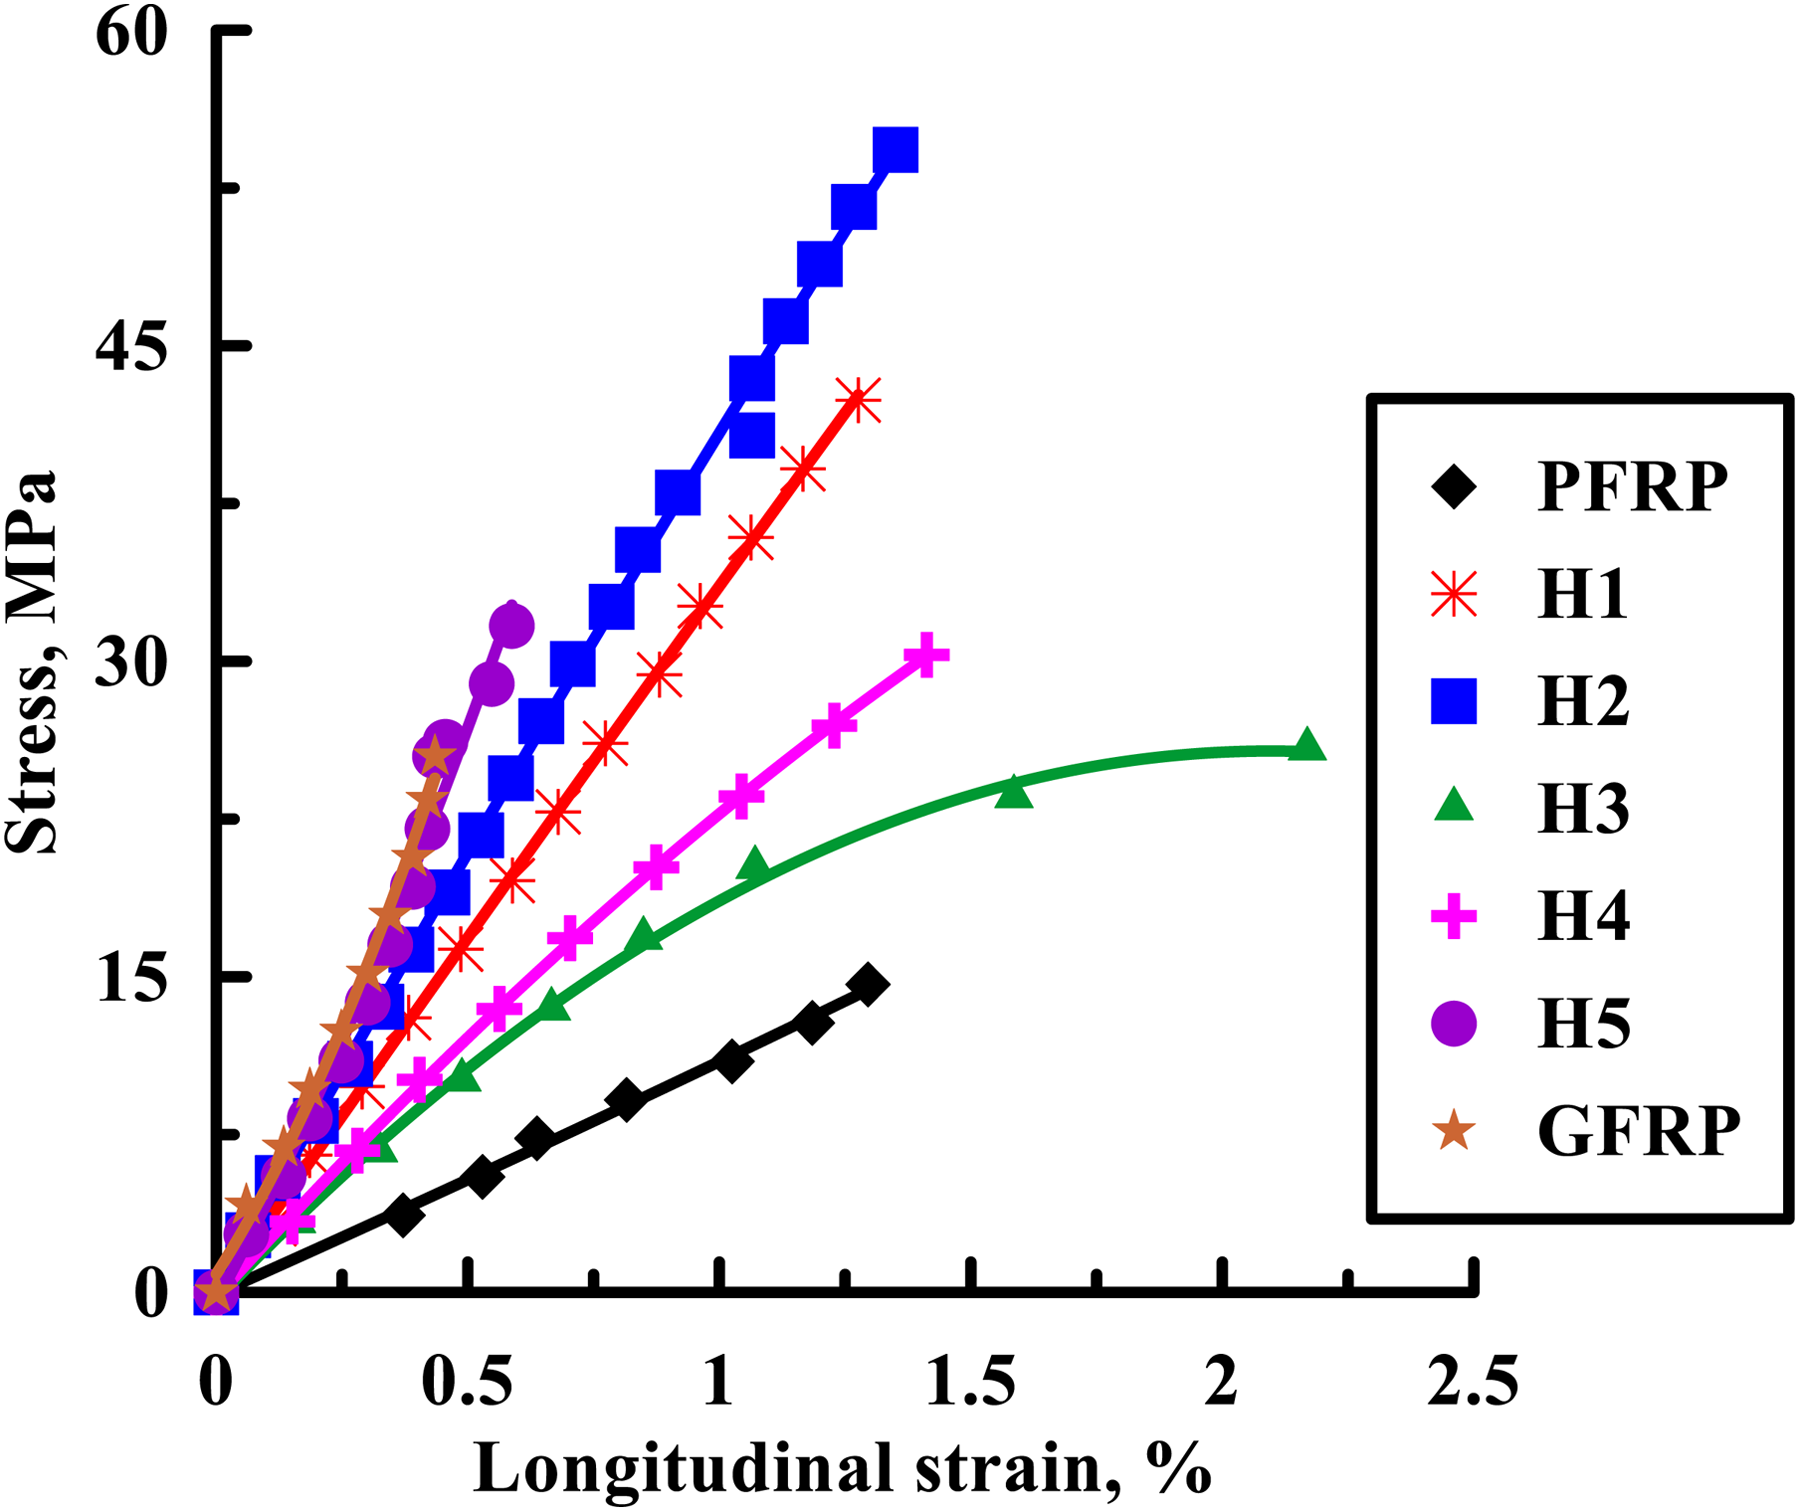
Stress–strain diagram for PA-G-reinforced epoxy composites obtained from strain gauge readings.
Hybrid composites H1–H5 display intermediate tensile properties between those of parent composite materials, that is, GFRP and PFRP. It is important to emphasize that the plies stacking combinations obviously affects the tensile properties of PA-G/epoxy hybrid composites. The tensile strength of H3 composite, where PA-fiber is placed at the laminate interior, is about 1.2 times that of the hybrid composite with the opposite arrangement, H1. This is due to the better load transfer from the weak outer plies, containing G-fiber, to the strong inner plies, containing PA-fiber, and consequently, the crack arrest is improved. 41,42
The strain to failure and Young’s modulus of H3 composite are about 1.1 and 0.7 times, respectively, those of the hybrid composite with the opposite arrangement, H1. It is clear from Table 3 that as PA-fiber amount increases, the tensile strength and strain to failure increase while Young’s modulus decreases.
Regarding the tensile failure modes shown in Figure 6, for PFRP composite, the failure is longitudinal splitting with audible sound, fiber pull-out, and fiber–matrix debonding in the specimen’s gauge length while a complete fracture into two parts across the specimen width in the gauge length was observed for GFRP composite. For hybrid composites H1–H5 specimens, a mixed failure mode was noticed; that is, complete fracture in G-fiber layers accompanied with longitudinal splitting in PA-ones and matrix fretting. Figure 7 shows scanning electron microscopic (SEM) images of PA-G-reinforced composite specimens underwent tensile test indicating longitudinal splitting and surface fracture.
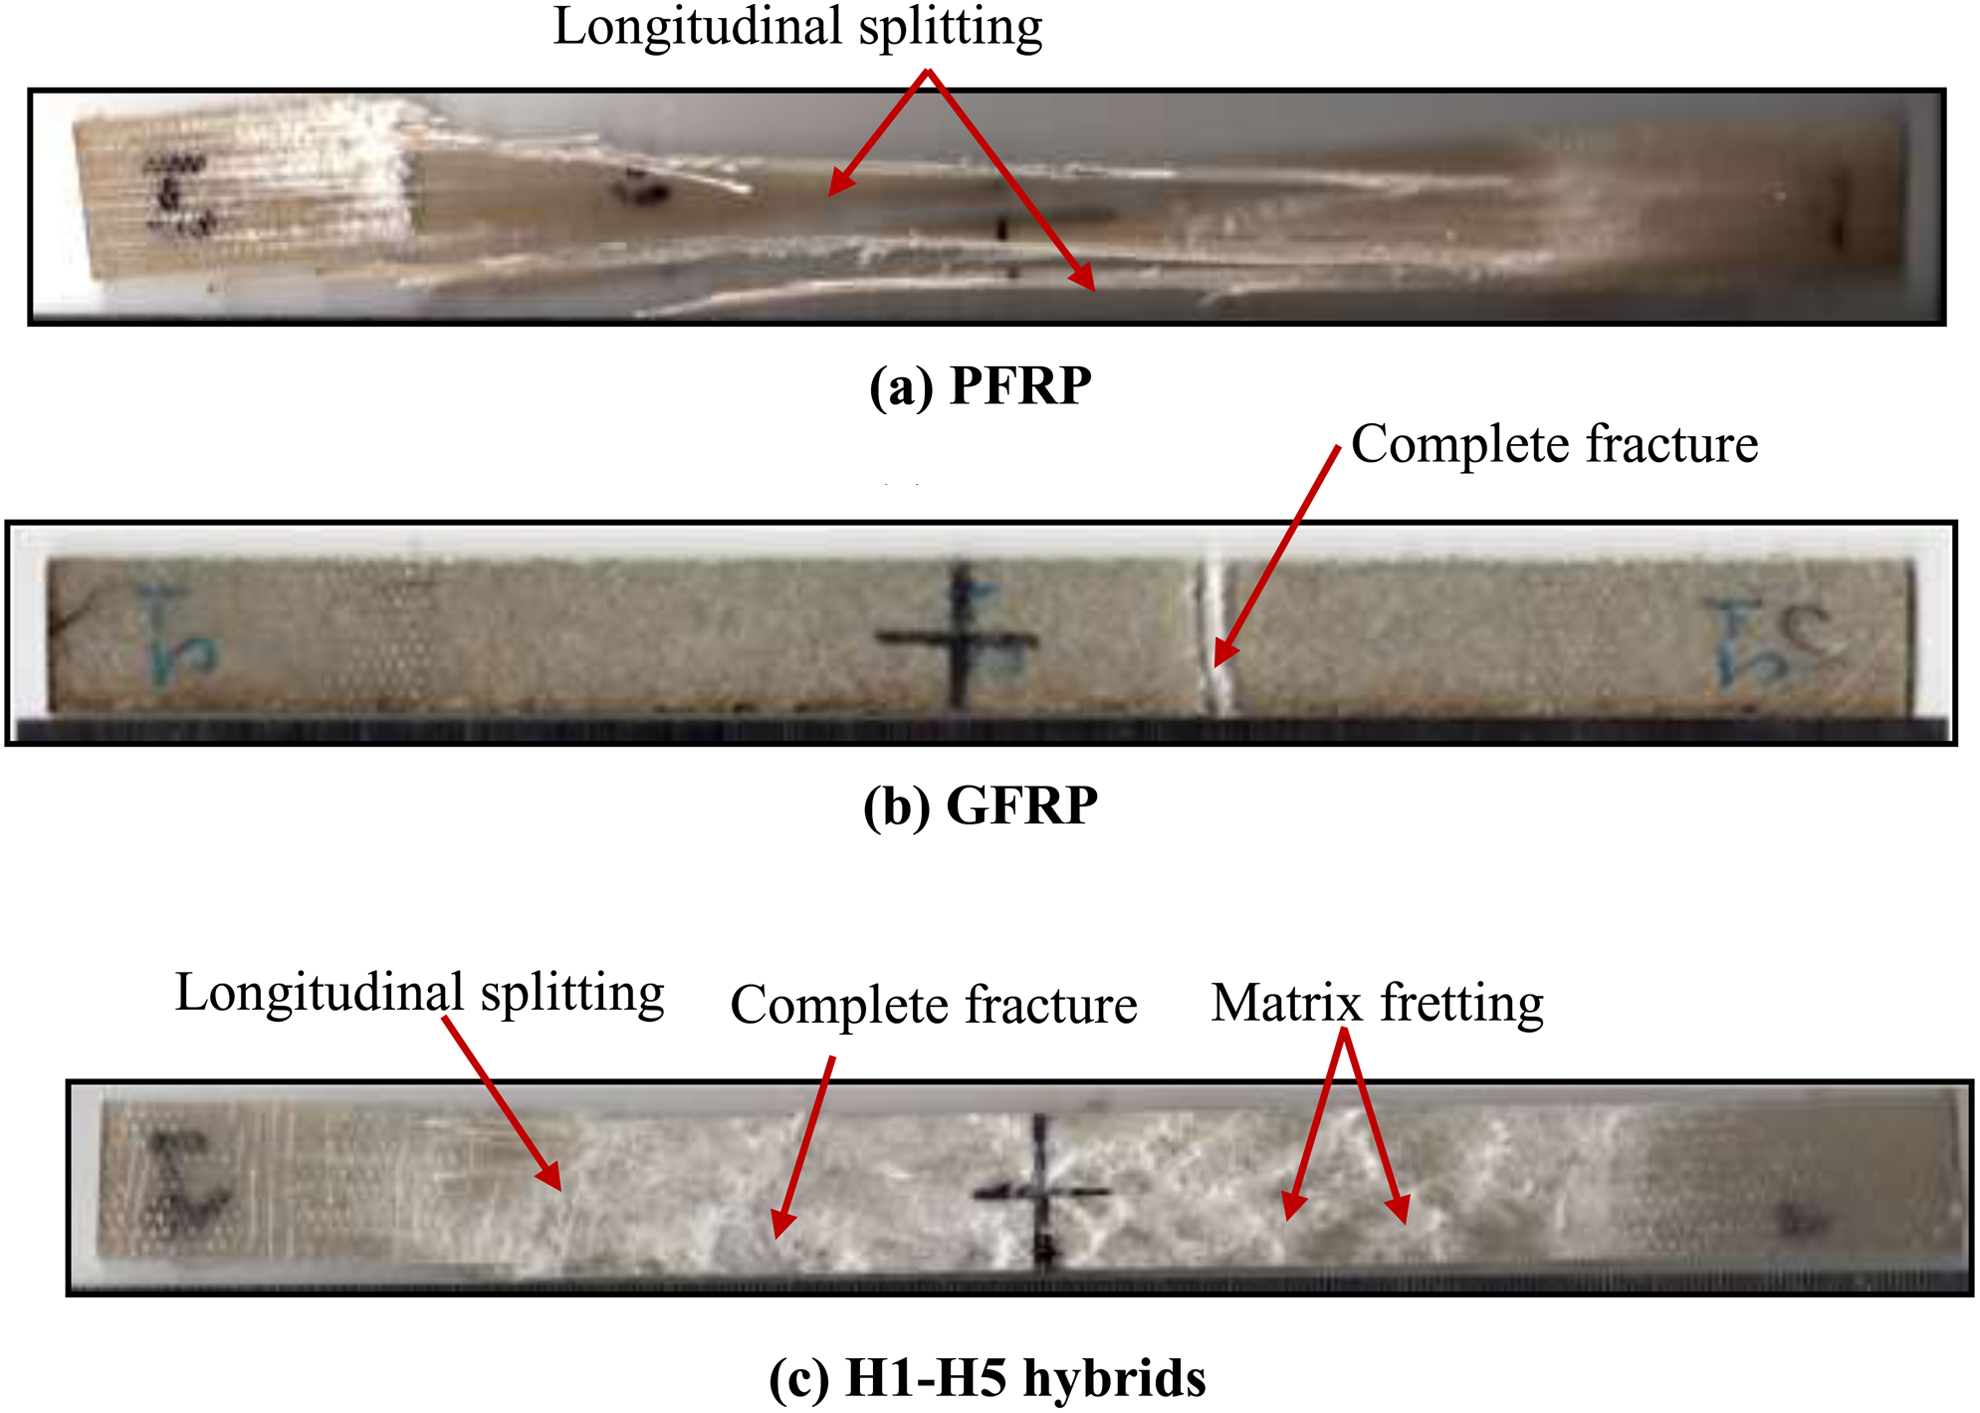
Common failure modes for PA-G-reinforced epoxy tensile test specimens.
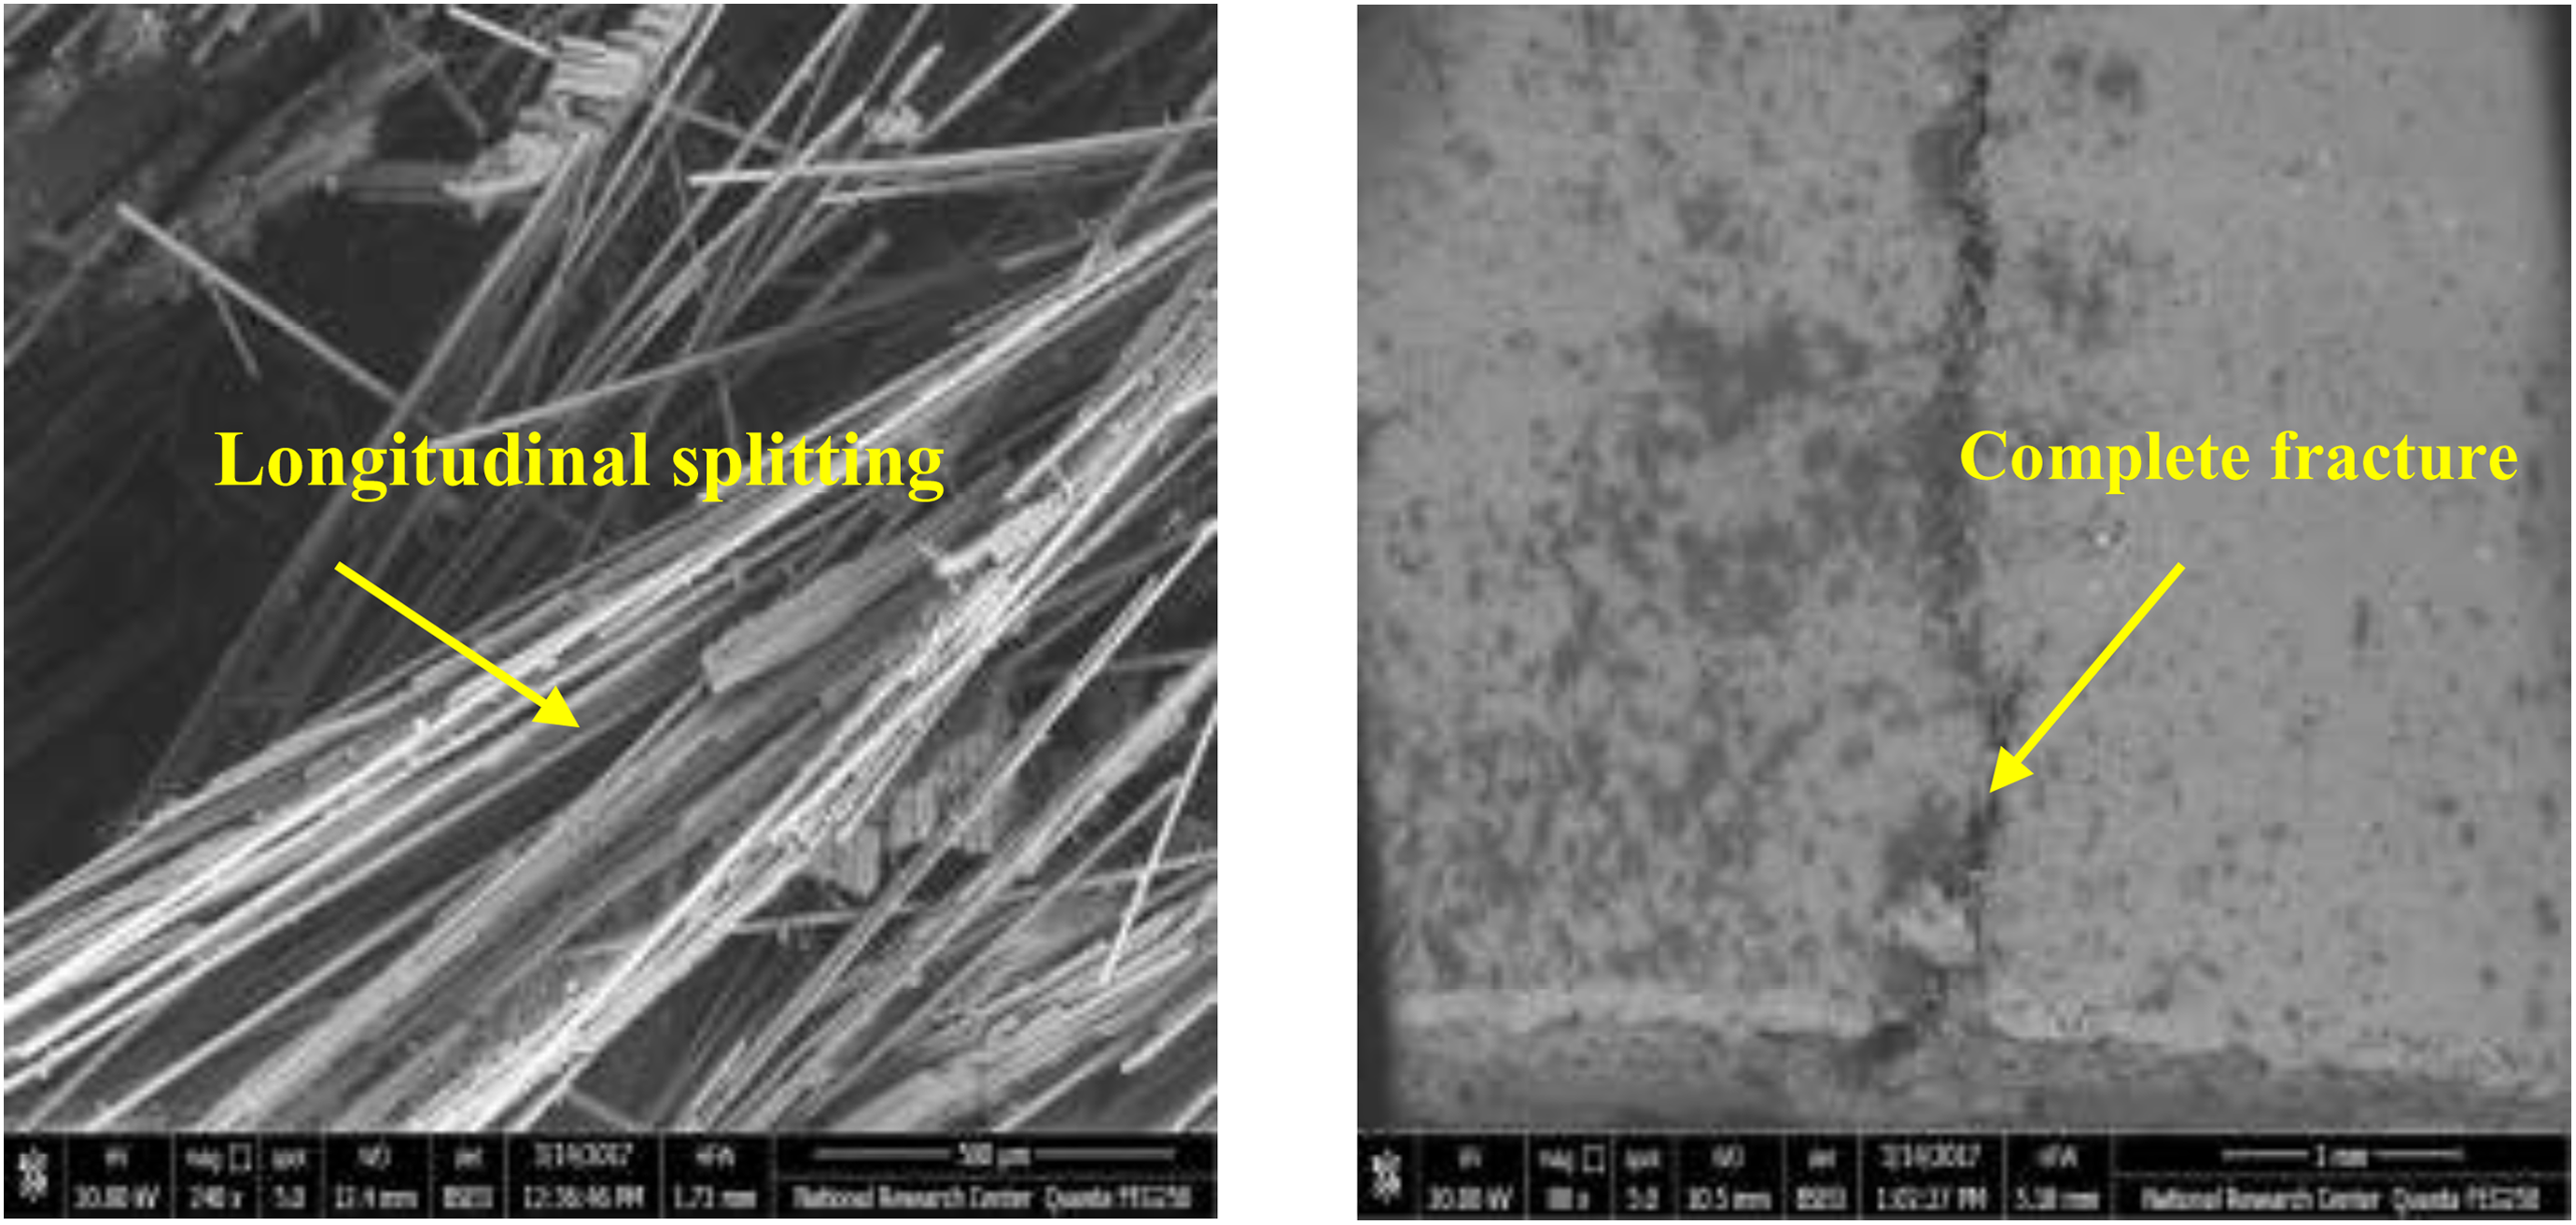
Scanning electron microscopic (SEM) images of PA-G-reinforced epoxy tensile failed specimens.
Flexural properties
The typical load–deflection curves for the tested composites are compared in Figure 8. It is clear that hybrid composite H4, which is asymmetric, has been tested under flexural loading by two ways. So it was coded as follows: H4 (G to PA) where the compressive side of flexural specimen is G-fiber and tension side is PA-fiber and H4 (PA to G) where the compressive side is PA-fiber and tension side is G-one.
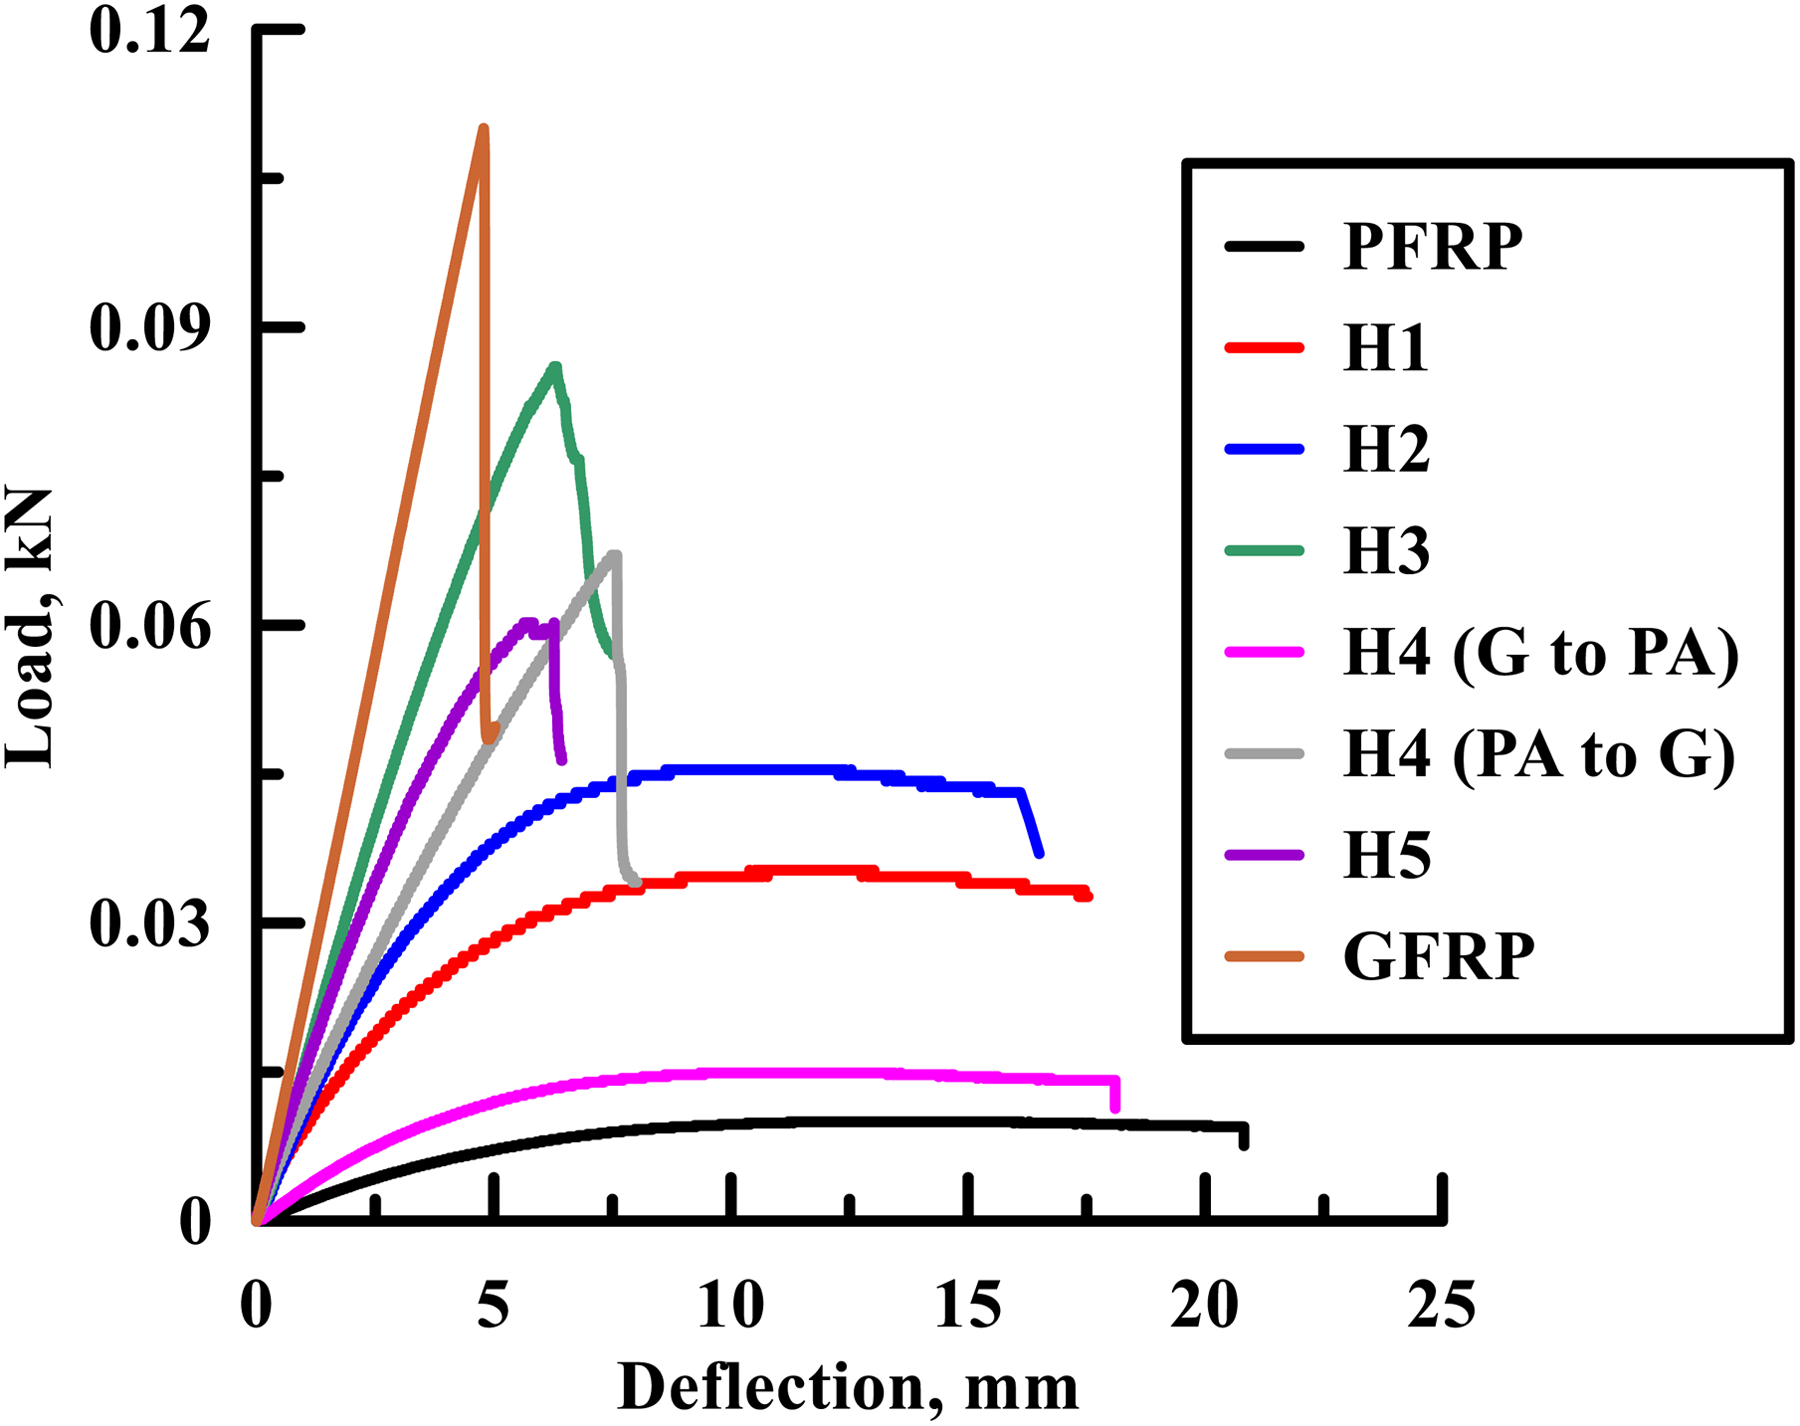
Flexural load–deflection curves for PA-G-reinforced epoxy composites.
It reveals from Figure 8 that for PERP composite, the load–deflection curve exhibits an essentially nonlinear behavior with a very slow load rise followed by a stage in which the load stabilizes with an increasing in the deflection. Then failure occurs. On contrary, the load–deflection curve of GFRP composite behaves linearly with a rapid load rise up to the maximum load followed by a sudden load decrease, which is associated with the delamination and the failure of matrix and fiber breakage. It was noticed that, among all the tested composites, PFRP composite shows the lowest flexural strength and modulus but the highest flexural strain which is opposite to the GFRP composite. The flexural strength, modulus, and strain of GFRP composite are about 8.2, 24.0, and 0.2 times, respectively, those of PFRP composite.
The presence of G-fiber in a combination with PA-fiber in hybrid composites improves the flexural strength and decreases the flexural strain as depicted in Table 4. Arranging G-fiber plies at the laminate faces and PA-fiber plies at the middle as shown in H3 composite leads to a considerable improvement in the flexural strength and flexural modulus. This may be justified from the fact that the flexural strength and flexural modulus are controlled by the outer layers (refer to the works of Ahmed and Vijayarangan 43 and Subagia et al. 44 ). Generally, hybrid composites have higher flexural properties than PFRP one regardless the plies stacking sequence and fibers ratio.
Flexural properties of the fabricated PA-G/epoxy composites.
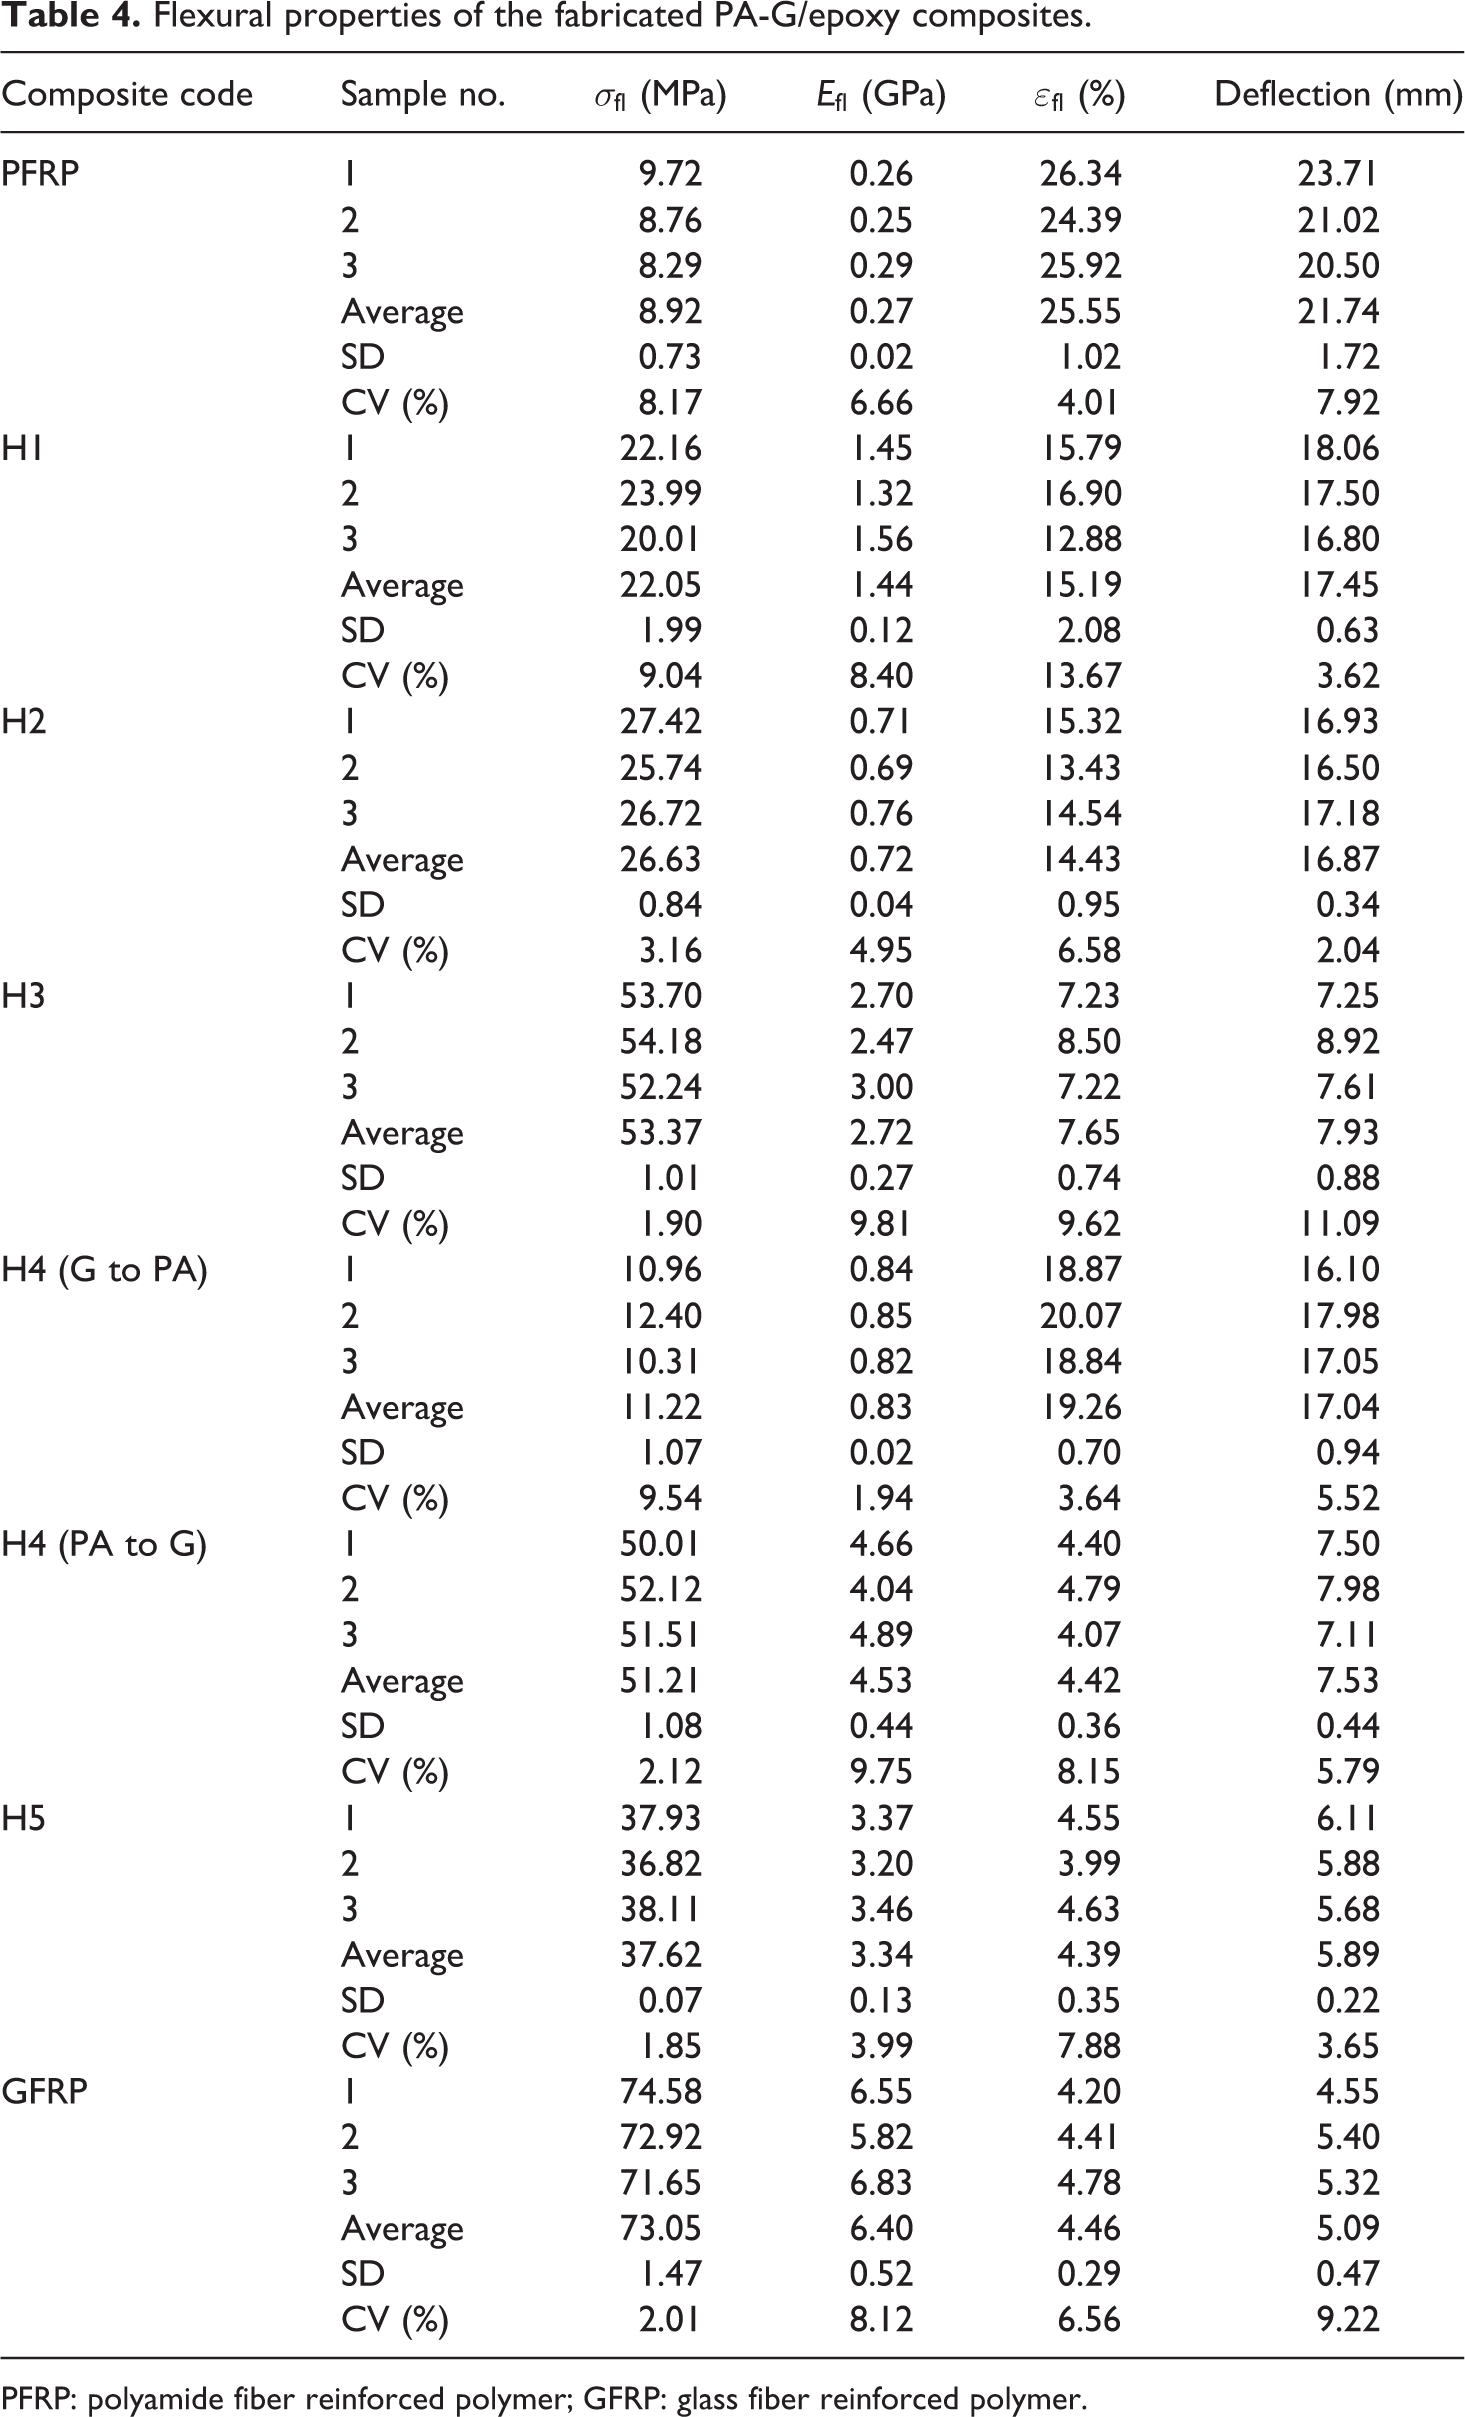
PFRP: polyamide fiber reinforced polymer; GFRP: glass fiber reinforced polymer.
Since the applied load is initially distributed on the specimen compressive side and is transferred to the tension side through the specimen thickness. Thus, the flexural strength and modulus of hybrid composites depend mainly on the fact that which fiber layers are stacked on the compressive and tensile sides of the composite laminate. 45 Placing G-fiber in both compressive and tension faces, as in H3 composite, results in flexural strength and modulus of 4.8 and 3.3 times, those of H4 (G to PA) composite where G-fiber is on the compressive face and PA-fiber is on the tension face. In the same way, when PA-fiber was located at the compressive face of the hybrid composite, the flexural behavior was also significantly influenced by which fiber type is used at the tension side as seen in Table 4. Stacking PA-reinforced layers at the compressive face and G-reinforced ones at the tension face as in H4 (PA to G) composite improves the flexural strength and modulus by about 132.2 and 214.6% comparing to those having PA-fiber in both compressive and tension faces as in H1 composite. Interestingly, using PA-fiber layers on both compressive and tensile faces of the hybrid laminate results in a good ductility, which reaches that of PFRP non-hybrid composite.
It is also seen from Figure 8 that the load–deflection curves of H3, H4 (PA to G), and H5 hybrids behave like GFRP composite. That means the failure of these hybrids is in G-layers. On contrary, H1, H2, and H4 (G to PA) hybrids exhibit a nonlinear behavior similar to that of the PFRP composite. That means the failure of these hybrids is in PA-layers.
The failure of composites under flexural loading includes tensile, compressive, shear failure, and/or delamination, wherein failure by compression is the most common because of strong tensile properties of the fiber. 46,47 The failure modes of the tested specimens can be summarized as matrix cracking and delaminating appear at the specimen front and back surfaces. The sudden stress transferred from the matrix to the fiber exceeds the fiber strength and results in fiber fracture as shown in Figure 9. SEM image of PA-G-reinforced epoxy failed specimens under flexural loadings is shown in Figure 10.
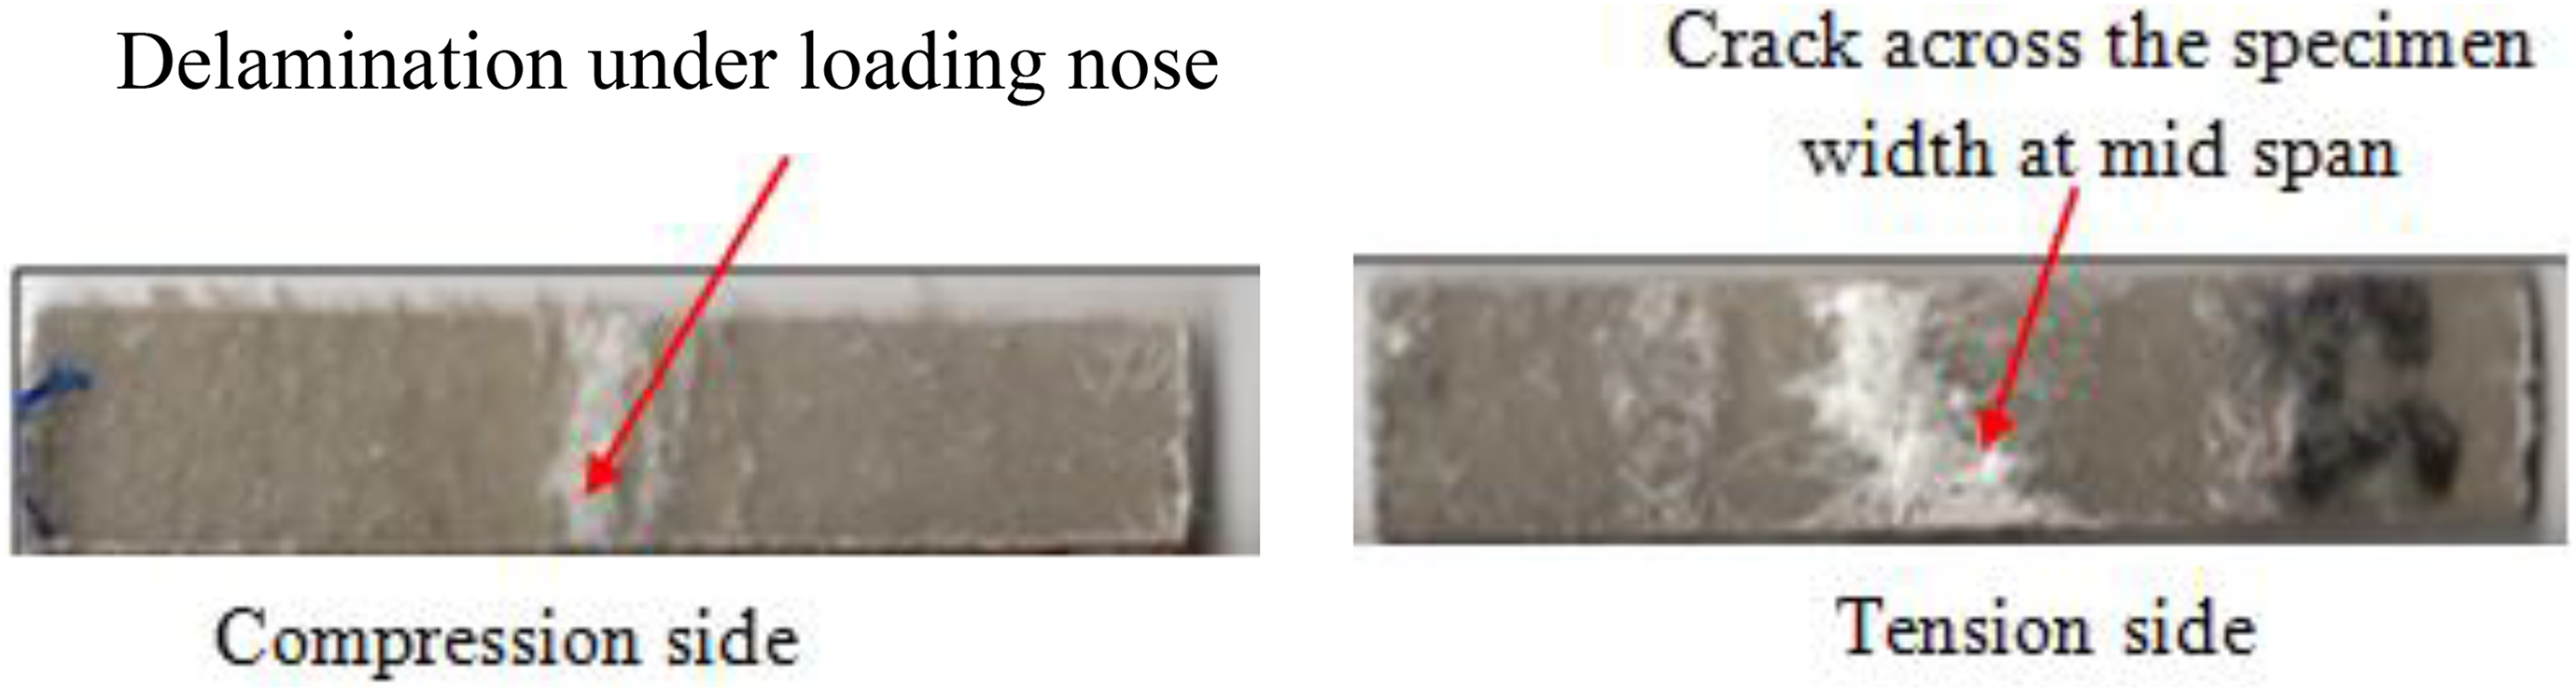
Common failure mode of PA-G-reinforced epoxy flexural test specimens.
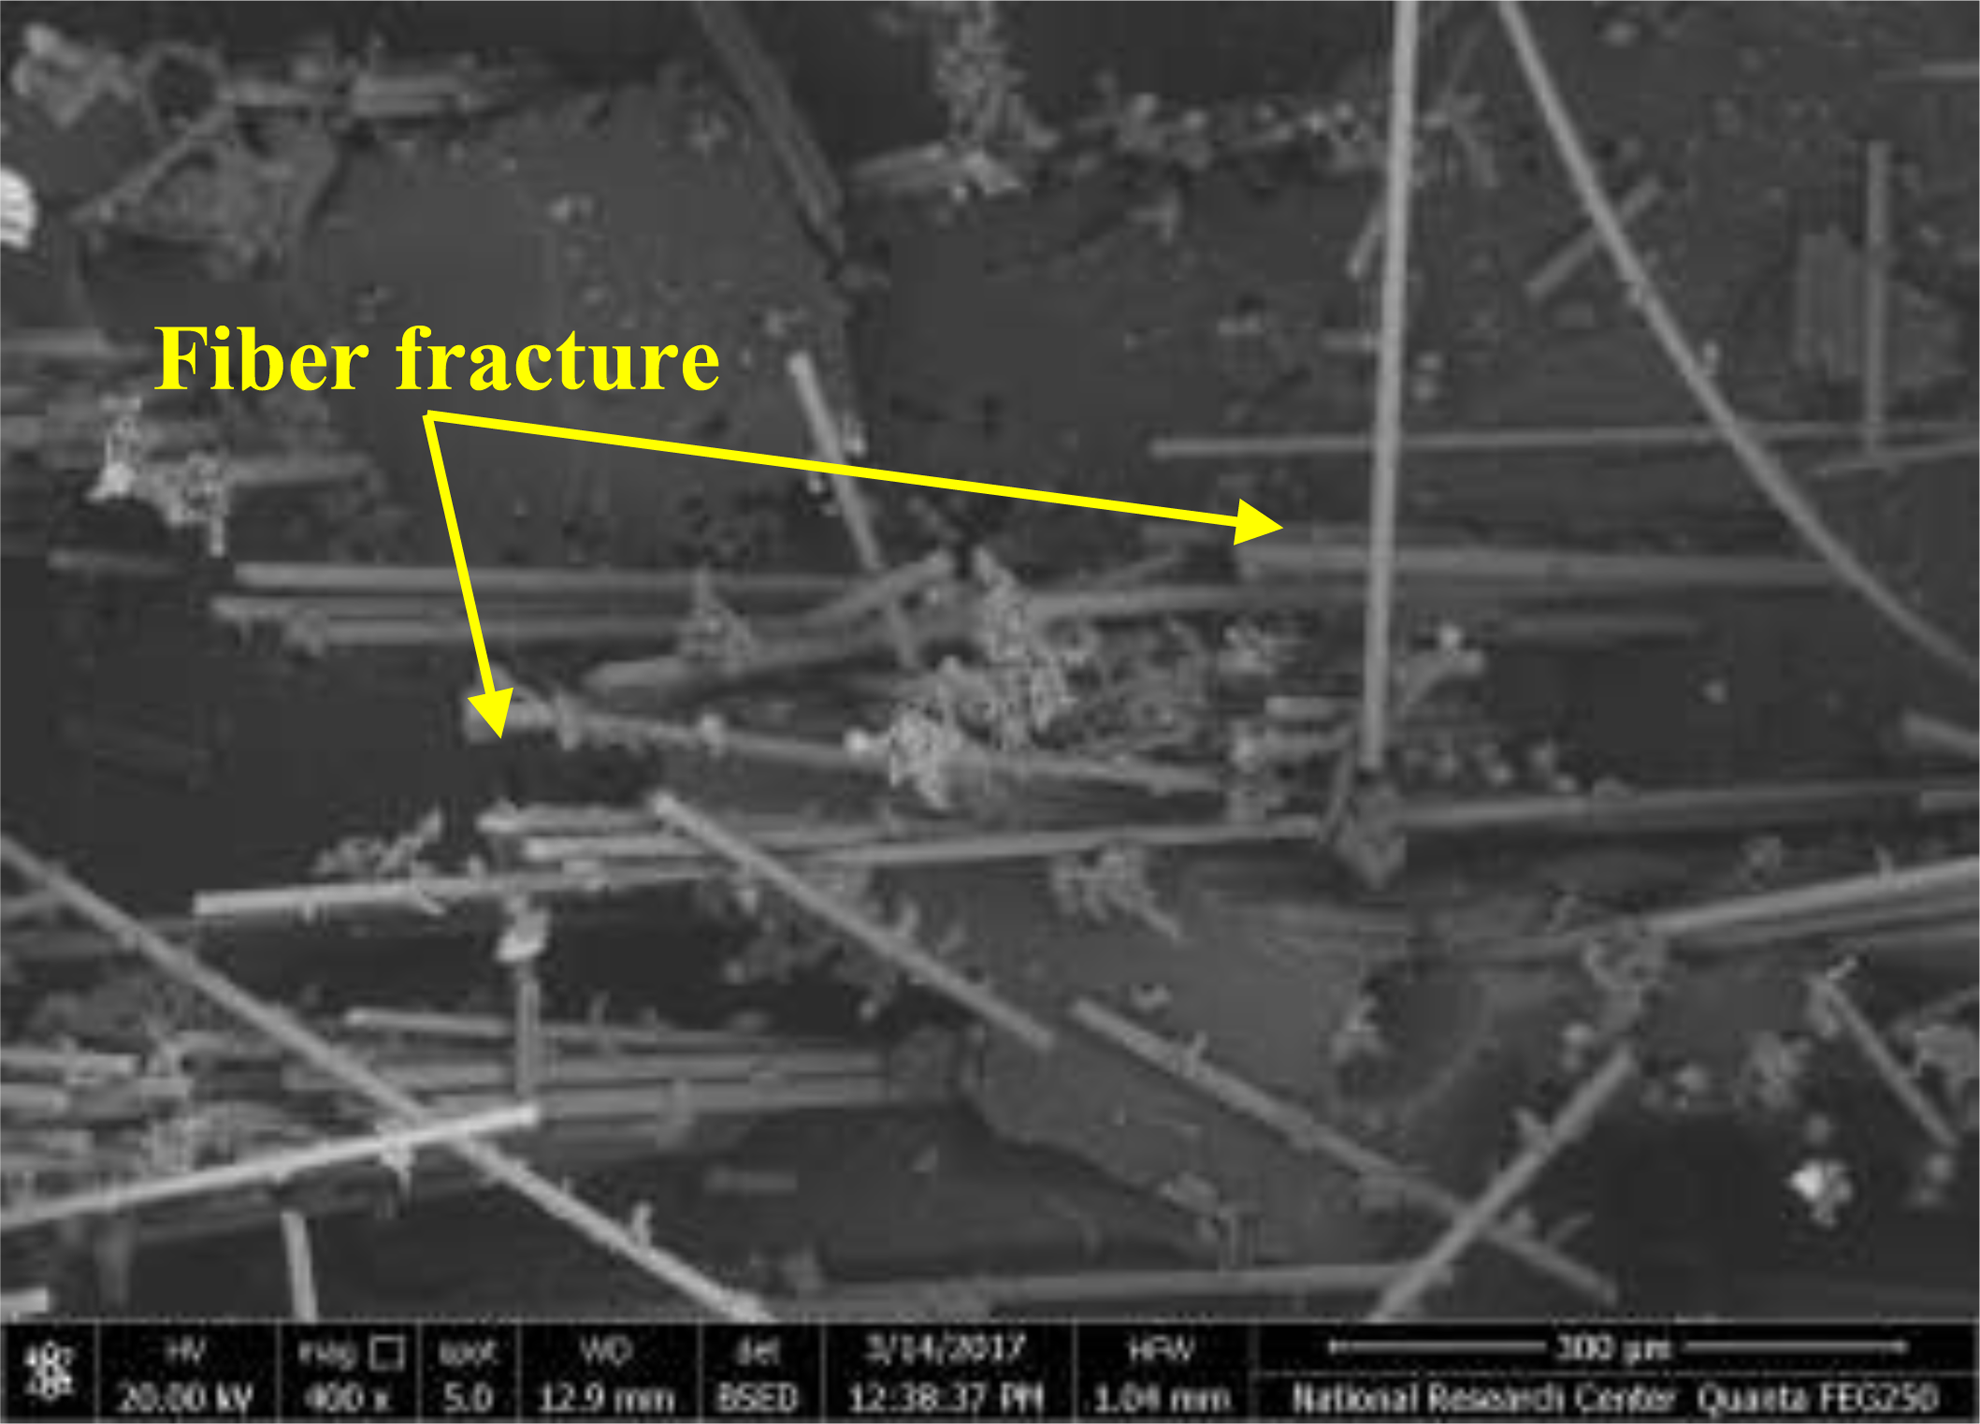
Scanning electron microscopic (SEM) image of PA-G-reinforced epoxy failed test specimens under flexural loading.
Shear properties
Figure 11(a) shows the load–displacement curves obtained from the testing machine for PA-G-fiber–reinforced epoxy composite specimens tested under in-plane shear loading using Iosipescu shear test. These curves have a moderately linear behavior up to a maximum point which represents the developing and propagation of cracks at the notch root. Beyond this point, the complete failure occurs and the load gradually decreases. There are many factors that affect the shear behavior of hybrid and non-hybrid composite laminates such as the mechanical properties and relative amounts of the used fiber, fiber configuration (chopped or roving) and orientation, stacking sequence, and interfacial bond.
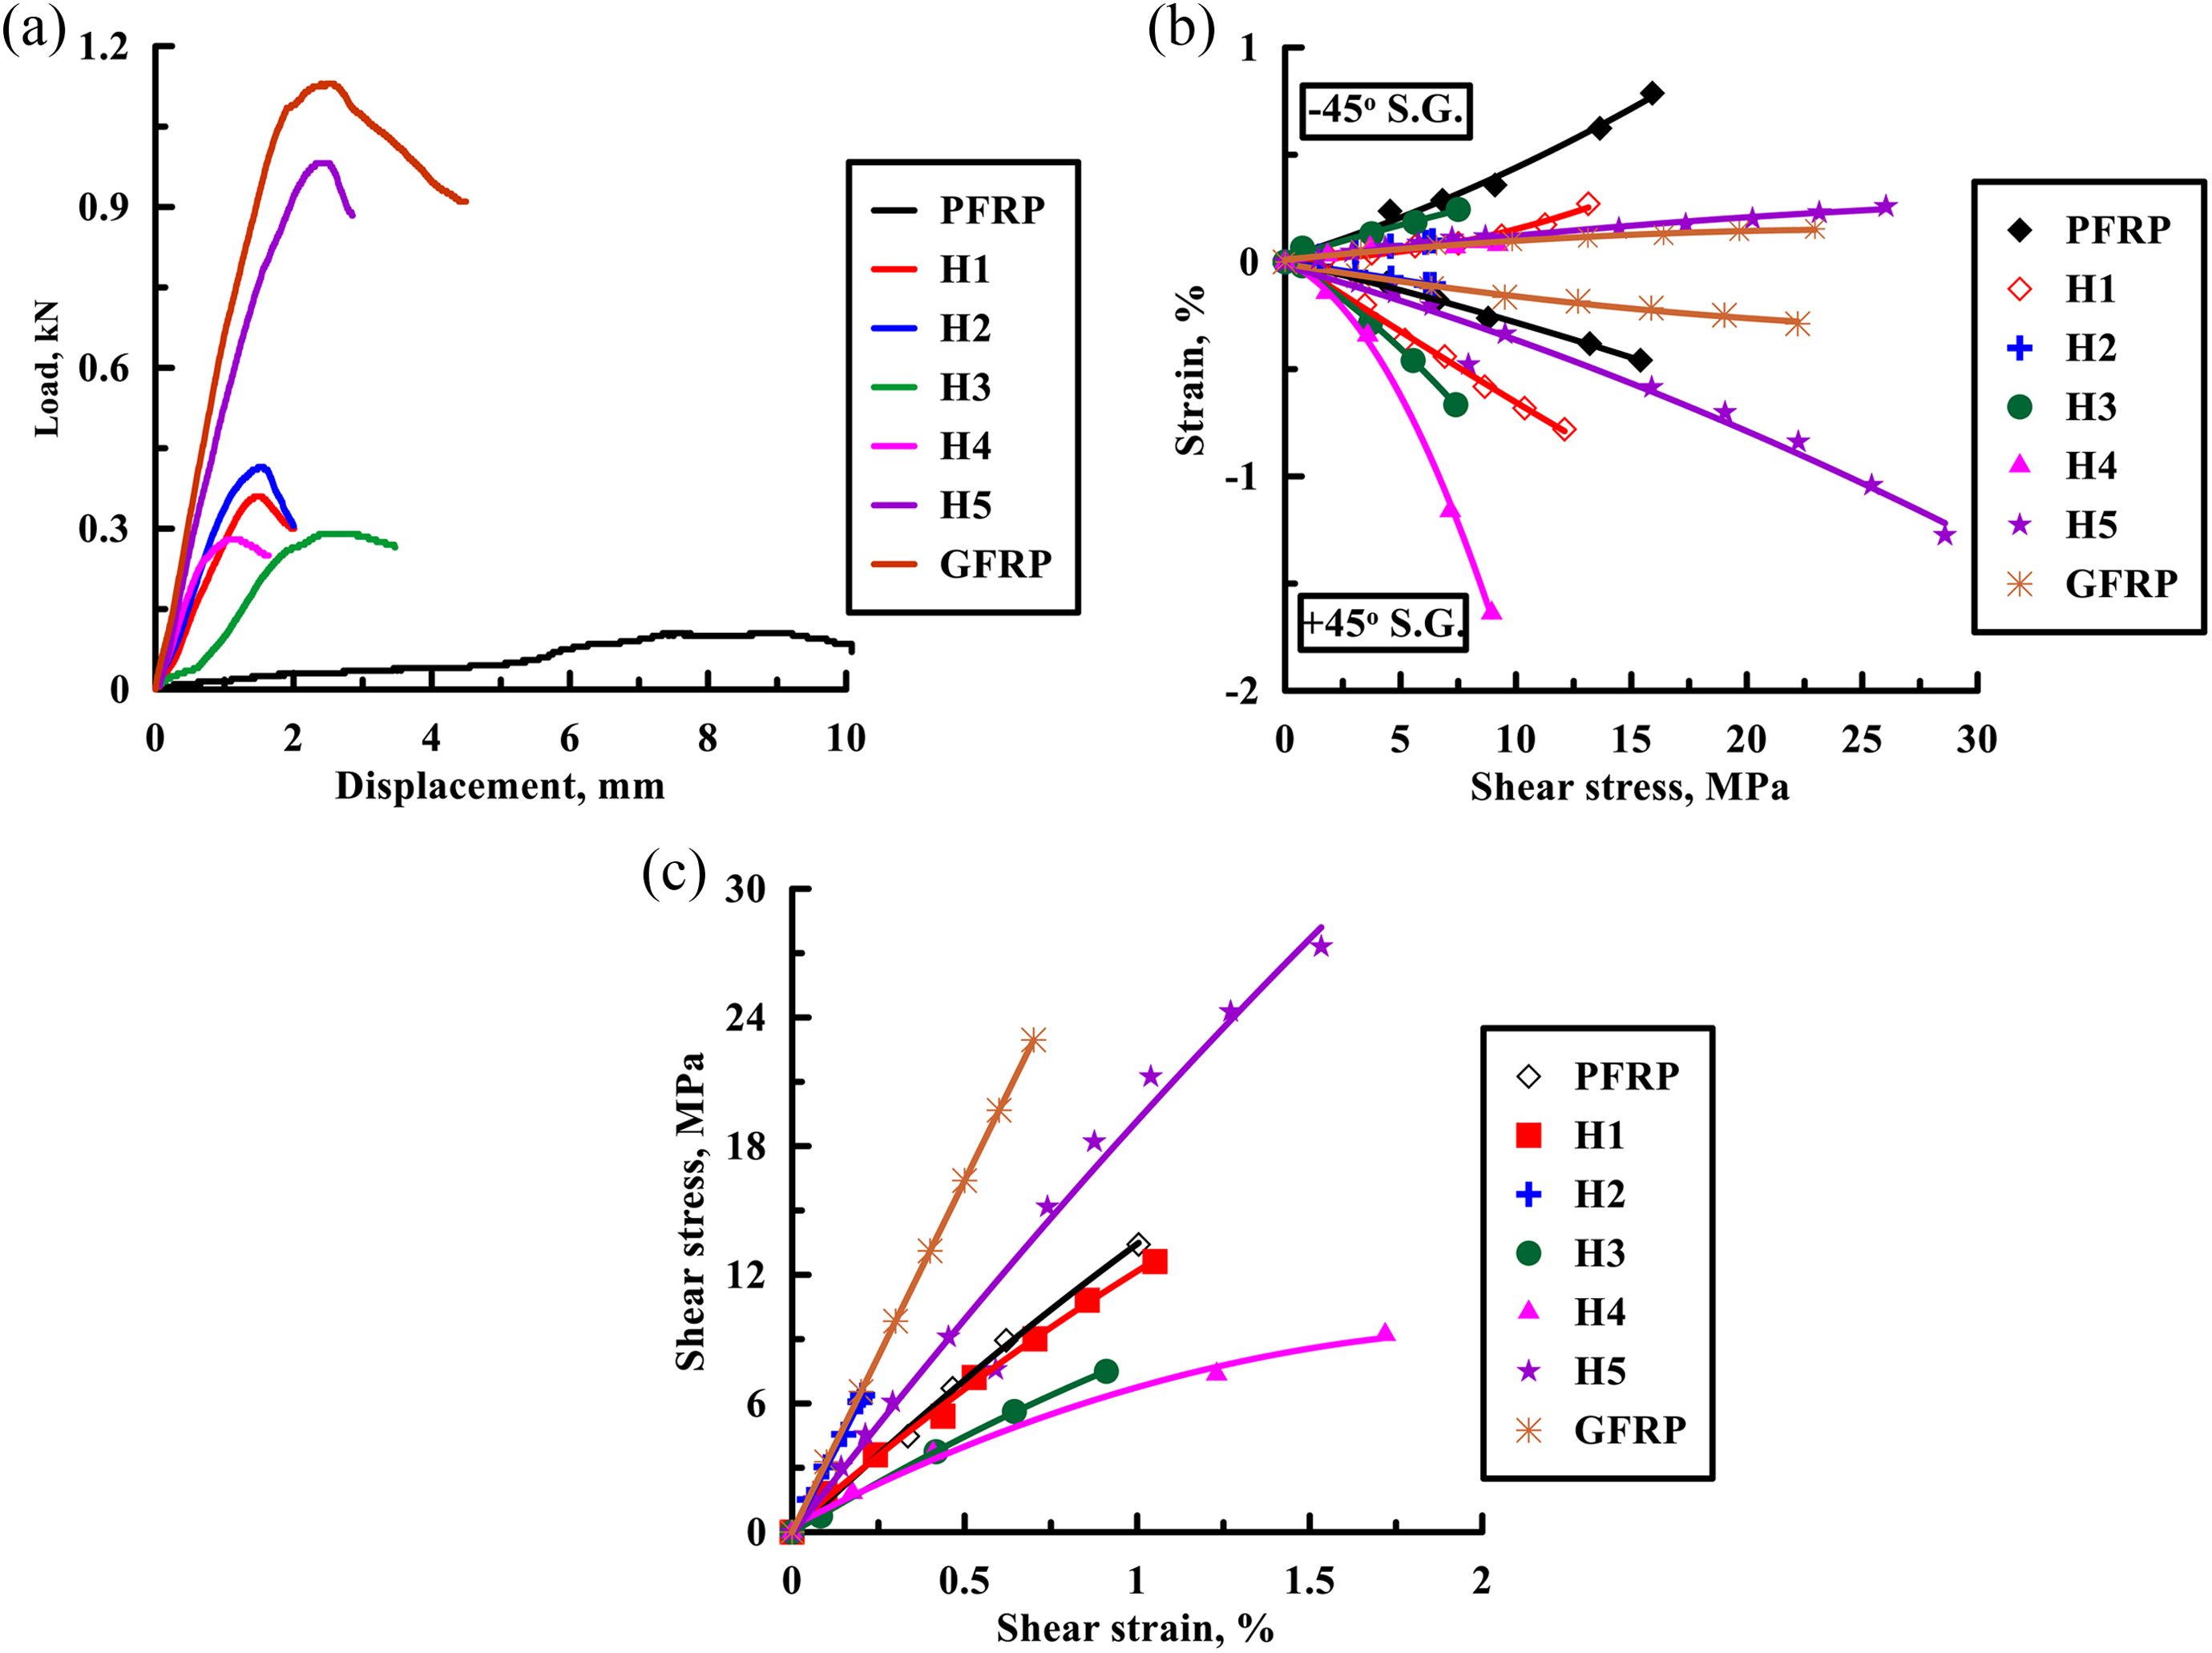
(a) Shear load–displacement diagrams, (b) shear stress (τxy) versus strains (ε +45 ° and ε −45 °), and (c) shear stress (τxy) versus shear strain (γxy), for PA-G-reinforced epoxy composites.
Figure 11(b) shows the relationship between the shear stress and the strains taken from +45° and −45° strain gauges bonded on the test specimens. From this figure, the relationship between the shear stress (τxy) and shear strain (γxy) was constructed as illustrated in Figure 11(c) from which shear modulus (Gxy) could be calculated.
It is obvious from Figure 11 and Table 3 that GFRP specimen has the maximum shearing force, while PFRP specimen has the highest deformation to failure. Shear strength and modulus of GFRP composite are, respectively, about 8.5 and 2.0 times those of unidirectional PFRP composite. Also, it is clear from Figure 11(a) and Table 3 that, as
Figure 11 and Table 3 declare the effect of the stacking sequence on the average shear properties (strength and modulus) of PA-G-reinforced epoxy hybrid composite specimens. It is clear that the shear behavior of the hybrid system is influenced by the material combinations in addition to their arrangement across the thickness. When G-fiber layers are at the middle of the composite laminate and PA-fiber layers are located at the surface, H1, the shear strength and modulus are improved by about 81.5 and 34.8%, respectively, in comparison with hybrid composite laminate with the opposite arrangement, H3. This behavior may be attributed to a better transfer of the load from the weak (weak in shear) exterior layers (PA-fiber layers), resulting in improved crack arrest mechanisms by the interior strong layers (G-fiber layers). This result agrees with that obtained by Selmy et al. 9
In general, the in-plane shear properties of PA-fiber–reinforced composite have been greatly enhanced by adding chopped G-fiber plies, regardless the G-fiber plies location and amount, through the fabrication of hybrid composites.
Regarding the composite specimens tested under in-plane shear, failure occurs in the notch tip area due to the stress concentrations caused by the existence of geometry and material discontinuities at the free edges of the notches. For PFRP composites, two asymmetrical horizontal macro-cracks starting just below the notch tips, propagating in two opposite sides along the fiber direction, were observed as shown in Figure 12(a). For hybrid composites, delamination parallel to the loading direction connecting the roots of the V-notches was observed as shown in Figure 12(b). For GFRP composites, macro-cracks and delamination were noticed around the notch roots instead of the center region between the notches. By continuously increasing the loading, crushing the material at the inner loading points was noticed (Figure 12(c)). Chiang and He 48 confirmed these results.
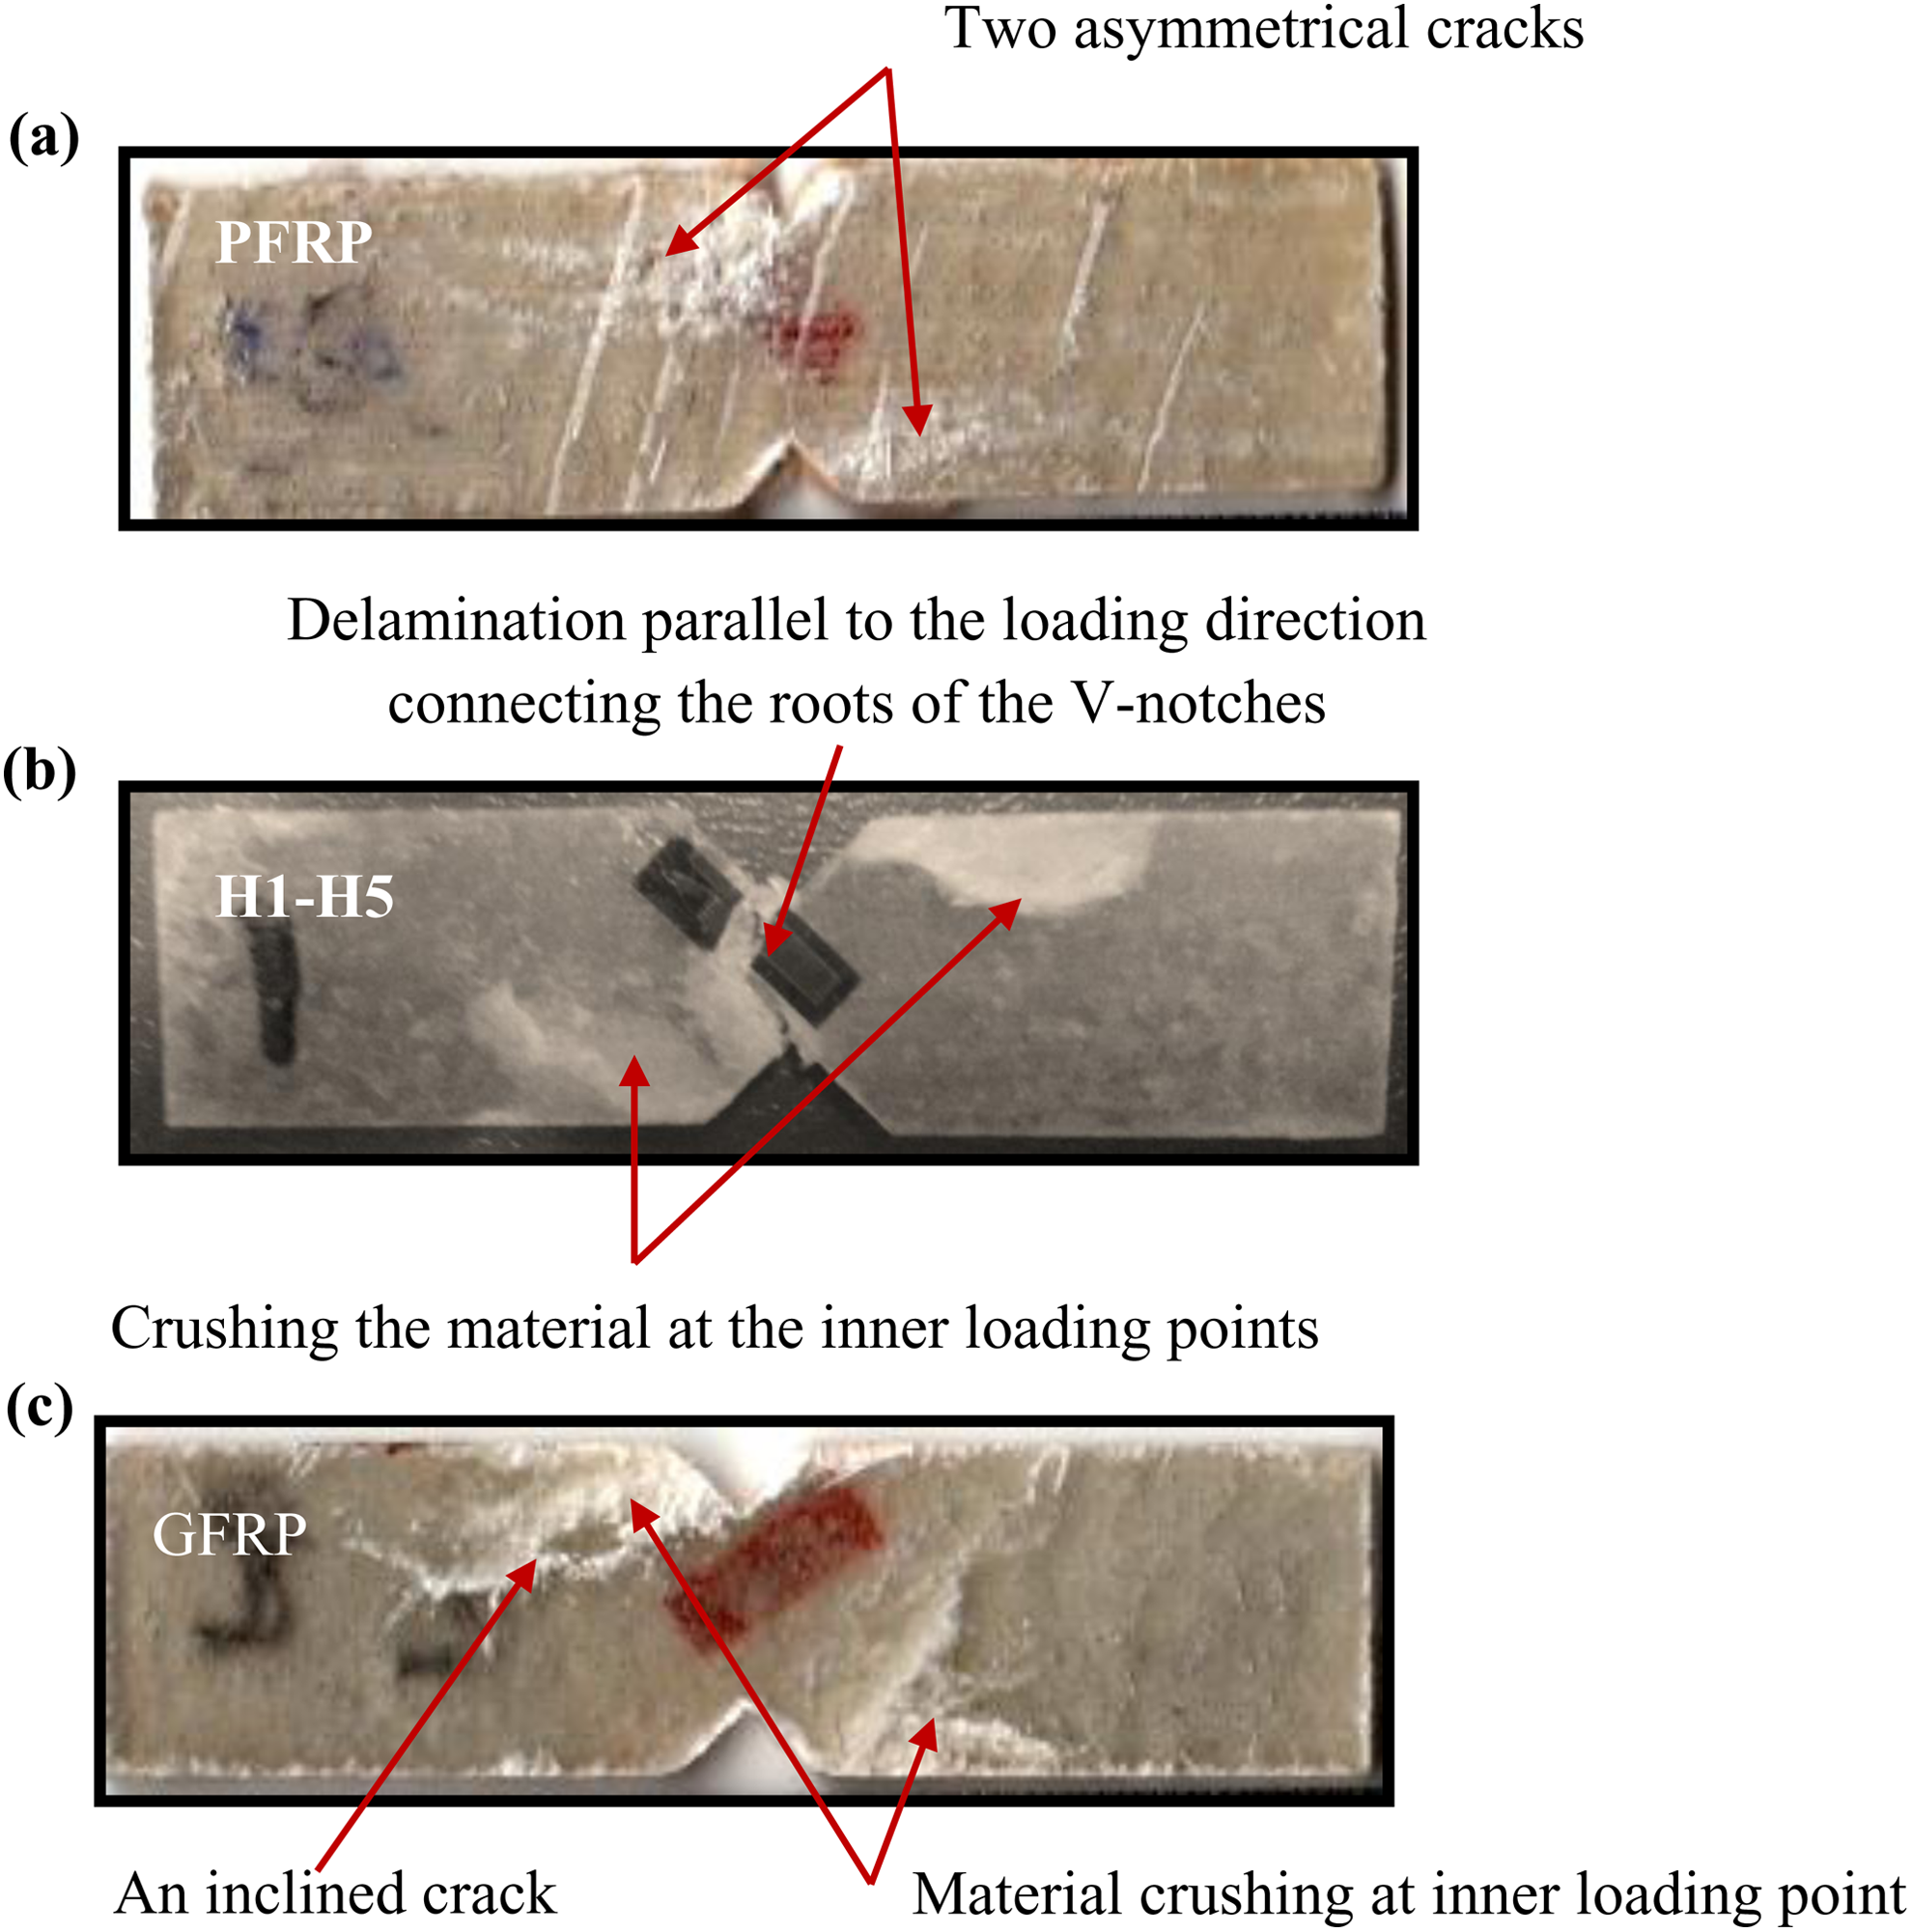
Common failure modes of PA-G-reinforced epoxy specimens tested under in-plane shear loading using Iosipescu test.
Specific properties
Table 5 shows the various specific properties of the fabricated composites. It is obvious that PFRP non-hybrid composite has the best specific tensile strength, while GFRP has the best specific Young’s modulus, flexural strength, flexural modulus, and shear strength. Comparing the hybrid composites, one can note that H3 hybrid composites show the highest specific tensile and flexural strengths which are approximately about 0.7 times those of PFRP and GFRP composites. Also, H2 hybrid composite gives the highest specific Young’s modulus and shear modulus which presents 0.8 and 1.3 times those of GFRP. Hybrid composites H1 and H5 provide, respectively, the highest specific flexural modulus and specific shear strength which are 0.5 and 1.0 times those of GFRP, respectively. From the mentioned results, it is clear that the flexural and shear properties increase with increasing G-fiber content while tensile properties decrease.
Specific properties of the fabricated PA-G/epoxy composites.
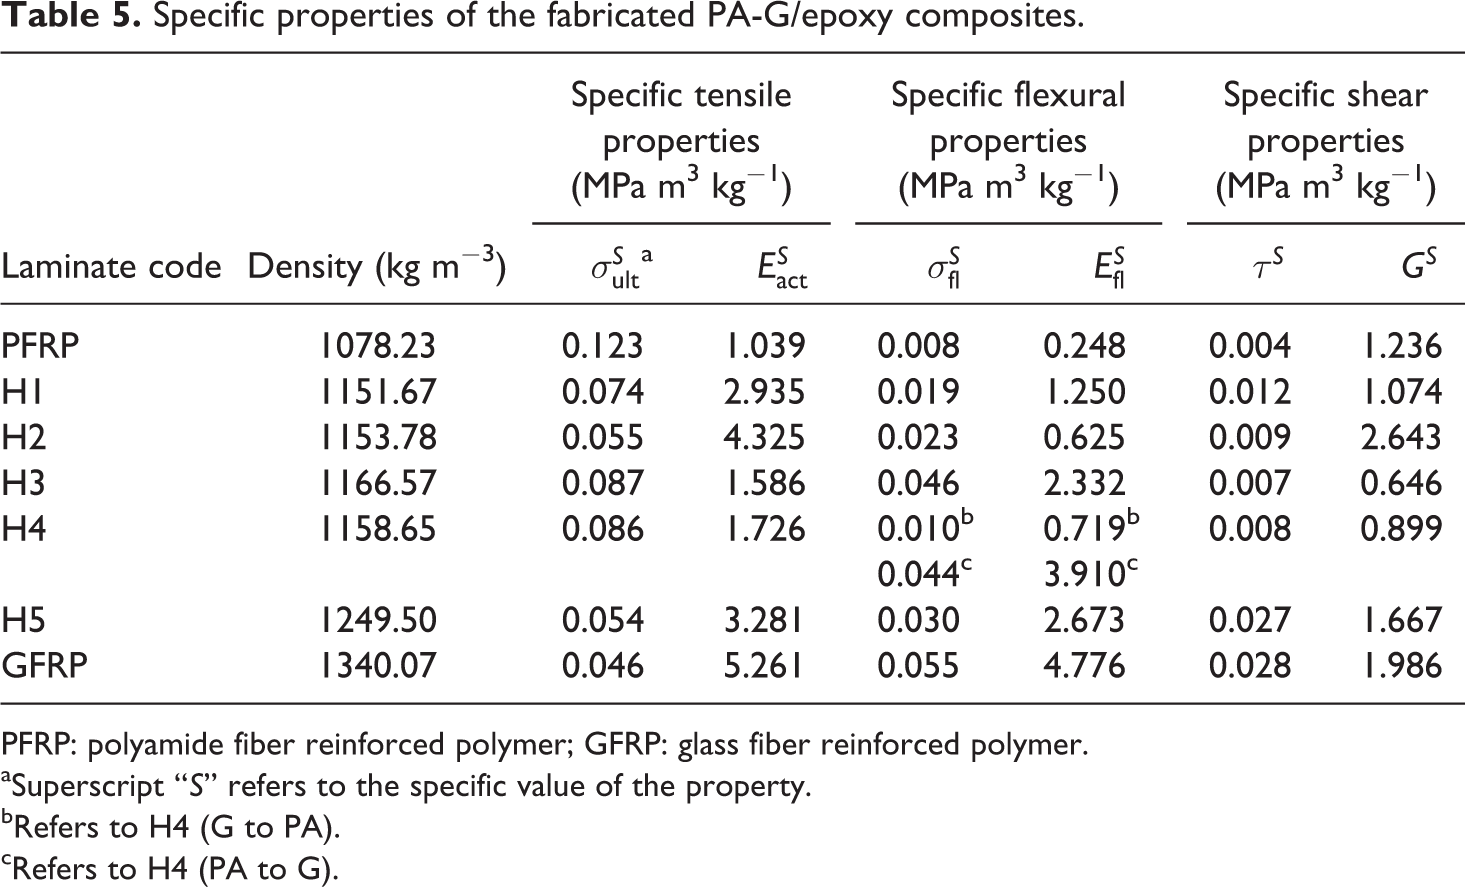
PFRP: polyamide fiber reinforced polymer; GFRP: glass fiber reinforced polymer.
aSuperscript “S” refers to the specific value of the property.
bRefers to H4 (G to PA).
cRefers to H4 (PA to G).
Hybrid effect
A positive or negative hybrid effect in hybrid composites is defined as a positive or negative deviation of a certain mechanical property from the rule-of-mixtures behavior. There are different parameters that might control the hybrid effect such as the relative volume fraction of fiber types, the relative moduli and strengths of the fibers, the nature of the fiber–matrix interface, and the arrangement of the fibers within the composite. Comparisons are made between the experimentally observed values and predictions based on the rule-of-mixtures for the tensile, flexural, and shear strengths. 49
It is obvious from Figure 13 that a negative hybrid effect governs the mechanical properties of PA-G/epoxy hybrids except for H3 and H4 (PA to G) under flexural loading and H5 under shear loading. The flexural strength for H3 and H4 (PA to G) composites and shear strength for H5 indicated the maximum hybrid effect. This result agrees with that obtained by Dong and Davies. 50 The occurrence of a negative or a positive hybrid effect depends on two factors, that is, on the arrangement of the fibers within the hybrid and on their relative volume fraction as reported by Marom et al. 49
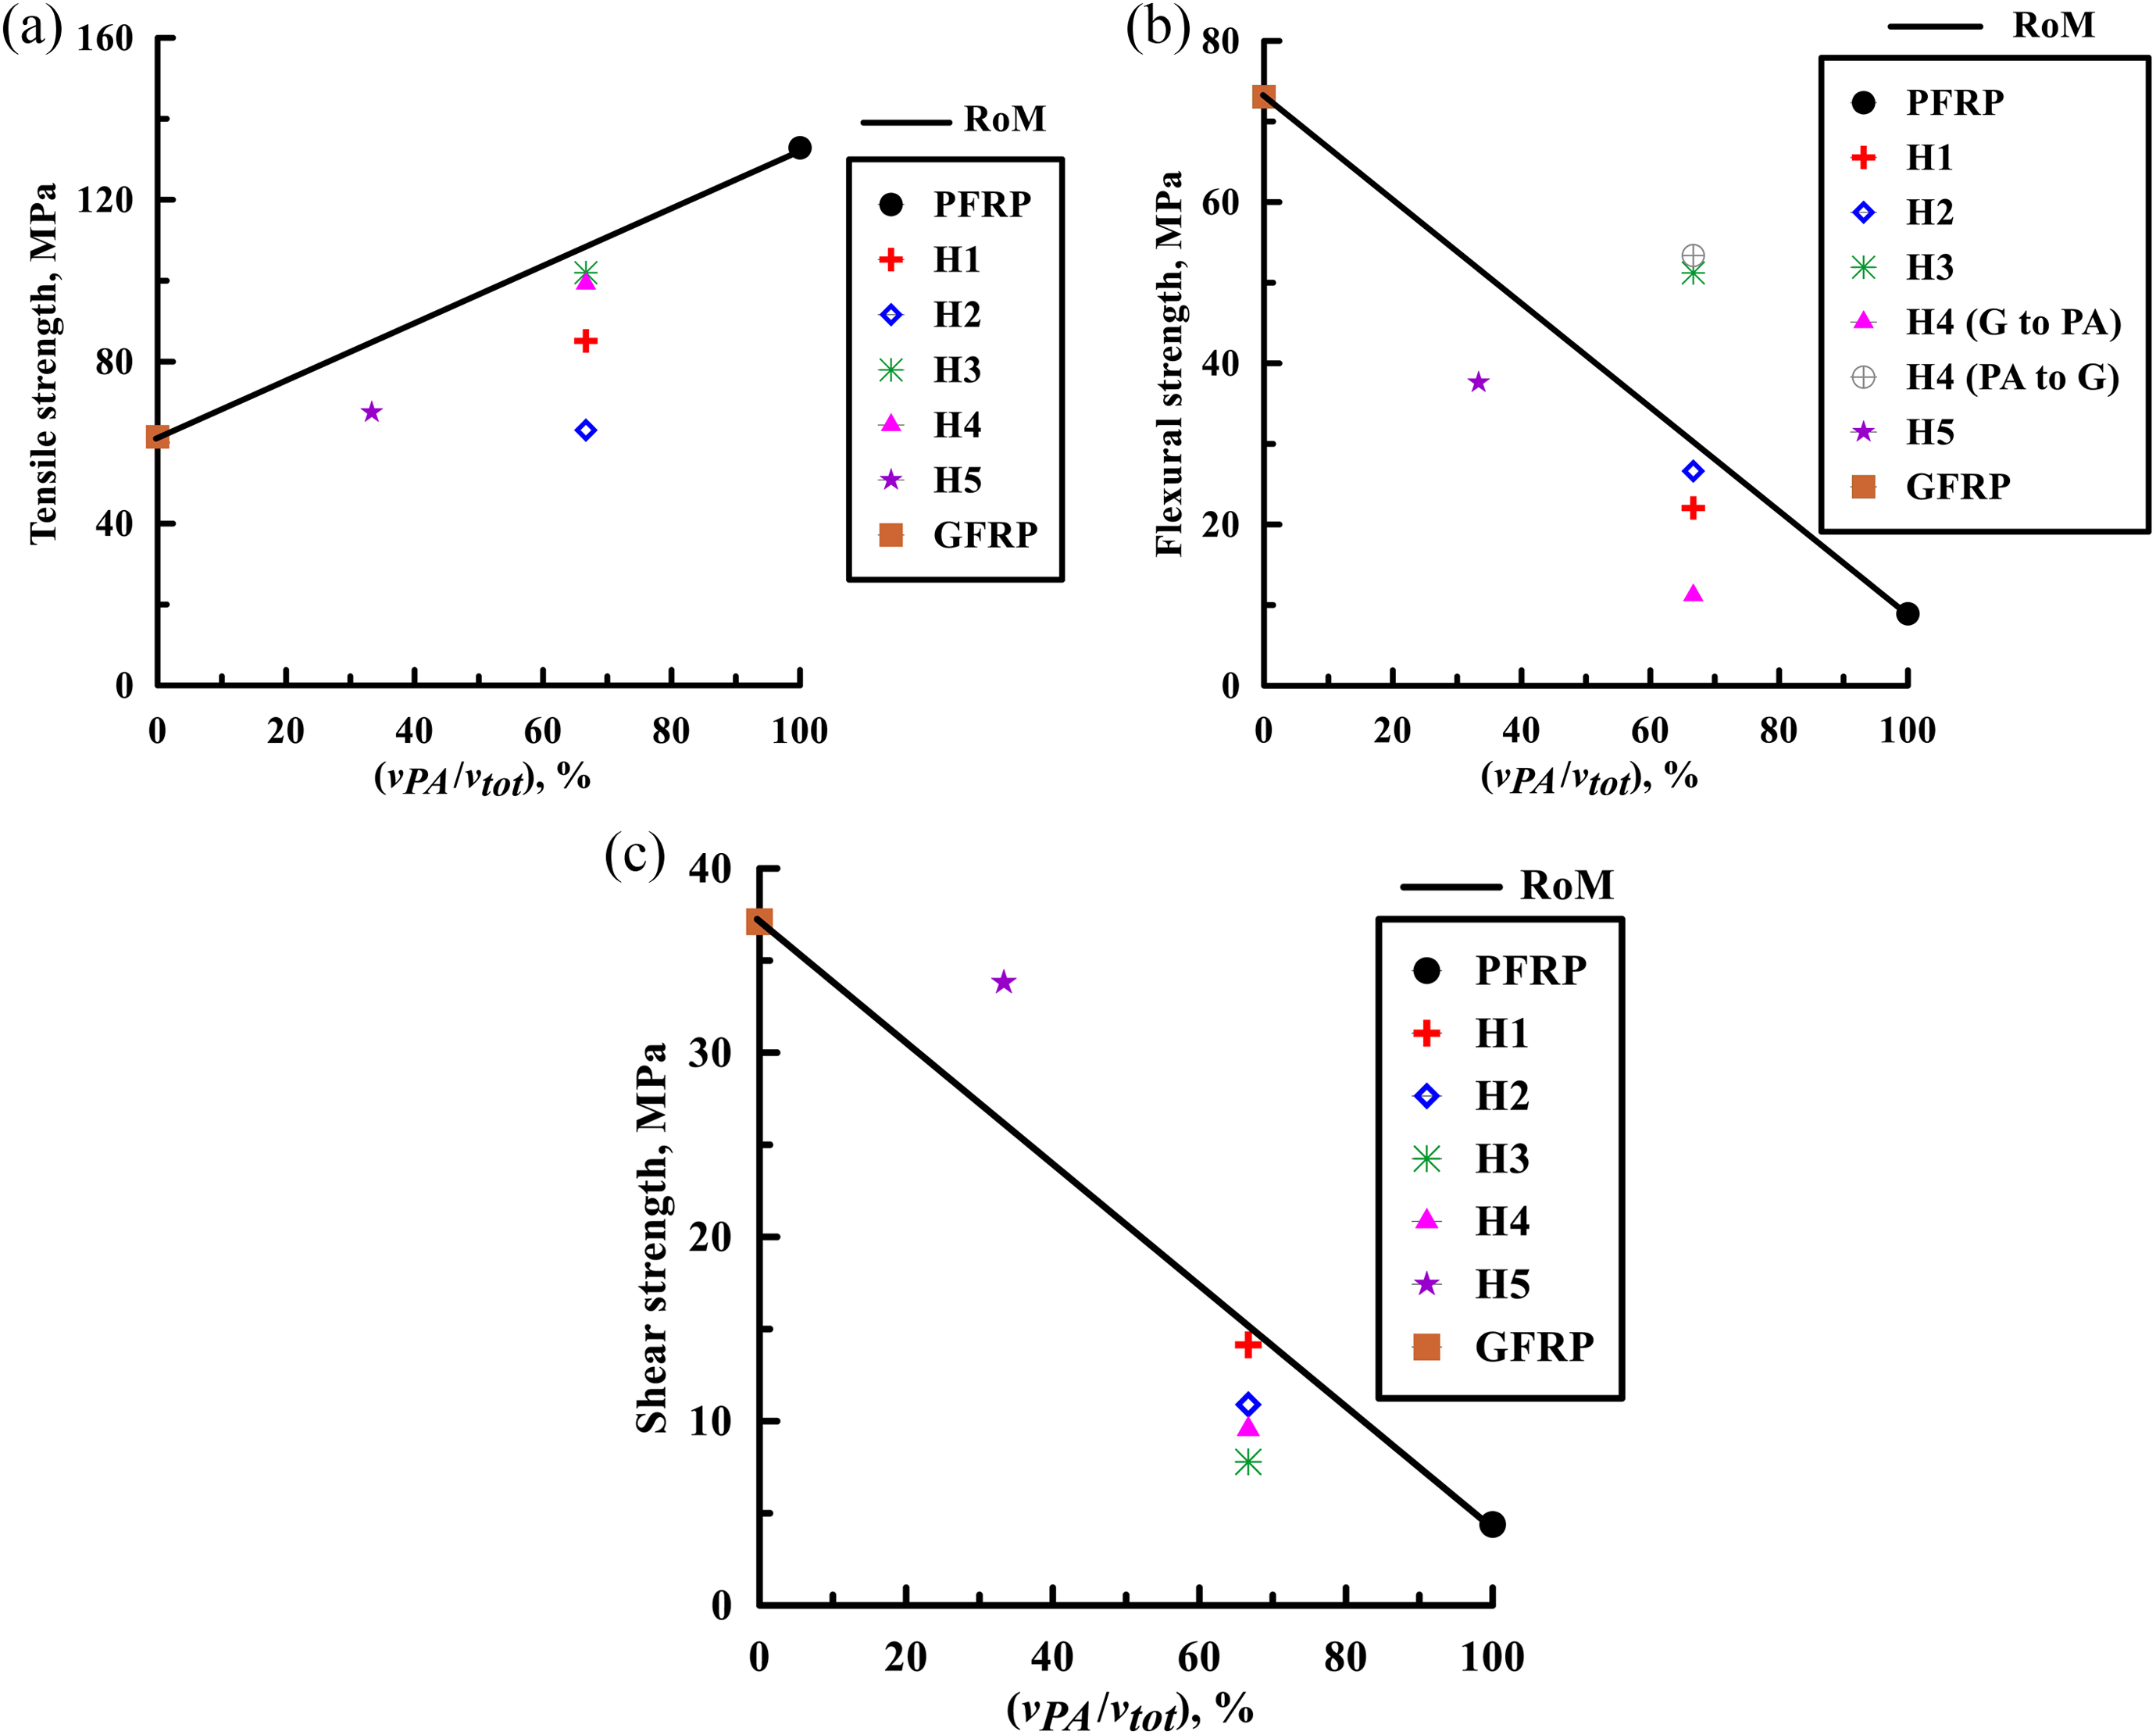
Hybrid effect on the studied mechanical properties of PA-G-reinforced epoxy composites.
Scatter in the test results
Many factors can affect the test results, such as specimen manufacturing, preparation, handling, storage, test rig design, and experimental technique. The statistical scatter, that is, coefficient of variation (CV), in the experimental test results, has been obtained as presented in Tables 3 and 4. The maximum CV for ultimate tensile strength, Young’s modulus, strain to failure, shear strength, flexural strength, flexural modulus, and flexural strain was observed to be 4.43% for H5, 11.84% for PFRP, 4.83% for H3, 10.09% for H1, 9.54% for H4 (G to PA), 9.81% for H3, and 13.67% for H1, respectively. The minimum CV for ultimate tensile strength, Young’s modulus, strain to failure, shear strength, flexural strength, flexural modulus, and flexural strain were observed to be 1.35% for PFRP, 4.84% for H2, 2.89%, 3.16%, and 1.85% for H5, and 1.94% and 3.64% for H4 (G to PA), respectively. The obtained results reflect a visible accuracy for the tested composite laminates.
Conclusions
This research explored the possibility of using polyamide as a reinforcement with glass fiber to form new inter-ply hybrid composites with improved physical and mechanical properties. The effects of stacking sequence and PA-fiber relative volume fraction
The proposed PA-G/epoxy inter-ply hybrid laminates achieve high ductility and lightweight brought by PA-fiber and high strength and stiffness and low cost brought by G-fiber.
Among the studied composites, pure G/epoxy composite shows the highest void content which can be decreased by hybridizing the G-reinforced composite with PA-fiber.
The stacking sequence has a noticeable effect on the mechanical properties. The best tensile and flexural strengths, 101.97 and 53.37 MPa, respectively, were obtained when the G-fiber were stacked at the composite outer faces and PA-fiber in the composite core. On contrary, the presence of the G-fiber at the composite core gives the highest shear strength, 14.14 MPa.
As PA-fiber relative volume fraction
The obtained hybrid system combines the privileges of each used reinforcement type into a single hybrid composite. The merits of the proposed hybrids make them more suitable for medium load applications.
The obtained promising properties and low density of PA-fiber could make it a potential candidate as reinforcement for polymer matrix to obtain lightweight composites having comparable mechanical performance with G-fiber–reinforced composites.
Hybrid composite with G-fiber at external layers and PA-fiber in the core achieves the best specific tensile and flexural strengths. The best specific shear strength was observed for the hybrid with the opposite arrangement.
A negative hybrid effect governs almost all the studied mechanical properties of PA-G hybrid composites.
Footnotes
Declaration of Conflicting Interests
The author(s) declared no potential conflicts of interest with respect to the research, authorship, and/or publication of this article.
Funding
The author(s) received no financial support for the research, authorship, and/or publication of this article.