
Abstract
This study explores the material extrusion (MEX) based 3D printing of polylactic acid (PLA) reinforced with milled carbon fibre (MCF) composite using the fused deposition modeling (FDM) technique. A Taguchi L16 orthogonal array design was employed to investigate the influence of key FDM process parameters (printing temperature (PT), layer thickness (LT), infill pattern (IP), and print speed (PS)) on the tensile properties of the composite, including Young’s modulus (E), maximum tensile load (Lmax), ultimate tensile stress (UTS), and strain at maximum stress (∊). A combined approach of Gray Relational Analysis (GRA) and Analysis of Variance (ANOVA) was utilized to optimize the process parameters. The results indicate that the optimal combination of 210°C PT, 0.2 mm LT, rectilinear IP, and 30 mm/s PS achieved the highest Gray Relational Grade (GRG). ANOVA further revealed that print speed had the most significant impact on tensile properties (34.84%), followed by layer thickness (30.70%), infill pattern (23.92%), and printing temperature (1.40%). The developed linear model demonstrated high predictive accuracy, with an R2 value of 90.96%. Optical microscopy analysis confirmed that FDM parameters significantly influenced the microstructural characteristics and fracture behavior of the composite. These findings highlight the potential of PLA-MCF composites for high-strength engineering applications, advancing additive manufacturing technologies in structural and functional components.
Highlights
• Optimum printing parameters were identified using GRA and ANOVA.
• 210°C PT, 0.2 mm LT, Rectilinear IP and 30 mm/s PS are the optimum parameters.
• Print speed and layer thickness were the most effective FDM parameters.
Introduction
Additive manufacturing (AM) is a process that combines innovative approaches to develop products by layer deposition over a built plate. 1 With the rapid growth in technology, AM has significant strides in modern manufacturing and has transformed various industries, including aerospace, 2 automobile, 3 bio-medical,4,5 defense, 6 electronics, 7 consumer goods and many more. Among many AM techniques, fused deposition modeling/ fused filament fabrication (FDM/FFF), 8 selective laser sintering (SLS)9,10 and stereolithography 11 are the most popular methods to produce rapid prototypes and functional components. Moreover, FDM, which is a material extrusion-based 3D printing, is the widely used technology because of its ease of use, easy availability of feedstock material, flexibility, economics, and suitability for continuous part fabrication.12,13 This technique traditionally relies on thermoplastics like polyethylene terephthalate glycol (PETG),14–16 acrylonitrile butadiene styrene (ABS),17–19 polylactic acid (PLA),20,21 and polyamide (PA) 22 to manufacture parts for engineering applications. However, these single-material filaments have limitations in mechanical, thermal, and chemical properties, which may restrict their use in more demanding applications. To address these challenges, polymer composite filaments have emerged as a potential solution.
Among all thermoplastic composites, PLA-based composites have emerged as superior materials due to their ease of processing, compatibility, and natural degradability. PLA composite filaments have been reinforced with synthetic fibres, 23 natural fibres, 24 ceramics, 25 and metals 26 to fabricate high-performance 3D-printed products. However, these composites still face challenges in achieving satisfactory results due to improper selection of FDM input parameters. Therefore, current research must focus on identifying printing parameters that can enhance the primary mechanical properties of PLA composites. The primary parameters the FDM process includes are the printing/nozzle temperature, layer height, infill density, infill pattern, raster angle, print speed and nozzle diameter. The variation in these input process parameters directly affects the part physio-mechanical performance, build time and raw material consumption. 27 Therefore, it became necessary to use multi-objective optimization techniques to determine the optimal FDM input printing parameters. This technique involves simultaneous optimization of two or more conflicting response objectives and seeks solutions that balance trade-offs between them. It helps in finding Pareto-optimal solutions, which is a set of optimal solutions where improvement in one objective may worsen another. Among various multi-objective optimization tools, many studies have revealed that Gray Relational Analysis (GRA) shows a smaller error percentage from the ANOVA table, which makes GRA more readily used for parametric optimization.3,28,29
Previously, researchers utilized Taguchi, ANOVA, response surface method (RSM) and GRA methods to determine the effect of printing parameters on the mechanical properties of parts manufactured through FDM technique. Hardani et al. 30 used integrated RSM and desirability function technique (DFT) to evaluate the optimal 3D printing parameters of 3D printed PLA/carbon nanotube (CNT). Chahdoura et al. 31 used GRA analysis for multi-objective optimization of mechanical properties of 3D printed PLA sample. The sample showed optimized results when 3D printed at 0.1 mm layer height, 0° raster angle, 40 mm/s print speed and 100% infill density. Abas et al. 32 used an integrated GRA and entropy approach to optimize the tensile strength, flexural strength and impact strength of 3D printed PLA/CF composite. The optimal results are found for sample 3D printed at 0.1 mm layer height, six contours, 50% infill density, 0° fill angle, 60 mm/s printing speed, 220°C nozzle temperature, 90°C bed temperature, and 0° part orientation. Another study examined the effect of infill pattern, strain rate, and nozzle diameter on 3D-printed PLA samples. GRA revealed that the highest gray relational grade (GRG) was found for a 0.8 mm nozzle diameter, 5 mm/min strain rate, and square cell geometry. ANOVA showed that the nozzle diameter and cell geometry were the major contributors, with an influence of 48.99% and 40.78%, which affected the part performance. 33 Similarly, Kumar and Singh’s study 34 employed Taguchi method-based GRA to optimize FDM printing parameters for 3D-printed PLA surgical instruments. It was found that 3D-printed samples achieved Young’s modulus (E) and ultimate tensile strength (UTS) of 3274 MPa and 42.6 MPa, respectively, with layer height and infill pattern identified as key contributors. Shakeri et al. 35 combined the Taguchi approach with GRA to optimize FDM parameters for 3D printed polyamide 6 (PA6) cylindrical parts. The optimal parameters, including a nozzle temperature of 270°C, bed temperature of 60°C, 0.1 mm layer height, and 600 mm/min print speed, resulted in the highest Gray Relational Grade (GRG). Another study used a similar method to identify the optimal combination of input parameters air gaps, raster width, layer height, raster angle, and build orientation—for fabricating ABS parts. The best surface finish and dimensional accuracy were achieved with the following settings: a layer height of 0.254 mm, a raster angle of 0°, a build orientation of 0°, a raster width of 0.454 mm, and zero air gaps. 36 Singh et al. 37 studied the effect of nozzle diameter, raster pattern build orientation, layer height, infill density and print speed on the tensile strength, build time and material consumption of the PLA components. The design of the experiment (DOE) was adopted based on L27 orthogonal array to fabricate the samples, and the optimum printing parameters were obtained from S/N ratio (signal-to-noise ratio) values. At optimum print settings, UTS obtained was 61.24 MPa, which was 6.26% higher. Pulipaka et al. 38 investigated the effect of FDM printing parameters (nozzle temperature, bed temperature, infill density, layer thickness, and print speed) on the mechanical properties of PEEK samples using the Taguchi method and ANOVA. The study found that elastic modulus, yield strength, ultimate tensile strength, and resilience were primarily affected by infill density, followed by nozzle temperature and layer thickness. Mathiazhagan et al. 39 employed the Taguchi GRA technique to examine the effect of FFF parameters on the mechanical properties of a walnut/PLA-based hexagonal lattice structure composite. They found that maximum flexural and compressive strengths of 4.98 MPa and 28.19 MPa, respectively, were achieved at a lower layer thickness, higher infill, higher printing temperature, and a print speed of 0.1 mm, 100%, 230°C, and 20 mm/s. Kumar et al. 40 optimized extrusion parameters to improve the flowability and tensile strength of an ABS/PC blend filament using the GRA-Taguchi approach. The study found that a 50:50 wt% blend of ABS/PC increased tensile strength by 38.02% compared to pure ABS. Kechagias and Zaoutsos 41 optimized the FFF infill rate, print, and bed temperature for producing dental implants. They observed that reducing the layer thickness to 0.16 mm decreased average surface roughness (Ra) to 9.895 μm. Similarly, another study investigates the effect of printing parameters on tensile properties, build time, and material consumption of 3D-printed PLA composite reinforced with 30% ceramic. The optimization was conducted using combined Taguchi, ANOVA and GRA methods. It was found that the use of GRA has led to an improvement in GRG value by 8.31%. 42
This study focuses on the multi-objective optimization of FDM process parameters to enhance the mechanical performance of carbon fibre-reinforced PLA composites. A systematic approach integrating Taguchi L16 orthogonal array, Grey Relational Analysis (GRA), and Analysis of Variance (ANOVA) was employed to analyze the effects of printing temperature, layer thickness, infill pattern, and print speed on tensile properties. Meanwhile, ANOVA was chosen in this study due to its ability to statistically quantify the influence of multiple FDM process parameters and assess their significance. Unlike other advanced optimization techniques, ANOVA provides a structured approach for evaluating parameter contributions in combination with the Taguchi method and Grey Relational Analysis (GRA). This integration ensures a comprehensive and reliable optimization process, making it an appropriate choice for analyzing the mechanical performance. The Taguchi method was initially used to evaluate individual parameter influences and determine optimal settings. GRA was then applied to convert multiple response variables into a single Grey Relational Grade (GRG), enabling a comprehensive optimization process. Finally, ANOVA was utilized to validate the statistical significance of the results, and a validation experiment confirmed the effectiveness of the optimized parameters. The findings highlight the importance of parameter tuning in improving the structural integrity and performance of FDM-printed composites, offering valuable insights for advanced additive manufacturing applications.
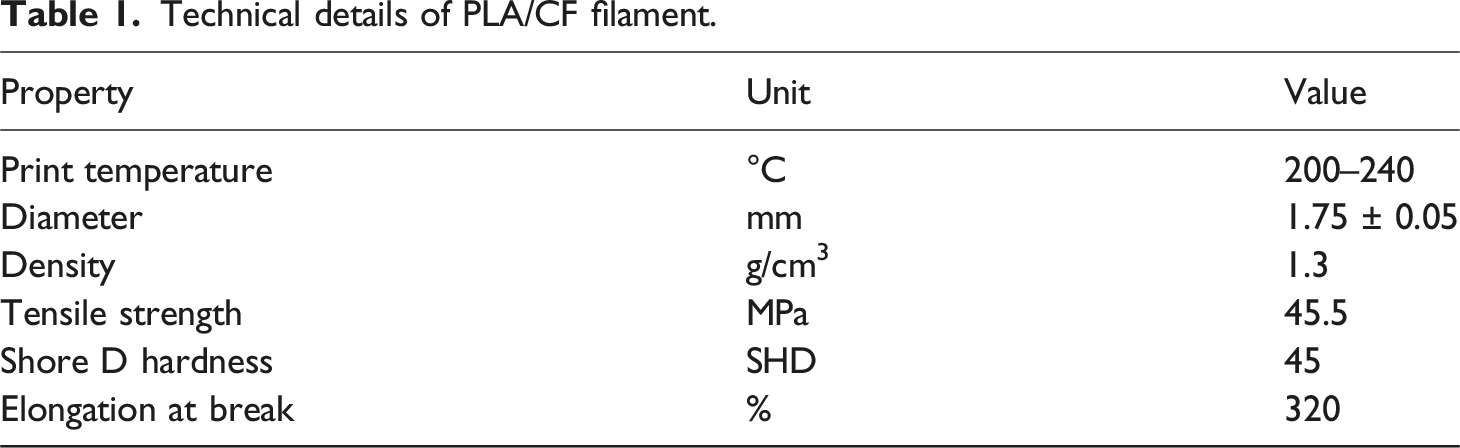
Material
Technical details of PLA/CF filament.
Methodology
Design of Experiment, 3D Printing and Tensile Test
Experimental 3D printing input parameters.
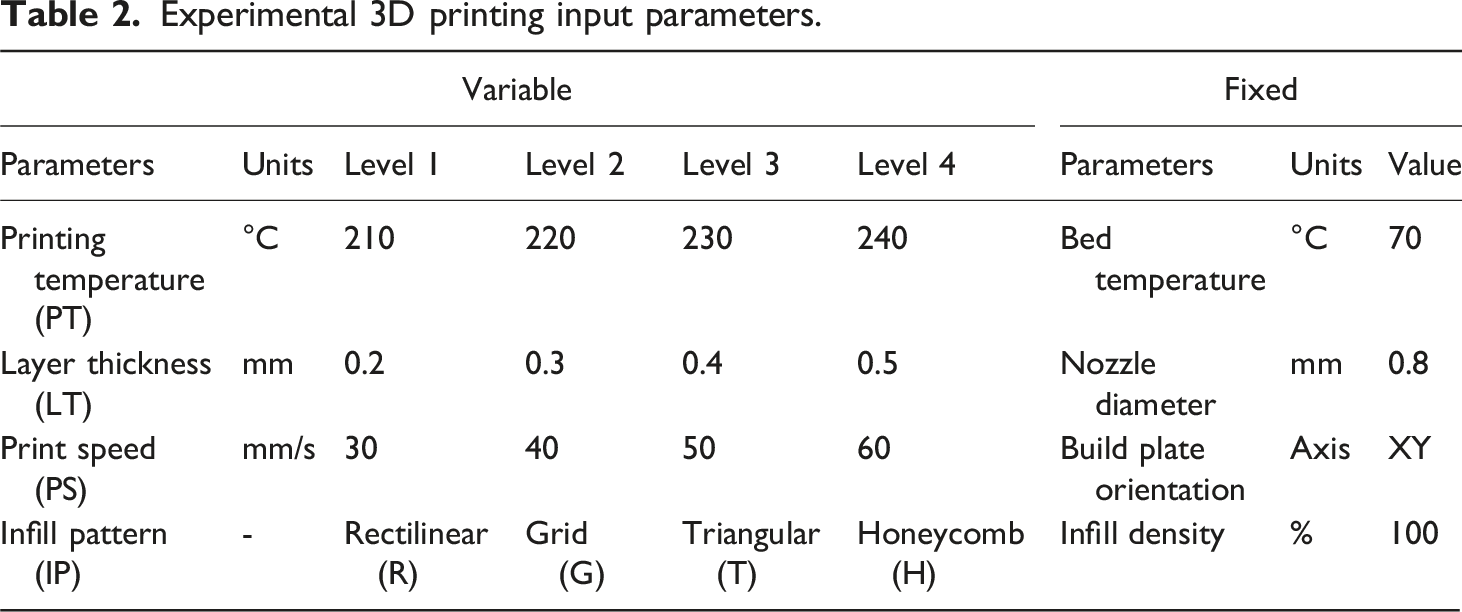
Before sample fabrication, the printer bed was heated to 70°C, and the printer was kept idle for 20 minutes to achieve thermal equilibrium. After achieving thermal equilibrium, a 3D printing glue (Magigoo Original) was applied over the printer bed to ensure complete bed adhesion of part during 3D printing and the printing was started. The complete illustration of 3D printing and the equipment utilized throughout the process is shown in Figure 1. 3D printing of tensile samples.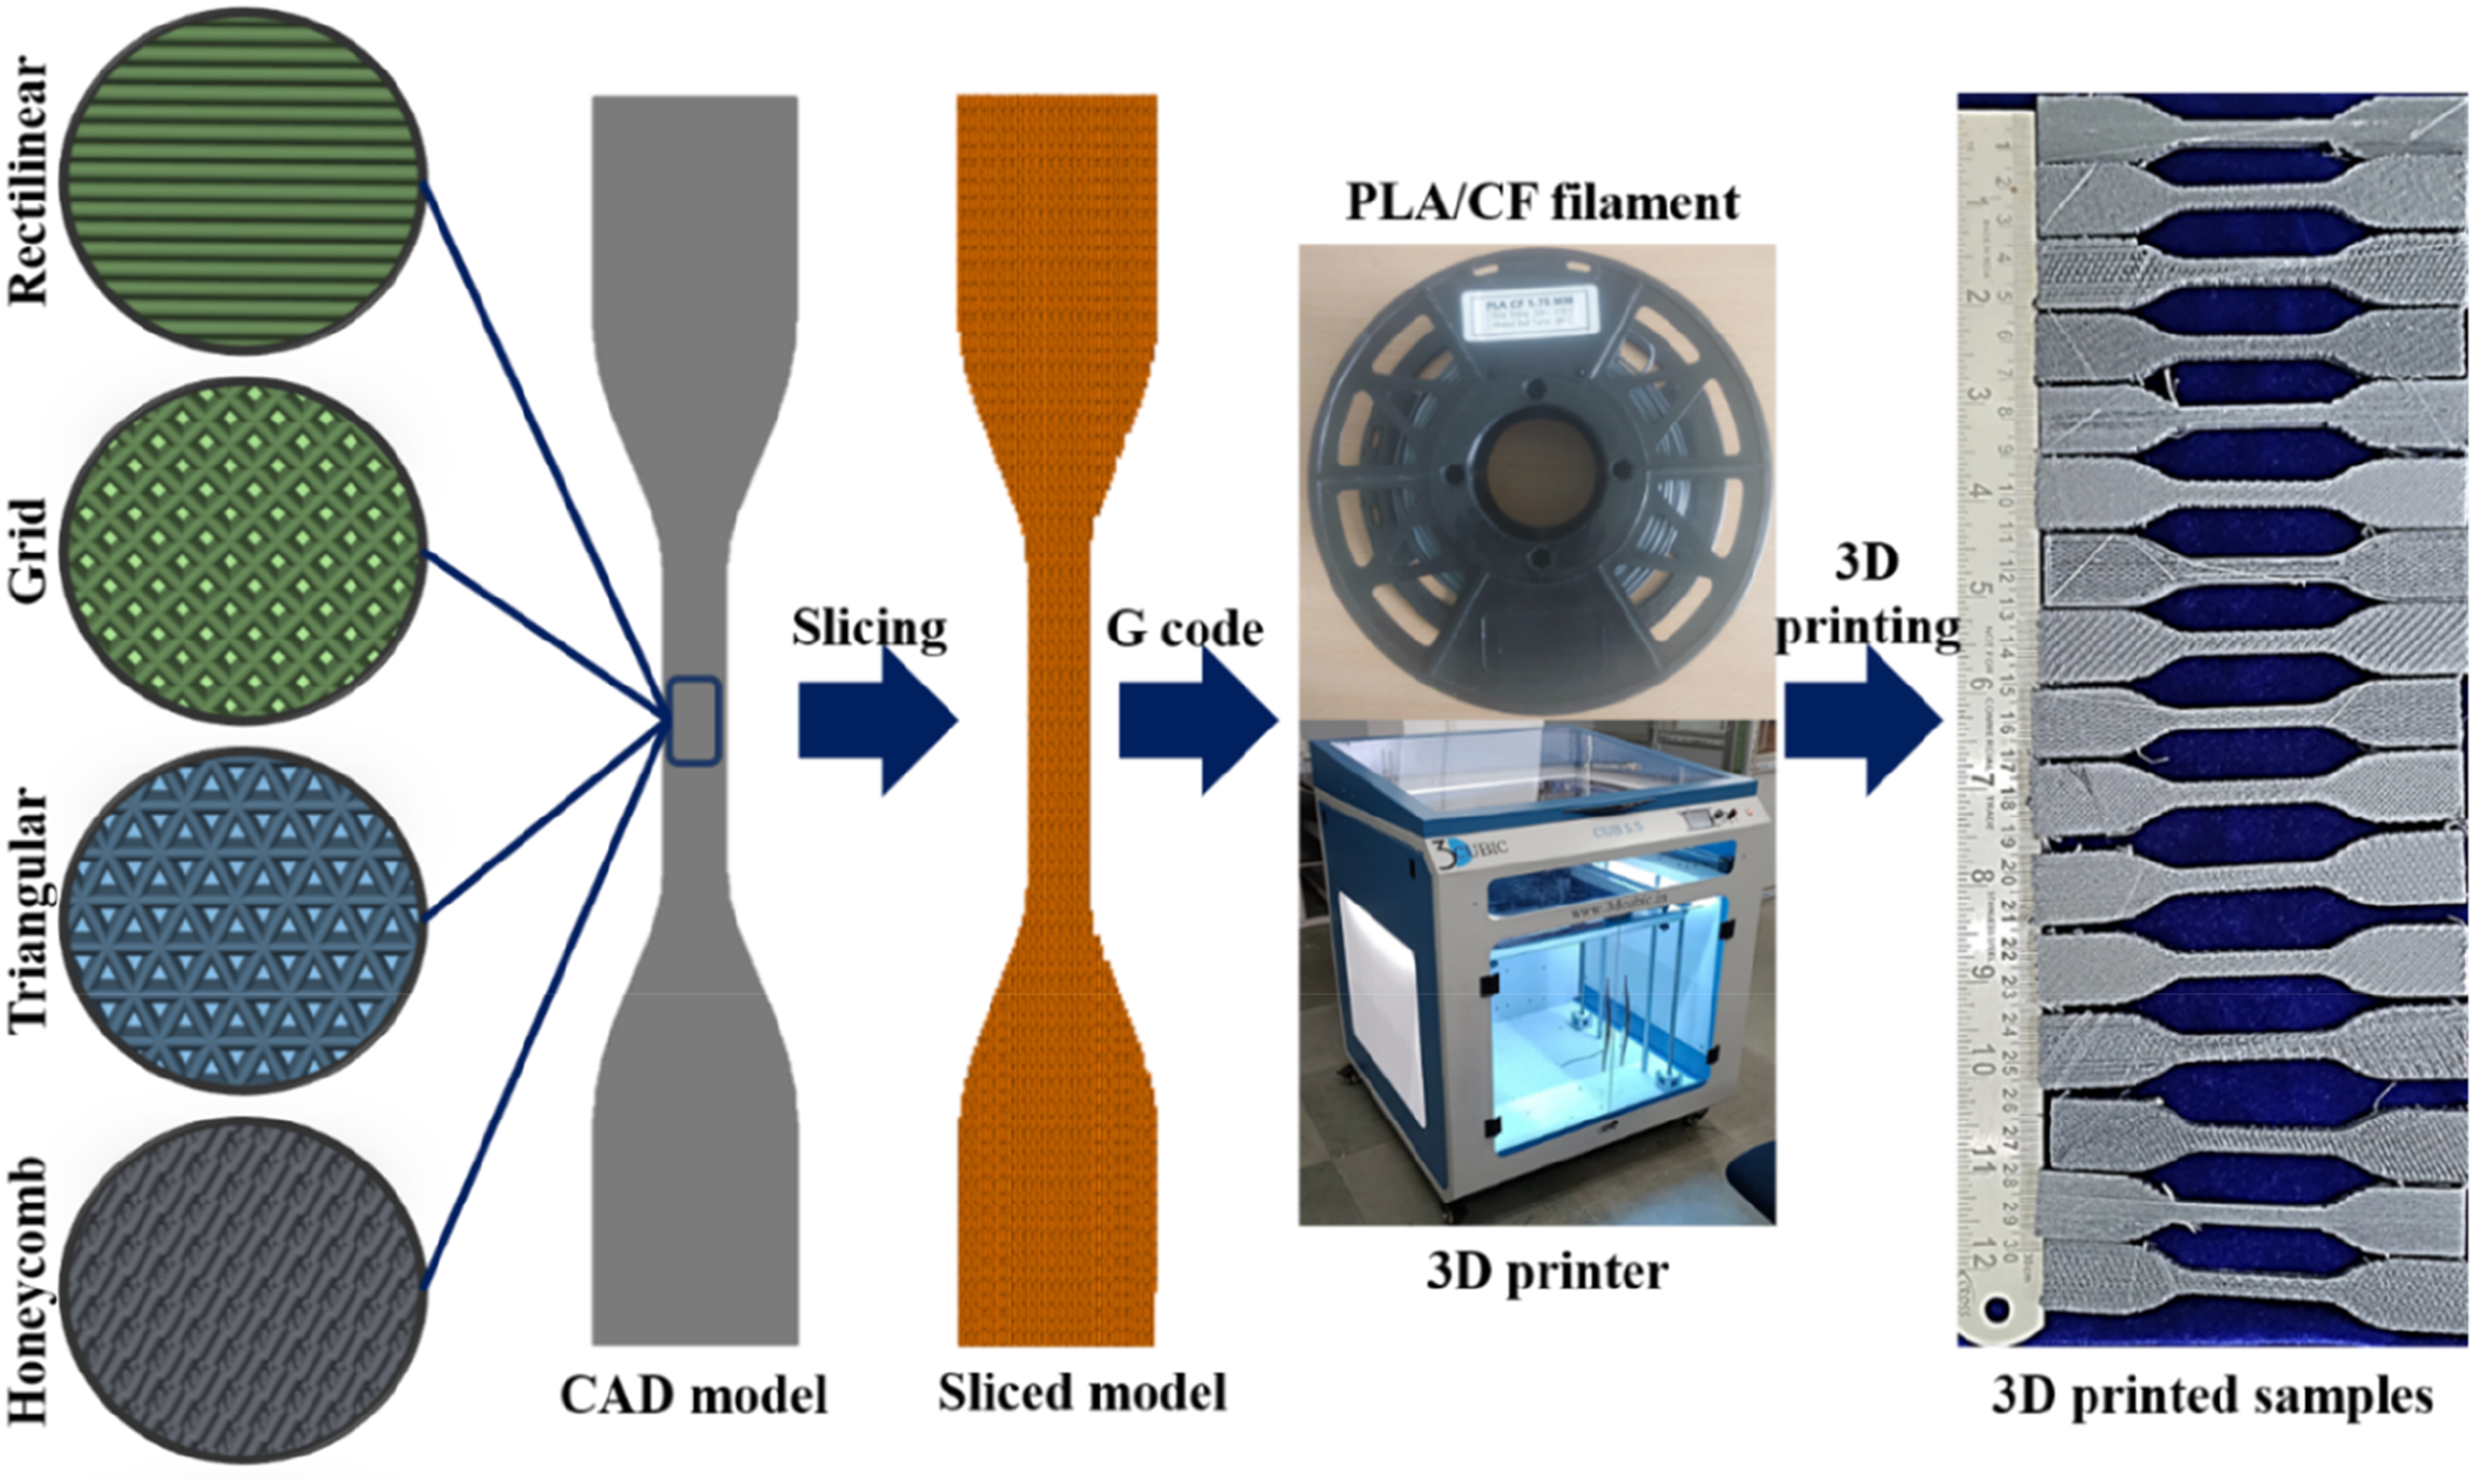
Based on the FDM input parameters, the L16 orthogonal array was selected to fabricate tensile samples. The L16 orthogonal array allows for an efficient experimental design by significantly reducing the number of trials while maintaining the robustness of statistical analysis. This design effectively captures the main effects of multiple process parameters without requiring a full factorial experiment, which would be computationally and experimentally intensive. Compared to other potential designs, such as full factorial or response surface methodology (RSM) and many more, the L16 array provides a systematic approach for process optimization with minimal experimental effort, making it a suitable choice for additive manufacturing studies involving multiple variables.
After the fabrication, tensile samples were then subjected to tensile testing using a 50 kN universal testing machine (UTM) (Tinius Olsen, H50 KL). The samples were gripped between the mechanical jaw of UTM, and the cross-head displacement of 5 mm/min was selected for the test. Before the test, the sample gauge region dimensions were recorded using a vernier calliper and the room temperature was maintained at 24°C and 50% humidity. The complete illustration of the tensile testing with sample dimension is shown in Figure 2. Tensile sample dimension with test setup.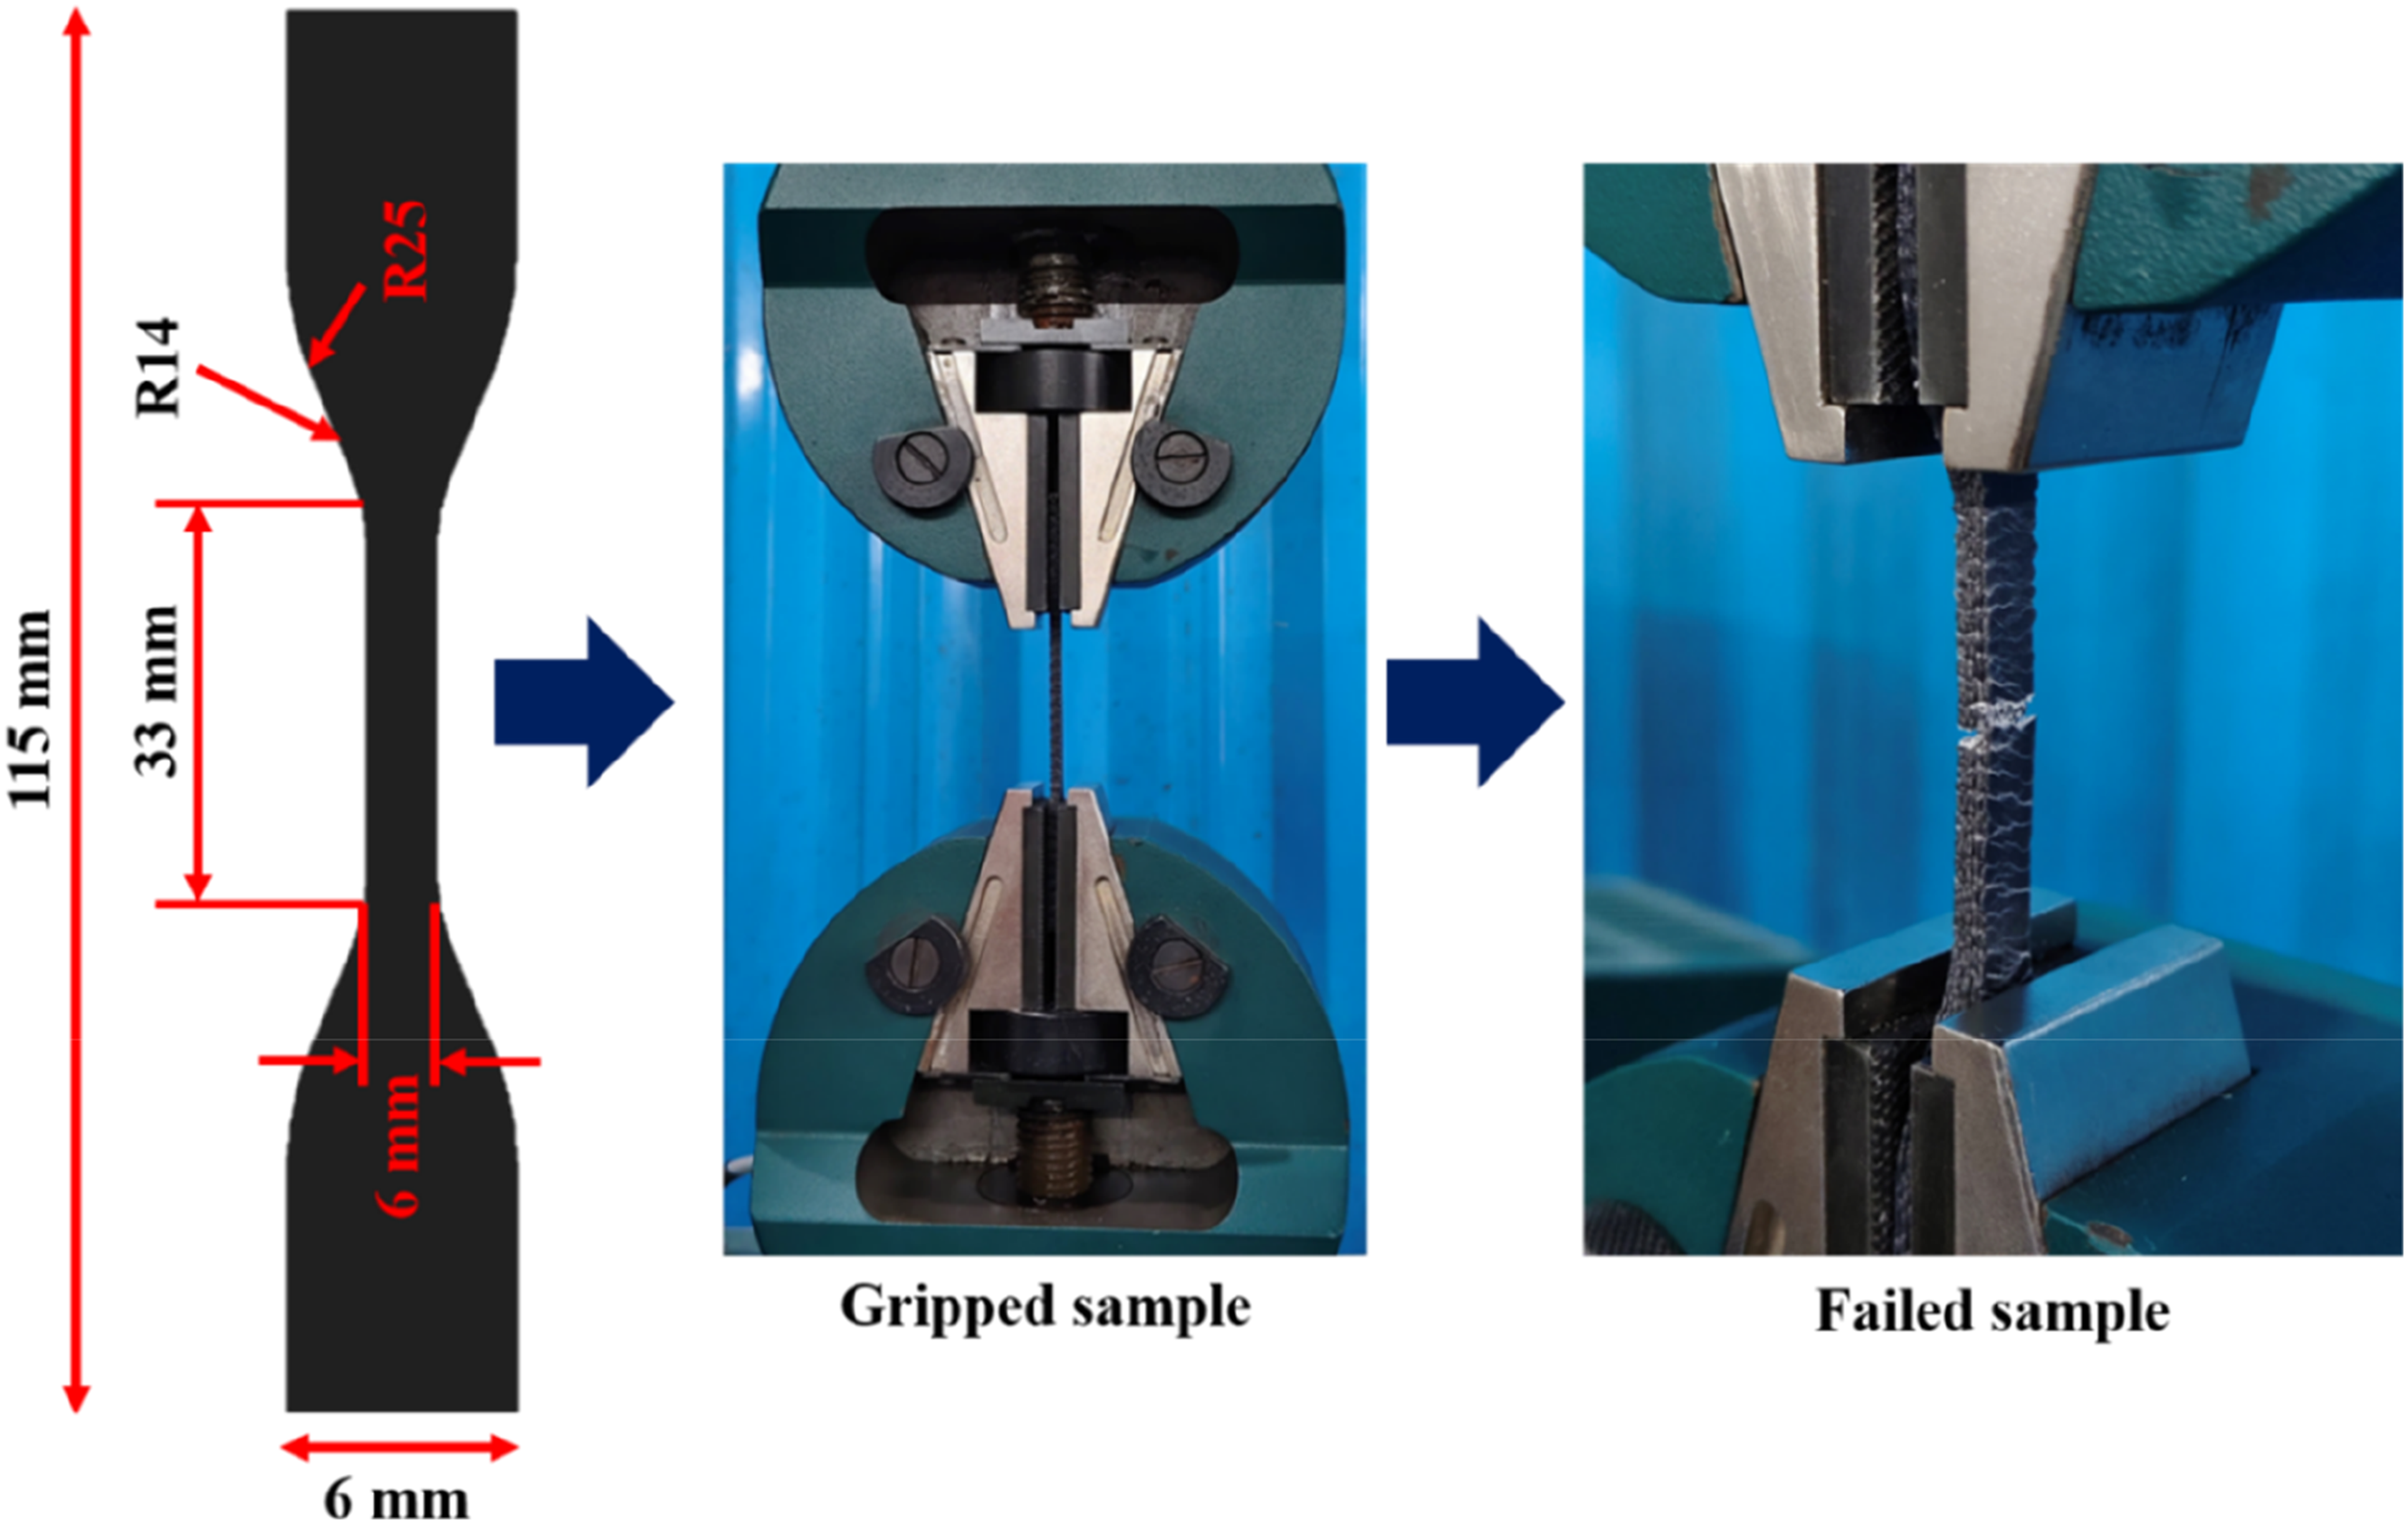
Optimization Technique
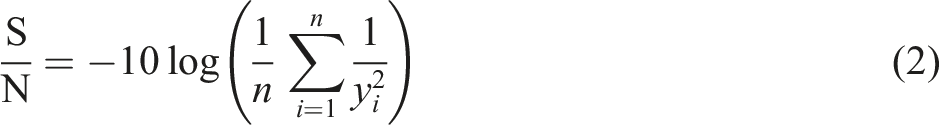
Taguchi’s approach’s key aim is to achieve high-quality products using optimized 3D printing parameters, not by increasing the cost. The goal is to choose settings that make the process less affected by changes in the environment or other factors while still improving quality. Taguchi’s method combines experimental work with the optimization of process parameters to get the best results. A key tool in this approach is the signal-to-noise (S/N) ratio, which helps evaluate the impact of different factors on quality. It compares the useful signal to the unwanted variation (noise) and is divided into three types: “lower is better,” “higher is better,” or “nominal is better.” The best setup is the one that gives the highest S/N ratio. The S/N ratio for characteristics where “lower is better” and “larger is better” is typically expressed in equations (1) and (2), respectively.
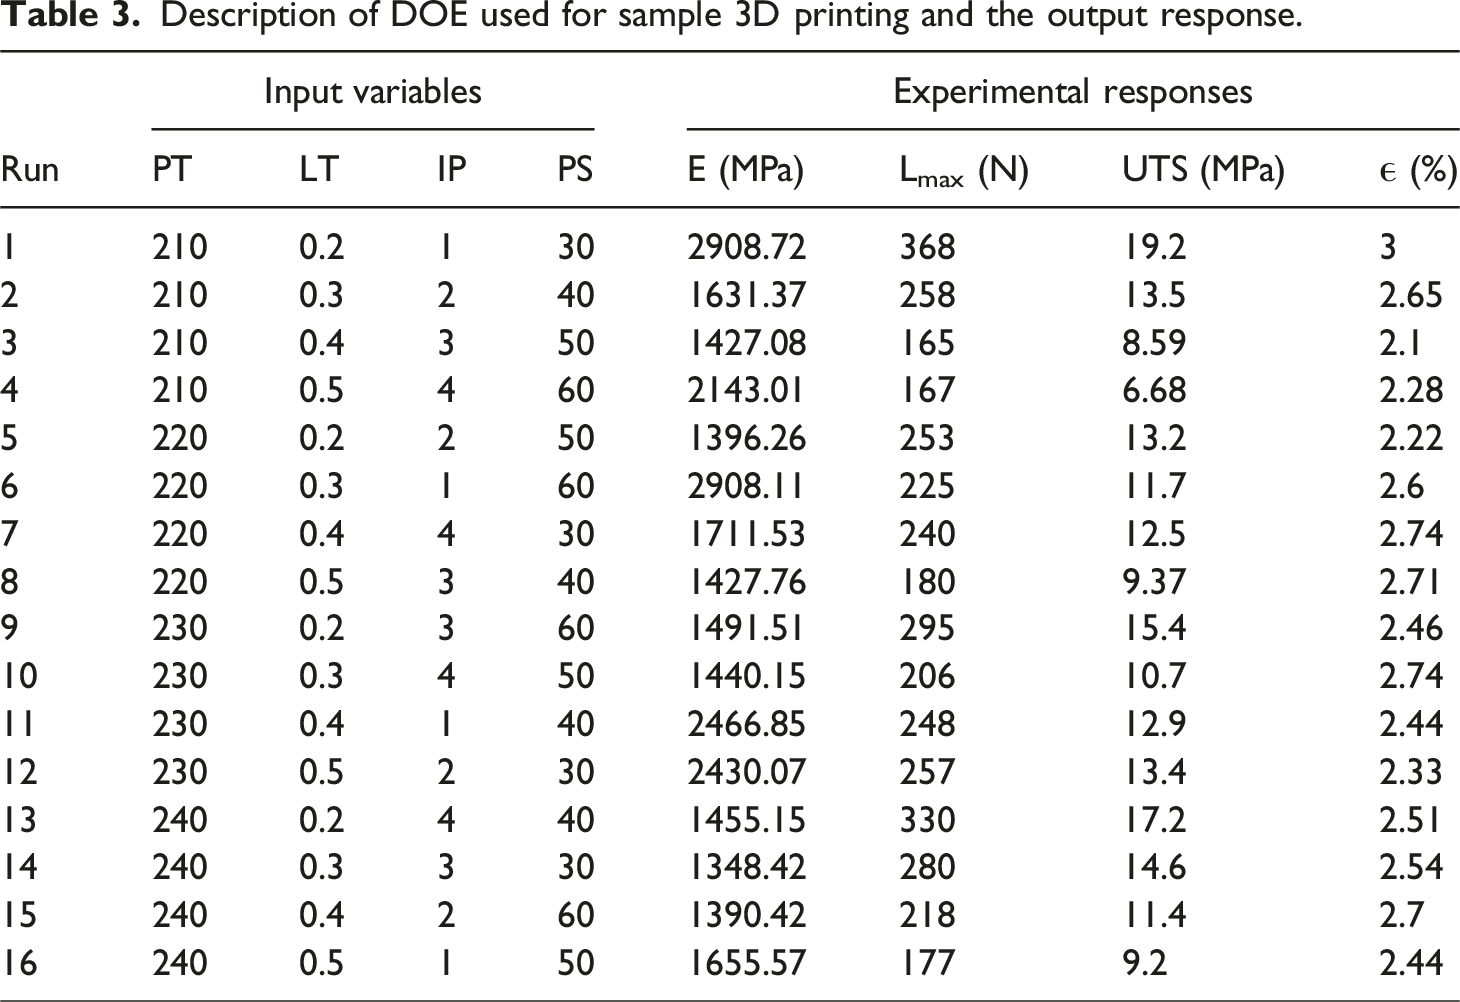
In this study, the experimental design uses an L16 orthogonal array, as shown in Table 2. Each set of settings was tested three times to measure average values of Young’s modulus (E), maximum tensile load (Lmax), ultimate tensile stress (UTS) and strain at maximum stress (∊), aiming for greater accuracy. Since the Taguchi method is common for single-objective optimization to convert the data into a single objective, Gray Relational Analysis (GRA) was used in the current research. In GRA, the multi-responses were normalized, the Gray relational coefficient (GRC) for each response was calculated, and then the Gray relational Grade was obtained (GRG). The obtained GRG acts as a single response which was further optimized using the Taguchi ANOVA technique.
Optical Microscopy
The failed tensile samples’ optical images were taken using a portable optical microscope. The Hi-view open-source software was used to analyze the images over a laptop, and scaling was done on the same. The microscopy was done to analyse the effect of FDM process parameters on the fracture behaviour of the composite.
Results and Discussion
Gray Relational Analysis
Description of DOE used for sample 3D printing and the output response.
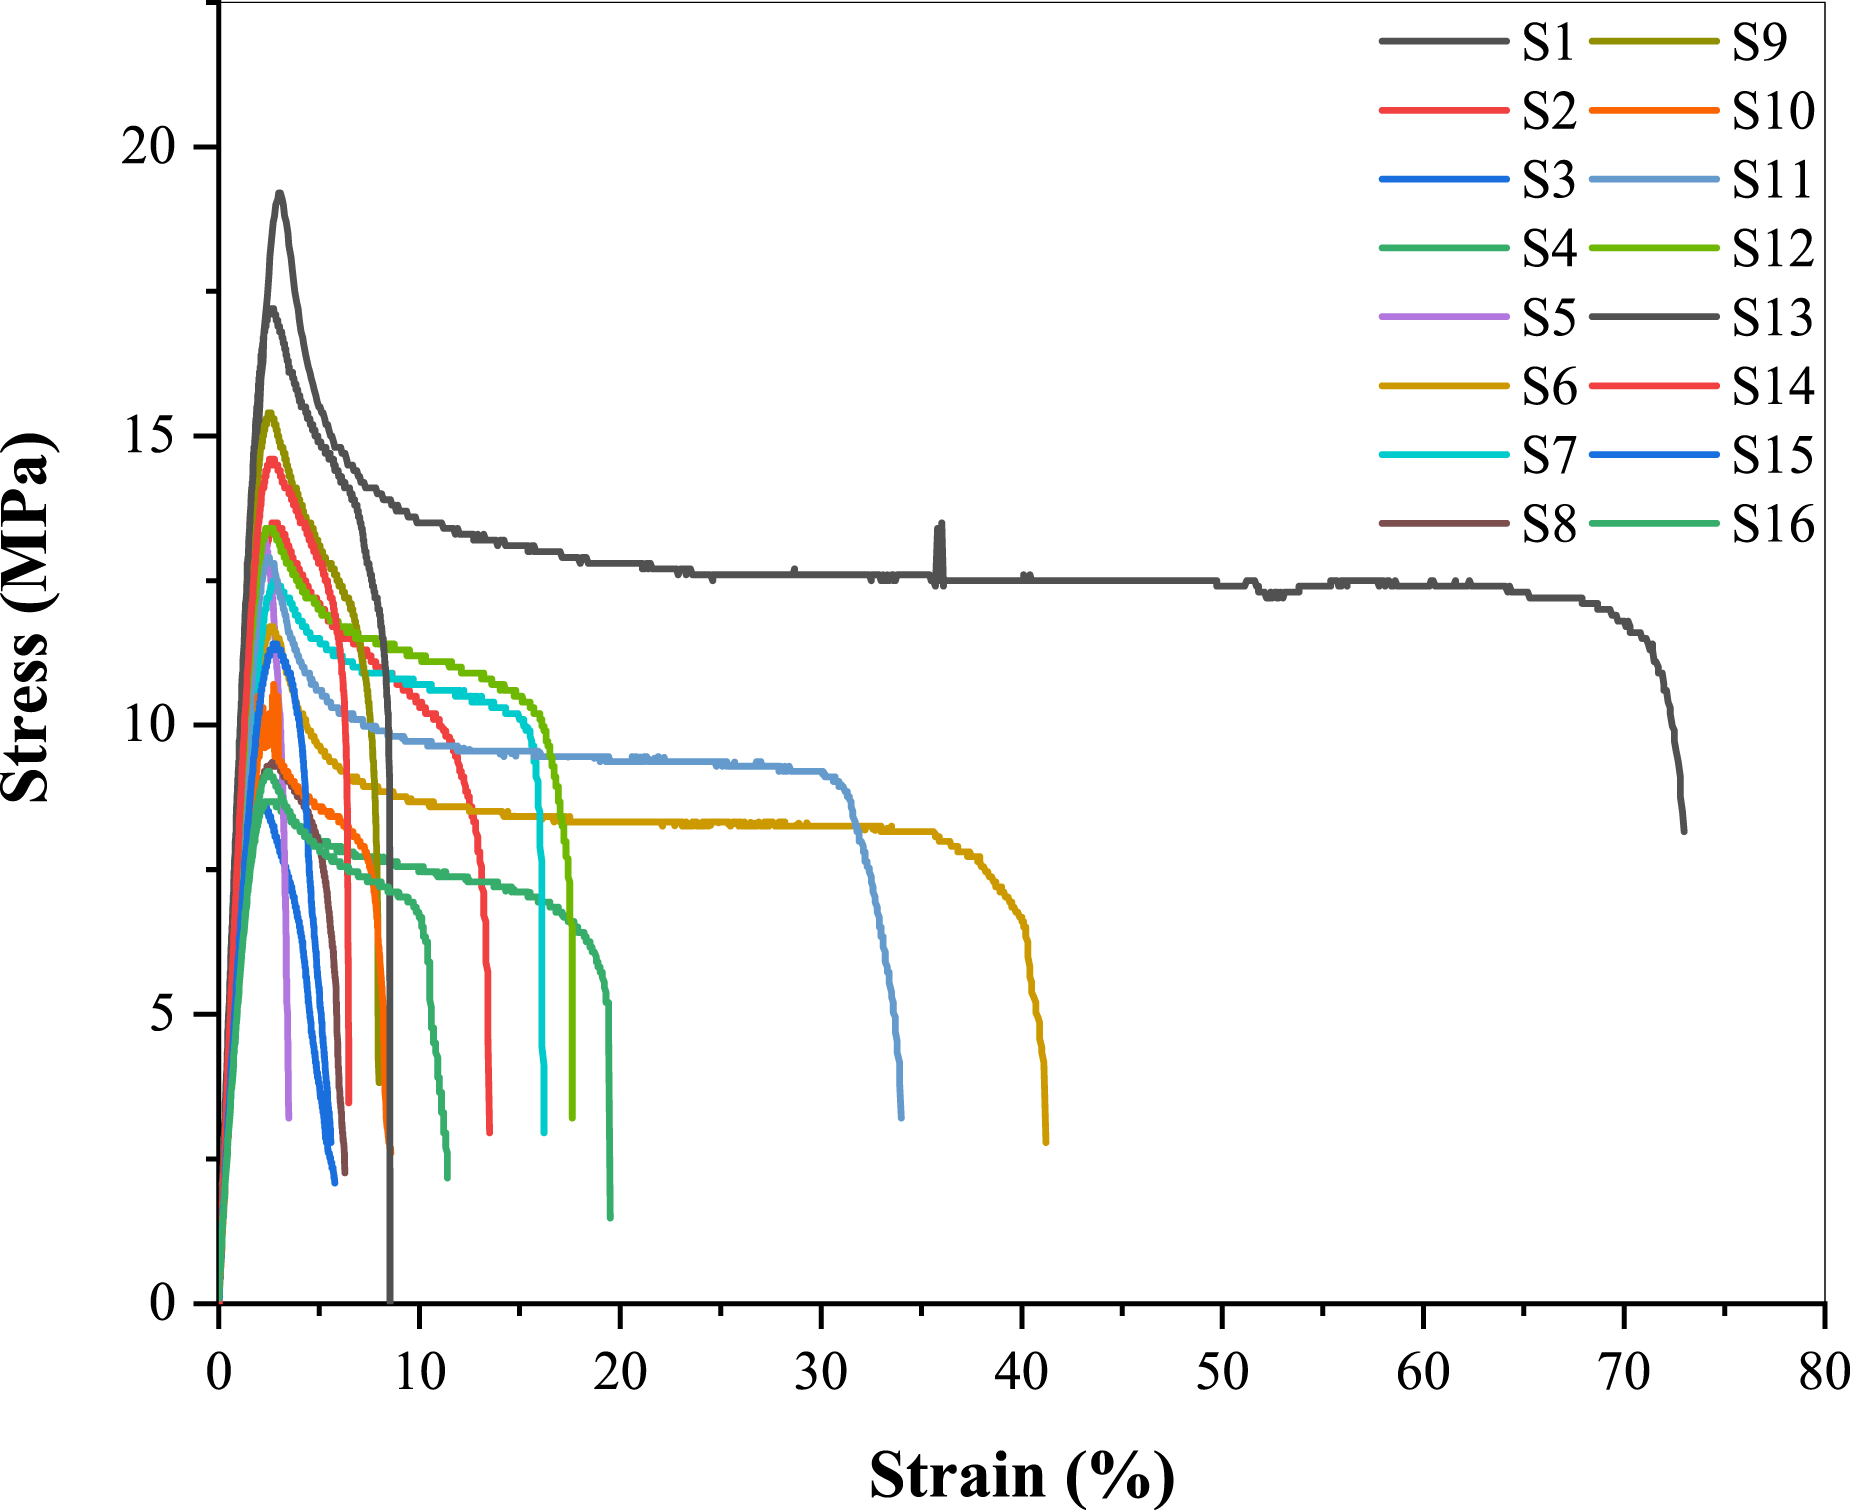
Tensile stress-strain curve of the 3D printed samples.
Data Pre-processing
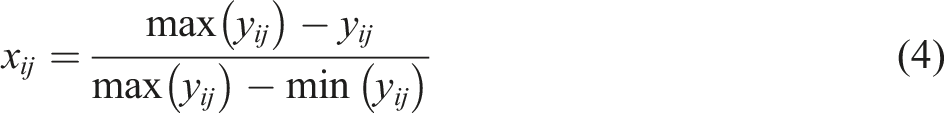
Data pre-processing involves converting the original sequence into a comparable sequence through normalization. The numerical response data were normalized to a range between zero and one using equations (3) and (4), where the respective equations were used: “higher is better” and “smaller is better” conditions.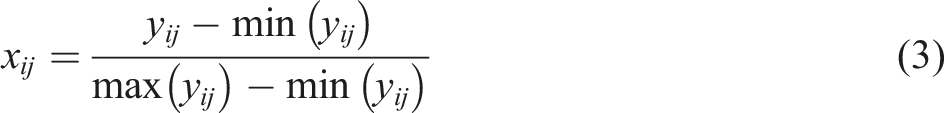
To identify the best performance for a particular response i, the processed values xij were compared after data preprocessing. If xij is equal to or closer to 1 compared to other experiment values, it is considered the best for that response. A reference sequence X0 was established, denoted as (x01, x02, x03, ……, x0j, ……, x0n) where, x0j represents the reference value for the jth response. The goal is to identify the experiment with a comparability sequence closest to the reference sequence (1, 1, ...., 1, ...., 1). 43
Furthermore, the deviation sequence was determined by calculating the absolute difference between the normalized value of each experimental result and the reference value. This calculation was performed using equation (5).
Furthermore, gray relational coefficient (GRC) is determined to know the closeness of xij with xoj. The larger the GRC the closer xij and xoj. The GRC is evaluated using equation (6).
After computing the Gray Relational Coefficient (GRC), the Gray Relational Grade (GRG) is calculated using equation (7), which represents the weighted sum of the GRCs. The GRG measures how closely the comparability sequence matches the reference sequence, indicating their degree of similarity. A higher GRG value means that the experiment’s comparability sequence is more aligned with the reference sequence. Therefore, the experiment with the highest GRG is considered the optimal choice.
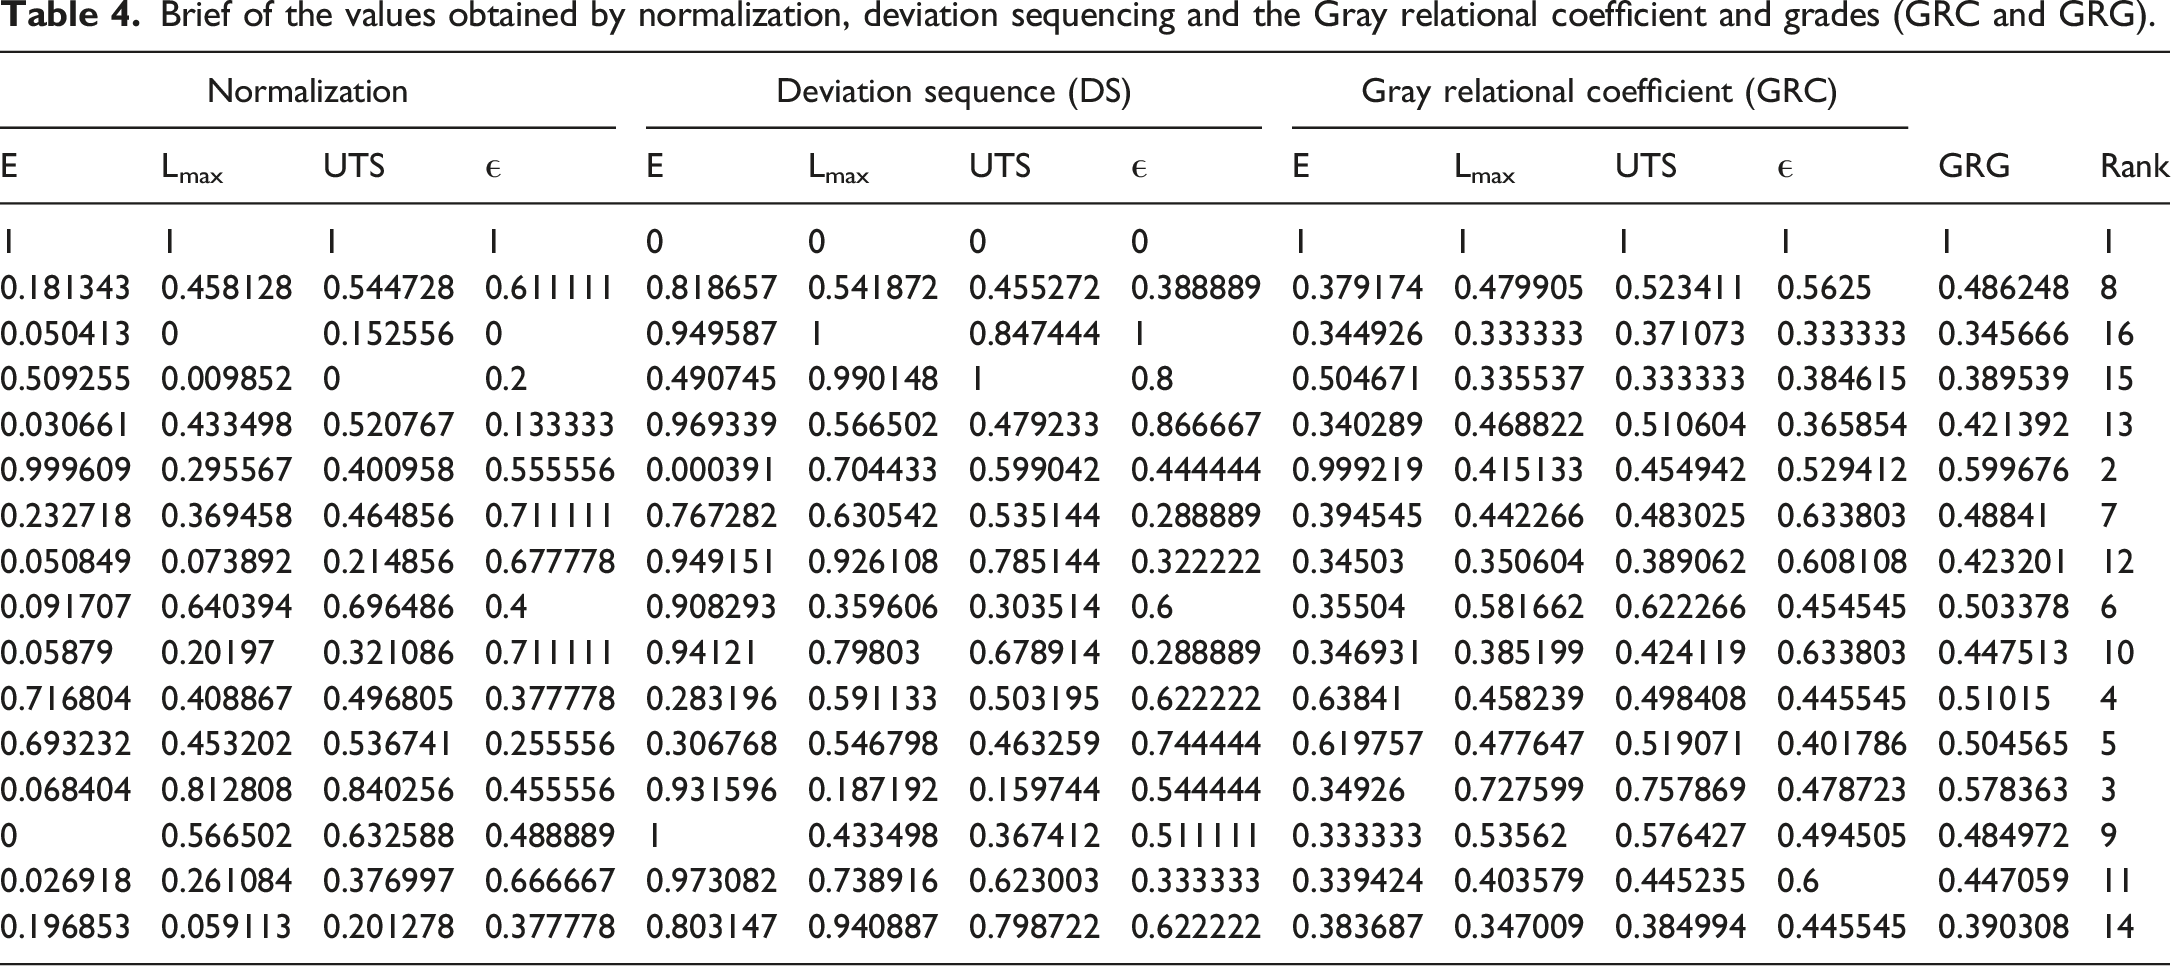
Brief of the values obtained by normalization, deviation sequencing and the Gray relational coefficient and grades (GRC and GRG).
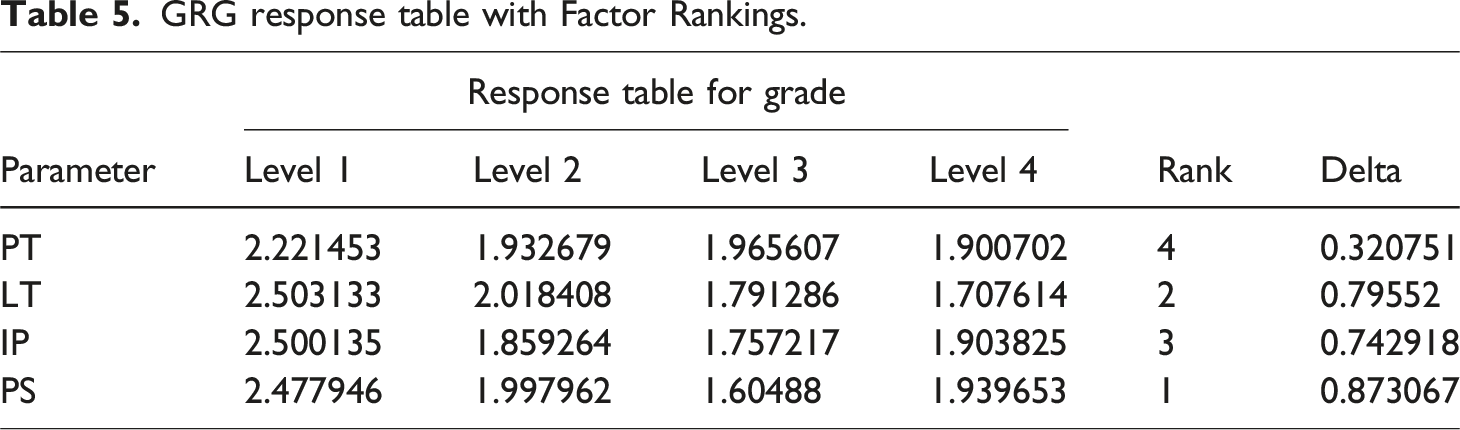
GRG response table with Factor Rankings.
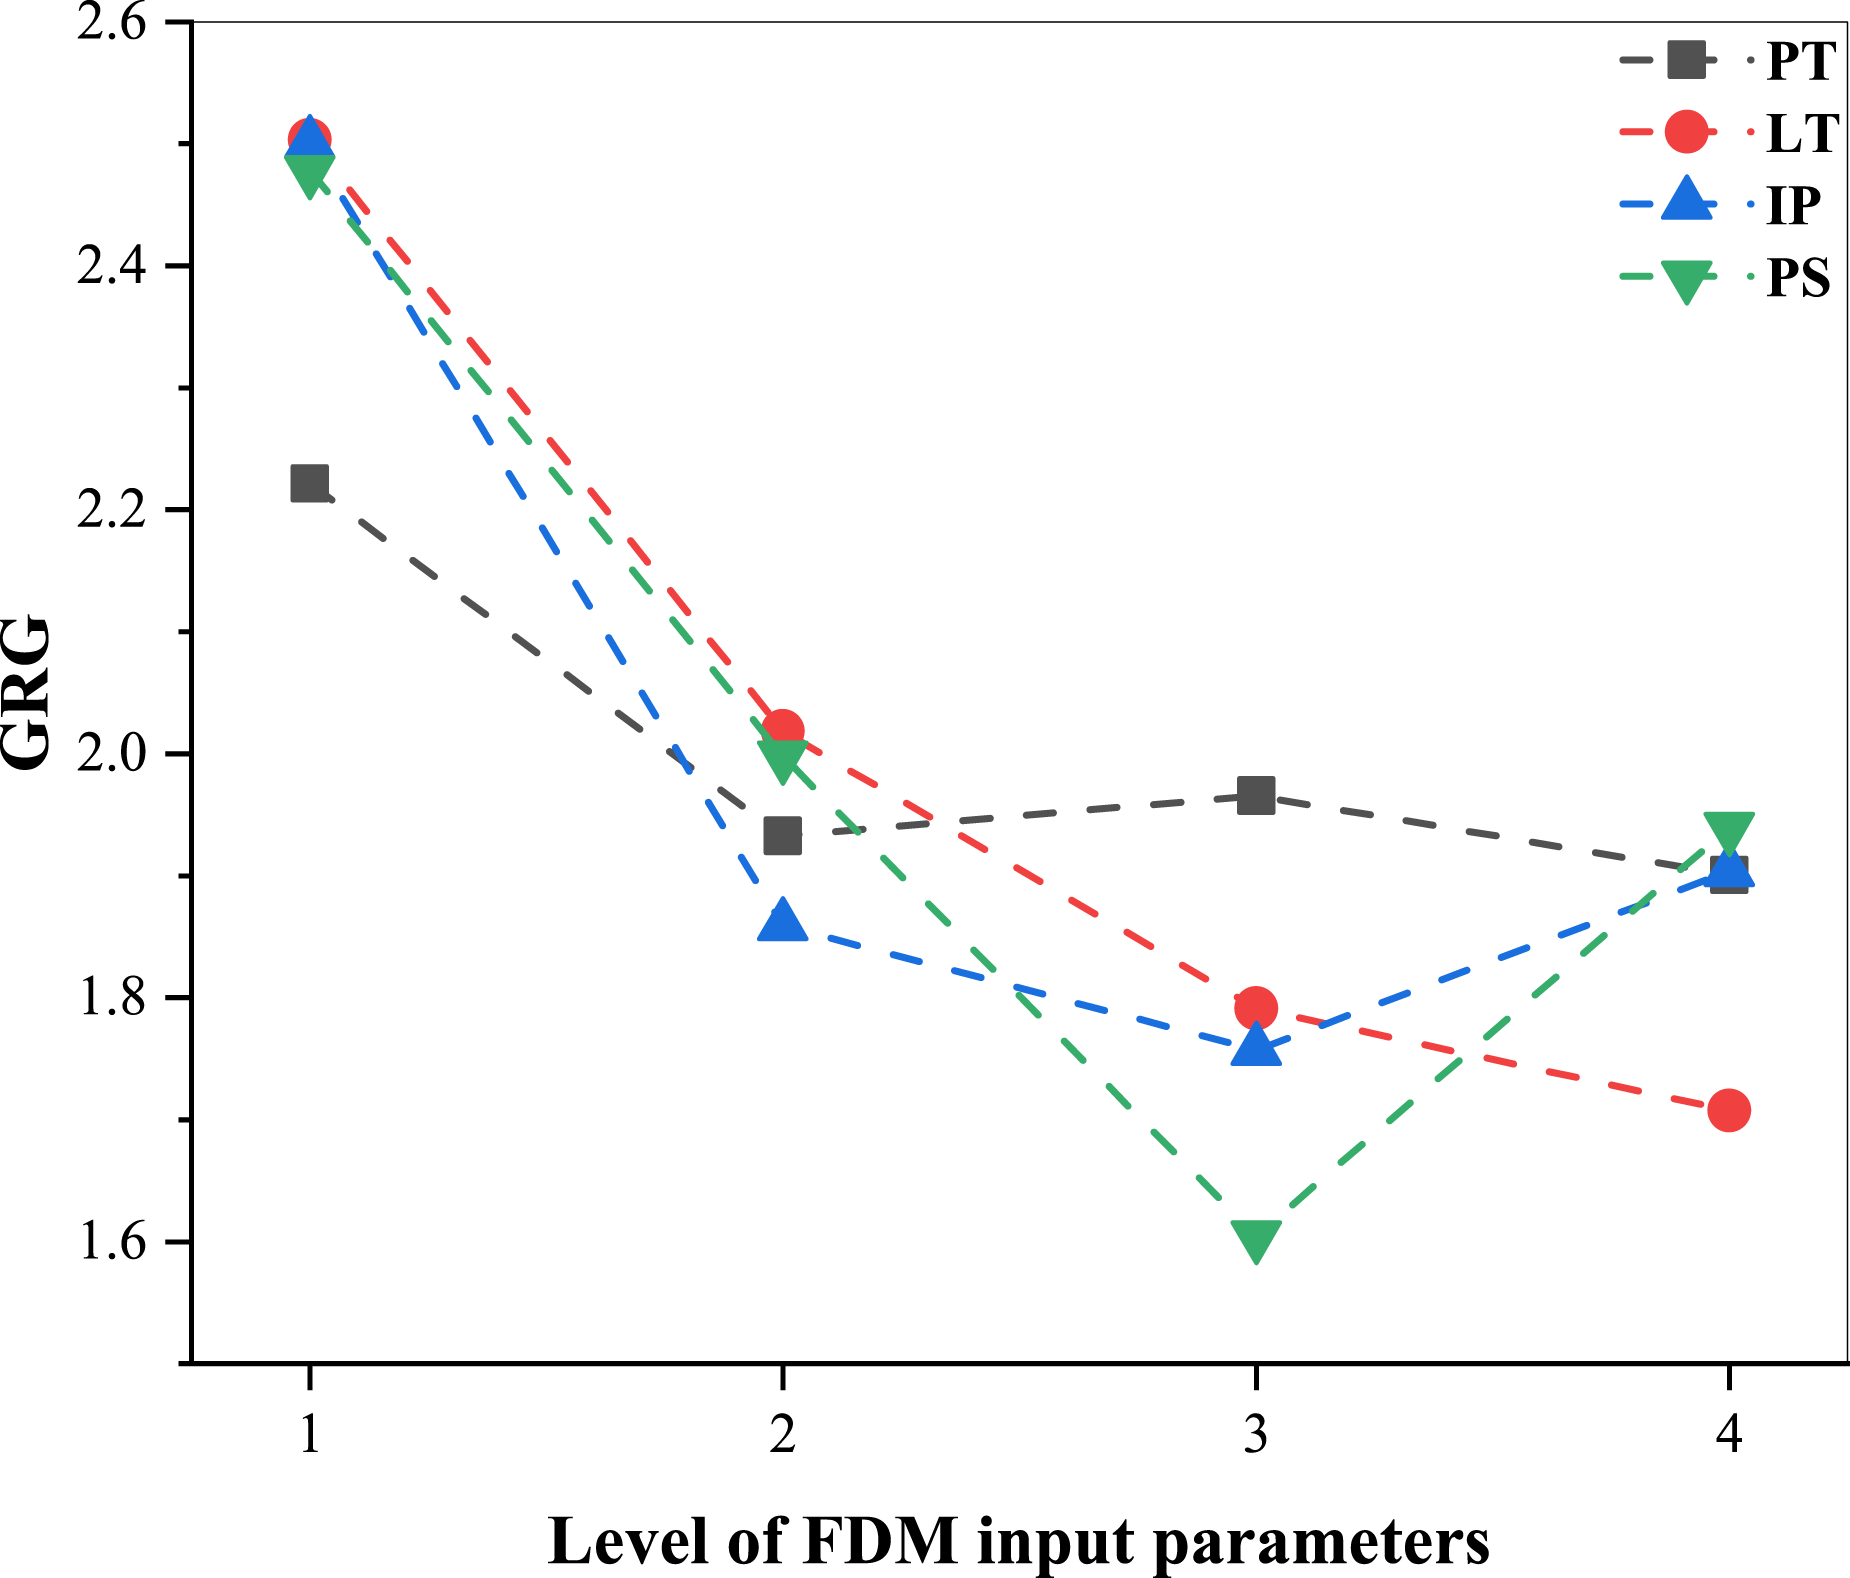
Main effects graph for GRG.
Taguchi Method for ANOVA Analysis of Gray Relational Grade
Analysis to variance for S/N ratios.
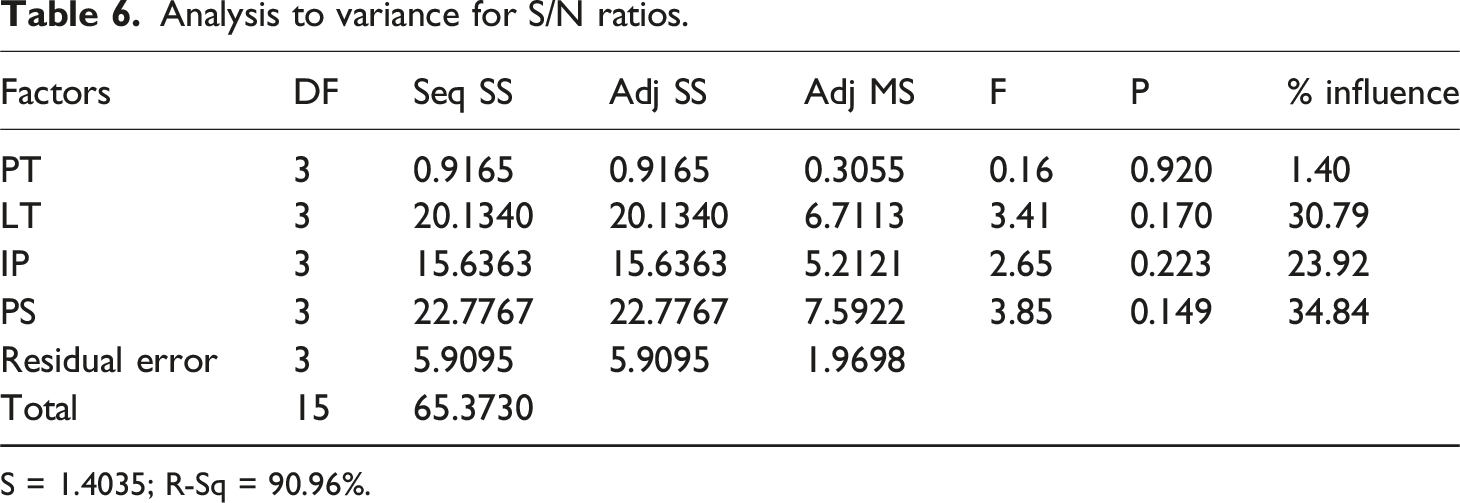
S = 1.4035; R-Sq = 90.96%.
Response table for signal-to-noise ratios.
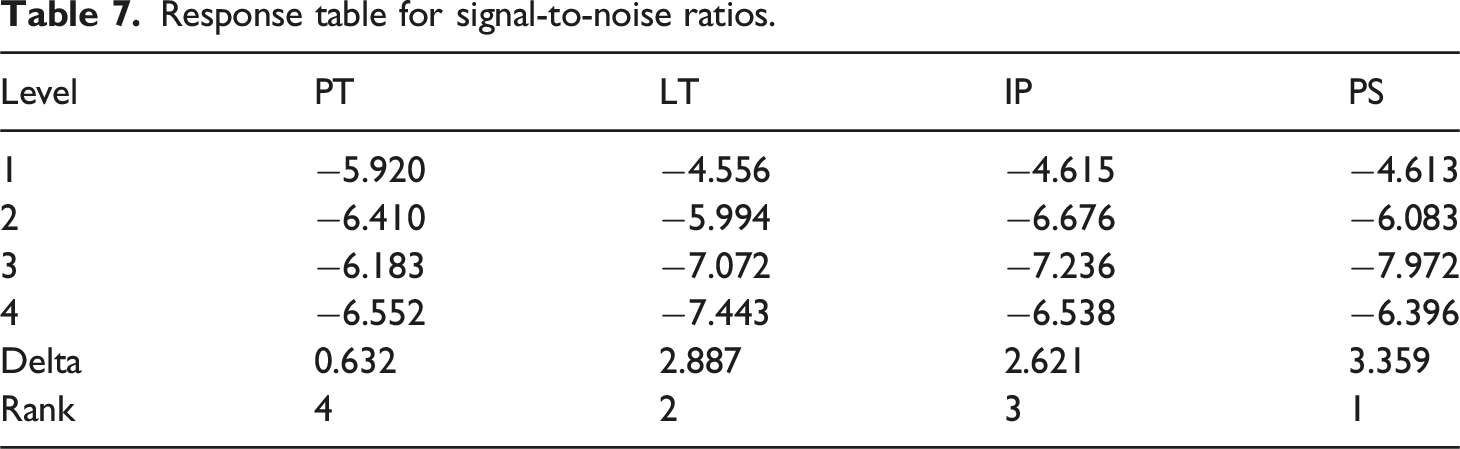
Table 7 illustrates the Signal-to-Noise (S/N) ratio analysis for four critical input parameters in the FDM process. The S/N ratios, evaluated at four levels for each parameter, serve as indicators of process stability, with higher values reflecting enhanced performance by minimizing the effects of variation (noise). The delta values, representing the range between the highest and lowest S/N ratios for each parameter, quantify the influence of each factor on process outcomes. Print speed (PS) exhibits the largest Delta (3.359), signifying its dominant effect on process performance and thus ranked 1st insignificance. Layer thickness (LT) and Infill pattern (IP) show moderate impact, ranked 2nd and 3rd with Deltas of 2.887 and 2.621, respectively. Printing Temperature (PT), with the smallest delta (0.632), has the least influence, ranked 4th, indicating that it contributes minimally to performance variation within the evaluated ranges.
The main effects plot for signal-to-noise (S/N) ratios shown in Figure 5 provides critical insights into the influence of key FDM process parameters on the physical properties of 3D printed PLA/CF composite parts. The mean S/N ratios for printing temperature are approximately −6.5 at 210°C, −6.4 at 220°C, and −6.6 at 240°C, indicating a slight decrease in tensile strength with increasing temperature. Higher temperatures can lead to over-extrusion, causing defects in the material structure, which negatively affects the tensile strength. The layer thickness exhibits a significant decline in S/N ratios, from −6.1 at 0.2 mm to −7.8 at 0.4 mm, suggesting that larger layer heights compromise tensile strength due to inadequate bonding between layers and increased porosity. Moreover, the infill pattern shows varying S/N ratios, with patterns yielding approximately −7.1, −7.4, −7.8, and −7.3, respectively. This variation is due to differences in material distribution and structural integrity among patterns, affecting overall strength. Print speed displays a marked decrease in mean S/N ratios, dropping from −6.3 at 30 mm/s to −7.6 at 60 mm/s, indicating that increased speeds can lead to incomplete layer adhesion and insufficient cooling time, resulting in weakened structures. Main effects plot for signal-to-noise (S/N) ratios.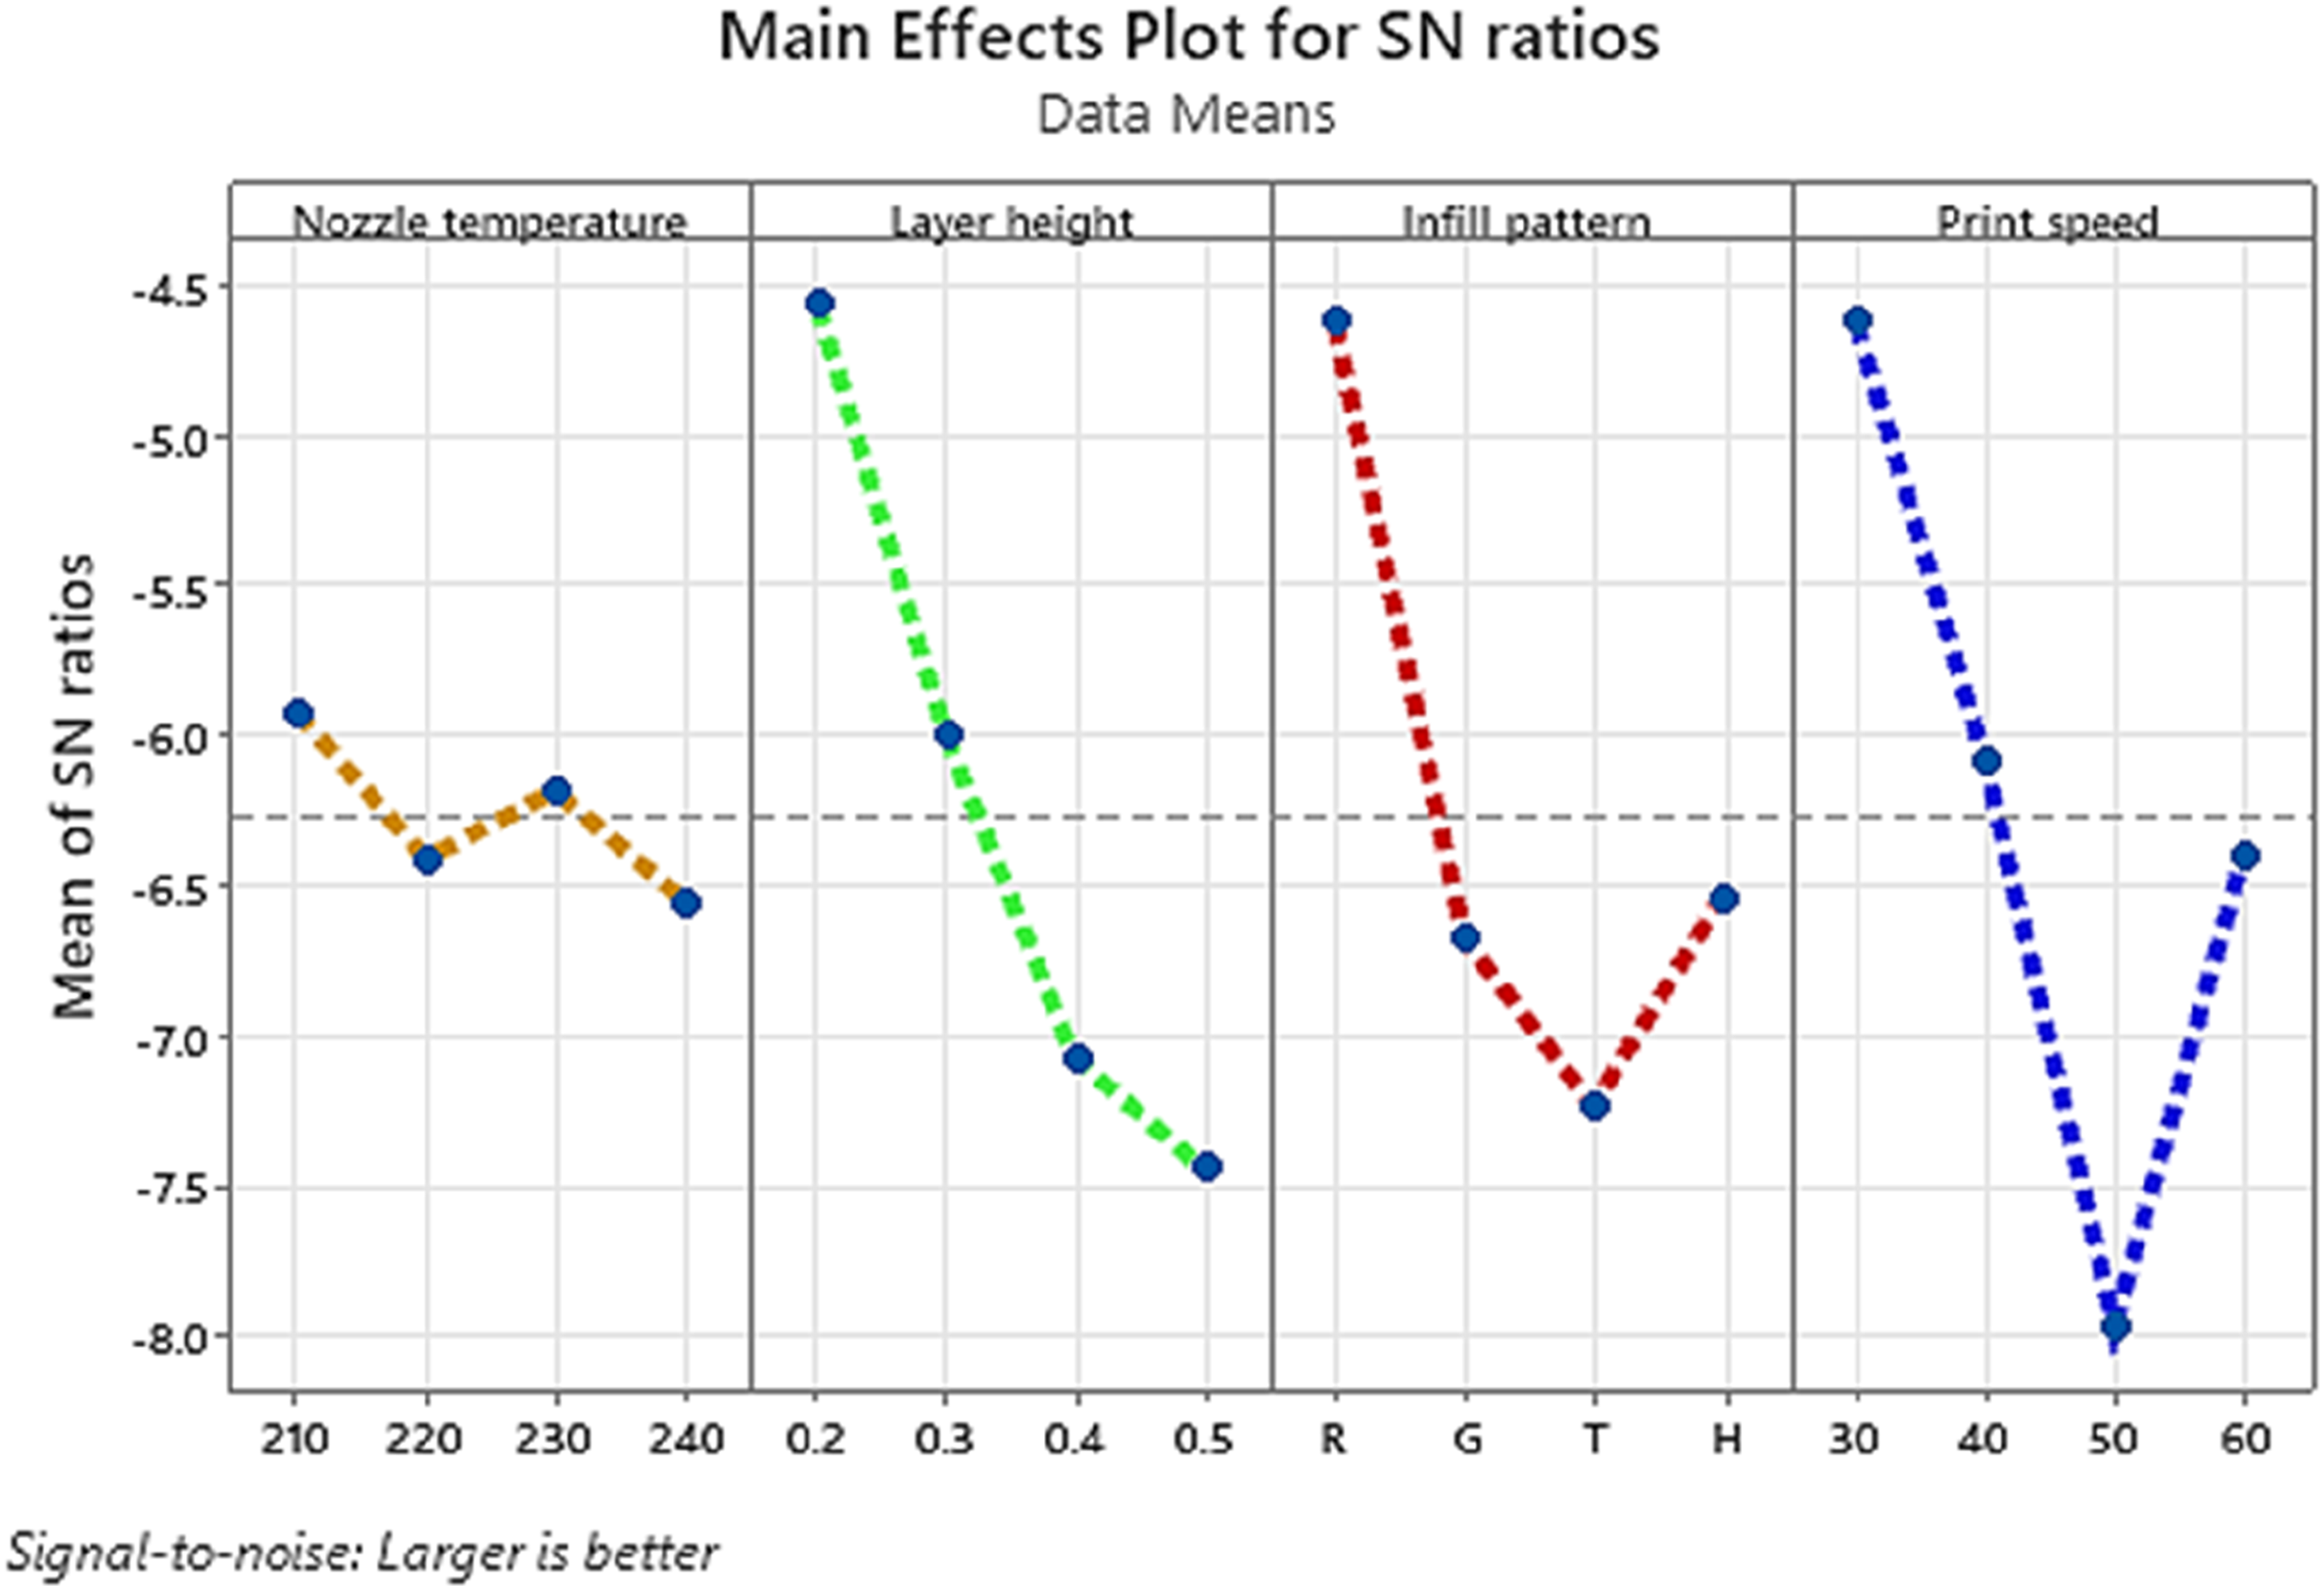
The residual plots for the signal-to-noise (S/N) ratios shown in Figure 6 provide essential diagnostic information regarding the adequacy of the fitted model used to analyze the effects of FDF process parameters on the tensile properties of 3D printed PLA/CF composite parts. The “Normal Probability Plot” indicates that residuals are normally distributed as the points on the plot follow a straight line with no significant deviation seen. However, minor deviations were observed at the extreme end, indicating slight non-normality at the tails, but these minor deviations are not significant enough to affect model validity. In residuals versus fitted values plots, residuals appeared as random scatterings at zero lines with no major discernible pattern suggesting constant residual variance. The histogram showed a balanced and symmetric residual distribution, thereby supporting the normality assumption. It also indicates an even distribution of residuals around the mean (zero), as no extreme skewness or outliers can be noticed in the graph. At last, the residual versus observation order plots indicate the random fluctuation of residuals without any trends or cycles. This suggests that all the residuals are independent over the experimental order, and there are no lurking (secret) variables present that influence the experimental runs conducted under stable conditions. Residual plots for the signal-to-noise (S/N) ratios.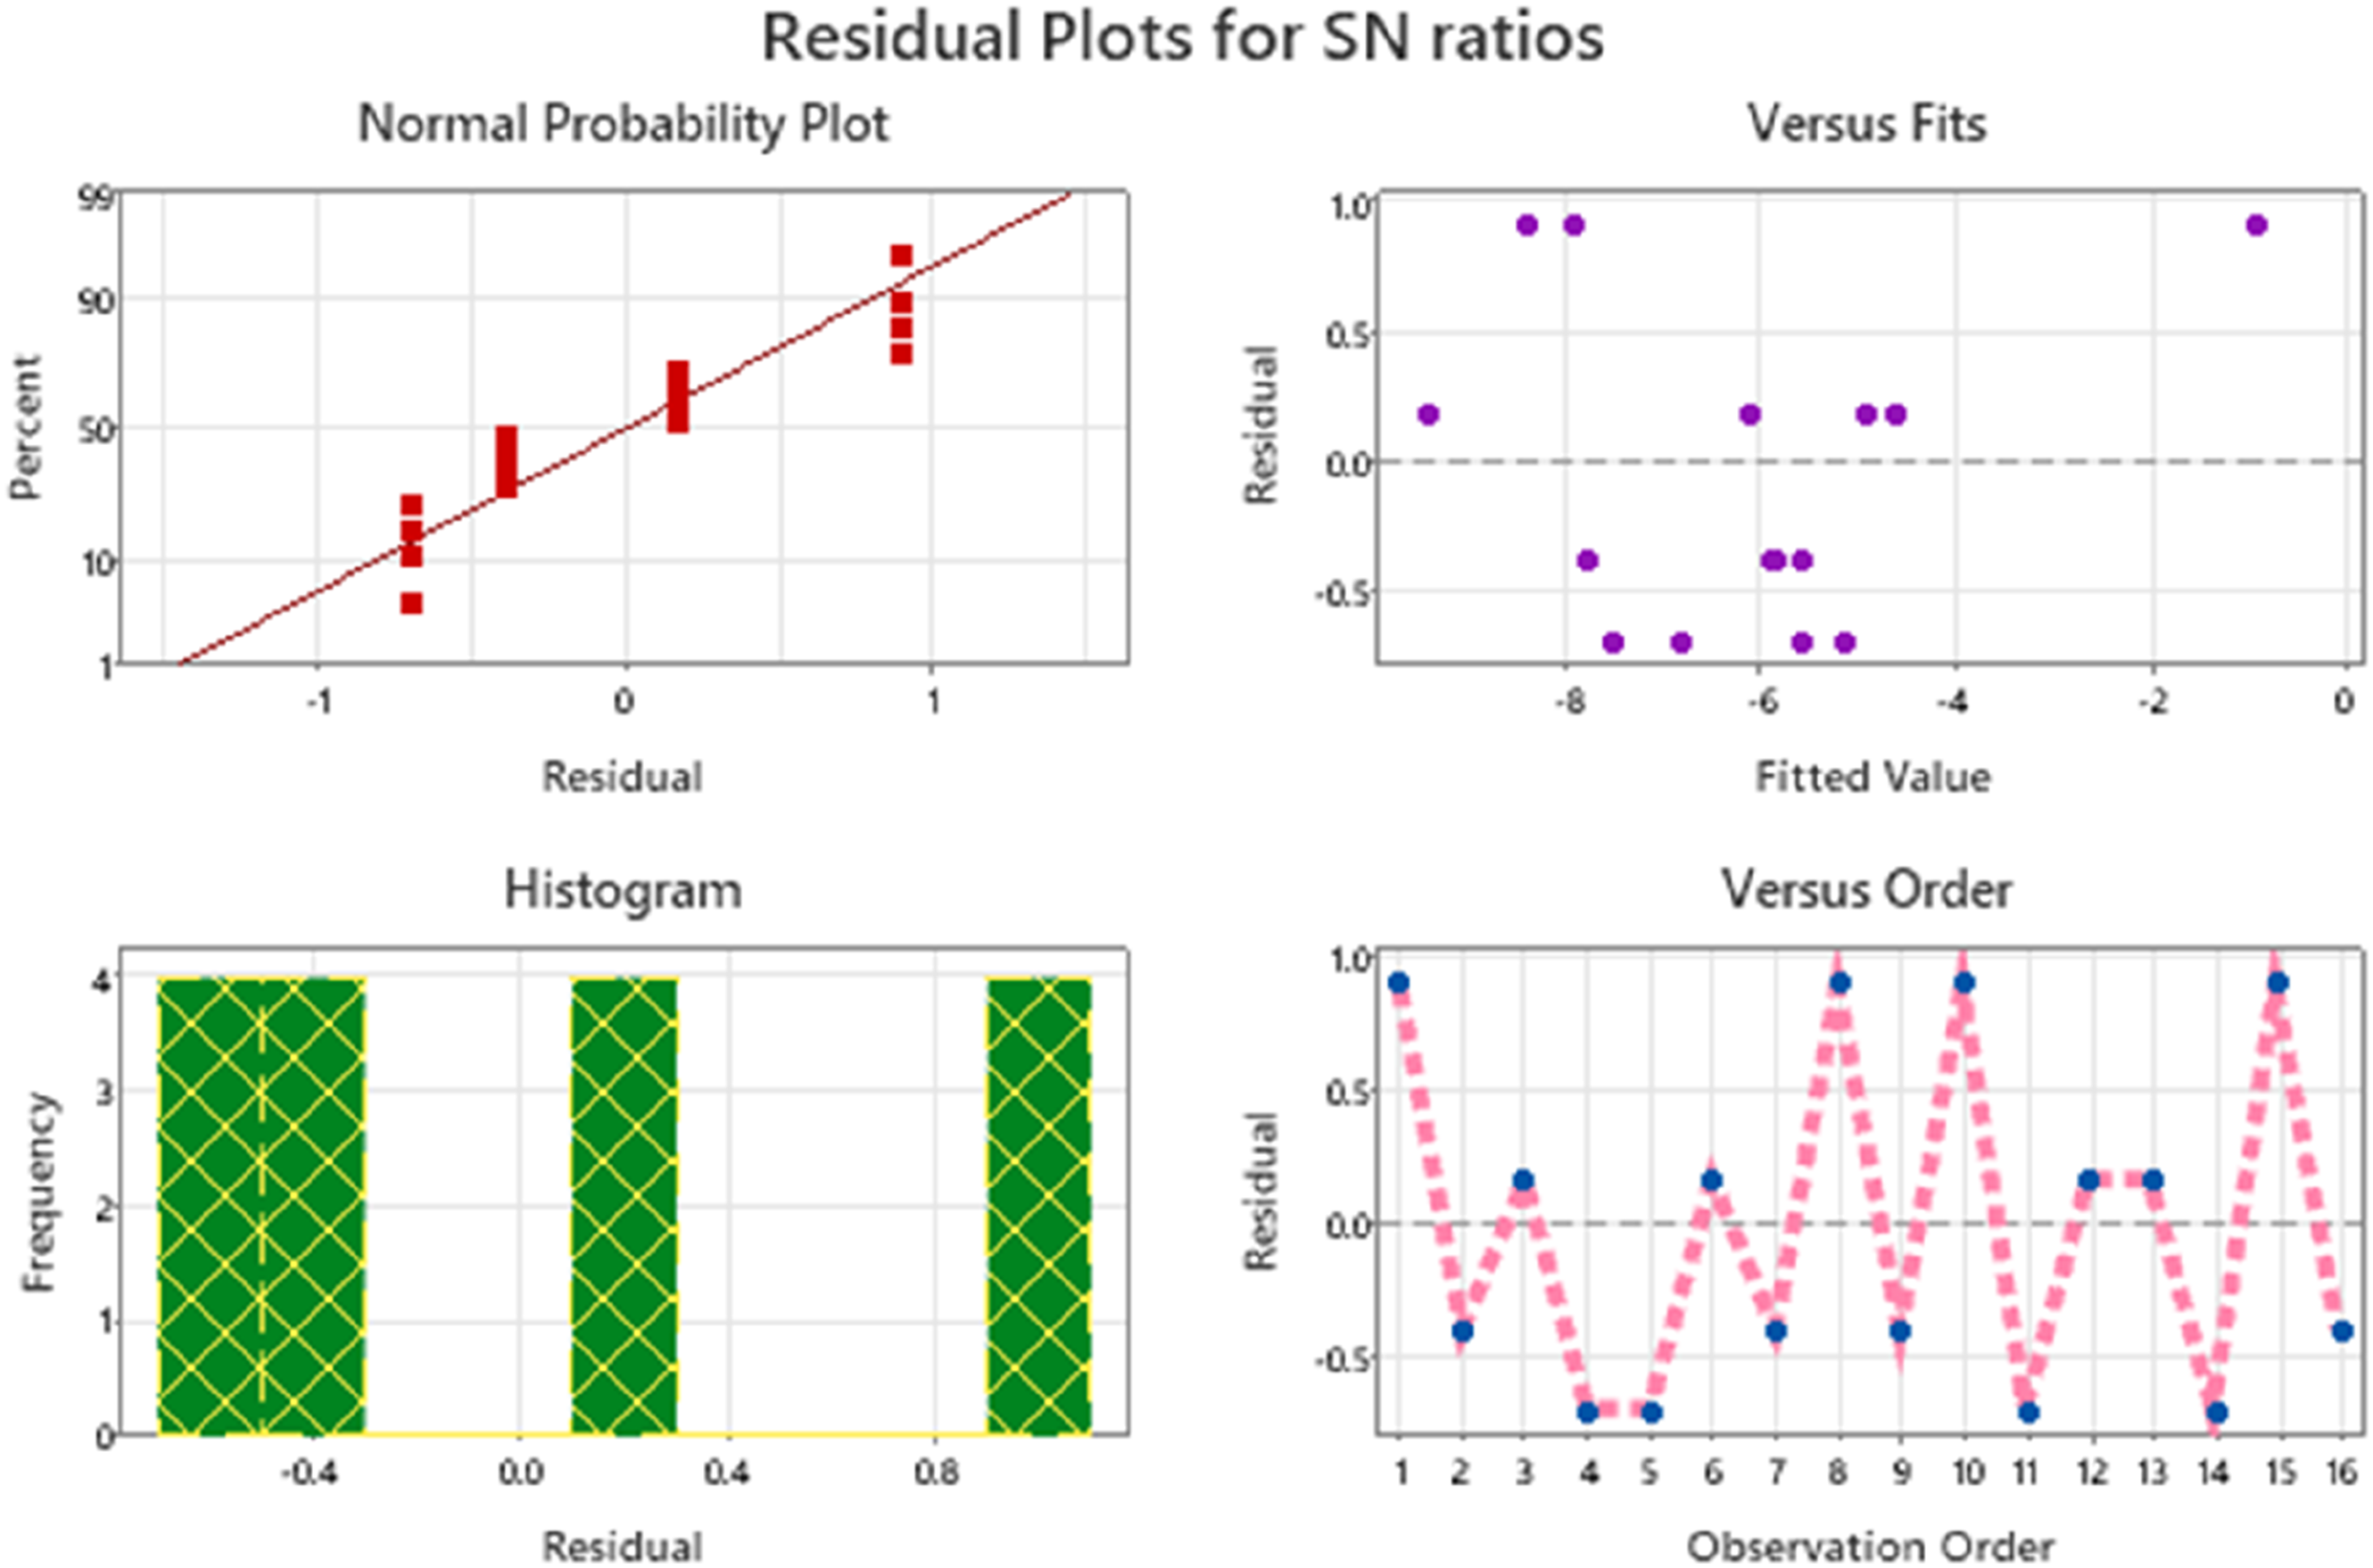
Fractured Surface Morphology
Figure 7 illustrates the optical images of the fractured surfaces of 3D printed PLA/CF composite developed at a unique set of FDM parameters. The images provide evidence and brief information about the influence of varying process parameters on the composite’s microstructural properties and failure behavior. Since CF is randomly oriented in the composite, therefore, its interactions with the PLA matrix are significantly dependent on dispersion quality, fibre alignment and interfacial adhesion achieved during 3D printing. Optical images of the fractured area of 3D printed PLA/CF composite samples fabricated at varying FDM process parameters.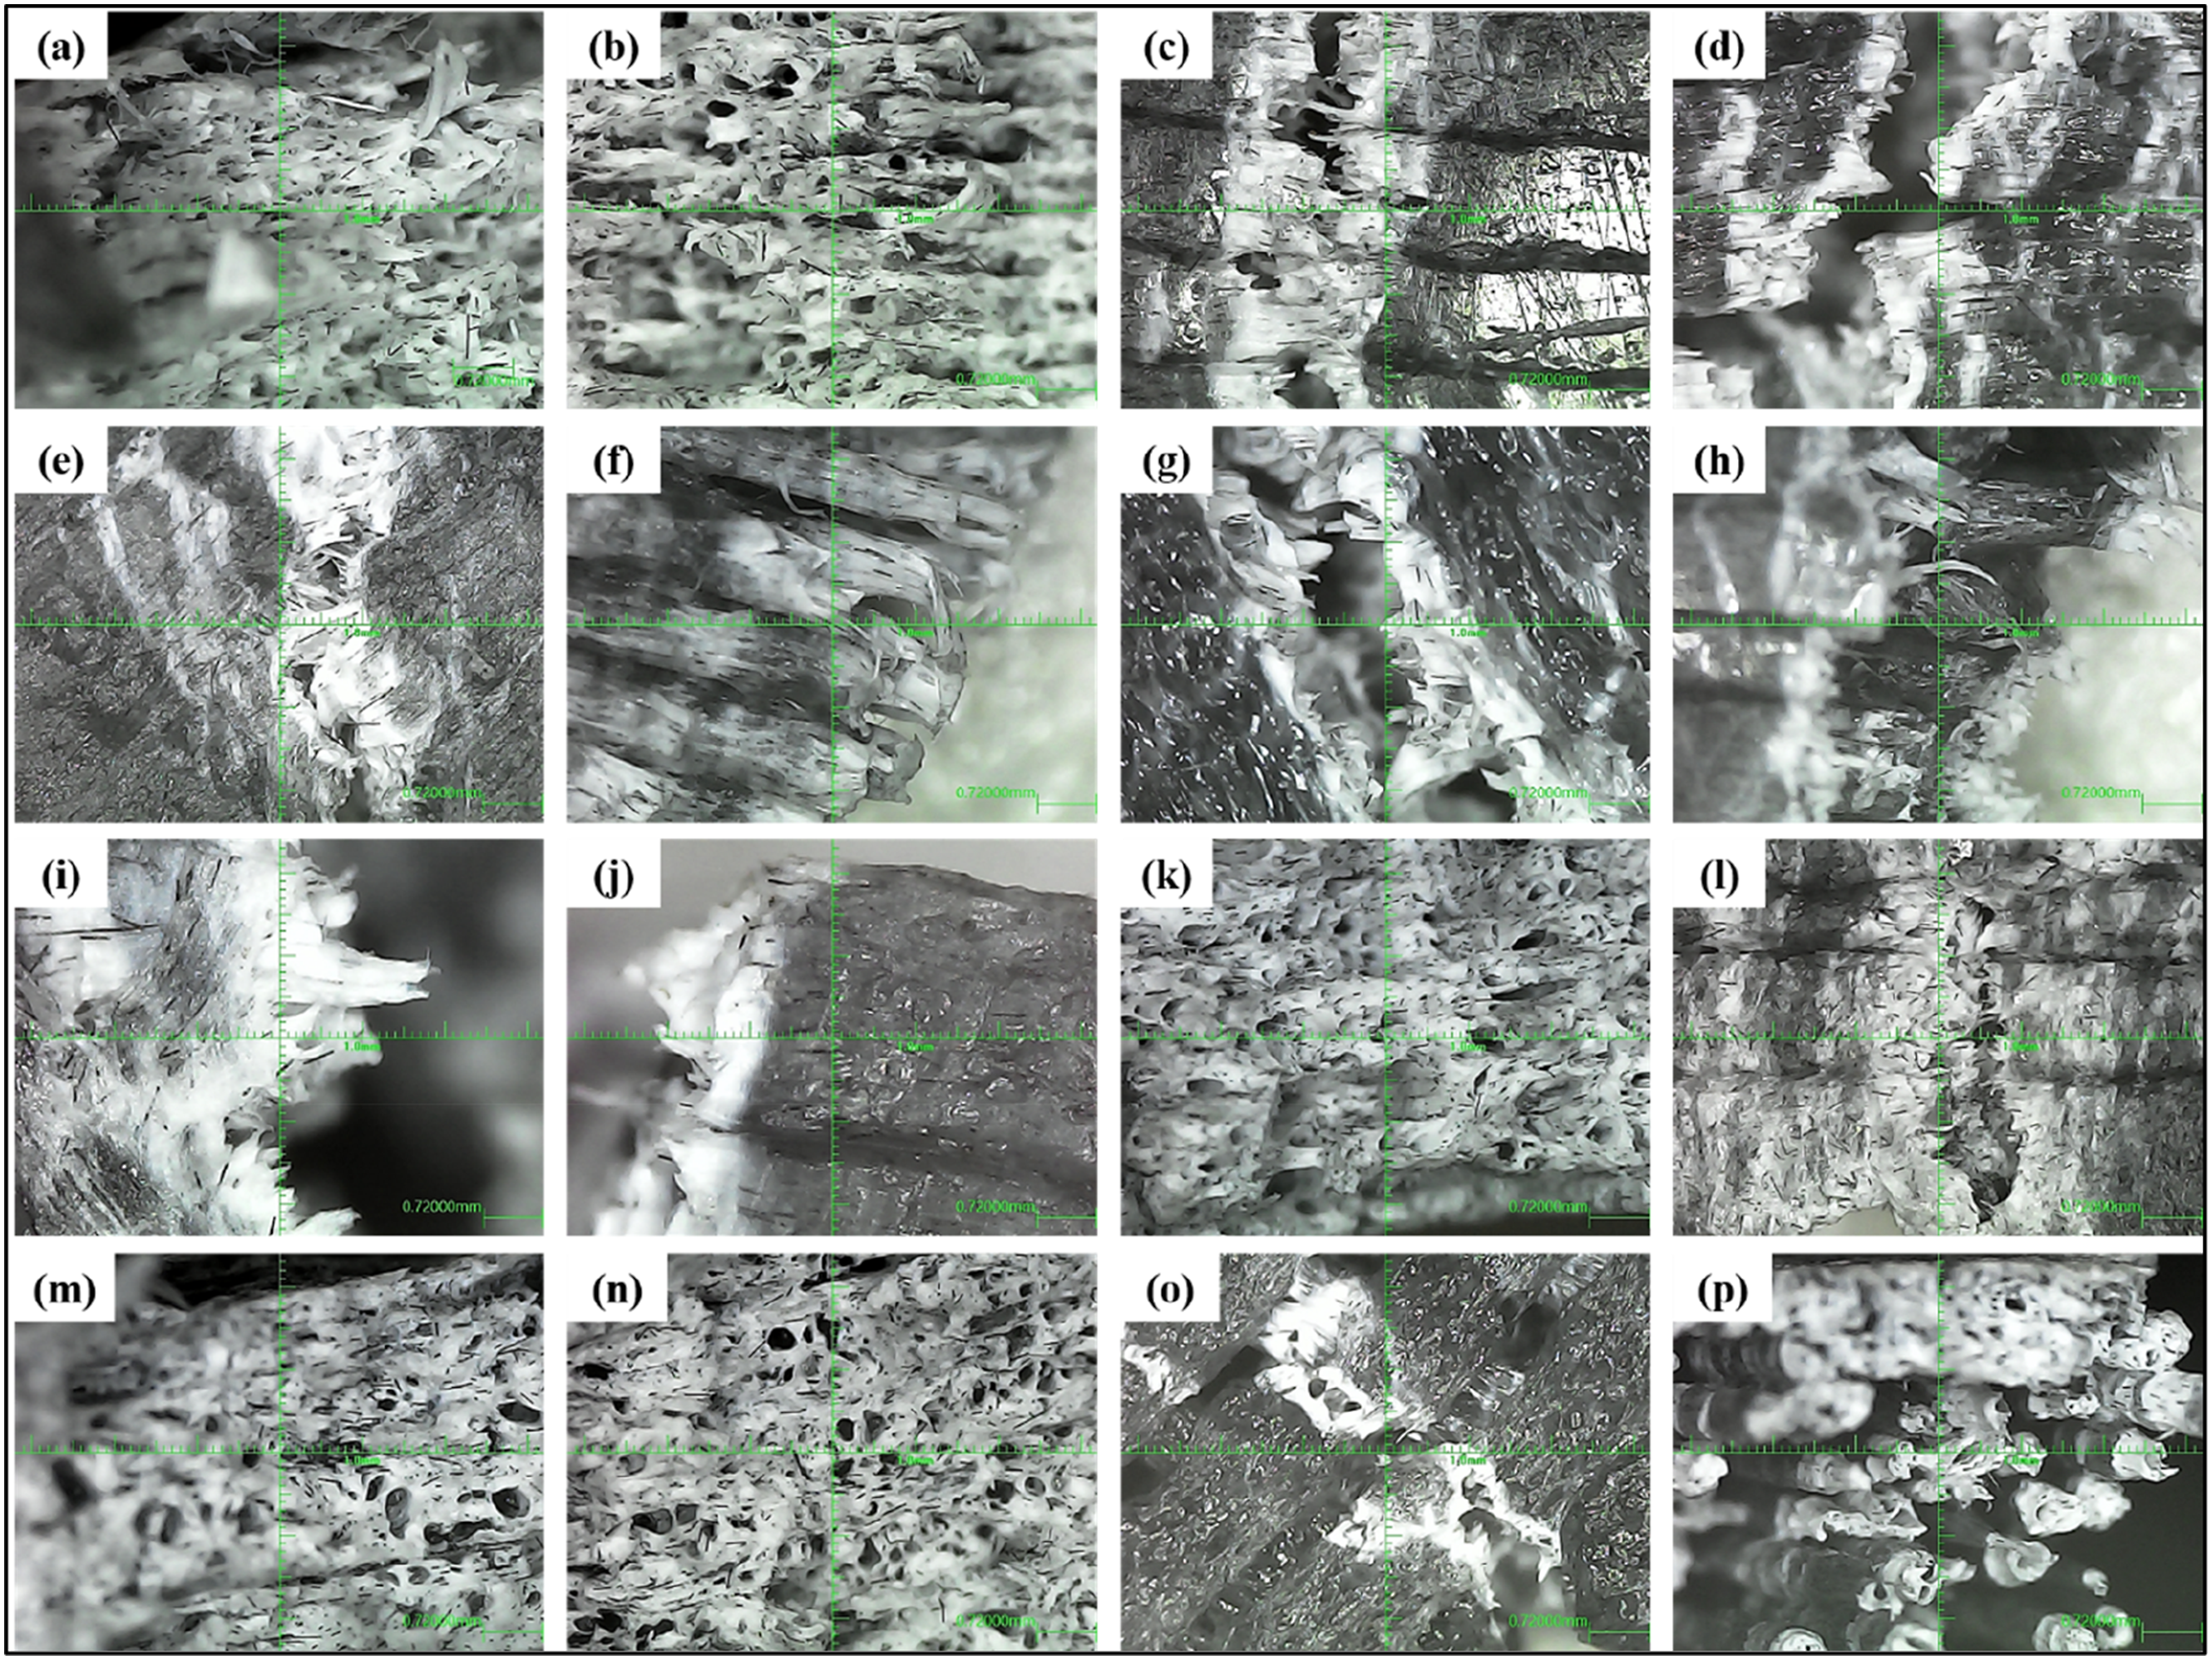
Figure 7(a) and 6(d) represents relatively smooth topography with limited fibre protrusion and fewer voids, which indicates strong interfacial PLA-CF adhesion. Moreover, minimal fibre pull-out with cohesive matrix fracture can be seen due to uniform layer bonding and adequate fusion between the inter-layer. The uniform layer bonding and fusion possibly resulted from the optimal temperature setting with lower print speed. This type of fracture indicates efficient stress transfer from PLA matrix to CF fibres. However, Figure 7(e) and 6(g) showed a significant amount of fibre pull-out and layer debonding. This may be due to issues of high print speed which has caused premature solidification and poor wetting of CF fibres by PLA matrix. This type of failure reduces the ability of CF to reinforce the matrix and leads to lesser load-bearing capacity and decreased tensile strength. Figure 7(h) reveals matrix shearing combined with CF pullout, indicating poor interfacial strength and brittle failure. Figure 7(j) and 6(k) exhibit distinct layered fractures with visible gaps, indicating poor interlayer adhesion due to suboptimal printing parameters, leading to delamination and reduced mechanical strength. In contrast, Figure 7(m) and (o) show smoother surfaces with minimal fibre pull-out, suggesting cohesive fracture due to better matrix-fibre interaction and optimized FDM settings. Figure 7(p) reveals extensive microcracking and fibre breakage, indicating brittle failure caused by high fibre content or low matrix ductility, resulting in premature crack propagation under tension. Moreover, it was also noticed that samples 3D printed at optimal settings exhibited uniform fibre dispersion and strong interlayer bonding, minimizing defects such as voids and fibre pull-out. Conversely, higher print speeds and increased layer thickness resulted in premature solidification and weak interfacial adhesion, leading to brittle fracture. The presence of matrix shearing and delamination in suboptimal conditions further confirmed the role of process parameters in governing fracture behavior.
Conclusion
The current study optimized the FDM process parameters for PLA/CF composite fabrication using integrated GRA and ANOVA. The influence of printing temperature, layer thickness, infill pattern, and print speed on tensile properties was analyzed, with GRA converting multi-objective responses into a single Gray Relational Grade (GRG). The optimal parameters (210°C PT, 0.2 mm LT, Rectilinear IP, and 30 mm/s PS) achieved the highest GRG of 1. ANOVA results indicated that print speed had the most significant effect (34.84%), followed by layer thickness (30.70%), infill pattern (23.92%), and printing temperature (1.40%). The developed model demonstrated high predictive accuracy (R2 = 90.96%), and optical analysis confirmed the impact of FDM parameters on microstructural characteristics and fracture behavior. Samples 3D-printed with optimal settings demonstrated uniform fibre dispersion and strong interlayer adhesion, reducing defects like voids and fibre pull-out. In contrast, higher print speeds and increased layer thickness caused premature solidification and weak interfacial bonding, resulting in brittle fracture. The occurrence of matrix shearing and delamination under suboptimal conditions further highlighted the critical influence of process parameters on fracture behavior. These findings emphasize the importance of parameter optimization for enhancing mechanical performance in 3D-printed composites.
Future Scope
Despite the promising outcomes, certain limitations in the study has been acknowledged. The findings are specific to PLA-milled carbon fibre composites and may not be directly applicable to other reinforced polymers. Additionally, some FDM parameters, such as nozzle diameter and bed temperature, were kept constant, which may have influenced the results. Future research could explore a broader range of materials and process variables, along with advanced imaging techniques like SEM, to gain deeper insights into fracture mechanisms. Furthermore, investigating the effects of environmental conditions on mechanical performance could enhance the real-world applicability of the findings. Moreover, future research can extend the current optimization framework by exploring additional FDM parameters and diverse composite materials. Integrating machine learning-based predictive models can further refine optimization strategies, reducing experimental iterations. Moreover, investigating the influence of optimized parameters on properties beyond tensile strength, such as thermal stability and wear resistance, will enhance the applicability of 3D-printed composites. Finally, real-world validation in engineering and biomedical applications will provide practical insights into the effectiveness of optimized additive manufacturing processes.
Footnotes
Acknowledgements
The authors would like to thank Flexible Manufacturing System Lab., National Institute of Technology Silchar, Assam, and Centre for Additive Manufacturing, Chennai Institute of Technology, Tamil Nadu, for providing their valuable technical support.
Declaration of conflicting interests
The authors declared no potential conflicts of interest with respect to the research, authorship, and/or publication of this article.
Funding
The authors did not receive any financial support for the research, authorship, and/or publication of this research article.